Page 1
Report to the Alaska Board of Fisheries
DRAFT: McDonald Lake Sockeye Salmon Stock
Status and Action Plan, 2018
By
Scott Walker,
Troy Thynes,
Dan Gray,
Kelly S. Reppert,
Andrew W. Piston,
and
Steven C. Heinl
January 2018
Alaska Department of Fish and Game Divisions of Sport Fish and Commercial Fisheries
Page 2
Symbols and Abbreviations
The following symbols and abbreviations, and others approved for the Système International d'Unités (SI), are used
without definition in the following reports by the Divisions of Sport Fish and of Commercial Fisheries: Fishery
Manuscripts, Fishery Data Series Reports, Fishery Management Reports, and Special Publications. All others,
including deviations from definitions listed below, are noted in the text at first mention, as well as in the titles or
footnotes of tables, and in figure or figure captions.
Weights and measures (metric)
centimeter cm
deciliter dL
gram g
hectare ha
kilogram kg
kilometer km
liter L
meter m
milliliter mL
millimeter mm
Weights and measures (English)
cubic feet per second ft3/s
foot ft
gallon gal
inch in
mile mi
nautical mile nmi
ounce oz
pound lb
quart qt
yard yd
Time and temperature
day d
degrees Celsius °C
degrees Fahrenheit °F
degrees kelvin K
hour h
minute min
second s
Physics and chemistry
all atomic symbols
alternating current AC
ampere A
calorie cal
direct current DC
hertz Hz
horsepower hp
hydrogen ion activity pH
(negative log of)
parts per million ppm
parts per thousand ppt,
‰
volts V
watts W
General
Alaska Administrative
Code AAC
all commonly accepted
abbreviations e.g., Mr., Mrs., AM, PM, etc.
all commonly accepted
professional titles e.g., Dr., Ph.D.,
R.N., etc.
at @
compass directions:
east E
north N
south S
west W
copyright
corporate suffixes:
Company Co.
Corporation Corp.
Incorporated Inc.
Limited Ltd.
District of Columbia D.C.
et alii (and others) et al.
et cetera (and so forth) etc.
exempli gratia
(for example) e.g.
Federal Information
Code FIC
id est (that is) i.e.
latitude or longitude lat. or long.
monetary symbols
(U.S.) $, ¢
months (tables and
figures): first three
letters Jan,...,Dec
registered trademark
trademark
United States
(adjective) U.S.
United States of
America (noun) USA
U.S.C. United States Code
U.S. state use two-letter abbreviations (e.g., AK, WA)
Mathematics, statistics
all standard mathematical
signs, symbols and
abbreviations
alternate hypothesis HA
base of natural logarithm e
catch per unit effort CPUE
coefficient of variation CV
common test statistics (F, t, 2, etc.)
confidence interval CI
correlation coefficient
(multiple) R
correlation coefficient
(simple) r
covariance cov
degree (angular ) °
degrees of freedom df
expected value E
greater than >
greater than or equal to
harvest per unit effort HPUE
less than <
less than or equal to
logarithm (natural) ln
logarithm (base 10) log
logarithm (specify base) log2, etc.
minute (angular) '
not significant NS
null hypothesis HO
percent %
probability P
probability of a type I error
(rejection of the null
hypothesis when true)
probability of a type II error
(acceptance of the null
hypothesis when false)
second (angular) "
standard deviation SD
standard error SE
variance
population Var
sample var
Page 3
REPORT TO THE ALASKA BOARD OF FISHERIES
DRAFT MCDONALD LAKE SOCKEYE SALMON STOCK STATUS AND
ACTION PLAN, 2018
by
Scott Walker, Andrew W. Piston, and Steven C. Heinl
Alaska Department of Fish and Game, Division of Commercial Fisheries, Ketchikan
Troy Thynes
Alaska Department of Fish and Game, Division of Commercial Fisheries, Petersburg
Kelly S. Reppert
Alaska Department of Fish and Game, Division of Sport Fish, Ketchikan
and
Dan Gray
Alaska Department of Fish and Game, Division of Commercial Fisheries, Sitka
Alaska Department of Fish and Game
Division of Sport Fish, Research and Technical Services
333 Raspberry Road, Anchorage, Alaska, 99518-1565
January 2018
Page 4
Scott Walker, Steven C. Heinl, and Andrew W. Piston,
Alaska Department of Fish and Game, Division of Commercial Fisheries,
2030 Sea Level Drive, Suite 205, Ketchikan, AK 99901, USA
Troy Thynes,
Alaska Department of Fish and Game, Division of Commercial Fisheries
16 Sing Lee Alley, Petersburg, AK 99833, USA
Kelly S. Reppert,
Alaska Department of Fish and Game, Division of Sport Fish
2030 Sea Level Drive, Suite 205, Ketchikan, AK 99901, USA
and
Dan Gray
Alaska Department of Fish and Game, Division of Commercial Fisheries,
304 Lake Street, Room 103, Sitka, AK 99835, USA
This document should be cited as:
Walker, S., T. Thynes, D. Gray, K. S. Reppert, A. W. Piston, and S. C. Heinl. 2018. DRAFT: McDonald Lake
sockeye salmon stock status and action plan 2018. Alaska Department of Fish and Game, Division of
Commercial Fisheries, Report to the Alaska Board of Fisheries, Douglas.
The Alaska Department of Fish and Game (ADF&G) administers all programs and activities free from discrimination
based on race, color, national origin, age, sex, religion, marital status, pregnancy, parenthood, or disability. The
department administers all programs and activities in compliance with Title VI of the Civil Rights Act of 1964, Section
504 of the Rehabilitation Act of 1973, Title II of the Americans with Disabilities Act (ADA) of 1990, the Age
Discrimination Act of 1975, and Title IX of the Education Amendments of 1972.
If you believe you have been discriminated against in any program, activity, or facility please write:
ADF&G ADA Coordinator, P.O. Box 115526, Juneau, AK 99811-5526
U.S. Fish and Wildlife Service, 4401 N. Fairfax Drive, MS 2042, Arlington, VA 22203
Office of Equal Opportunity, U.S. Department of the Interior, 1849 C Street NW MS 5230, Washington DC 20240
The department’s ADA Coordinator can be reached via phone at the following numbers:
(VOICE) 907-465-6077, (Statewide Telecommunication Device for the Deaf) 1-800-478-3648,
(Juneau TDD) 907-465-3646, or (FAX) 907-465-6078
For information on alternative formats and questions on this publication, please contact:
ADF&G Division of Sport Fish, Research and Technical Services, 333 Raspberry Road, Anchorage AK 99518 (907) 267-2375
Page 5
i
TABLE OF CONTENTS Page
LIST OF TABLES........................................................................................................................................................ II
LIST OF FIGURES ...................................................................................................................................................... II
LIST OF APPENDICES .............................................................................................................................................. II
ABSTRACT .................................................................................................................................................................. 1
INTRODUCTION ......................................................................................................................................................... 1
STOCK ASSESSMENT BACKGROUND ................................................................................................................... 2
Escapement .................................................................................................................................................................... 2
Harvest ........................................................................................................................................................................... 3
Commercial Fisheries ............................................................................................................................................... 3 Personal Use Fishery ................................................................................................................................................ 5 Sport Fisheries .......................................................................................................................................................... 5
Enhancement ................................................................................................................................................................. 6
ESCAPEMENT GOAL EVALUATION ...................................................................................................................... 7
Escapement Goal History .............................................................................................................................................. 7
Spawner Data and Escapement Goal Analysis .............................................................................................................. 8
Escapement Goal Recommendation .............................................................................................................................. 8
STOCK OF CONCERN RECOMMENDATION ......................................................................................................... 8
Outlook .......................................................................................................................................................................... 8
HABITAT ASSESSMENT ........................................................................................................................................... 9
FISHERY MANAGEMENT OVERVIEW AND BACKGROUND ............................................................................ 9
Commercial Fisheries Overview ................................................................................................................................... 9
Past Commercial Fishery Management Actions .......................................................................................................... 11
Past Personal Use Fishery Management Actions ......................................................................................................... 12
Past Sport Fishery Management Actions ..................................................................................................................... 12
ACTION PLAN MANAGEMENT OPTIONS FOR ADDRESSING STOCK OF CONCERN ................................ 13
Action Plan Goal ......................................................................................................................................................... 13
Action Plan Alternatives .............................................................................................................................................. 13
Action #1: Commercial Fisheries ........................................................................................................................... 13 Action #2: Personal Use Fishery............................................................................................................................. 15 Action #3: Sport Fishery ......................................................................................................................................... 15
CONDITIONS FOR REDUCING MANAGEMENT RESCTRICTIONS OR DELISTING STOCK OF
CONCERN .................................................................................................................................................................. 16
2018 ALASKA BOARD OF FISHERIES REGULATORY PROPOSALS AFFECTING MCDONALD LAKE
SOCKEYE SALMON ................................................................................................................................................. 17
RESEARCH PLAN ..................................................................................................................................................... 17
REFERENCES CITED ............................................................................................................................................... 18
APPENDIX ................................................................................................................................................................. 32
Page 6
ii
LIST OF TABLES
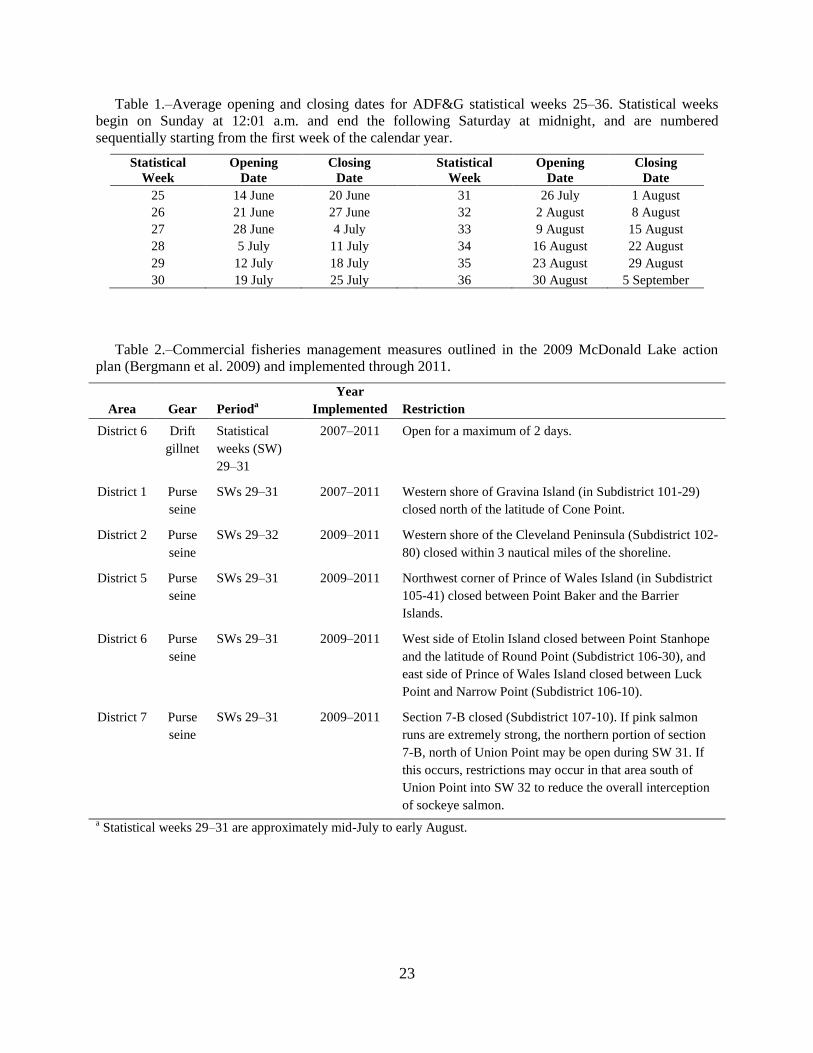
Table Page Table 1.–Average opening and closing dates for ADF&G statistical weeks 25–36. Statistical weeks begin on
Sunday at 12:01 a.m. and end the following Saturday at midnight, and are numbered sequentially
starting from the first week of the calendar year. .......................................................................................... 23 Table 2.–Commercial fisheries management measures outlined in the 2009 McDonald Lake action plan
(Bergmann et al. 2009) and implemented through 2011. .............................................................................. 23 Table 3.–Average annual harvest in numbers fish and average percentage of harvest by gear, district, and
species in southern SEAK commercial salmon net fisheries, 1997–2016. .................................................... 24 Table 4.–History of personal use sockeye salmon fishery limits in Yes Bay. ............................................................. 24
LIST OF FIGURES
Figure Page Figure 1.–Major (thick arrows) and minor (thin arrows) migration routes of McDonald Lake sockeye salmon
through southern SEAK and management Districts 1–8. .............................................................................. 26 Figure 2.–Estimated McDonald Lake sockeye salmon spawning escapements and terminal harvest (purse seine
and personal use) in Yes Bay and upper West Behm Canal, 1980–2017. Historical escapement goals
are shown as horizontal black lines. The current sustainable escapement goal is a range of 55,000–
120,000 sockeye salmon................................................................................................................................ 27 Figure 3.–Estimated McDonald Lake sockeye salmon spawning escapements, 1980–2017. Black bars represent
approximate numbers of fish that experienced lake fertilization during rearing years 1982–2004. .............. 27 Figure 4.–Commercial fishing districts in southern SEAK and locations identified for time and area restrictions
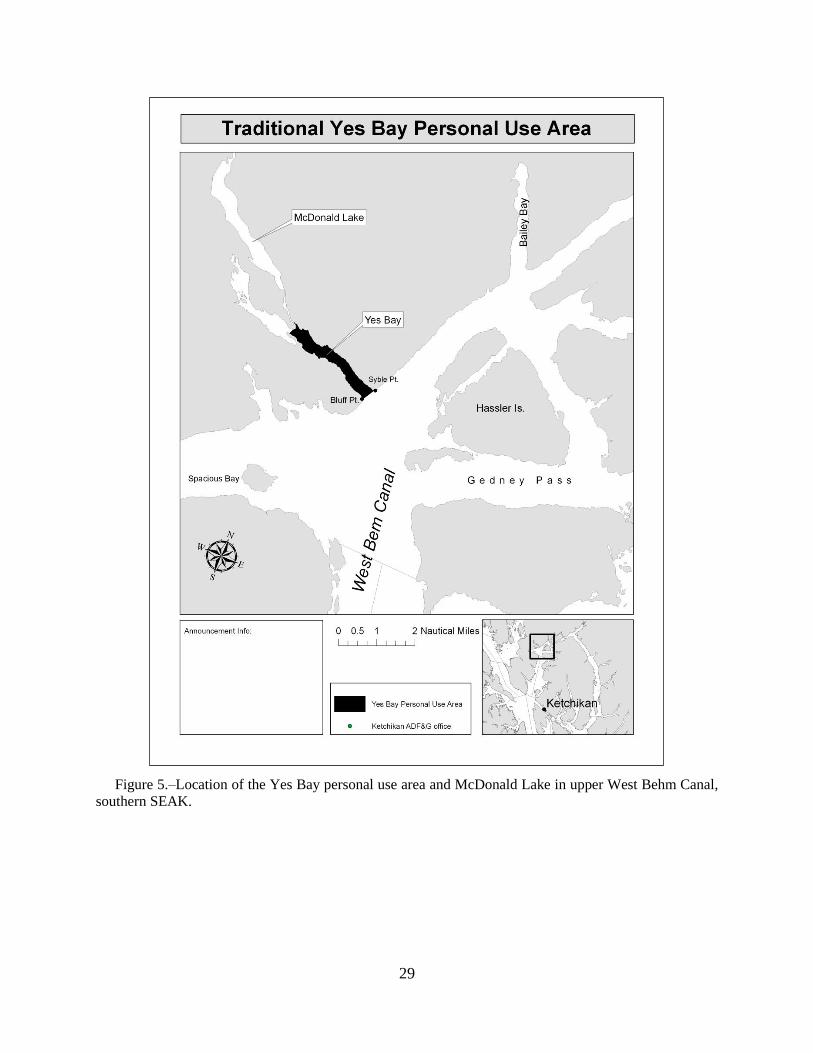
in the 2009 McDonald Lake action plan (Bergmann et al. 2009). ................................................................. 28 Figure 5.–Location of the Yes Bay personal use area and McDonald Lake in upper West Behm Canal, southern
SEAK. ........................................................................................................................................................... 29 Figure 6.–Reported McDonald Lake (Yes Bay) sockeye salmon personal use harvest and number of permits
fished, 1985–2016. ........................................................................................................................................ 30 Figure 7.–Estimated McDonald Lake sockeye salmon escapements (1982–2016) and estimated fall rearing fry
populations in the following year (1983–2017). ........................................................................................... 30
LIST OF APPENDICES
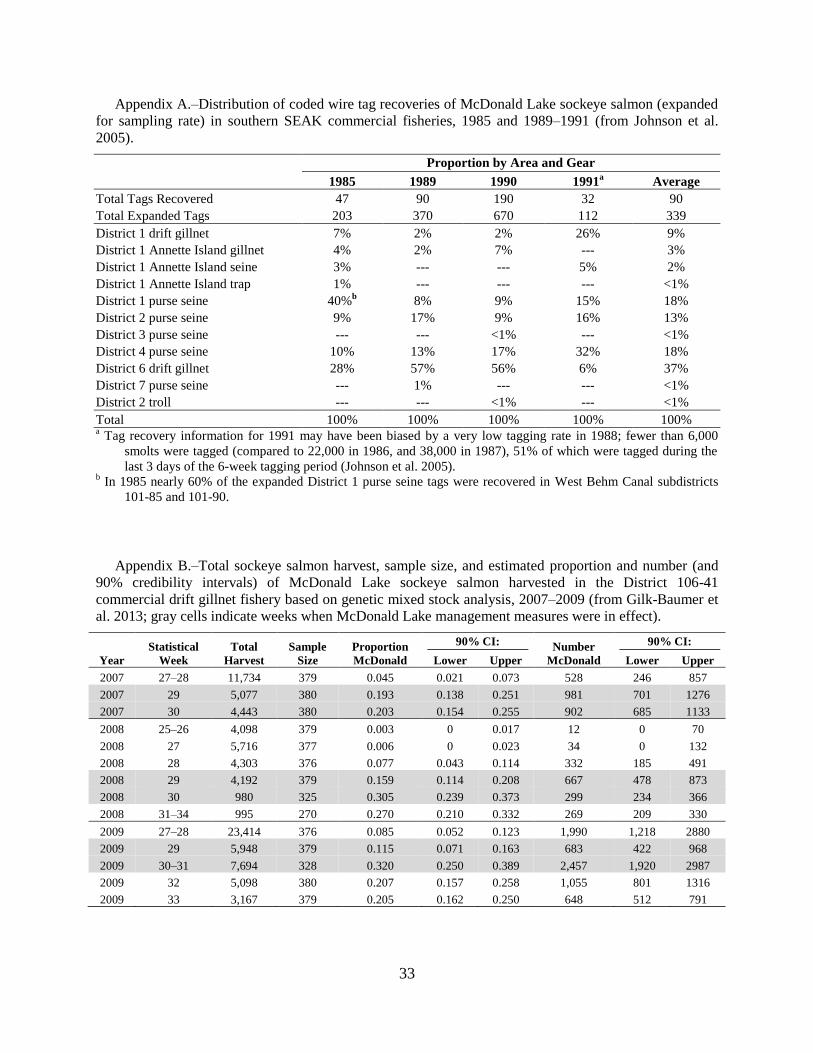
Appendix Page Appendix A.–Distribution of coded wire tag recoveries of McDonald Lake sockeye salmon (expanded for
sampling rate) in southern SEAK commercial fisheries, 1985 and 1989–1991 (from Johnson et al.
2005). ............................................................................................................................................................ 33 Appendix B.–Total sockeye salmon harvest, sample size, and estimated proportion and number (and 90%
credibility intervals) of McDonald Lake sockeye salmon harvested in the District 106-41 commercial
drift gillnet fishery based on genetic mixed stock analysis, 2007–2009 (from Gilk-Baumer et al. 2013;
gray cells indicate weeks when McDonald Lake management measures were in effect). ............................ 33 Appendix C.–Total sockeye salmon harvest, sample size, and estimated proportion and number (and 90%
credibility intervals) of McDonald Lake sockeye salmon harvested in the District 106-30 commercial
drift gillnet fishery based on genetic mixed stock analysis, 2007–2009 (from Gilk-Baumer et al. 2013;
gray cells indicate weeks when McDonald Lake management measures were in effect). ............................ 34 Appendix D.–Total sockeye salmon harvest, sample size, and estimated proportion and number (and 90%
credibility intervals) of McDonald Lake sockeye salmon in the District 101-29 and District 107-10
commercial purse seine fishery based on genetic mixed stock analysis, 2007–2009 (from Gilk-Baumer
et al. 2013; gray cells indicate weeks when McDonald Lake management measures were in effect)........... 34 Appendix E.–Estimated commercial harvest (and 90% credibility intervals) of McDonald Lake sockeye salmon
in southern SEAK by area based on genetic mixed stock analysis, and estimated escapement and
harvest rate, 2014–2017 (ADF&G Gene Conservation Laboratory, unpublished data). Salmon fisheries
in Annette Island waters of District 1 and purse seine fisheries in Districts 5, 6, and 7 were not
sampled. ........................................................................................................................................................ 35
Page 7
iii
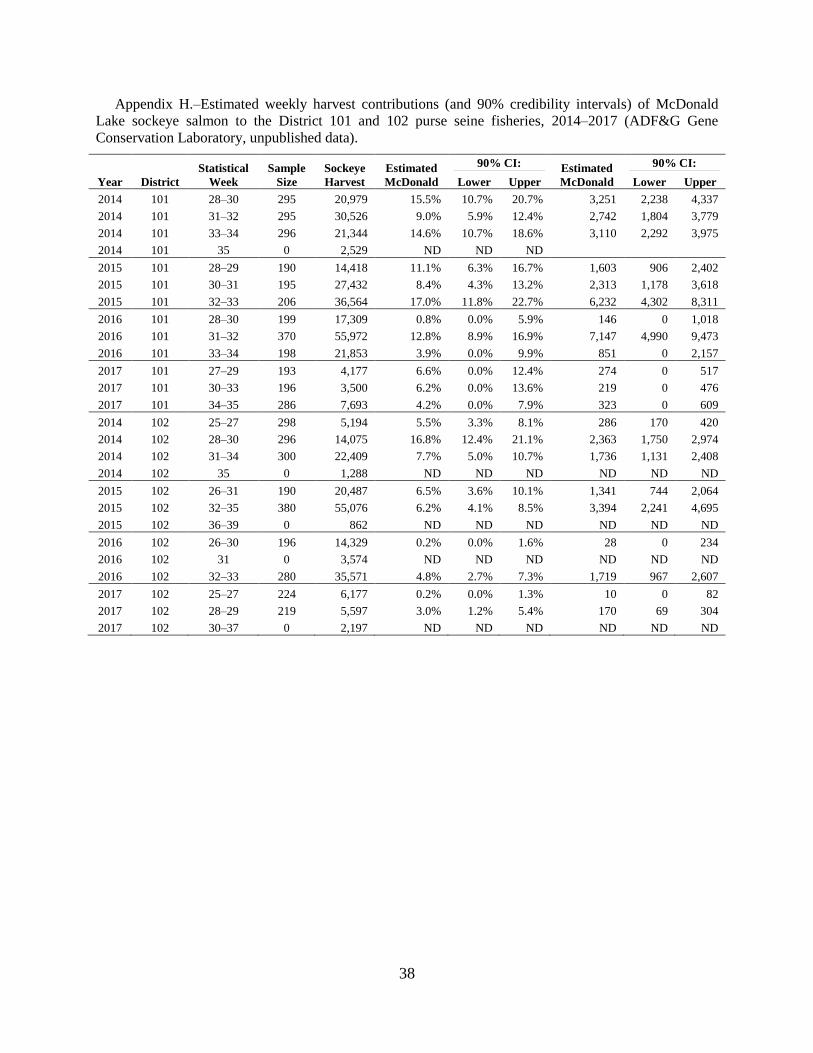
Appendix F.–Estimated weekly harvest contributions (and 90% credibility intervals) of McDonald Lake
sockeye salmon to the Subdistrict 106-41 drift gillnet fishery, 2014–2017 (ADF&G Gene Conservation
Laboratory, unpublished data). ...................................................................................................................... 36 Appendix G.–Estimated weekly harvest contributions (and 90% credibility intervals) of McDonald Lake
sockeye salmon to the Subdistrict 106-30 drift gillnet fishery, 2014–2017 (ADF&G Gene Conservation
Laboratory, unpublished data). ...................................................................................................................... 37 Appendix H.–Estimated weekly harvest contributions (and 90% credibility intervals) of McDonald Lake
sockeye salmon to the District 101 and 102 purse seine fisheries, 2014–2017 (ADF&G Gene
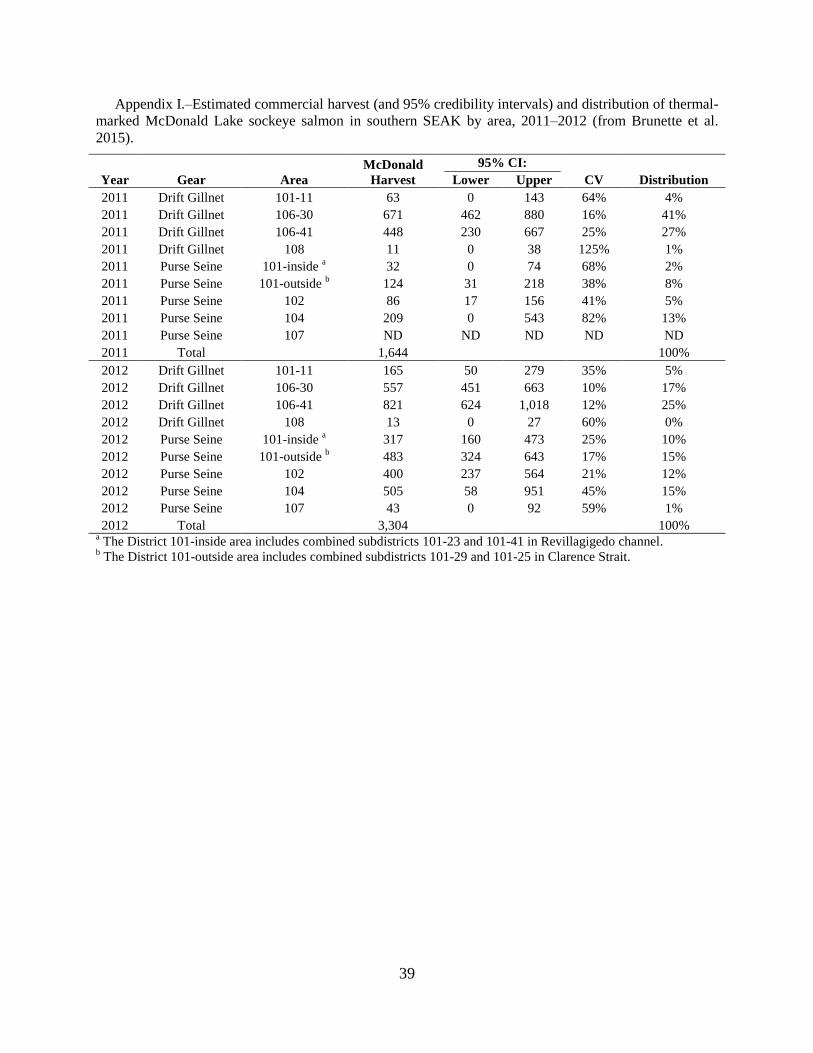
Conservation Laboratory, unpublished data). ................................................................................................ 38 Appendix I.–Estimated commercial harvest (and 95% credibility intervals) and distribution of thermal-marked
McDonald Lake sockeye salmon in southern SEAK by area, 2011–2012 (from Brunette et al. 2015). ....... 39
Page 8
1
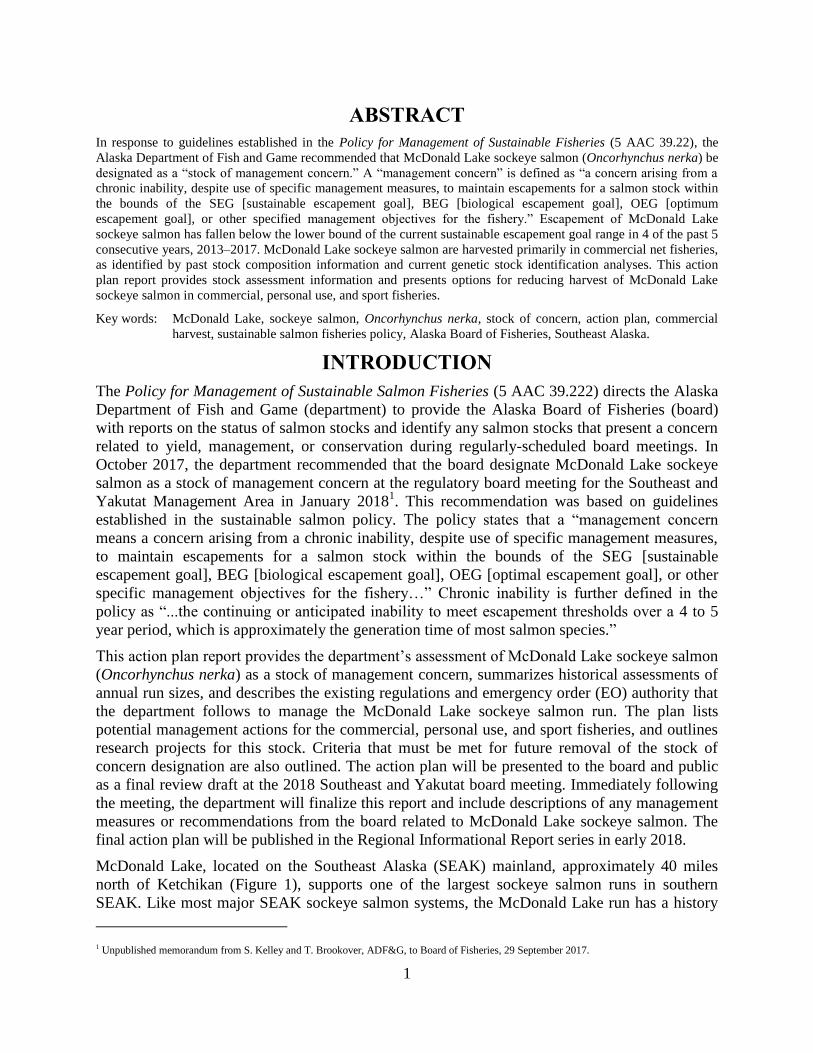
ABSTRACT
In response to guidelines established in the Policy for Management of Sustainable Fisheries (5 AAC 39.22), the
Alaska Department of Fish and Game recommended that McDonald Lake sockeye salmon (Oncorhynchus nerka) be
designated as a “stock of management concern.” A “management concern” is defined as “a concern arising from a
chronic inability, despite use of specific management measures, to maintain escapements for a salmon stock within
the bounds of the SEG [sustainable escapement goal], BEG [biological escapement goal], OEG [optimum
escapement goal], or other specified management objectives for the fishery.” Escapement of McDonald Lake
sockeye salmon has fallen below the lower bound of the current sustainable escapement goal range in 4 of the past 5
consecutive years, 2013–2017. McDonald Lake sockeye salmon are harvested primarily in commercial net fisheries,
as identified by past stock composition information and current genetic stock identification analyses. This action
plan report provides stock assessment information and presents options for reducing harvest of McDonald Lake
sockeye salmon in commercial, personal use, and sport fisheries.
Key words: McDonald Lake, sockeye salmon, Oncorhynchus nerka, stock of concern, action plan, commercial
harvest, sustainable salmon fisheries policy, Alaska Board of Fisheries, Southeast Alaska.
INTRODUCTION
The Policy for Management of Sustainable Salmon Fisheries (5 AAC 39.222) directs the Alaska
Department of Fish and Game (department) to provide the Alaska Board of Fisheries (board)
with reports on the status of salmon stocks and identify any salmon stocks that present a concern
related to yield, management, or conservation during regularly-scheduled board meetings. In
October 2017, the department recommended that the board designate McDonald Lake sockeye
salmon as a stock of management concern at the regulatory board meeting for the Southeast and
Yakutat Management Area in January 20181. This recommendation was based on guidelines
established in the sustainable salmon policy. The policy states that a “management concern
means a concern arising from a chronic inability, despite use of specific management measures,
to maintain escapements for a salmon stock within the bounds of the SEG [sustainable
escapement goal], BEG [biological escapement goal], OEG [optimal escapement goal], or other
specific management objectives for the fishery…” Chronic inability is further defined in the
policy as “...the continuing or anticipated inability to meet escapement thresholds over a 4 to 5
year period, which is approximately the generation time of most salmon species.”
This action plan report provides the department’s assessment of McDonald Lake sockeye salmon
(Oncorhynchus nerka) as a stock of management concern, summarizes historical assessments of
annual run sizes, and describes the existing regulations and emergency order (EO) authority that
the department follows to manage the McDonald Lake sockeye salmon run. The plan lists
potential management actions for the commercial, personal use, and sport fisheries, and outlines
research projects for this stock. Criteria that must be met for future removal of the stock of
concern designation are also outlined. The action plan will be presented to the board and public
as a final review draft at the 2018 Southeast and Yakutat board meeting. Immediately following
the meeting, the department will finalize this report and include descriptions of any management
measures or recommendations from the board related to McDonald Lake sockeye salmon. The
final action plan will be published in the Regional Informational Report series in early 2018.
McDonald Lake, located on the Southeast Alaska (SEAK) mainland, approximately 40 miles
north of Ketchikan (Figure 1), supports one of the largest sockeye salmon runs in southern
SEAK. Like most major SEAK sockeye salmon systems, the McDonald Lake run has a history
1 Unpublished memorandum from S. Kelley and T. Brookover, ADF&G, to Board of Fisheries, 29 September 2017.
Page 9
2
of commercial exploitation and hatchery operation during the late 19th and early 20th centuries
(Roppel 1982). Total run size was thought to exceed 100,000 fish in 1909 and 1911, and more
than 200,000 fish in 1910 (Johnson et al. 2005). Subsequently, little was known about the run
until 1981, when 129,653 sockeye salmon were counted at a weir operated near the outlet of the
lake.
McDonald Lake was the target of a long-term lake fertilization enhancement project initiated in
1982 and continued through 2004 (Johnson et al. 2005). McDonald Lake sockeye salmon runs
were strong during much of the enhancement period, and escapements averaged more than
100,000 fish through 2000. The stock was actively managed during the 1990s, and fish that were
expected to be in excess of the escapement goal were harvested in a terminal purse seine fishery
in upper West Behm Canal. The McDonald Lake stock has also supported the largest personal-
use fishery in southern SEAK at Yes Bay, including a maximum reported harvest of more than
10,000 fish in 1994. In addition, McDonald Lake sockeye salmon were used as a brood source
for enhancement projects at a number of other sites in southern SEAK (Johnson et al. 2005).
The McDonald Lake sockeye salmon run underwent a decline in recruitment starting in the late
1990s and escapements fell below the current sustainable escapement goal range of 55,000–
120,000 sockeye salmon in 4 out of 5 consecutive years from 2004 to 2008 (Figure 2). The
decline in recruitment and subsequent escapements occurred during the lake fertilization period
(Figure 3). The McDonald Lake run was designated a stock of management concern at the 2009
Southeast and Yakutat board meeting and an action plan was developed to reduce harvest on the
run (Bergmann et al. 2009). Management measures in the action plan were focused on areas and
times when the stock is most prevalent in the commercial drift gillnet and purse seine fisheries
closest to McDonald Lake. The escapement goal was met for 3 consecutive years from 2010 to
2012 and the stock of concern designation was removed; however, recent escapements fell below
the sustainable escapement goal range in 4 out of 5 consecutive years from 2013 to 2017 (Figure
2).
STOCK ASSESSMENT BACKGROUND
ESCAPEMENT
McDonald Lake sockeye salmon escapements are estimated from standardized foot survey
counts at Hatchery Creek, the primary spawning tributary. Sockeye salmon enter the system
from early July to early September (mid-point of weir counts occurred between 6 and 15
August), and spawn from late August to mid-October; peak spawning activity typically occurs in
mid-September. Foot surveys are conducted annually on approximately 10 September, 20
September, and 28 September to capture the peak of spawning abundance. Surveys cover the
entire 1.5 km-length of the creek accessible to sockeye salmon. Stream characteristics, including
shallow depth over nearly the entire survey length, relatively narrow stream width, and
contrasting pale granite substrate provide excellent conditions for counting fish. The peak annual
survey count is multiplied by an expansion factor of 4.85 to estimate total escapement. The
expansion factor was based on comparison of peak foot survey counts to 6 years of population
estimates from weir counts (1980, 1983, and 1984) and mark–recapture studies (2005–2007)
(Heinl et al. 2009).
Page 10
3
HARVEST
Commercial Fisheries
During their return migration, adult McDonald Lake sockeye salmon move through offshore
waters along the west coast of Prince of Wales Island and into inside waters from the north
through Sumner Strait and from the south through Dixon Entrance, then through Clarence Strait
and adjacent bodies of water to West Behm Canal and on to McDonald Lake (Figure 1). As a
result, McDonald Lake sockeye salmon contribute to every commercial net fishery in southern
SEAK (Districts 1–8) from early July to late August. Comprehensive information regarding
harvest is limited because most of these fisheries are distant from McDonald Lake and because
they are conducted on mixed stocks and do not specifically target McDonald Lake sockeye
salmon. This is particularly true of purse seine fisheries, which are largely managed to harvest
pink salmon (O. gorbuscha; Clark et al. 2006).
Information regarding the commercial harvest has been obtained from various projects
conducted intermittently since the early 1980s:
1) 1982–1983: U.S.-Canada marine tagging studies provided general information on
migration routes and areas where McDonald Lake sockeye salmon were harvested
(Hoffman et al. 1983, 1984).
2) 1985 and 1989–1991: coded wire tagging studies provided information on harvest rate
and distribution (Johnson et al. 2005).
3) 2007–2009: genetic stock identification (GSI) studies (Gilk-Baumer et al. 2013) provided
information regarding harvest in commercial fisheries specifically identified in the 2009
McDonald Lake action plan (Bergmann et al. 2009).
4) 2011–2012: otolith sampling studies provided general information on harvest distribution
and timing (Brunette et al. 2015).
5) 2014–present: U.S.-Canada GSI information has provided the best information to date on
harvest rate and harvest distribution and timing (ADF&G Gene Conservation Laboratory,
unpublished data).
Commercial Harvest Rate: Commercial harvest rates on McDonald Lake sockeye salmon in
distant mixed stocked fisheries have been estimated in 7 years. Harvest rates in 1985, 1989, and
1990 averaged 41% (range: 32–48%) based on total harvests estimated from coded wire tag
recoveries (Johnson et al. 2005). Harvest rates during 2014–2017 averaged 47% (range: 26–
63%) based on total harvests estimated from U.S.-Canada GSI information (Appendix E). These
estimates represent minimum values since not all fisheries were sampled in all years, thus
harvest rates were probably slightly higher than estimated. Harvest rates from 1991 to 2001 were
substantially higher due to additional harvest of McDonald Lake sockeye salmon in terminal
commercial purse seine fisheries conducted in upper West Behm Canal. In these years, the
department conducted test fisheries in West Behm Canal to determine run strength, then opened
terminal fisheries to harvest sockeye salmon in excess of escapement needs (Johnson et al.
2005). Total harvest rate in years when terminal fisheries were conducted averaged 61% (range:
47–84%) and terminal harvests averaged 60,000 fish (Figure 2), including maximum harvests of
142,000 fish (1993) and 210,000 fish (1996). Terminal commercial fisheries have not been
conducted since 2004.
Commercial Harvest Distribution: Comprehensive information regarding the distribution of
McDonald Lake sockeye salmon throughout all southern SEAK commercial mixed stock
Page 11
4
fisheries is available for 8 years, based on coded wire tag recoveries in 1985 and 1989–1991, and
GSI information, 2014–present. Additional information is available for specific areas in other
years, but not the entire region. The largest harvests of McDonald Lake sockeye salmon
generally occurred in the District 4 purse seine fishery off the west coast of Prince of Wales
Island, the District 1 and 2 purse seine fisheries in Clarence Strait, and the District 6 drift gillnet
fishery in Sumner and Clarence straits (Figure 1). During 1985 and 1989–1991, an average 18%
of coded-wire-tagged McDonald Lake sockeye salmon were recovered in the District 4 purse
seine fishery, 18% in the District 1 purse seine fishery, 13% in the District 2 purse seine fishery,
and 37% in the District 6 drift gillnet fishery (Appendix A; Johnson et al. 2005). During 2014–
2017, an average 36% of the McDonald Lake sockeye salmon harvest occurred in the District 4
purse seine fishery, 19% in the District 1 purse seine fishery, 6% in the District 2 purse seine
fishery, and 30% in the District 6 drift gillnet fishery (Appendix E; ADF&G Gene Conservation
Laboratory, unpublished data). Otolith sampling data obtained during 2011–2012 generally
showed a similar harvest distribution, though estimates were imprecise (Appendix I; Brunette et
al. 2015).
Commercial Harvest Timing: Management measures in the 2009 McDonald Lake action plan
were based on inferences about overall run timing and the distribution and timing of coded-wire-
tagged McDonald Lake sockeye salmon in the commercial harvest (Johnson et al. 2005;
Bergmann et al. 2009). In 1989 and 1990, approximately 90% of coded wire tag recoveries in the
District 6 drift gillnet fishery occurred during a 5-week period from statistical week (SW) 28 to
32 (approximately early July to mid-August; see Table 1 for average SW dates). Management
measures therefore were focused primarily on reducing the harvest of McDonald Lake sockeye
salmon during a 3-week period (SWs 29–31) in the District 6 drift gillnet fishery, adjacent
District 2, 5, 6 and 7 purse seine fisheries, and the District 1 purse seine fishery (Table 2; Figure
4). Studies conducted since the 2009 action plan was developed have largely corroborated the
utility of those management measures for reducing the harvest of McDonald Lake sockeye
salmon, and further suggest that restrictions may be more effective if shifted or extended into
later SWs.
2007–2009: The department conducted a GSI project to determine if area and timing measures
stipulated in the 2009 action plan were appropriate (Gilk-Baumer et al. 2013). Sockeye salmon
tissue samples were collected and analyzed from commercial drift gillnet harvests in subdistricts
106-30 (Clarence Strait) and 106-41 (Sumner Strait) and purse seine harvests in subdistricts 101-
29 (Gravina Island shoreline) and 107-10 (Ernest Sound).
In the Subdistrict 106-41 drift gillnet fishery, McDonald Lake fish comprised 16–32% of
the weekly sockeye salmon harvest during SWs 29–34 (Appendix B).
In the Subdistrict 106-30 drift gillnet fishery, McDonald Lake fish comprised 21–57% of
the weekly sockeye salmon harvest during SWs 30–34 (Appendix C).
In the Subdistrict 101-29 purse seine fishery, McDonald Lake fish comprised 11–31% of
the weekly sockeye salmon harvest during SWs 30–33 (Appendix D).
In the Subdistrict 107-10 purse seine fishery, McDonald Lake fish comprised 30–60% of
the sockeye salmon harvest when the fishery was open during SWs 31–34 (Appendix D).
2011–2012: The department conducted otolith sampling of commercial harvests for McDonald
Lake sockeye salmon that were thermal marked by Southern Southeast Regional Aquaculture
Association (Brunette et al. 2015; see Brood Source and Lake Stocking section, page 6).
Page 12
5
Thermal marked fish were most prevalent in drift gillnet subdistricts 106-41 and 106-30
and combined purse seine subdistricts 101-25/29.
Peak harvests of thermal marked fish occurred in the combined subdistrict 101-25/29
purse seine fishery during SWs 31–32.
Peak harvests of thermal marked fish occurred in the Subdistrict 106-41 drift gillnet
fishery during SWs 32–33 in 2011, and SW 30 in 2012.
Peak harvests of thermal marked fish occurred in the Subdistrict 106-30 drift gillnet
fishery during SWs 31–33 in 2011, and SWs 30–32 in 2012.
2014–2017: Since 2014, the proportions of McDonald Lake fish in sockeye salmon harvests in
southern SEAK commercial fisheries have been identified in conjunction with U.S.-Canada GSI
studies (ADF&G Gene Conservation Laboratory, unpublished data).
In the Subdistrict 106-41 drift gillnet fishery, McDonald Lake fish comprised 10–22% of
the weekly sockeye salmon harvest from SW 28 (2014), 29 (2017) or 30 (2015, 2016)
through SWs 32–34 (Appendix F).
In the Subdistrict 106-30 drift gillnet fishery, McDonald Lake fish comprised 12–32% of
the weekly sockeye salmon harvest from SW 29 (2014, 2017) or 30 (2015, 2016) through
SWs 33–34 (Appendix G).
Run timing in the districts 1 and 2 purse seine fisheries was more difficult to determine
than in the drift gillnet fisheries, because estimates were applied to the entire district
harvest (rather than by subdistrict) and SWs were often combined for analysis. In general,
run timing of McDonald Lake sockeye salmon appeared to be slightly earlier in 2014 and
2017 than it was in 2015 and 2016 when peak contributions occurred during SWs 31–32
or later (Appendix H).
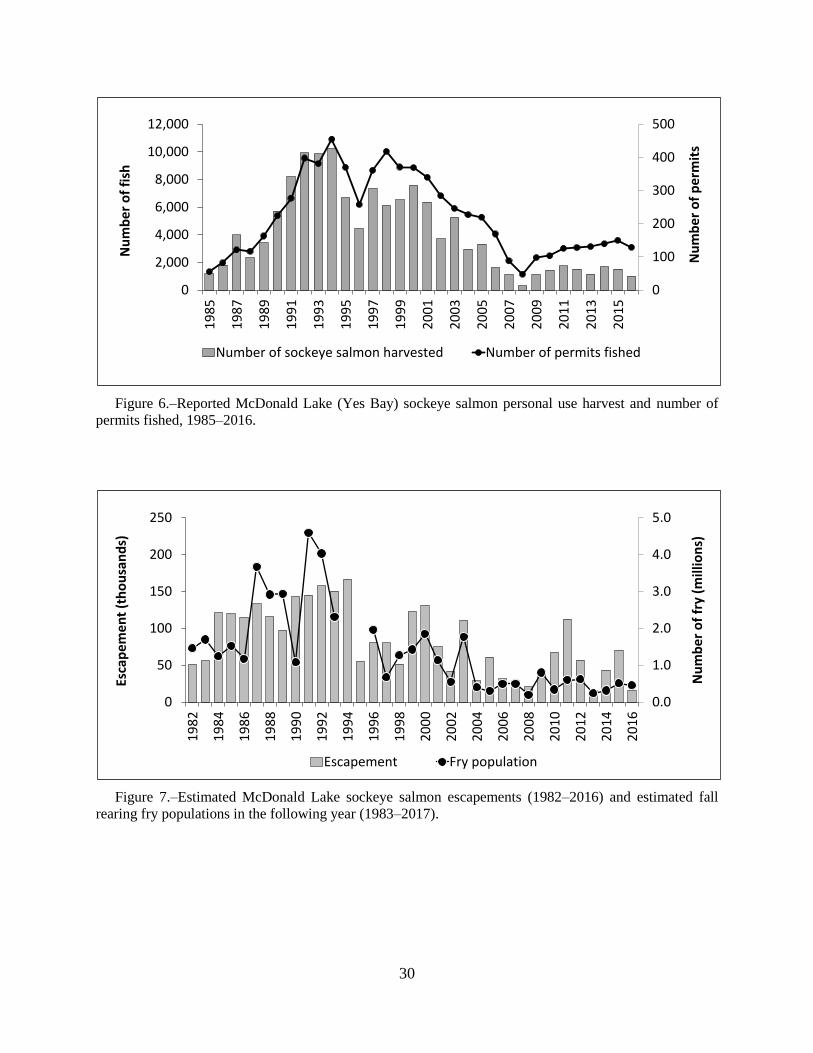
Personal Use Fishery
McDonald Lake sockeye salmon are harvested in a personal use fishery immediately in front of
the McDonald Lake outlet stream (Wolverine Creek) at Yes Bay, in upper West Behm Canal
(Figure 5). Fish are primarily harvested with gillnet gear in saltwater, but limited numbers are
also harvested with dip nets in Wolverine Creek. Personal use harvest has been monitored
through permits issued annually since 1985. From 1985 to 1999, personal use fishermen were
required to return permits with a record of their harvest. In 2000, permit requirements were
changed in an effort to improve reporting; fishermen are required to report harvest from the
previous year before being issued a new permit. Reported annual personal use harvest from 1985
to 2005 averaged approximately 5,600 sockeye salmon (range: 1,185‒10,000 fish), and an
average 273 permits were fished (Figure 6). Since 2006, the reported annual personal use harvest
averaged approximately 1,300 sockeye salmon (range: 310–1,756 fish), and an average 112
permits were fished. Reported harvest may underestimate true harvest, particularly prior to 2000;
however, the annual personal use harvest represents a very small portion (<3%) of the total
McDonald Lake run. There is no subsistence fishery on McDonald Lake sockeye salmon, as the
lake is located in the Ketchikan nonsubsistence area per 5 AAC 99.015 (1).
Sport Fisheries
Sport fishing effort and harvest of McDonald Lake sockeye salmon is presumed to be very low.
The Alaska Statewide Sport Fish Harvest Survey is designed to estimate sport fishing effort and
harvest by location (Romberg 2016). Estimates of the McDonald Lake sockeye salmon sport
Page 13
6
harvest are not available, however, due to the low number of respondents that report angling
effort in the McDonald Lake and Yes Bay areas. In the greater Ketchikan area, which
encompasses all of District 1, the recent 5-year average annual sport harvest of sockeye salmon
(as estimated from the statewide harvest survey) is approximately 90 fish in freshwater and 1,700
fish in saltwater. There are no guided freshwater activities that target McDonald Lake sockeye
salmon. Saltwater charter logbook data for the Ketchikan area indicates the average annual
sockeye salmon harvest is 190 fish, suggesting that the saltwater harvest of sockeye salmon in
the Ketchikan area is predominately non-charter (resident or unguided nonresident). Even if all
the sockeye salmon harvested in the Ketchikan area were assumed to be McDonald Lake fish,
the estimated sport harvest would account for a small fraction (3% of the recent 5-year average)
of the total McDonald Lake run.
ENHANCEMENT
Lake Fertilization
A lake fertilization enhancement project was conducted at McDonald Lake from 1982 to 2004.
The addition of fertilizer (nutrients) is intended to increase the food supply (zooplankton) of
juvenile sockeye salmon, which will result in more and larger sockeye smolt and, in turn, more
adult sockeye salmon (Burkett et al. 1989). The project was initiated following baseline studies
of lake productivity conducted from December 1979 through 1981 (Koenings et al. 1982;
Burkett et al. 1989; Olson 1989; Johnson et al. 2005). A variable amount of liquid fertilizer
(nitrogen to phosphorous atomic ratio of 27:7) was applied to McDonald Lake each year based
on the estimated late fall or early spring phosphorous concentration in the lake. A variety of
limnological and fisheries sampling and assessment information was collected in association
with the enhancement project, including smolt size and age (1981–1988), rearing fry abundance,
lake physical characteristics (light and temperature), lake chemistry (phosphorus and nitrogen
concentration), and primary (chlorophyll a concentration) and secondary (zooplankton density
and biomass) production (Johnson et al. 2005).
The effects of the lake fertilization project are difficult to assess, because only 2 years (1980–
1981) of lake productivity baseline data were collected prior to initiation of the project, and
because the sockeye salmon run declined through the later years of the project. Early
assessments concluded that natural variation in lake productivity measures masked effects that
lake fertilization may have had on productivity (Olson 1989). No significant changes were
observed in sockeye salmon fry growth rates, smolt sizes, or age composition, and only limited
increase in overall zooplankton production was documented through 1987 (Burkett et al. 1989).
The sockeye salmon escapements were strong before the lake was fertilized; e.g., escapements
during 1981–1985 averaged 94,000 fish (Figure 3). It was thought that sockeye salmon
production may have been artificially maintained at an elevated level because sockeye salmon
runs continued to be very strong during much of the enhancement period; however, strong
production due to unrelated environmental factors (e.g., favorable marine conditions) could not
be ruled out (Burkett et al. 1989). Poor recruitment starting in the late 1990s resulted in a
downward trend in escapement (Figure 3), and escapements in 2002 (42,000 fish) and 2004
(29,000 fish) were below the escapement goal range. The fertilization project was terminated
because escapements declined steadily during the enhancement period and because small fry
populations produced by poor escapements did not warrant continued nutrient enhancement.
Page 14
7
Brood Source and Lake Stocking
Lake stocking at McDonald Lake was limited to 5 years. McDonald Lake fry were back-planted
into McDonald Lake in 1989 (3.5 million fish) and 1990 (1.0 million fish) (Johnson et al. 2005).
More recently, Southern Southeast Regional Aquaculture Association (SSRAA) conducted a
“Sentinel Stock” project to stock thermal marked McDonald Lake sockeye salmon smolt in the
lake (Brunette et al. 2015). The primary purpose of this project was to provide marked fish that
could be tracked through commercial fisheries when they returned as adults and provide
improved information regarding the distribution and timing of McDonald Lake sockeye salmon
in the commercial harvest. Sockeye salmon eggs were collected annually at the lake for 3 years,
2007–2009. Fish were thermal marked and reared at Burnett Inlet Hatchery, and full-term smolt
were released at McDonald Lake in 2009 (276,000 fish), 2010 (160,000 fish), and 2011 (323,000
fish). Smolt were held in net pens for 24 hours to imprint at the mouth of Hatchery Creek prior to
release and were expected to immediately migrate to saltwater with wild fish. Adult returns from
this project were mixed: thermal marked fish accounted for approximately 18.8% of the
escapement in 2012 (10,700 fish), but only 4.5% in 2011 (5,100 fish), 5.3% in 2013 (820 fish),
and 0.5% in 2014 (220 fish) (Brunette et al. 2015).
The McDonald Lake sockeye salmon run has also been used as a brood source for enhancement
projects at various locations in southern SEAK by the department, the U.S. Forest Service, and
SSRAA. Sockeye salmon eggs were collected annually from 1988 to 1995 and fry were stocked
at Virginia Lake (1989–1996), Margaret Lake (1990–1994), and Shrimp Bay (1992–1994).
Those projects met with poor success (Edmundson et al. 1991; Cartwright et al. 1998; Piston
2004; Johnson et al. 2005). McDonald Lake sockeye salmon eggs were also collected from 1999
to 2003 and used as a brood source for a SSRAA sockeye salmon enhancement program at
Burnett Inlet Hatchery and Neck Lake (Johnson et al. 2005); that program was discontinued after
2010.
ESCAPEMENT GOAL EVALUATION
ESCAPEMENT GOAL HISTORY
The McDonald Lake sockeye salmon run has been managed for 4 escapement goals since the
late 1980s. The first escapement goal, set at 85,000 fish in 1989, was based on the euphotic
volume habitat model of Koenings and Burkett (1987), which related physical water features of
McDonald Lake to the carrying capacity of other sockeye salmon lakes throughout Alaska
(Burkett et al. 1989; Geiger et al. 2004). In 1993, the escapement goal was changed to a range of
65,000–85,000 fish, based on an undocumented Ricker stock-recruit analysis; the goal was
considered a biological escapement goal in 2003 (Geiger et al. 2004). In 2005, the goal was
revised to a sustainable escapement goal range of 70,000–100,000 fish, based on a simple brood-
year yield analysis (Johnson et al. 2005). The goal was considered a sustainable escapement goal
due to uncertainty in estimated harvest and escapement.
The current sustainable escapement goal range of 55,000–120,000 sockeye salmon was
established in 2009 (Eggers et al. 2009). The goal was based on a Ricker stock-recruit analysis of
the 1980–2001 brood years, improved escapement estimates (Heinl et al. 2009), and assumed
average commercial harvest rate of 41% in known mixed stock harvest areas, adjusted for
additional harvest in terminal purse seine and personal use fisheries in West Behm Canal. The
escapement goal represents the range of spawners predicted to provide 90% of maximum
Page 15
8
sustained yield. The goal was defined as a sustainable escapement goal due to limited
information on commercial harvest rates and because McDonald Lake was fertilized over most
of the stock-recruit data set. The effect of lake fertilization on productivity is not clear, however,
due to a lack of pre-fertilization baseline data and because the sockeye salmon run declined
substantially during the lake fertilization period (Figure 3). It should also be noted that sockeye
salmon production was at a high level regionwide during the 1980–2001 period upon which the
McDonald Lake escapement goal was established.
SPAWNER DATA AND ESCAPEMENT GOAL ANALYSIS
McDonald Lake sockeye salmon brood tables have been updated following the methods used to
establish the current escapement goal (Eggers et al. 2009). Ricker stock-recruit analysis of the
updated data set produced a slightly higher estimate of SMSY, the escapement that provides
maximum sustained yield: SMSY = 90,000 spawners for brood years 1980–2011 compared to
SMSY = 84,000 spawners for brood years 1980–2001 (Eggers et al. 2009). The updated estimate
of SMSY, though larger, falls well within the current sustainable escapement goal range of
55,000–120,000 sockeye salmon. The probability that escapements within the current sustainable
escapement goal range will provide greater than 80% of maximum sustained yield is estimated to
be 70–90%. The probability of reducing yield (“over fishing”) to less than 80% of maximum
sustained yield at the lower bound of the escapement goal is estimated to be 30% and increases
steeply at escapements below 55,000 fish (e.g., approximately 40% at 50,000 fish and 53% at
45,000 fish). Results based on this analysis suggest no change is warranted to the current
McDonald Lake sustainable escapement goal range.
ESCAPEMENT GOAL RECOMMENDATION
The department reviews salmon escapement goals every 3 years in preparation for Southeast and
Yakutat board meetings as outlined in the Policy for Statewide Salmon Escapement Goals (5
AAC 39.223). No changes to the current McDonald Lake sockeye salmon escapement goal were
recommended following escapement goal reviews prior to board meetings in 2012 (Heinl et al.
2011), 2015 (Heinl et al. 2014), or 2018 (Heinl et al. In press). McDonald Lake stock assessment
information and escapement goal analysis will be reviewed again prior to the 2021 Southeast and
Yakutat board meeting.
STOCK OF CONCERN RECOMMENDATION
McDonald Lake sockeye salmon escapements have fallen below the lower bound of the
sustainable escapement goal range of 55,000–120,000 fish in 4 out of 5 consecutive years from
2013 to 2017 (Figure 2). In October 2017, the department recommended that the board designate
McDonald Lake sockeye salmon as a stock of management concern at the regulatory board
meeting for the Southeast and Yakutat Management Area in January 2018.
OUTLOOK
The department does not develop a formal preseason forecast for McDonald Lake sockeye
salmon; however, the 2018 run is expected to be below average based on weak parent-year
escapement. Five-year old fish, primarily age 1.3, account for an average 65% of McDonald
Lake sockeye salmon returns. Age-1.3 fish in the 2018 run will have been produced by the 2013
escapement of 15,400 fish, which was among the smallest recorded since 1980 (Figure 2). The
Page 16
9
estimated sockeye salmon fry population at McDonald Lake in 2014 (240,000 fish), largely
produced by the 2013 escapement, was also among the smallest recorded (Figure 7).
HABITAT ASSESSMENT
Habitat in the McDonald Lake watershed is considered pristine, and there are no habitat related
concerns identified for this stock. Virtually no logging has occurred in the drainage, aside from
limited timber removal and other habitat alterations that may have taken place in the early 1900s
in association with operation of the federal hatchery at the head of the lake.
FISHERY MANAGEMENT OVERVIEW AND
BACKGROUND
COMMERCIAL FISHERIES OVERVIEW
All commercial salmon net fisheries conducted in southern SEAK harvest mixed stocks of
salmon, except in the most terminal harvest locations. In addition, commercial purse seine
fisheries are managed primarily to harvest pink salmon (Clark et al. 2006). While there are
exceptions, such as directed fisheries on fall-run chum salmon (O. keta) or on hatchery stocks,
inseason management of the purse seine fishery is based on pink salmon escapement levels,
harvest levels, and fishing effort. Pink salmon accounted for an average 87% (22.7 million fish)
of the annual salmon harvest in traditional commercial net fisheries in southern SEAK (Districts
1–8), followed by chum salmon at 8% (2.1 million fish), sockeye salmon at 3% (740,000 fish),
and coho salmon (O. kisutch) at 2% (448,000 fish) (Table 3). Unless otherwise noted, all harvest
data presented here and in the sections below pertain to the 20-year period 1997–2016.
District 1 Purse Seine Fishery
District 1 encompasses Revillagigedo Channel, portions of East and West Behm Canal, and the
eastern portion of southern Clarence Strait. The southern section of District 1 opens on the first
Sunday in July to target early-run pink salmon. After initial openings in lower District 1 to
harvest pink salmon traveling through southern Clarence Strait and Revillagigedo Channel, the
fishing area is expanded north to include the Gravina Island shoreline. The Gravina Island shore
is managed conservatively to allow pink salmon moving into West Behm Canal. In most years,
the entire shoreline of Gravina Island is open by the third week in August. Sockeye salmon
account for an average of 2% (67,500 fish) of the total purse seine salmon harvest in District 1
(Table 3). An average 45% (28,000 fish) of the sockeye salmon harvest in this district (not
including terminal West Behm Canal fisheries) occurs on the Gravina Island shoreline
(Subdistrict 101-29), the closest portion of District 1 to West Behm Canal (and McDonald Lake).
District 2 Purse Seine Fishery
District 2 encompasses the waters of Clarence Strait along the southeastern shore of Prince of
Wales Island south of Narrow Point, and the western shore of the Cleveland Peninsula between
Lemesurier and Camaano points. The southern section of District 2 opens on the first Sunday in
July. The northern portions of District 2 may open as early as SW 30 (late July) in years of high
pink salmon abundance. Sockeye salmon account for an average 1% (40,000 fish) of the total
purse seine salmon harvest in District 2 (Table 3). Subdistrict 102-80 is located directly south of
the drift gillnet fishery in Subdistrict 106-30, where McDonald Lake sockeye salmon are known
to be harvested. The department has managed this area conservatively during past years to ensure
Page 17
10
McDonald Lake sockeye salmon conserved in Districts 5, 6, and 7 to the north are passed
through the northernmost area of District 2. An average 7% (2,885 fish) of the sockeye salmon
harvest in this district occurred in Subdistrict 102-80 in years when it was fished (15 of 20 years,
1997–2016).
District 4 Purse Seine Fishery
District 4 encompasses the waters west of the offshore islands located east of Prince of Wales
Island from Cape Muzon north to Cape Lynch. Sockeye salmon account for an average 6%
(352,000 fish) of the total purse seine salmon harvest in District 4. The majority (70–80%) of
those sockeye salmon are Canadian fish bound primarily for the Skeena and Nass rivers. Pacific
Salmon Treaty provisions currently limit the total District 4 sockeye salmon harvest prior to SW
31 (approximately the last week in July) to 2.45% of the annual allowable catch of the combined
Nass and Skeena river sockeye salmon runs. While the intent of the Treaty is to pass Canadian
sockeye salmon, it also has the effect of passing other early-run salmon through the district.
District 5 Purse Seine Fishery
District 5 encompasses the waters of western Sumner Strait. Purse seine fisheries occur either
inside the major bays or in the more exposed waters along the eastern side of the district between
Cape Pole and Point Baker. District 5 purse seine fisheries normally open during the first or
second week in August and are often confined inside bays to harvest pink and chum salmon.
Occasionally, the area just south of the District 6 drift gillnet area is opened and when that occurs
the percentage of sockeye salmon is slightly higher. That shoreline area (Subdistrict 105-41)
from Point Baker south to Ruins Point has been opened prior to SW 32, one year since 1997. In
2003, that area was open in SW 31 (beginning around 24–30 July). The small sockeye salmon
harvests in this fishery have not been sampled for stock identification, but stock composition is
probably very similar to the composition of harvests in the adjacent drift gillnet fishery in
Sumner Strait (Subdistrict 106-41). Restrictions, during what is expected to be the peak timing of
the McDonald sockeye salmon run through the fishery (SWs 29–31), have not been necessary
because poor pink salmon runs in that area have not warranted opening the area prior to SW 32
since 2003.
District 6 Purse Seine Fishery
District 6 is divided into 4 sections. Purse seine fisheries are limited to Sections 6-C and 6-D.
Section 6-D includes most of the waters of northern Clarence Strait and the southern portion of
Stikine Strait. Section 6-C is a small diamond shaped area adjacent to Screen Island and Lincoln
Rock. Section 6-C together with the adjacent Screen Island shoreline of Section 6-D are the only
waters in SEAK that, at times, may be fished simultaneously by the purse seine and drift gillnet
fleets.
The District 6 purse seine fishery normally opens during the first or second week in August.
Openings occur in 3 general areas of the district. The earliest fisheries often occur along the
western shoreline of Etolin Island in 2 of those areas, including the Quiet Harbor to Screen
Island shoreline and the area off the mouths of Mosman/Burnett/McHenry Inlets and the western
side of Onslow Island. The third area is the Ratz Harbor shoreline, which usually opens between
the second and third week in August. The sockeye salmon harvests in this fishery have not been
sampled for stock identification, but stock composition is probably similar to the composition of
harvests in the adjacent drift gillnet fishery in Clarence Strait (Subdistrict 106-30). The Screen
Page 18
11
Island shoreline has been opened once during SW 30 and 3 times during SW 31 in the past 20
years. The Mosman/Burnett/McHenry/Onslow area has been opened once during SW 30 and 8
times during SW 31 during the past 20 years. The Ratz Harbor shoreline has only been opened
twice during SW 31.
District 7 Purse Seine Fishery
District 7 encompasses the waters of Ernest Sound, Bradfield Canal, Zimovia Strait, and Eastern
Passage. Purse seine fisheries occur primarily in Ernest Sound. District 7 is divided into early-
and middle-run pink salmon stocks in the northern portion (Section 7-A), which is known as the
Anan fishery, and late-run stocks in lower Ernest Sound (Section 7-B). Until recently, the area
was primarily a pink salmon harvesting area. Beginning in 1997, enhanced chum salmon entered
the district in large enough numbers to attract additional purse seiners to the area.
District 7 purse seine fisheries normally open the first Sunday in July in Section 7-A (Anan).
Openings occur most consistently during SWs 28 and 29, and by SWs 31 and 32, Section 7-A is
open about one out of every 4 years. Harvests of sockeye salmon in this fishery are small, so it is
usually difficult to obtain samples; however, the stocks are probably similar to those harvested in
the adjacent drift gillnet fishery in Clarence Strait.
Purse seine fisheries in Section 7-B (lower Ernest Sound) normally start between SWs 30 and 32.
Section 7-B was opened once during SW 29, 3 times during SW 30, and eleven times during SW
31 since 1997. Since 2005, when Section 7-B has been open in SW 31, the area open has
generally been restricted to the upper portion of the area.
District 6 Drift Gillnet Fishery
The District 6 drift gillnet fishery takes place in Section 6-A in Sumner Strait, and 6-B, 6-C, and
a portion of 6-D in Clarence Strait. Management of District 6 is based on sockeye salmon
abundance from early June to the end of July, pink salmon abundance throughout August, and
coho salmon abundance from September through the end of the season. Although these salmon
stocks largely dictate the management decisions for weekly openings, fishermen also target
summer coho and chum salmon as well as fall chum salmon during the season. The District 6
fishery is managed (along with the District 8 drift gillnet fishery) by Pacific Salmon Treaty
provisions to harvest 50% of the total allowable catch of the transboundary Stikine River
sockeye salmon run. Preseason forecasts of the Stikine River sockeye salmon run guide the
initial openings, but management is based on inseason information by the end of June or early
July. The sockeye salmon harvest in District 6 is typically dominated by Stikine River sockeye
salmon until early July, at which point other sockeye salmon stocks, including local island
stocks, represent the majority of the harvest.
PAST COMMERCIAL FISHERY MANAGEMENT ACTIONS
Management measures to reduce harvest of McDonald Lake sockeye salmon may result in
foregone harvest of other healthy stocks because McDonald Lake fish are harvested incidentally
in all of the commercial net fisheries in southern SEAK (Districts 1–8) and migratory timing
broadly overlaps with other sockeye, pink, and chum salmon runs (Bergmann et al. 2009).
Management of the McDonald Lake sockeye salmon run is further complicated by lack of
inseason stock assessment information with which to gauge run strength and take effective
inseason action to reduce harvest. Sockeye salmon do not enter the McDonald Lake system until
well after sockeye salmon harvests have peaked in the commercial fisheries. Management
Page 19
12
measures to date, therefore, were focused on area and time when the stock is known to be most
prevalent in the fisheries closest to McDonald Lake, as outlined in the Harvest section (pages 2–
5).
Management actions in southern SEAK fisheries to conserve McDonald Lake sockeye salmon
have occurred in varying degrees since 2006. Management measures implemented during
2006−2008 included restrictions in the commercial net fisheries in Sumner and upper Clarence
straits, in Districts 1, 2, 5, 6, and 7, during a 4-week period from mid-July to early August (SWs
29–32). Those measures (Table 2; Figure 4) were incorporated into the McDonald Lake action
plan instituted by the board in 2009 (Bergmann et al. 2009) and carried out through 2011 when
the stock of concern designation was removed.
From 2012 through 2016, possible management actions were outlined in the annual purse seine
and drift gillnet management plans. These actions were similar to those outlined in the 2009
McDonald Lake action plan. Actions were not always required due to pink and sockeye salmon
run timing or abundance, which made implementation of actions unnecessary either entirely or in
part. In 2017, set management actions were outlined in the in 2017 drift gillnet and purse seine
management plans and followed during the season; however, despite a significant drop in the
2017 harvest rate compared to 2014–2016 (Appendix E), the lower bound of the escapement
goal was not achieved.
PAST PERSONAL USE FISHERY MANAGEMENT ACTIONS
Sockeye salmon personal use fishing limits have varied since harvest permits were first issued
for McDonald Lake sockeye salmon. The first documented permit was issued in 1968. The
largest Yes Bay sockeye salmon possession limits were set in 1987, following several years of
robust runs and a growing interest from local users. The daily possession limit was 50 fish per
person or 75 fish per household with no annual limit (Table 4). In 1993 the daily possession limit
was reduced to 25 fish per person or 50 fish per household. Those limits were maintained until
2002, when permits were changed to combine the individual with the household possession limit,
which was then set to 40 fish (Table 3). In 2005, the possession limit was reduced to 25 fish. An
annual limit was implemented for the first time in 2007, following poor escapements to
McDonald Lake, and the daily and annual possession limit was set at 20 fish. The season was
also shortened from 1 June–30 August to 1 July–30 August. Following removal of the stock of
concern designation in 2012, the daily and annual possession limit was raised to 30 fish.
PAST SPORT FISHERY MANAGEMENT ACTIONS
Sport fishing effort and harvest of McDonald Lake sockeye salmon is presumed to be very low
(see Harvest section, page 5). The current freshwater bag limit for sockeye salmon, including the
McDonald Lake drainage, is 6 fish, 12 in possession. Sport fisheries are subject to inseason
action under EO authority, but no management actions to reduce sport harvest of McDonald
Lake sockeye salmon have been taken to date.
Page 20
13
ACTION PLAN MANAGEMENT OPTIONS FOR
ADDRESSING STOCK OF CONCERN
ACTION PLAN GOAL
The action plan goal is to rebuild the McDonald Lake sockeye salmon run to levels that
consistently achieve the sustainable escapement goal range. The plan includes measures to
reduce commercial harvests of McDonald Lake sockeye salmon in the commercial drift gillnet
and purse seine fisheries in closest proximity to McDonald Lake and during the time McDonald
Lake fish are most prevalent in those fisheries. The plan provides flexibility with respect to
information (e.g., harvest distribution and timing) used in managing fisheries to conserve
McDonald Lake sockeye salmon.
ACTION PLAN ALTERNATIVES
Action #1: Commercial Fisheries
Objective: Reduce commercial harvest of McDonald Lake sockeye salmon.
Option A. Status quo (2013–2016).
Specific Action to Implement the Objective: Use EO authority to manage commercial fisheries
based on pink salmon abundance. Management actions to reduce harvest of McDonald Lake
sockeye salmon would be implemented during SWs 29–31 in the Districts 1, 5, 6, and 7 purse
seine fisheries and the District 6 drift gillnet fishery and during SWs 29–32 in the District 2
purse seine fishery. Management measures could include time and area restrictions. Specific
actions will depend on expected run strength of McDonald Lake sockeye salmon, general
observations of sockeye salmon abundance and harvests, and expected or realized levels of
fishing effort.
Benefits: The status quo would allow commercial net fisheries to proceed based on historical
fishing patterns. Management actions would be more restrictive during periods of low sockeye
salmon abundance and less restrictive during periods of high sockeye salmon abundance. As a
result, there may be less economic loss than with management actions that are set regardless of
inseason sockeye salmon abundance.
Detriments: The department can determine trends in total sockeye salmon abundance inseason,
but cannot accurately determine the abundance of McDonald Lake sockeye salmon due to lack of
inseason assessment programs to determine stock-specific abundance. If commercial harvest of
McDonald Lake sockeye salmon is the major factor contributing to recent poor escapements,
then escapements may not improve if prescriptive management measures are not implemented.
Option B. Reinstate the 2009 McDonald Lake action plan.
Specific Action to Implement the Objective: Use EO authority to implement the 2009
McDonald Lake action plan (Table 2) to reduce fishing time and area in the districts 1, 2, 5, 6,
and 7 purse seine fisheries and reduce time in the District 6 drift gillnet fishery. These actions
will be implemented annually during SWs 29–31, and extended to SW 32 in the District 2 purse
seine fishery, to reduce harvest of McDonald Lake sockeye salmon.
Page 21
14
Benefits: Management actions implemented by the board in 2009 were accepted by the fishing
industry, though the actions reduced fishing opportunity. The McDonald Lake sockeye salmon
escapement goal was achieved during years the action plan was implemented.
Detriments: Recent GSI information suggests conservation measures in the 2009 McDonald
Lake action plan may need to be expanded or shifted later into the season to be most effective in
reducing harvest of McDonald Lake sockeye salmon. Fishing opportunity will be reduced.
Option C. Implement modified 2009 McDonald Lake action plan.
Specific Action to Implement the Objective: Management actions outlined in the 2009
McDonald Lake action plan will be modified to account for harvest information collected since
2007 (Gilk-Baumer et al. 2013; Brunette et al. 2015; ADF&G Gene Conservation Laboratory,
unpublished data). Openings would be reduced in Districts 1, 2, 5, 6, and 7 during SWs 29–32 to
allow more McDonald Lake sockeye salmon to pass through the fisheries when these fish are
most prevalent in those fisheries. Changes from the 2009 McDonald Lake action plan are shown
in bold:
1) District 1 purse seine—The purse seine fishery on the entire western shore of Gravina
Island (Subdistrict 101-29) will be closed during SWs 29–30 (only closed north of the
latitude of Cone Point in the 2009 McDonald Lake action plan). In SW 31, the area north
of the latitude of Cone Point will be closed and will remain closed during SW 32.
2) District 2 purse seine—No change from 2009 action plan. The purse seine fishery in
Subdistrict 102-80 on the western shore of the Cleveland Peninsula (within 3 nautical
miles of the shoreline) will be closed during SWs 29–32.
3) District 5 purse seine—No change from 2009 action plan. The purse seine fishery in
Subdistrict 105-41 along northwestern Prince of Wales Island between Point Baker and
the Barrier Islands will be closed during SWs 29–31.
4) District 6 purse seine—The purse seine fishery in Subdistrict 106-30 along western Etolin
Island between Point Stanhope and the latitude of Round Point will be closed during SWs
29–31, and the area between Point Stanhope and the latitude of Steamer Point will
remain closed in SW 32. The purse seine fishery in Subdistrict 106-10 along eastern
Prince of Wales Island between Luck Point and Narrow Point will be closed during SWs
29–31 and will remain closed in SW 32.
5) District 7 purse seine—The purse seine fishery in Section 7-B (Subdistrict 107-10) will
be closed during SWs 29–31 and will remain closed in SW 32. If pink salmon runs are
strong, the northern portion of section 7-B north of Union Point may be open during SWs
31 and 32.
6) District 6 drift gillnet—In the 2009 McDonald Lake action plan, the District 6 drift
gillnet fishery was open for a maximum of 2 days during SWs 29–31. The plan will be
modified to include SW 32 and have a maximum of three days in SW 29 and SW 32.
The plan will continue to include a maximum of 2 days in SWs 30–31. Specific fishing
time in SWs 29 and 32 will be dependent on expected or observed fishing effort. Specific
area closures in this fishery are not anticipated; however, ongoing stock composition data
Page 22
15
may highlight certain time and area where McDonald Lake sockeye salmon are more
susceptible to harvest, and modifications to these conservation measures would proceed
accordingly.
Benefits: Changing management actions based on recent GSI information may prove to be more
effective in conserving McDonald Lake sockeye salmon.
Detriments: Fishing opportunity will be reduced. Recent stock composition information may
only represent a recent trend in McDonald Lake sockeye salmon run timing and actions based on
newer information may be too conservative. Additional area restrictions in District 1 may not
have the desired effect as the purse seine fleet will move into other districts in the Ketchikan
management area where McDonald Lake sockeye salmon could be present, resulting in no real
reduction in harvest.
Action #2: Personal Use Fishery
Objective: Reduce personal use harvest of McDonald Lake sockeye salmon.
Option A. Status quo.
Specific Action to Implement the Object: No change to annual personal use limit of 30
sockeye salmon per household.
Benefits: Maintaining personal use limits would keep personal use fishing effort on McDonald
Lake sockeye salmon at Yes Bay and away from other much smaller sockeye salmon systems in
the Ketchikan Management Area.
Detriments: The personal use fishery at Yes Bay specifically targets McDonald Lake salmon.
The personal use harvest may be too large to allow for adequate sockeye salmon escapement at
McDonald Lake. In addition, the personal use fishery may not share the conservation burden
with other fisheries; however, the reported personal use harvest averaged <3% of the total
McDonald Lake sockeye salmon run from 2012 to 2016 (see Harvest section, page 5).
Option B. Reduce harvest limits.
Specific Action to Implement the Object: Take action to reduce the annual harvest limit on the
personal use permit to 20 sockeye salmon per household.
Benefits: The harvest limit will be reduced by 33% to allow more sockeye salmon to reach
McDonald Lake. Reducing the harvest limit will also limit participation, further reducing
harvest.
Detriments: Significant costs are incurred by participants to travel by boat from Ketchikan to
Yes Bay to participate in this fishery. Some may not consider 20 sockeye salmon to be worth the
cost and effort, and effort may shift to other smaller sockeye salmon stocks in the area. The
reported personal use harvest averaged <3% of the total McDonald Lake sockeye salmon run
from 2012 to 2016 (see Harvest section, page 5).
Action #3: Sport Fishery
Objective: Reduce sport harvest of McDonald Lake sockeye salmon.
Option A. Status quo.
Page 23
16
Specific Action to Implement the Object: Use EO authority to reduce sport harvest of
McDonald Lake sockeye salmon by implementing restrictions or closures inseason. No
restrictions are being considered at this time because sport effort and harvest is very low.
Benefits: This option would provide the department with the flexibility to maintain sport fishing
opportunity if the McDonald Lake sockeye salmon run rebuilds prior to the next board meeting.
Detriments: If restrictions were implemented, this option will likely not decrease harvest of
McDonald Lake sockeye salmon by a measurable amount because the sport harvest is already
very low (see Harvest section, page 5).
Option B. Close sport fishing for sockeye salmon at McDonald Lake and saltwater areas in
Yes Bay.
Specific Action to Implement the Object: Take board action to close the McDonald Lake
drainage and the saltwater area adjacent to the mouth of the outlet stream in Yes Bay to sport
fishing for sockeye salmon.
Benefits: Closing the freshwater drainage and saltwater staging area to the retention of sockeye
salmon may increase the sockeye salmon escapement by a small number of fish.
Detriments: This option will likely not decrease harvest of McDonald Lake sockeye salmon by
a measurable amount because the sport harvest is already very low (see Harvest section, page 5).
It would eliminate the small amount of sport fishing opportunity provided by this fishery.
CONDITIONS FOR REDUCING MANAGEMENT
RESCTRICTIONS OR DELISTING STOCK OF CONCERN
Criteria for removing the stock of concern designation or reducing management restrictions
include:
1) If the lower bound of the escapement goal is met or exceeded in 3 consecutive years or is
met or exceeded in 4 of 6 consecutive years, the department will recommend removing
the McDonald Lake sockeye salmon run as a stock of management concern at the first
Southeast and Yakutat board meeting after this condition is met.
2) Management measures could be relaxed in specific areas if updated stock composition
and harvest data indicate areas where restrictions are no longer needed to ensure the
escapement goal is met.
3) In the event that 2 consecutive years of escapements are near the upper bound of the
escapement goal range or above the range, some management restrictions may be relaxed
or set aside using EO authority.
Stock status, action plan performance (including information on harvest rate, distribution, and
timing in commercial fisheries), and escapement goal review will be updated in a report to the
board at the 2021 Southeast and Yakutat meeting.
Page 24
17
2018 ALASKA BOARD OF FISHERIES REGULATORY
PROPOSALS AFFECTING MCDONALD LAKE SOCKEYE
SALMON
The following proposals before the board at the 2018 Southeast and Yakutat Board of Fisheries
meeting potentially affect commercial fisheries in which McDonald Lake sockeye salmon are
harvested. In addition, adoption of an action plan to reduce harvest of Unuk River king salmon
(O. tshawytscha) in commercial net fisheries may also result in reduced harvest of McDonald
Lake sockeye salmon.
Proposal 153: Repeal the District 1 pink salmon management plan.
Proposal 154: Establish a management plan for pink salmon in lower Clarence Strait
(proposal would reestablish a drift gillnet fishery in District 2).
Proposal 169: Open Section 6-D the second Sunday of June to commercial fishing for
salmon with drift gillnet gear.
Adoption of Unuk River king salmon action plan.
RESEARCH PLAN
Funding for McDonald Lake stock assessment was greatly reduced by state budget cuts in 2015
(removed video escapement assessment project). Stock assessment information essential for
escapement goal review and evaluation of action plan performance will continue to be collected.
Current Research Projects
1. Escapement estimates. Standardized multiple foot survey counts will be conducted
annually at McDonald Lake to estimate the sockeye salmon escapement. Surveys will be
conducted on approximately 10 September, 20 September, and 28 September. The annual
peak survey count will be multiplied by an expansion factor (4.85) to estimate total
escapement (Heinl et al. 2009). Scale samples will be collected on the spawning grounds
to estimate age composition of the run.
2. Fry population estimates. A fall (October) hydroacoustic survey will be conducted
annually at McDonald Lake to estimate the sockeye salmon fry rearing population.
3. Commercial harvest estimates. The commercial harvest will be estimated annually in
conjunction with U.S.-Canada GSI studies. This information will provide much needed
long-term assessment of harvest rates, distribution, and timing in southern SEAK
commercial fisheries.
Future Research Projects
1. Improved escapement estimates. Current escapement estimates are based on expanded
peak foot survey counts conducted on the spawning grounds. Additional years of mark–
recapture studies could be conducted at McDonald Lake to compare total population
estimates to peak survey counts with the goal of improving the current expansion factor.
Conducting adult escapement work at the outlet to McDonald Lake has proven to be
problematic over the last several decades, but a mark–recapture program where fish are
marked throughout the run at the mouth of Hatchery Creek (the primary spawning
tributary) and recovered upstream would have a high probability of success. However, it
is unlikely that additional years of data would dramatically alter the current expansion
Page 25
18
factor and the project itself could cause additional stress and mortality on McDonald
Lake sockeye salmon immediately prior to spawning.
There would potentially be some benefit in counting the escapement at the outlet of
McDonald Lake to provide timelier inseason information regarding abundance, but
maintaining picket and net weirs in what appear to be the most suitable locations has
proven to be problematic in the past. In addition, peak movements of sockeye salmon into
McDonald Lake typically occur in August, after the Action Plan measures have been
implemented. Even a perfect weir program at the outlet of the lake may not provide
useful inseason information for managing fisheries, and may come at a very high cost.
The current program of estimating escapement through an expanded peak count provides
adequate escapement information at low cost and no harm to the sockeye salmon
population.
2. Detailed harvest estimates. Although the current harvest information obtained through
U.S.-Canada GSI studies is a vast improvement over anything previously available,
additional funding would allow for a more detailed examination of specific subdistricts
where managers may want additional harvest location information. Although the majority
of the harvest in Districts 1–8 is covered under current sampling plans, additional area
not currently covered (e.g., District 7 purse seine), could be sampled with more funding.
Reasonable estimates of harvest in those areas can currently be made by applying stock
composition from adjacent fisheries. Thus, additional sampling would not likely provide
dramatic improvements to current estimates of harvest rate and harvest distribution, but
may be useful for fine-tuning management actions in southern SEAK net fisheries.
REFERENCES CITED
Bergmann, W. R, S. N. Forbes, S. C. Heinl, B. L. Meredith, A. W. Piston, and S. B. Walker. 2009.
McDonald Lake sockeye salmon action plan, 2009. Alaska Department of Fish and Game, Regional
Information Report Series No. 1J09-03, Douglas.
Brunette, M. T., A. W. Piston, and S. C. Heinl. 2015. Distribution and run timing of stocked McDonald
Lake sockeye salmon, 2011–2014. Alaska Department of Fish and Game, Fishery Data Series No. 15-
38, Anchorage.
Burkett, R. J., Koenings, M. Haddix, and D. Barto. 1989. Cooperative ADF&G, FRED Division/U.S.
Forest Service lake enrichment program for Southeast Alaska. Alaska Department of Fish and Game,
Division of Fisheries Rehabilitation, Enhancement, and Development Report Series No. 98, Juneau.
Cartwright, M. A., D. A. Beauchamp, and M. D. Bryant. 1998. Quantifying cutthroat trout
(Oncorhynchus clarki) predation on sockeye salmon fry (Oncorhynchus nerka) using a bioenergetics
approach. Canadian Journal of Fisheries and Aquatic Sciences 55:1285–1295.
Clark, J. H., A. McGregor, R. D. Mecum, P. Krasnowski and A. M. Carroll. 2006. The commercial
salmon fishery in Alaska. Alaska Fishery Research Bulletin 12:1–146.
Edmundson, J. A., T. P. Zadina, and M. H. Haddix. 1991. The development of a natural sockeye salmon
run into Virginia lake, Southeast Alaska. Alaska Department of Fish and Game, Division of Fisheries
Rehabilitation, Enhancement and Development Report Series No. 113, Juneau.
Eggers, D. M., S. C. Heinl, and A. W. Piston. 2009. McDonald Lake sockeye salmon stock status and
escapement goal recommendations, 2008. Alaska Department of Fish and Game, Fishery Data Series
No. 09-31, Anchorage.
Page 26
19
Geiger, H. J., M. A. Cartwright, J. H. Clark, J. Conitz, S. C. Heinl, K. Jensen, B. Lewis, A. J. McGregor,
R. Riffe, G. Woods, and T. P. Zadina. 2004. Sockeye salmon stock status and escapement goals in
Southeast Alaska [in] Stock Status and Escapement Goals for Salmon Stocks in Southeast Alaska. H.
J. Geiger and S. McPherson, editors. Alaska Department of Fish and Game, Divisions of Sport and
Commercial Fisheries, Special Publication 04-02, Anchorage.
Gilk-Baumer, S., S. M. Turner, C. Habicht, and S. C. Heinl. 2013. Genetic stock identification of
McDonald Lake sockeye salmon in selected Southeast Alaska fisheries, 2007–2009. Alaska
Department of Fish and Game, Fishery Manuscript Series No. 13-04, Anchorage.
Page 27
20
REFERENCES CITED (Continued)
Heinl, S. C., D. M. Eggers, and A. W. Piston. 2009. Sockeye salmon mark–recapture and radio telemetry
studies at McDonald Lake in 2007. Alaska Department of Fish and Game, Fishery Data Series No. 09-
42, Anchorage.
Heinl, S. C., R. L. Bachman, and K. Jensen. 2011. Sockeye salmon stock status and escapement goals in
Southeast Alaska. Alaska Department of Fish and Game, Divisions of Sport Fish and Commercial
Fisheries, Special Publication No. 11-20, Anchorage.
Heinl, S. C., E. L. Jones III, A. W. Piston, P. J. Richards, and L. D. Shaul. 2014. Review of salmon
escapement goals in Southeast Alaska, 2014. Alaska Department of Fish and Game, Fishery
Manuscript Series No. 14-07, Anchorage.
Heinl, S. C., E. L. Jones III, A. W. Piston, P. J. Richards, L. D. Shaul, B. W. Elliott, S. E. Miller, R. E.
Brenner, and J. V. Nichols. In press. Review of salmon escapement goals in Southeast Alaska, 2017.
Alaska Department of Fish and Game, Fishery Manuscript Series No. 17-XX, Anchorage.
Hoffman, S. H., L. Talley, and M. C. Seibel. 1983. 1982 U.S./Canada research pink and sockeye salmon
tagging, interception rates, migration patterns, run timing, and stock intermingling in southern
Southeast Alaska and Northern British Columbia. [in]: Final Report 1982 salmon research conducted
in Southeast Alaska by the Alaska Department of Fish and Game in conjunction with joint U.S.-
Canada Interception investigations. Contract No. NASO-82-00134.
Hoffman, S .H., L. Talley, and M. C. Seibel. 1984. 1983 sockeye and chum salmon tagging, notional
contribution rates, migration patterns, run timing, and stock intermingling research in southern
Southeast Alaska and northern British Columbia. [in] Final Report. 1983 salmon research conducted
in Southeast Alaska by the Alaska Department of Fish and Game in conjunction with National Marine
Fisheries Service Auke Bay Laboratory for joint U.S.-Canada Interception Studies. Contract No.
WASC-83-ABC-00157.
Johnson, T., S. C. Heinl, and H. J. Geiger. 2005. McDonald Lake: stock status report and escapement goal
recommendations. Alaska Department of Fish and Game, Fishery Manuscript No. 05-07, Anchorage.
Koenings, J. P., and R. D. Burkett. 1987. Population characteristics of sockeye salmon (Oncorhynchus
nerka) smolts relative to temperature regimes, euphotic volume, fry density and forage base within
Alaska lakes, p. 216–234. [in]: H. S. Smith, L. Margolis, and C. C. Wood, editors. Sockeye salmon
(Oncorhynchus nerka) population biology and future management. Candian Special Publication
Fisheries and Aquatic Science 96: 486.
Koenings, J. P., G. B. Kyle, M. Haddix, and B. Campbell. 1982. Limnology and fisheries investigations at
McDonald Lake (1979–1982). Alaska Department of Fish and Game, Division of Fisheries
Rehabilitation, Enhancement, and Development report, Soldotna.
Olson, R. P. 1989. Effects of lake fertilization on growth of juvenile sockeye salmon (Oncorhynchus
nerka) in Lake McDonald, Tongass National Forest, Alaska. M. S. Thesis, Humboldt State University,
Arcata.
Piston, A. W. 2004. Limnological and fisheries investigations at Virginia Lake, Southeast Alaska. Alaska
Department of Fish and Game, Division of Commercial Fisheries, Regional Information Report No.
1J04-17, Juneau.
Romberg, W. J. 2016. Alaska statewide sport fish harvest survey, 2016. Alaska Department of Fish and
Game, Division of Sport Fish, Regional Operational Plan ROP.SF.4A.2016.04, Anchorage.
Roppel, P. 1982. Alaska’s salmon hatcheries, 1891–1959. National Marine Fisheries Service, Alaska
Historical Commission Studies in History No. 20.
Page 30
23
Table 1.–Average opening and closing dates for ADF&G statistical weeks 25–36. Statistical weeks
begin on Sunday at 12:01 a.m. and end the following Saturday at midnight, and are numbered
sequentially starting from the first week of the calendar year.
Statistical
Week
Opening
Date
Closing
Date
Statistical
Week
Opening
Date
Closing
Date
25 14 June 20 June 31 26 July 1 August
26 21 June 27 June 32 2 August 8 August
27 28 June 4 July 33 9 August 15 August
28 5 July 11 July 34 16 August 22 August
29 12 July 18 July 35 23 August 29 August
30 19 July 25 July 36 30 August 5 September
Table 2.–Commercial fisheries management measures outlined in the 2009 McDonald Lake action
plan (Bergmann et al. 2009) and implemented through 2011.
Area Gear Perioda
Year
Implemented Restriction
District 6 Drift
gillnet
Statistical
weeks (SW)
29–31
2007–2011 Open for a maximum of 2 days.
District 1 Purse
seine
SWs 29–31 2007–2011 Western shore of Gravina Island (in Subdistrict 101-29)
closed north of the latitude of Cone Point.
District 2 Purse
seine
SWs 29–32 2009–2011 Western shore of the Cleveland Peninsula (Subdistrict 102-
80) closed within 3 nautical miles of the shoreline.
District 5 Purse
seine
SWs 29–31 2009–2011 Northwest corner of Prince of Wales Island (in Subdistrict
105-41) closed between Point Baker and the Barrier
Islands.
District 6 Purse
seine
SWs 29–31 2009–2011 West side of Etolin Island closed between Point Stanhope
and the latitude of Round Point (Subdistrict 106-30), and
east side of Prince of Wales Island closed between Luck
Point and Narrow Point (Subdistrict 106-10).
District 7 Purse
seine
SWs 29–31 2009–2011 Section 7-B closed (Subdistrict 107-10). If pink salmon
runs are extremely strong, the northern portion of section
7-B, north of Union Point may be open during SW 31. If
this occurs, restrictions may occur in that area south of
Union Point into SW 32 to reduce the overall interception
of sockeye salmon.
a Statistical weeks 29–31 are approximately mid-July to early August.
Page 31
24
Table 3.–Average annual harvest in numbers fish and average percentage of harvest by gear, district,
and species in southern SEAK commercial salmon net fisheries, 1997–2016.
Gear District
Pink
Salmon
Chum
Salmon
Sockeye
Salmon
Coho
Salmon
Chinook
Salmon Total
Drift Gillnet 101 444,799 275,714 86,915 53,262 1,449 862,140
Drift Gillnet 106 353,084 202,657 100,524 154,478 1,696 812,439
Drift Gillnet 108 44,282 113,363 42,872 26,224 8,182 234,922
Drift Gillnet Total 842,165 591,734 230,310 233,964 11,326 1,909,500
Purse Seine 101 5,228,062 341,184 67,459 36,664 741 5,674,110
Purse Seine 102 3,904,059 571,448 40,167 51,978 874 4,568,526
Purse Seine 103 4,042,274 119,416 25,786 29,269 437 4,217,182
Purse Seine 104 5,687,543 233,107 351,816 74,486 6,607 6,353,558
Purse Seine 105 565,326 16,584 3,078 2,466 18 587,471
Purse Seine 106 1,048,134 18,205 8,183 12,205 21 1,086,750
Purse Seine 107 1,460,268 188,248 13,577 7,467 389 1,669,949
Purse Seine Total 21,935,666 1,488,191 510,065 214,536 9,087 24,157,545
SSEAK Total 22,725,424 2,079,015 739,966 447,890 20,413 26,012,708
Drift Gillnet 101 50% 33% 10% 6% 0% 100%
Drift Gillnet 106 41% 26% 13% 21% 0% 100%
Drift Gillnet 108 21% 43% 18% 16% 3% 100%
Drift Gillnet Total 43% 32% 12% 13% 1% 100%
Purse Seine 101 89% 9% 2% 1% 0% 100%
Purse Seine 102 81% 17% 1% 1% 0% 100%
Purse Seine 103 94% 4% 1% 1% 0% 100%
Purse Seine 104 87% 5% 6% 1% 0% 100%
Purse Seine 105 89% 10% 1% 1% 0% 100%
Purse Seine 106 94% 3% 2% 2% 0% 100%
Purse Seine 107 82% 17% 1% 0% 0% 100%
Purse Seine Total 88% 8% 3% 1% 0% 100%
SSEAK Total 87% 8% 3% 2% 0% 100%
Table 4.–History of personal use sockeye salmon fishery limits in Yes Bay.
Year
Individual
Limit
Household
Limit
Annual
Limit Notes
1974 --- 10 None Beach Seine, gillnet, and dipnet gear allowed.
1981 10 50 None Weir operated on system 1981–1984; large
escapements counted. 1984 10 20 None
1987 50 75 None Season established 1 June–30 August.
1993 25 50 None Set gillnet allowed at Yes Bay.
2002 NA 40 None Individual limit combined with household limit.
2005 NA 25 None
2007 NA 20 20 Season changed to 1 July–30 August.
2017 NA 30 30
Page 33
26
Figure 1.–Major (thick arrows) and minor (thin arrows) migration routes of McDonald Lake sockeye
salmon through southern SEAK and management Districts 1–8.
Page 34
27
Figure 2.–Estimated McDonald Lake sockeye salmon spawning escapements and terminal harvest
(purse seine and personal use) in Yes Bay and upper West Behm Canal, 1980–2017. Historical
escapement goals are shown as horizontal black lines. The current sustainable escapement goal is a range
of 55,000–120,000 sockeye salmon.
Figure 3.–Estimated McDonald Lake sockeye salmon spawning escapements, 1980–2017. Black bars
represent approximate numbers of fish that experienced lake fertilization during rearing years 1982–2004.
0
50
100
150
200
250
300
350
19
80
19
82
19
84
19
86
19
88
19
90
19
92
19
94
19
96
19
98
20
00
20
02
20
04
20
06
20
08
20
10
20
12
20
14
20
16
Nu
mb
er
of
fish
(th
ou
san
ds)
Escapement Terminal harvest
0
30
60
90
120
150
180
19
80
19
82
19
84
19
86
19
88
19
90
19
92
19
94
19
96
19
98
20
00
20
02
20
04
20
06
20
08
20
10
20
12
20
14
20
16
Esti
mat
ed
esc
ape
me
nt
(th
ou
san
ds)
Fertilized escapement Non-fertilized escapement
Page 35
28
Figure 4.–Commercial fishing districts in southern SEAK and locations identified for time and area
restrictions in the 2009 McDonald Lake action plan (Bergmann et al. 2009).
Page 36
29
Figure 5.–Location of the Yes Bay personal use area and McDonald Lake in upper West Behm Canal,
southern SEAK.
Page 37
30
Figure 6.–Reported McDonald Lake (Yes Bay) sockeye salmon personal use harvest and number of
permits fished, 1985–2016.
Figure 7.–Estimated McDonald Lake sockeye salmon escapements (1982–2016) and estimated fall
rearing fry populations in the following year (1983–2017).
0
100
200
300
400
500
0
2,000
4,000
6,000
8,000
10,000
12,000
19
85
19
87
19
89
19
91
19
93
19
95
19
97
19
99
20
01
20
03
20
05
20
07
20
09
20
11
20
13
20
15
Nu
mb
er
of
pe
rmit
s
Nu
mb
er
of
fish
Number of sockeye salmon harvested Number of permits fished
0.0
1.0
2.0
3.0
4.0
5.0
0
50
100
150
200
250
19
82
19
84
19
86
19
88
19
90
19
92
19
94
19
96
19
98
20
00
20
02
20
04
20
06
20
08
20
10
20
12
20
14
20
16
Nu
mb
er
of
fry
(mill
ion
s)
Esca
pe
me
nt
(th
ou
san
ds)
Escapement Fry population
Page 39
32
APPENDIX
MCDONALD LAKE SOCKEYE SALMON HARVEST
INFORMATION
Page 40
33
Appendix A.–Distribution of coded wire tag recoveries of McDonald Lake sockeye salmon (expanded
for sampling rate) in southern SEAK commercial fisheries, 1985 and 1989–1991 (from Johnson et al.
2005).
Proportion by Area and Gear
1985 1989 1990 1991a Average
Total Tags Recovered 47 90 190 32 90
Total Expanded Tags 203 370 670 112 339
District 1 drift gillnet 7% 2% 2% 26% 9%
District 1 Annette Island gillnet 4% 2% 7% --- 3%
District 1 Annette Island seine 3% --- --- 5% 2%
District 1 Annette Island trap 1% --- --- --- <1%
District 1 purse seine 40%b 8% 9% 15% 18%
District 2 purse seine 9% 17% 9% 16% 13%
District 3 purse seine --- --- <1% --- <1%
District 4 purse seine 10% 13% 17% 32% 18%
District 6 drift gillnet 28% 57% 56% 6% 37%
District 7 purse seine --- 1% --- --- <1%
District 2 troll --- --- <1% --- <1%
Total 100% 100% 100% 100% 100% a Tag recovery information for 1991 may have been biased by a very low tagging rate in 1988; fewer than 6,000
smolts were tagged (compared to 22,000 in 1986, and 38,000 in 1987), 51% of which were tagged during the
last 3 days of the 6-week tagging period (Johnson et al. 2005). b In 1985 nearly 60% of the expanded District 1 purse seine tags were recovered in West Behm Canal subdistricts
101-85 and 101-90.
Appendix B.–Total sockeye salmon harvest, sample size, and estimated proportion and number (and
90% credibility intervals) of McDonald Lake sockeye salmon harvested in the District 106-41
commercial drift gillnet fishery based on genetic mixed stock analysis, 2007–2009 (from Gilk-Baumer et
al. 2013; gray cells indicate weeks when McDonald Lake management measures were in effect).
Year
Statistical
Week
Total
Harvest
Sample
Size
Proportion
McDonald
90% CI: Number
McDonald
90% CI:
Lower Upper Lower Upper
2007 27–28 11,734 379 0.045 0.021 0.073 528 246 857
2007 29 5,077 380 0.193 0.138 0.251 981 701 1276
2007 30 4,443 380 0.203 0.154 0.255 902 685 1133
2008 25–26 4,098 379 0.003 0 0.017 12 0 70
2008 27 5,716 377 0.006 0 0.023 34 0 132
2008 28 4,303 376 0.077 0.043 0.114 332 185 491
2008 29 4,192 379 0.159 0.114 0.208 667 478 873
2008 30 980 325 0.305 0.239 0.373 299 234 366
2008 31–34 995 270 0.270 0.210 0.332 269 209 330
2009 27–28 23,414 376 0.085 0.052 0.123 1,990 1,218 2880
2009 29 5,948 379 0.115 0.071 0.163 683 422 968
2009 30–31 7,694 328 0.320 0.250 0.389 2,457 1,920 2987
2009 32 5,098 380 0.207 0.157 0.258 1,055 801 1316
2009 33 3,167 379 0.205 0.162 0.250 648 512 791
Page 41
34
Appendix C.–Total sockeye salmon harvest, sample size, and estimated proportion and number (and
90% credibility intervals) of McDonald Lake sockeye salmon harvested in the District 106-30
commercial drift gillnet fishery based on genetic mixed stock analysis, 2007–2009 (from Gilk-Baumer et
al. 2013; gray cells indicate weeks when McDonald Lake management measures were in effect).
Year
Statistical
Week
Total
Harvest
Sample
Size
Proportion
McDonald
90% CI: Number
McDonald
90% CI:
Lower Upper Lower Upper
2007 28–29 6,644 380 0.149 0.108 0.193 990 717 1,282
2007 30 2,277 380 0.213 0.163 0.267 485 371 608
2007 31 2,251 379 0.397 0.316 0.474 894 712 1,067
2007 32–33 3,170 379 0.353 0.295 0.410 1,119 935 1,300
2007 34 1,235 190 0.468 0.392 0.542 579 485 670
2008 26–27 1,974 380 0.018 0 0.044 36 0 87
2008 28 913 380 0.102 0.063 0.146 93 57 133
2008 29 2,017 380 0.123 0.083 0.167 248 168 337
2008 30–31 2,827 378 0.388 0.325 0.449 1,098 919 1,270
2008 32–34 1,853 310 0.567 0.503 0.628 1,051 933 1,164
2009 27–28 8,606 380 0.127 0.087 0.170 1,094 750 1,465
2009 29 4,783 380 0.250 0.201 0.301 1,196 961 1,439
2009 30 1,992 380 0.460 0.401 0.517 914 797 1,027
2009 31 3,297 379 0.551 0.482 0.616 1,817 1,589 2,031
2009 32 5,351 380 0.454 0.382 0.527 2,425 2,040 2,815
2009 33–34 4,132 380 0.395 0.342 0.448 1,633 1,414 1,852
Appendix D.–Total sockeye salmon harvest, sample size, and estimated proportion and number (and
90% credibility intervals) of McDonald Lake sockeye salmon in the District 101-29 and District 107-10
commercial purse seine fishery based on genetic mixed stock analysis, 2007–2009 (from Gilk-Baumer et
al. 2013; gray cells indicate weeks when McDonald Lake management measures were in effect).
Year Area
Statistical
Week
Total
Harvest
Sample
Size
Proportion
McDonald
90% CI: Number
McDonald
90% CI:
Lower Upper Lower Upper
2007 101-29 30 3,655 354 0.306 0.238 0.377 1,119 870 1,378
2007 101-29 31 5,509 380 0.247 0.189 0.307 1,359 1,050 1,689
2007 101-29 32 4,597 380 0.294 0.228 0.362 1,351 1,048 1,664
2007 101-29 33–34 4,123 190 0.251 0.187 0.320 1,035 771 1,320
2008 101-29 32 282 215 0.109 0.063 0.160 31 18 45
2008 101-29 33–34 3,245 378 0.073 0.046 0.102 237 149 331
2009 101-29 31 4,251 260 0.166 0.111 0.226 705 472 960
2009 101-29 32–33 8,557 240 0.171 0.120 0.225 1,464 1,028 1,927
2009 101-29 34–35 4,238 220 0.082 0.042 0.128 347 178 541
2007 107-10 31–32 4,175 379 0.605 0.542 0.664 2,531 2,268 2,778
2008 107-10 32–33 1,038 248 0.306 0.238 0.376 318 247 391
2009 107-10 31–34 8,030 369 0.469 0.411 0.526 3,770 3,304 4,229
Page 42
35
Appendix E.–Estimated commercial harvest (and 90% credibility intervals) of McDonald Lake
sockeye salmon in southern SEAK by area based on genetic mixed stock analysis, and estimated
escapement and harvest rate, 2014–2017 (ADF&G Gene Conservation Laboratory, unpublished data).
Salmon fisheries in Annette Island waters of District 1 and purse seine fisheries in Districts 5, 6, and 7
were not sampled.
Year Gear Area
McDonald
Harvest
90% CI: Harvest
Distribution
Estimated
Escapement
Harvest
Rate Lower Upper
2014 Drift Gillnet 101-11 2,635 1,904 3,365 6% 43,400 51%
Drift Gillnet 106-30 2,965 2,501 3,430 6%
Drift Gillnet 106-41 2,944 2,478 3,410 6%
Drift Gillnet 108 269 188 349 1%
Purse Seine 101 9,103 6,155 12,050 20%
Purse Seine 102 4,386 2,607 6,164 10%
Purse Seine 103 44 0 2,071 0%
Purse Seine 104 23,658 15,011 32,305 51%
Total 46,004 30,844 63,144 100%
2015 Drift Gillnet 101-11 4,263 3,714 4,812 6% 70,200 48%
Drift Gillnet 106-30 8,762 7,838 9,687 13%
Drift Gillnet 106-41 6,521 5,394 7,647 10%
Drift Gillnet 108 318 178 457 0%
Purse Seine 101 10,148 7,682 12,614 15%
Purse Seine 102 4,735 3,335 6,136 7%
Purse Seine 103 43 0 388 0%
Purse Seine 104 30,800 18,662 42,937 47%
Total
65,590
100%
2016 Drift Gillnet 101-11 1,254 810 1,698 5% 15,600 63%
Drift Gillnet 106-30 3,742 3,240 4,244 14%
Drift Gillnet 106-41 4,914 3,989 5,839 18%
Drift Gillnet 108 140 25 256 1%
Purse Seine 101 8,145 5,517 10,773 31%
Purse Seine 102 1,747 905 2,589 7%
Purse Seine 103 415 139 691 2%
Purse Seine 104 6,215 3,183 9,247 23%
Total 26,572 100%
2017 Drift Gillnet 101-11 1,002 603 1,401 12% 24,000 26%
Drift Gillnet 106-30 2,265 1,892 2,637 27%
Drift Gillnet 106-41 2,274 1,928 2,620 27%
Drift Gillnet 108 115 52 178 1%
Purse Seine 101 816 360 1,272 10%
Purse Seine 102 180 47 314 2%
Purse Seine 103 94 0 243 1%
Purse Seine 104 1,790 914 2,666 21%
Total 8,536 100%
Page 43
36
Appendix F.–Estimated weekly harvest contributions (and 90% credibility intervals) of McDonald
Lake sockeye salmon to the Subdistrict 106-41 drift gillnet fishery, 2014–2017 (ADF&G Gene
Conservation Laboratory, unpublished data).
Year
Statistical
Week
Sample
Size
Sockeye
Harvest
Estimated
McDonald
90% CI: Estimated
McDonald
90% CI:
Lower Upper Lower Upper
2014 25 280 2,683 0.0% 0.0% 0.0% 0 0 0
2014 26 30 1,729 ND ND ND ND ND ND
2014 27 290 3,189 2.3% 0.5% 5.0% 74 15 159
2014 28 300 5,064 14.1% 9.3% 19.5% 713 470 987
2014 29 300 4,477 13.7% 9.2% 18.8% 613 411 841
2014 30 300 4,213 9.8% 5.5% 14.7% 412 230 620
2014 31 300 2,446 18.0% 12.8% 23.7% 440 312 579
2014 32 300 3,664 18.4% 13.1% 24.2% 673 478 885
2014 33 300 1,124 1.6% 0.2% 4.7% 18 2 53
2014 34–39 240 4,289 ND ND ND ND ND ND
2015 25 200 1,290 0.0% 0.0% 0.0% 0 0 0
2015 26 300 6,035 0.2% 0.0% 1.7% 15 0 102
2015 27 300 9,201 0.2% 0.0% 1.2% 15 0 107
2015 28 300 13,219 0.9% 0.0% 3.2% 116 0 425
2015 29 200 6,946 7.6% 4.2% 11.6% 526 291 805
2015 30 300 7,737 16.5% 11.5% 21.6% 1,277 891 1,674
2015 31 60 7,484 20.8% 12.4% 30.4% 1,556 927 2,272
2015 32 200 7,150 20.4% 15.3% 25.9% 1,461 1,094 1,854
2015 33 300 5,315 21.9% 16.1% 28.2% 1,164 857 1,497
2015 34–40 24 6,401 ND ND ND ND ND ND
2016 25 240 1,161 0.0% 0.0% 0.0% 0 0 0
2016 26 280 5,038 0.1% 0.0% 0.1% 4 0 7
2016 27 139 7,311 0.6% 0.0% 2.9% 42 0 212
2016 28 61 10,471 ND ND ND ND ND ND
2016 29 210 10,730 3.2% 0.4% 6.4% 342 45 692
2016 30 300 13,519 9.7% 6.7% 13.0% 1,306 908 1,755
2016 31 298 8,900 14.9% 10.9% 19.2% 1,325 971 1,713
2016 32 302 8,275 12.9% 8.8% 17.4% 1,069 731 1,441
2016 33 300 3,600 6.6% 2.5% 11.4% 238 88 410
2016 34 218 2,281 7.7% 3.0% 13.7% 175 67 312
2016 35 0 1,062 ND ND ND ND ND ND
2016 36 136 393 1.8% 0.0% 8.8% 7 0 34
2016 37–39 0 213 ND ND ND ND ND ND
2017 25 300 2,287 0.0% 0.0% 0.0% 0 0 0
2017 26 300 4,714 0.0% 0.0% 0.0% 1 0 0
2017 27 320 4,938 0.6% 0.0% 2.8% 31 0 141
2017 28 300 4,461 6.1% 3.1% 9.5% 270 138 424
2017 29 300 3,571 12.2% 7.8% 17.1% 434 279 612
2017 30 120 2,474 21.9% 15.1% 29.3% 541 373 724
2017 31 300 1,616 20.2% 13.9% 27.1% 327 224 438
2017 32 300 1,507 16.8% 10.8% 23.5% 252 162 354
2017 33 300 1,507 11.6% 6.9% 17.1% 175 103 258
2017 34–35 514 1,158 20.9% 14.8% 27.2% 242 171 315
2017 36–39 0 211 ND ND ND ND ND ND
Page 44
37
Appendix G.–Estimated weekly harvest contributions (and 90% credibility intervals) of McDonald
Lake sockeye salmon to the Subdistrict 106-30 drift gillnet fishery, 2014–2017 (ADF&G Gene
Conservation Laboratory, unpublished data).
Year
Statistical
Week
Sample
Size
Sockeye
Harvest
Estimated
McDonald
90% CI: Estimated
McDonald
90% CI:
Lower Upper Lower Upper
2014 25 120 535 0.0% 0.0% 0.0% 0 0 0
2014 26 200 897 0.0% 0.0% 0.0% 0 0 0
2014 27 300 2,029 3.9% 1.3% 7.5% 79 26 151
2014 28 300 5,600 8.6% 4.7% 13.3% 482 263 743
2014 29 300 3,681 17.2% 12.1% 22.8% 633 446 840
2014 30 300 5,083 19.7% 14.2% 25.7% 1,001 724 1,305
2014 31 300 1,099 11.6% 6.9% 16.8% 127 76 185
2014 32 300 3,260 11.7% 7.5% 16.5% 383 245 538
2014 33 300 667 25.1% 19.7% 30.8% 167 132 205
2014 34 300 1,894 4.9% 2.2% 8.5% 93 41 161
2014 35–39 0 807 ND ND ND ND ND ND
2015 25 200 396 3.6% 0.0% 12.1% 14 0 48
2015 26 300 1,244 0.0% 0.0% 0.0% 0 0 0
2015 27 300 2,815 0.6% 0.0% 2.5% 17 0 70
2015 28 300 7,001 5.4% 2.8% 8.5% 376 195 595
2015 29 300 4,967 6.1% 2.8% 10.1% 305 141 503
2015 30 180 10,414 15.8% 10.6% 21.5% 1,642 1,100 2,234
2015 31 300 8,066 29.6% 24.7% 34.7% 2,389 1,989 2,797
2015 32 300 8,836 28.1% 22.9% 33.3% 2,481 2,020 2,939
2015 33 300 3,694 31.6% 25.2% 38.4% 1,168 930 1,420
2015 34 300 1,429 25.9% 17.4% 34.9% 371 249 499
2015 35–39 0 2,281 ND ND ND ND ND ND
2016 25 10 74 ND ND ND ND ND ND
2016 26 120 798 0.0% 0.0% 0.0% 0 0 0
2016 27 289 2,225 0.7% 0.0% 4.2% 16 0 92
2016 28 304 5,554 4.3% 0.0% 8.4% 236 0 467
2016 29 300 4,112 6.7% 3.7% 10.3% 276 151 425
2016 30 300 3,432 14.0% 9.5% 18.9% 481 327 649
2016 31 300 5,296 14.0% 10.2% 18.1% 741 542 959
2016 32 300 7,264 18.0% 14.1% 22.3% 1,309 1,025 1,617
2016 33 300 2,100 14.8% 9.4% 20.7% 310 197 435
2016 34 300 1,758 18.6% 12.7% 25.0% 328 223 440
2016 35 263 747 0.0% 0.0% 0.0% 0 0 0
2016 36–39 91 335 ND ND ND ND ND ND
2017 25–26 315 1,953 0.2% 0.0% 1.0% 3 0 20
2017 27 216 1,707 8.4% 4.1% 13.5% 143 71 230
2017 28 300 2,012 9.8% 4.3% 16.0% 198 87 322
2017 29 300 2,788 18.4% 11.8% 25.6% 512 330 713
2017 30–31 299 3,341 18.5% 13.2% 24.1% 617 442 807
2017 32 300 2,508 18.4% 12.2% 25.2% 461 307 632
2017 33–35 393 2,056 16.0% 9.6% 23.3% 329 197 479
2017 36–39 0 196 ND ND ND ND ND ND
Page 45
38
Appendix H.–Estimated weekly harvest contributions (and 90% credibility intervals) of McDonald
Lake sockeye salmon to the District 101 and 102 purse seine fisheries, 2014–2017 (ADF&G Gene
Conservation Laboratory, unpublished data).
Year District
Statistical
Week
Sample
Size
Sockeye
Harvest
Estimated
McDonald
90% CI: Estimated
McDonald
90% CI:
Lower Upper Lower Upper
2014 101 28–30 295 20,979 15.5% 10.7% 20.7% 3,251 2,238 4,337
2014 101 31–32 295 30,526 9.0% 5.9% 12.4% 2,742 1,804 3,779
2014 101 33–34 296 21,344 14.6% 10.7% 18.6% 3,110 2,292 3,975
2014 101 35 0 2,529 ND ND ND
2015 101 28–29 190 14,418 11.1% 6.3% 16.7% 1,603 906 2,402
2015 101 30–31 195 27,432 8.4% 4.3% 13.2% 2,313 1,178 3,618
2015 101 32–33 206 36,564 17.0% 11.8% 22.7% 6,232 4,302 8,311
2016 101 28–30 199 17,309 0.8% 0.0% 5.9% 146 0 1,018
2016 101 31–32 370 55,972 12.8% 8.9% 16.9% 7,147 4,990 9,473
2016 101 33–34 198 21,853 3.9% 0.0% 9.9% 851 0 2,157
2017 101 27–29 193 4,177 6.6% 0.0% 12.4% 274 0 517
2017 101 30–33 196 3,500 6.2% 0.0% 13.6% 219 0 476
2017 101 34–35 286 7,693 4.2% 0.0% 7.9% 323 0 609
2014 102 25–27 298 5,194 5.5% 3.3% 8.1% 286 170 420
2014 102 28–30 296 14,075 16.8% 12.4% 21.1% 2,363 1,750 2,974
2014 102 31–34 300 22,409 7.7% 5.0% 10.7% 1,736 1,131 2,408
2014 102 35 0 1,288 ND ND ND ND ND ND
2015 102 26–31 190 20,487 6.5% 3.6% 10.1% 1,341 744 2,064
2015 102 32–35 380 55,076 6.2% 4.1% 8.5% 3,394 2,241 4,695
2015 102 36–39 0 862 ND ND ND ND ND ND
2016 102 26–30 196 14,329 0.2% 0.0% 1.6% 28 0 234
2016 102 31 0 3,574 ND ND ND ND ND ND
2016 102 32–33 280 35,571 4.8% 2.7% 7.3% 1,719 967 2,607
2017 102 25–27 224 6,177 0.2% 0.0% 1.3% 10 0 82
2017 102 28–29 219 5,597 3.0% 1.2% 5.4% 170 69 304
2017 102 30–37 0 2,197 ND ND ND ND ND ND
Page 46
39
Appendix I.–Estimated commercial harvest (and 95% credibility intervals) and distribution of thermal-
marked McDonald Lake sockeye salmon in southern SEAK by area, 2011–2012 (from Brunette et al.
2015).
Year Gear Area
McDonald
Harvest
95% CI:
CV Distribution Lower Upper
2011 Drift Gillnet 101-11 63 0 143 64% 4%
2011 Drift Gillnet 106-30 671 462 880 16% 41%
2011 Drift Gillnet 106-41 448 230 667 25% 27%
2011 Drift Gillnet 108 11 0 38 125% 1%
2011 Purse Seine 101-inside a 32 0 74 68% 2%
2011 Purse Seine 101-outside b 124 31 218 38% 8%
2011 Purse Seine 102 86 17 156 41% 5%
2011 Purse Seine 104 209 0 543 82% 13%
2011 Purse Seine 107 ND ND ND ND ND
2011 Total
1,644
100%
2012 Drift Gillnet 101-11 165 50 279 35% 5%
2012 Drift Gillnet 106-30 557 451 663 10% 17%
2012 Drift Gillnet 106-41 821 624 1,018 12% 25%
2012 Drift Gillnet 108 13 0 27 60% 0%
2012 Purse Seine 101-inside a 317 160 473 25% 10%
2012 Purse Seine 101-outside b 483 324 643 17% 15%
2012 Purse Seine 102 400 237 564 21% 12%
2012 Purse Seine 104 505 58 951 45% 15%
2012 Purse Seine 107 43 0 92 59% 1%
2012 Total
3,304
100% a The District 101-inside area includes combined subdistricts 101-23 and 101-41 in Revillagigedo channel.
b The District 101-outside area includes combined subdistricts 101-29 and 101-25 in Clarence Strait.