Page 1
Draft
Effect of critical sub-system failures on the post-earthquake
functionality of buildings: A case study for Montreal hospitals
Journal: Canadian Journal of Civil Engineering
Manuscript ID cjce-2015-0428.R1
Manuscript Type: Article
Date Submitted by the Author: 18-Jun-2016
Complete List of Authors: Youance, Suze; École de technologie supérieure, Génie de la construction Nollet, Marie-José; Ecole de technologie supérieure, Genie de la construction; McClure, G.; Civil Engineering and Applied Mechanics
Keyword: Buildings; seismic evaluation; performance-based earthquake engineering; system reliability
https://mc06.manuscriptcentral.com/cjce-pubs
Canadian Journal of Civil Engineering
Page 2
Draft
1
Effect of critical sub-system failures on the post-earthquake functionality of
buildings: A case study for Montreal hospitals
Suze Youance, ing.jr., PhD. Département de génie de la construction, École de Technologie Supérieure 1100 Notre-Dame Ouest, Montréal, QC Canada, H3C 1K3 Marie-José Nollet, ing., Ph.D. Professeure Département de génie de la construction, École de Technologie Supérieure 1100 Notre-Dame Ouest, Montréal, QC Canada, H3C 1K3 Ghyslaine McClure, ing., Ph.D. Associate Provost McGill University James Administration Building, 845 Sherbrooke Street West Montréal, QC Canada, H3A 0G4
Corresponding Author:
Suze Youance, ing.jr., PhD. Département de génie de la construction, École de Technologie Supérieure 1100 Notre-Dame Ouest, Montréal, QC Canada, H3C 1K3 Tél : 514-433-8899 Courriel : [email protected]
Page 1 of 48
https://mc06.manuscriptcentral.com/cjce-pubs
Canadian Journal of Civil Engineering
Page 3
Draft
2
ABSTRACT:
When an earthquake occurs, hospitals are expected to remain functional as they play a
crucial role in emergency care operations. This ability to ensure the continuity of quality
operations while ensuring the safety of occupants during and after an earthquake defines
the concept of post-earthquake functionality. Hospital functionality relies on the good
performance of a large number of critical sub-systems, components and equipment.
Although the global seismic performance of building structures and their non-structural
components was extensively observed in several post-disaster reconnaissance surveys,
there is few and incomplete information on the effect of building and non-structural
damage on post-earthquake functionality. The objective of this paper is to present a
methodology for the assessment of post-earthquake functionality of existing Montreal
hospitals using fault-tree analysis. The study shows that using specific and accurate
information on the vulnerability and fragility of structural and critical non-structural
components, a probabilistic index of post-earthquake functionality of the entire facility is
computed which informs mitigation action for the critical failure processes through the
system.
Keywords: Buildings; seismic evaluation; performance-based earthquake engineering; system reliability
Page 2 of 48
https://mc06.manuscriptcentral.com/cjce-pubs
Canadian Journal of Civil Engineering
Page 4
Draft
3
1 INTRODUCTION
Nowadays, the seismic performance expected from a building structure is linked to its use
and occupancy as well as to the social, economic and operational impacts resulting from a
poor performance (Gupta and Krawinkler 1999). As such, even when structural damage
is minimal, some buildings become dysfunctional following moderate earthquakes. This
is referred to as domino effect, technological failure or more directly, loss of
functionality.
Oddly enough considering the main goal of building codes, these concepts are relatively
new in earthquake structural engineering. They are based on the analysis of the
consequences of local failure of critical operational and functional components (OFCs) in
the system. Experiences from large earthquakes such as in Northridge, California
(January 17th, 1994 - Mw 6.7), Kobe, Japan (January 16th, 1995- Mw 6.9), Kocaeli, Turkey
(August 17th, 1999 - Mw7.6) and Chi Chi, Taiwan, China (October 20th, 1999 - Mw7.6),
have highlighted the fact that the post-earthquake functionality of hospitals largely
depends on the good performance of its non-structural components and equipment
(Myrtle et al. 2005). In each of these disasters, and even in more recent events, health
care facilities had to be evacuated (Davidovici 2007; EERI 2009, 2010; Myrtle et al.
2005; NCREE 2010).
These observations initiated new research towards the understanding and improvement of
seismic behaviour of OFCs. These include seismic assessment and conducting
experimental investigations of OFCs, the development of database and provisions or
guidelines for seismic design and seismic risk reduction of OFCs (PWGSC 1995; Soong
Page 3 of 48
https://mc06.manuscriptcentral.com/cjce-pubs
Canadian Journal of Civil Engineering
Page 5
Draft
4
et al. 1999; Chong and Soong 2000; Filiatrault et al. 2003; CSA 2014). From a post-
earthquake functionality point of view, the focus has been made on a better understanding
of damage propagation within a system and to improve codes and construction standards,
especially in high seismic risk regions (Johnson et al. 1999; Myrtle et al. 2005; Nuti and
Vanzi 1997; Porter et al. 2006; Scawthorn 2011; Shinozuka et al. 2004; Yavari et al.
2010).
In Eastern Canada, the Saguenay earthquake (1988, Mw 5.9) is one of the largest and
most damaging event to have occurred in recent decades; damage reports on hospital
buildings from this event are also the only ones documented in Canada, despite a higher
seismic hazard on the West Coast (Hanna 1993). Although no severe structural damages
(except to the Montreal East City Hall building that suffered foundation failure) or major
fires were reported, this earthquake provided an excellent opportunity to investigate the
“serviceability performance” of critical buildings in the event of stronger earthquakes
(Mitchell et al. 1990). Observations from damage reconnaissance teams in hospital
buildings highlighted the following: 1) the abundance of damaged unreinforced masonry
(URM) walls poorly fastened to the structures, 2) the vulnerability of operational systems
dedicated to essential services: communication and water pipes systems and the
managing rescue and evacuation operation and 3) the presence of local site conditions
that tended to amplify shaking levels and structural damage. According to the detailed
analysis of building damage, 36 hospitals were affected at a distance up to 350 km from
the epicenter (Paultre et al. 1993). Although most of the available damage data remains
qualitative and limited, these observations highlight the vulnerability of existing buildings
and indicate potential dysfunction of post-disaster buildings for moderate seismic events
Page 4 of 48
https://mc06.manuscriptcentral.com/cjce-pubs
Canadian Journal of Civil Engineering
Page 6
Draft
5
due to damaged operational and functional components. As summarized in Table 1, small
horizontal accelerations were recorded in Quebec city, but significant non-structural
damage did occur in two hospitals built on soft soil (Mitchell et al. 1990).
Recent changes to the seismic provisions of the National Building Code of Canada
(NBCC 2010) provide more explicit requirements in relation to the performance of post-
disaster buildings (IRC-CNRC 2010). Immediate occupancy of these buildings is
mandatory for rare earthquakes with a hazard level of 2% in 50 years. Therefore, it can be
assumed that for more frequent events (10% in 50 years), the full functionality should be
maintained. In both cases, the structure shall retain most of its initial strength and
stiffness, while essential non-structural components and critical systems could suffer only
minor or no damage. For non-structural components in existing and new buildings, the
Canadian standard CSA-S832-14 (CSA 2014) complements the NBCC clauses that apply
to new buildings only, and suggests a methodology for seismic risk assessment of
individual OFCs. The OFC risk assessment procedure accounts for interdependencies
between the building structure, the building content and its non-structural components
and subsystems, and their interfaces with lifelines.
1.1 Evidence of interdependencies in hospitals
A hospital is a complex and highly interactive system of structural components,
operational and functional equipment and personnel providing services. Figure 1 reflects
this interactivity/interdependency in a post-earthquake functionality context. The overall
reliability of the hospital system is determined by: 1) the seismic vulnerability assigned to
each OFC; 2) the seismic vulnerability of the structure and its vertical and lateral load
Page 5 of 48
https://mc06.manuscriptcentral.com/cjce-pubs
Canadian Journal of Civil Engineering
Page 7
Draft
6
resisting systems and; 3) the vulnerability of its various utility interfaces (electricity,
water, gas, telecommunication, etc.), which are all directly influenced by seismic hazard
and geotechnical site effects. The dashed line in the figure represents the interaction of
seismic performance involving the building structure, the OFCs and their subsystems and
the service lifelines and interfaces. The interaction between the different components is
complex and the system functionality cannot be achieved by a simple sum of subsystem
vulnerability or component indices.
1.2 Research Significance
The main objective of this study is to develop a methodology to assess the seismic risk of
a health care centre (Montreal hospital), with the consideration of the interaction between
various physical elements. The study describes the concept of system interaction in
hospitals along with the Fault-Tree Analysis (FTA) method that is used to collect and
analyse data. The effect of interactions between critical sub-systems on the post-
earthquake functionality of the whole is illustrated by a case study of two essential
hospital systems: Heating, ventilation and air conditioning (HVAC) and life support
systems. The seismic risk for independent critical health care facilities is assessed through
a post-earthquake functionality index giving valuable insights on salient risk contributors
and eventual mitigation action.
Page 6 of 48
https://mc06.manuscriptcentral.com/cjce-pubs
Canadian Journal of Civil Engineering
Page 8
Draft
7
2 RISK ANALYSIS FRAMEWORK FOR COMPLEX SYSTEMS
2.1 Methodology
To quantify the consequence of failure, the authors proposed an iterative approach: 1) a
qualitative phase in order to conceptualize the hospital systems using fault tree model,
and 2) a quantitative phase based on a combination of existing procedures and methods:
- The seismic vulnerability of the buildings is evaluated from the updated version
of the NRC-92 procedure (Rainer et al. 92);
- The seismic risk associates to the OFCs is evaluated according to the CSA 2014
methodology (CSA 2014);
- The probability of damage to OFCs is estimated from fragility functions
developed by HAZUS (NIBS 2013);
- The probability of failure within a system is computed using fault tree analysis
(MIL-STD-1629A 1980; Vesely et al. 1981).
2.2 Infrastructure interactions and complexities
In a theory of “normal accidents”, Perrow (1984) suggested that systems of high
complexity, coupling technology and organization are subjected to cascading failures.
Considering the widespread presence of technology in society’s common operations and
essential infrastructure, this notion has evolved and expanded to various fields such as
economy or national security (Dhillon 1999). In this perspective, Rinaldi et al. (2001)
proposed a conceptual framework for addressing infrastructure interactions and
complexities in terms of six “dimensions”, to clarify the various aspects of interactions
within complex systems (See Table 2). The interdependencies are defined by
Page 7 of 48
https://mc06.manuscriptcentral.com/cjce-pubs
Canadian Journal of Civil Engineering
Page 9
Draft
8
bidirectional relations between infrastructures or as intrinsic relations within a given
infrastructure. The problem of complex system analysis and infrastructure interactions
can also be defined in the form of a set of questions as proposed by Limnios (1991). The
proposed framework for the analysis of hospital’s complex systems follows these
concepts and identifies global objectives and models for risk analysis based on the fact
that seismic performance of components depends on their vulnerability and fragility
(Table 2).
To determine the reliability of the system, one needs to assess its failure scenarios and
determine the influence of a given component state or a default type on the whole. The
main challenge is then to conceptualize a functional hospital system that can accurately
represent the component and sub-system interdependencies, the interface complexities,
the component and sub-system failure modes and the associated losses or consequences.
The proposed approach is to construct the functional hospital system using Fault Tree
Analysis (FTA) that is commonly used in risk analysis of complex systems modelled by
random variables (MIL-STD-1629A 1980; Vesely et al. 1981).
A fault tree is a logical graph representing the various combinations of basic
failure/malfunction events susceptible to occur in a system. The fault tree depicts the
relationship between the Output (higher event) and Input (lower event) as a Boolean gate
(.AND. / .OR.) in order to evaluate the probability of failure of the higher event. When
the first failure (lower event) occurs, an .AND. gate represents relationships between all
the input faults in such way that the system will automatically rely on the next input event
in the row to survive, whereas an .OR. gate indicates that the system will fail. The .AND.
Page 8 of 48
https://mc06.manuscriptcentral.com/cjce-pubs
Canadian Journal of Civil Engineering
Page 10
Draft
9
gate therefore expresses a more robust and redundant system. This deductive analysis
from the higher event will proceed until reaching all lower event or individual
components or equipment failure modes. Moreover, FTA offers modularity and
flexibility that enable specific accommodations to the required scenarios, such as change
in the components or sub-systems interdependency or the possibility of using another
probability theory.
2.3 Quantitative analysis methodology
Subsequent to the qualitative process of mapping the system FTA, a quantitative analysis
can proceed by defining a Priority Risk Index (PRI) for each lower event. This is called
Failure Modes, Effects & Criticality Analysis (FMECA), aiming to identify failures that
have significant (or undesirable) effects on system performance. As expressed by
Equation 1, PRI is the simple product of a risk level (SRI, Seismic risk index in the
present application) and the probability (P) of reaching or exceeding a given damage
level or failure. This application is more inherently simple than usual FMECA as the
failures will all be initiated from damage due to an earthquake.
[1] PRI = SRI×P
The resulting PRIi for each lower event i is then injected into the fault tree to obtain the
final post-earthquake functionality index (PFIj) of a system j by algebraic calculation
rules. These rules highlight the weaknesses in systems as the fault tree represents all
possible failure paths or direct effects of damage to components (Equations 2 and 3). The
Page 9 of 48
https://mc06.manuscriptcentral.com/cjce-pubs
Canadian Journal of Civil Engineering
Page 11
Draft
10
proposed methodology allows to quantify the consequences of interdependent failures
from individual component dysfunctions.
[2] .AND. gate ∶ PFIj = PRI1×PRI2×…×PRIi
[3] .OR. gate :PFIj=1-(1-PRI 1) × (1-PRI2)×….× (1-PRIi-1)
The PFI has an optimal value of zero, which corresponds to a system fully functional or
in which the top event has an ideal zero probability of occurrence. For example, low PFIs
typically indicate optimal base event conditions with a low probability of damage or high
redundancy.
The implementation of this quantitative post-earthquake functionality analysis for
Montreal hospital buildings relies on the construction of a reliable database on seismic
vulnerability information to define the risk level, SRI. The probability of failure P of non-
structural components could be obtained from fragility curves expressed in terms of
spectral acceleration or spectral displacement, as appropriate to their failure modes.
3 OVERVIEW OF MONTREAL HOSPITALS AND SEISMIC
VULNERABILITY CONTEXT
The portrait of Montreal hospitals shows a wide range of building types housing various
critical services, local site conditions and seismic characteristics. In an Eastern North
American context where observed earthquake damage data are scarce, those factors have
to be combined to create damage models in the perspective of post-earthquake
Page 10 of 48
https://mc06.manuscriptcentral.com/cjce-pubs
Canadian Journal of Civil Engineering
Page 12
Draft
11
functionality assessment. According to the last annual report of Montreal’s Health and
Social Services Agency, the Montreal Island population, estimated to 1.9 million,
received health care services from 81 institutions and around 400 facilities and service
points distributed throughout its 499 km2 territory (ASSSM 2014). Among those
institutions, 31 are categorized as hospitals, i.e. general and specialized or ultra-
specialized care facilities offering emergency services, nursing, paediatric and mental
health care and other services including medical imaging, nuclear medicine or
rehabilitation services: these are mapped on Fig.2.
These hospitals are generally composed of several buildings that are structurally
independent, i.e. separated by structural joints. In Montreal, half of them have been built
between 1950 and 1970. They are pre-code in terms of seismic design according to
NBCC. Typically they consist in large buildings of low to medium height (up to 14
stories) with few exceptions (see Fig. 2). The most common structural systems are steel
braced frames, steel frames with masonry infills and reinforced concrete frames with
masonry infills. Individual buildings are usually of rectangular footprint with few vertical
or horizontal irregularities. Heavy load-bearing masonry walls are used in the oldest
constructions, built before 1920 (22% of buildings): These buildings will be closed down
and their services relocated in new buildings under construction. Two facilities, Montreal
General Hospital (MGH) and Rivière-des-Prairies Hospital (RDPH), have been retained
as case studies to develop a database on seismic vulnerability with three main damage
factors: 1) seismic hazard (10% and 2% in 50 years occurrence), 2) site category (stiff to
soft soil, site classes A to E according to NBCC), and 3) building fundamental period.
Page 11 of 48
https://mc06.manuscriptcentral.com/cjce-pubs
Canadian Journal of Civil Engineering
Page 13
Draft
12
MGH is a designated Adult Trauma Centre and RDPH is specialized in Pediatric and
Adolescent psychiatric care, therefore both hospitals bring specific challenges related to
post-seismic functionality. Hospital building managers are aware of this complexity and
have set up management systems to detect hazard, communicate alerts, and respond
promptly and efficiently. Main critical OFC systems are designed to be redundant and
secondary systems provide additional or more specific services. For example, hospitals
typically use multiple sources of energy or connections to water or power supply utility
network with backup systems for fast recovery in case of interface or external failure.
Internally, there is redundancy in almost all of the essential OFCs such as power
generators, boilers, filter systems, pumps for medical air production, etc. to ensure
continuity of operations in case of a component dysfunction during normal building
operations. Fault trees of the analyzed systems are developed in section 4.
With around one million square feet, the MGH operational area is about twice the
RDPH’s. As illustrated in Figure 3, both hospitals are comprised of several blocks,
typically steel braced frames with uniform plan joining at right angles, simple façades
and flat roofs. Diagonal bracings are located at the perimeter of each block and are made
of symmetric steel plates and angles.
4 DEFINITION OF RISK LEVEL (SRI) FROM SEISMIC VULNERABILITY
DATA
As a first step, a qualitative risk assessment process, based on a visual in-situ inspection
of ten MGH and RDPH buildings, has been conducted to collect information on
structures and non-structural components being part of 17 critical systems. The structural
Page 12 of 48
https://mc06.manuscriptcentral.com/cjce-pubs
Canadian Journal of Civil Engineering
Page 14
Draft
13
inspection followed the procedure for rapid visual screening of buildings described in
NRC-92 and updated to the more recent seismic provisions of NBCC 2005 (Rainer et al.
1992, Saatcioglu et al. 2013). The non-structural inspection is carried out in accordance
with the parametric procedure described in CSA-S832-14 Seismic risk reduction of
operational and functional components (OFCs) of buildings” (CSA 2014). The results
are expressed by a Seismic Risk Index (SRI) for each building and each OFC.
Collected data were used to generate samples of 76 cases for the structure and 4044 cases
for the OFCs or 224 critical systems. The SRI serves to estimate the seismic vulnerability
as function of each damage factor or in other words, is an indication of potential
structural or non-structural damage that could hinder the global functionality of hospitals
at the urban scale of Montreal Island. This database encompassed the SRI values obtained
for the hospital buildings and OFCs that were inspected.
The two sets of data are statistically analysed to identify their main trends and define four
levels of risk (slight to very high). The definition of risk levels harmonizes the overall
methodology with the damage levels (from slight to complete) considered in fragility
functions or probability of damage (P).
The risk levels and their relative threshold values for the SRI index proposed in Table 3,
have been defined in accordance with CSA-S832-14 and expert judgement within the
range of the calculated SRI values. The normalized rank highlights the high seismic
vulnerability of the last two classes for which mitigation measures or further evaluation
are mandatory.
Page 13 of 48
https://mc06.manuscriptcentral.com/cjce-pubs
Canadian Journal of Civil Engineering
Page 15
Draft
14
SRI indices for the structure were generated from the parametric combinations that could
trigger seismic deficiency, as follows: (i) three groups of buildings according to their
fundamental period (T ≤ 0.2 s; 0.2 s < T ≤ 0.5 s; T > 0.5 s.); (ii) five seismic site classes,
and; (iii) the presence of structural irregularities. The maximum SRI value generated is
63 and represents an irregular structure with a fundamental period of 0.5 s and located on
a site class E (soft soil). The minimum SRI value of 3.0 was found to be larger than the
threshold value for low risk (SRI ≤ 2) as illustrated in Figure 4, a reflect of the age of the
buildings used to build the database (pre-code buildings). The dashed line shows the
threshold of moderate seismic risk level to the structure. The global distribution of SRI
index confirms the importance of structural irregularities and site amplification effects on
the seismic vulnerability.
The SRI for non-structural components is obtained for each OFC from the risk index (R)
defined in CSA-S832-14 as the product of a vulnerability index score (V) and a
consequences index score (C). SRI index values for OFCs were generated by varying the
parameters of building characteristics, site categories and ground motion characteristics,
for a total of 4044 cases. The statistical analysis of these results is summarized in Figure
5 with the dashed line showing the moderate risk level threshold (SRI=64). It is seen that
the first two levels of risk (slight and moderate) are obtained in most cases (88% of the
database), for either all site categories for a 10% in 50 years hazard or site A and B for a
2% in 50 years event. However, the limit of the high risk category was lowered to 86
instead of 128 as recommended by the standard
CSA-S832-14, to highlight the very high risk associated with site category E (or upper
5% extreme values).
Page 14 of 48
https://mc06.manuscriptcentral.com/cjce-pubs
Canadian Journal of Civil Engineering
Page 16
Draft
15
5 DEFINITION OF PROBABIBLITY OF DAMAGE (P) FROM FRAGILITY
DATA ANALYSIS
Fragility curves refer to mathematical functions describing the probability of reaching or
exceeding a given level of damage state (DS) related to a given level of ground shaking
(or ground failure). Equation 4 assumes that seismic demand is represented by the
spectral displacement Sd, a valid assumption for the building structure and displacement-
sensitive OFCs:
[4] P�DS|S� = ϕ � �β��
ln � �����,����
In this equation, ��,� is the median value of the spectral displacement for specified DS,
!� , the standard deviation of the lognormal distribution and " represents the lognormal
cumulative standard normal distribution. Discrete probabilities of damage are used
directly as inputs to induced physical damage into systems of components and the
structural system (NIBS 2003).
Extensive literature covers the development of those parameters from empirical,
analytical or mixed approaches. Among them, the HAZUS methodology proposed
fragility values for ��,� and β#� for a large range of structural building types modelled
as an equivalent single-degree-of-freedom model (ESDOF), acceleration-sensitive and
displacement-sensitive non-structural components (NIBS 2003). HAZUS values are
frequently used to define fragility curves when specific regional data are sparse, as is the
case for Montreal. Although fragility data in HAZUS were developed for buildings in the
Page 15 of 48
https://mc06.manuscriptcentral.com/cjce-pubs
Canadian Journal of Civil Engineering
Page 17
Draft
16
US, hospital building’s structural types and occupancy class are compatible with the
description given in HAZUS. At this stage of the research, the assumption that HAZUS’s
fragility data could be used in the context of Montreal is considered reasonable.
However, authors are aware of this limitation which highlights the need for research and
development of specific fragility data for the Canadian context.
For both structural and non-structural components, fragility values are given in terms of
equivalent peak ground acceleration (PGA) or spectral seismic demand (pseudo-
acceleration Sa or spectral displacement Sd), depending on the damage mode of the
component. This approach is therefore well suited to quantify the post-earthquake
functionality of few specific buildings and a large number of non-structural components.
However, a drawback of using HAZUS fragility values is that the probability of damage
for non-structural components is only defined in terms of total drift of the building (Eq.
4), which is not a correct indicator for components that are sensitive to inter-story drift or
accelerations, or both. More specific fragility information should then be used to better
reflect this type of vulnerability.
The model parameters used to build the ESDOF model of the studied buildings are
extracted from ambient vibration measurements, and period values were found to vary
from 0.16 s to 1.2 s. Seismic demand indicators at an equivalent height, Sa and Sd, are
computed directly from the Uniform Hazard Spectra for Montreal and for both 2% and
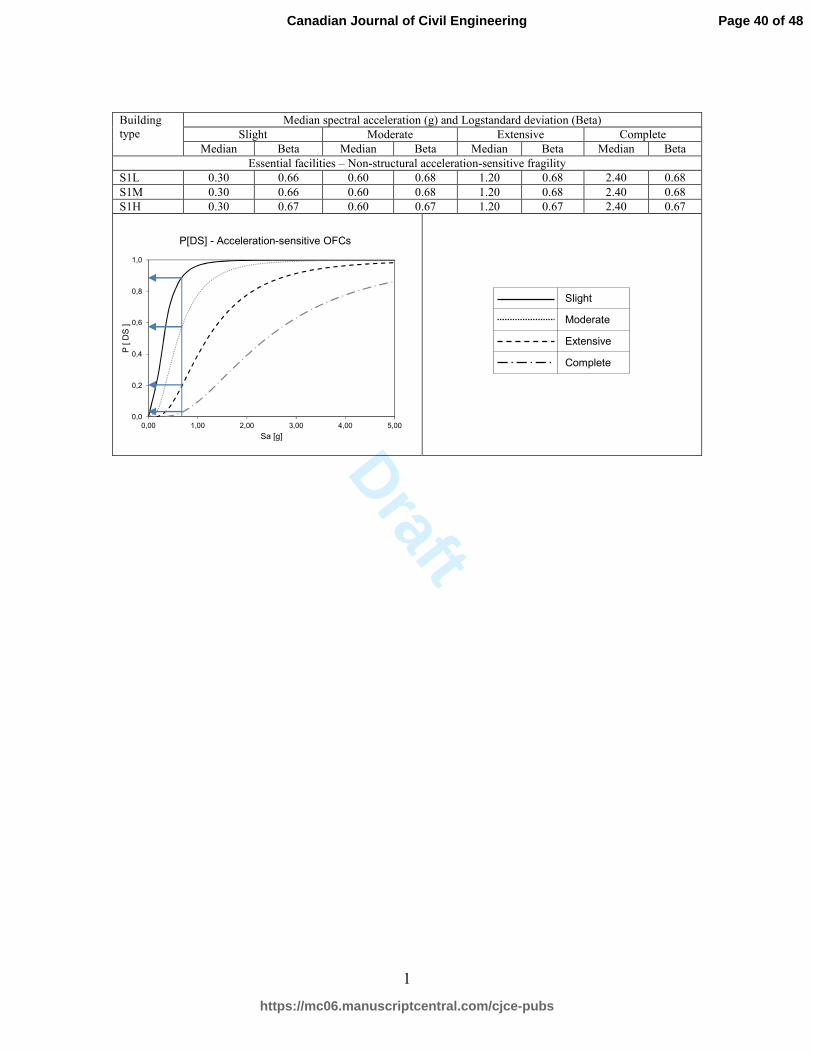
10% in 50 years occurrence. Figures 6 and 7 provide the fragility curves obtained for
both drift and acceleration sensitive OFCs and for four damage states: slight, moderate,
extensive and complete. A similar procedure has been followed for the structure seismic
fragility. Values (median and deviation) from HAZUS take into account: 1) seismic
Page 16 of 48
https://mc06.manuscriptcentral.com/cjce-pubs
Canadian Journal of Civil Engineering
Page 18
Draft
17
design level (Low level), 2) building type (Steel moment frame S1), 3) building height
(Low, Medium, High), 4) facility classification (Essential facilities) and 5) sensitivity
(NIBS 2003). It should be noted that for acceleration-sensitive OFCs, there is no
significant variation in the fragility with the height of the structure (see Figure 7).
As mentioned previously, one specific seismic demand (OFC or building) is related with
four values of P (Figure 7), which will be reflected in the distribution of system PFI
indices. The levels of risk for structural and non-structural SRI defined in the previous
section, as well as the fragility information will be used in the following section to
illustrate the application of the proposed methodology to calculate a PFI index for critical
systems using fault-tree analysis.
6 CASE STUDY
This section presents an overview of the reliability analysis of two critical functional
systems: 1) HVAC (Heating, ventilating, and air conditioning) and 2) life support
including medical gases production, as built at the Montreal General Hospital. The PFI is
obtained for a structure having a fundamental period of 0.5 s, a slight probability of
damage, and a seismic hazard level of 2% in 50 years occurrence. The risk index (PRI) -
Equation 1, is computed for each component at the base of the fault tree (event, EVi)
considering different seismic hazard and site conditions. The upward computation of PFI
is then carried out using Boolean algebra equations 2 and 3, as illustrated on the system
fault trees of Figures 8, 9 and 11 built with Isograph (Isograph Ltd. 2011). In order to
have the complete PFI index distribution for this building, the same procedure has to be
applied to the other damage levels (moderate, extensive and complete).
Page 17 of 48
https://mc06.manuscriptcentral.com/cjce-pubs
Canadian Journal of Civil Engineering
Page 19
Draft
18
6.1 HVAC system
HVAC systems in hospitals are required to achieve a variety of critical functions with
high levels of performance. Examples of such functions include maintaining optimal
levels of air quality, humidity and heat to ensure infection control; special care is needed
for hazardous substances used in medical treatments, which require air exchange,
treatment and complex filtering. HVAC systems are also key to fire detection and space
pressurization with exhaust devices.
Montreal hospital HVAC systems typically include a central heating system and air
conditioning systems and ventilation units according to serviced areas (corridors,
operating room, emergency, magnetic resonance, critical areas, etc.). Moreover, given the
importance of the good performance of the HVAC system to maintain continuous
hospital functionality, it is also connected to emergency power supply sources. The
HVAC system fault-tree includes the following sub-systems (cf. Figure 8):
• The central heating system including OFC unit that is necessary for the production
of heat or steam supplemented in some cases by storage tanks and hot water
reservoirs for domestic needs (sterilization and humidification). The fault tree
identifies two main sub-systems: sub-system 1 - heat and steam production system
(Gate 1, GT1), and sub-system 2 – hot water production (Gate 2, GT2). Under
each gate a lower event (EV1 to EV11) identifies a specific OFC unit.
• The interface system to buildings could be represented by supply pipes (drinkable
water pipes, shut-off valves or check valves, etc.) connected to the main
municipal water supply network. Seismic requirements for shut-off valves or
check valves for supply pipes vary, somehow, from a region to another (FEMA
Page 18 of 48
https://mc06.manuscriptcentral.com/cjce-pubs
Canadian Journal of Civil Engineering
Page 20
Draft
19
2011). Seismic design guidelines for these components, and in particular for
supply pipes containing hazardous materials, lack a strong rational basis due to
the scarcity of research data, as indicated in CSA-S832-14.
• HVAC systems use air conditioning to remove heat from one area and ventilation
to maintain a comfortable environment usually through cooling towers and air-
cooled condensers using a refrigerant (mainly glycol) and evaporative condensers
in some cases integrate with a cooler (see Figure 9). The fault tree of a typical air
conditioning system identifies the top event (TP1) as depending of two main sub-
systems: 1) the chiller system (Gate 1, GT1), 2) the air treatment system (Gate 2,
GT2), 3) the distribution system (Gate 3, GT3), and 4) the water pipe system
(EV1). Under each gate, a lower event (EV2 to EV9) identifies a specific OFC
unit such as chillers, filters, redundant power source, control equipment and
piping systems. The complexity of the control system depends on the
sophistication of the many subsystems to be monitored. Figure 10 shows
examples for domestic water supply and air filter systems.
6.2 Life support system
Figure 11 shows the fault tree of a life support system including systems for in-situ
production of medical gases (GT1), physiotherapy, intensive care and decontamination
equipment (GT2 to GT4). The main distribution network for medical gas is composed of
a set of three sub-systems (including pipe systems) and their control: 1) centrifugal
compressor for medical air production (GT5), 2) vacuum pumps for suction gas
production (GT6), and 3) high pressure portable cylinders (EV1). At the end of the
distribution network or in medical care areas, power modules for medical gases must pass
Page 19 of 48
https://mc06.manuscriptcentral.com/cjce-pubs
Canadian Journal of Civil Engineering
Page 21
Draft
20
stress tests to dynamic and static forces as required by standards; they are not considered
in this analysis.
Single OFCs in subsystems GT2 to GT4 are mainly mobile devices (gas cylinders) that
could pose life safety issues as they can be stored with inadequate restraints. All OFCs at
the base are considered acceleration-sensitive (Figure 7).
7 DEAGGREGATED VALUES OF POST-EARTHQUAKE INDEX
7.1 Extended PFI values at urban Montreal scale
Figures 12 to 14 present PFI values obtained for the four levels of damage considered
(slight, moderate, extensive and complete) as function of : (i) seismic hazard (10% and
2% in 50 years occurrence); (ii) site category (stiff to soft soil, A to E), and; (iii) building
fundamental period T. These figures illustrate the PFI distribution for different buildings
and cumulative damage level, for rapid identification of conditions that hinder hospital
functionality. From this deaggregation analysis, the following observations can be made:
• As expected, structural PFI is directly proportional to the vulnerability of the
building and the probability of damage (PFI=PRI), and structures on soft soils are
the most affected. But while no structural PFI reveals significant risk of complete
damage (Figure 12), OFC systems can experience damage from slight to
complete. This emphasizes the importance of insuring OFC functionality even for
low seismic hazard. Figure 12 is scaled at 1/10 compared to Figures 13 and 14
related to PFI for OFC.
• For both structural and non-structural systems, PFI values show peaks for
buildings on sites C to E; particularly in taller buildings with fundamental period
Page 20 of 48
https://mc06.manuscriptcentral.com/cjce-pubs
Canadian Journal of Civil Engineering
Page 22
Draft
21
higher than 1 s. Mitigation measures are therefore mandatory for these high PFI
values.
• Exclusively comprised of acceleration-sensitive components, the analysis
indicates that the life support system has the highest PFI. In case of a 2% in 50
years earthquake and a low-rise building (itself sensitive to acceleration), the life
support system could present failure for all sites (see figure 14). However, in a
more specific study, PFI values shall be less since acceleration at equivalent roof
level is used in the generic evaluation.
• The proposed methodology can be used in a screening process as the dysfunction
depends jointly on the likely occurrence of an earthquake, the inherent structural
vulnerability and the fragility states considered.
7.2 Interpretation criteria
The probability of damage P (from slight to complete damage) alongside the risk levels
SRI (from slight to very high) are grouped into a risk matrix to develop PFI interpretation
criteria (Figure 15). It is seen that to achieve hospital required levels of performance; the
only acceptable combination is slight damage with slight risk. Obviously, unacceptable
performance will occur when considering a probability of complete damage and a very
high seismic risk. The matrix form facilitates risk interpretation to support decision
making for mitigation action.
More specifically, the performance of the studied systems can be interpreted and as
follows:
• For the HVAC system exposed to a seismic hazard of 2% in 50 years, 95% of
Page 21 of 48
https://mc06.manuscriptcentral.com/cjce-pubs
Canadian Journal of Civil Engineering
Page 23
Draft
22
OFCs have a moderate risk when on site Class A, whereas 75% of OFCs are at
very high risk when on site Class E. The expected performance levels are,
respectively, immediate occupancy and unacceptable performance. For a hazard
level of 10% in 50 years, the PFI values are all less than 0.4 and the PRI indices
are concentrated in areas of low or moderate damage, suggesting an acceptable
level of performance of either complete functionality or immediate occupancy;
• The life support system shows a uniform distribution of high PFIs (close to one)
for a seismic hazard of 2% in 50 years. This could be attributed to the fact that
unrestrained portable components reach high or very high risk level index (SRI).
Post-earthquake functionality will be highly hindered with life safety challenges
posed by such components.
• Finally, the expected performance of critical systems in hospital buildings on
Montreal sites of class D or E will be minimally in the life safety range for a
seismic hazard of 2% in 50 years.
8 CONCLUSIONS
The predictive approach for the assessment of post-earthquake functionality of hospital
systems mainly focuses on modelling and on risk assessment of non-structural
components. To illustrate the approach and assess how component failures propagate
through a system, two case studies of OFC systems were analysed and discussed.
According to the proposed methodology, the risk level is considered in a unified way for
all types of non-structural components and the structure, through indices obtained from
the application of known and largely used seismic evaluation procedures as well as
fragility information. The final post-functionality index (PFI) resulting from the
Page 22 of 48
https://mc06.manuscriptcentral.com/cjce-pubs
Canadian Journal of Civil Engineering
Page 24
Draft
23
procedure takes into consideration interdependencies within the systems and with the
structure, as reflected in fault trees. Data collection on specific components (4044 OFCs)
and buildings (76 units) reduced the uncertainties associated with the computation of the
PFI index. It appears that the proposed methodology gives an accurate picture of the
earthquake survivability of Montreal hospitals and consequently can inform decisions
pertaining to mitigation. However, further research is needed to improve the information
on the probability of damage to operational and functional components of buildings.
9 AKCNOWLEDGEMENT
The financial support provided by the Natural Sciences and Engineering Research
Council of Canada (NSERC) in the form of a Strategic Research Project Grant, and the
Centre d'étude interuniversitaire des structures sous charges extremes (CEISCE) are
gratefully acknowledged. The authors wish to thank the MGH and RDPH hospital
technical Services Division.
NOTATION
DS: Damage state
IS: Structural index according to NRC-92
PFI : Post-earthquake functionality index
PRI : Priority risk index
SRI : Seismic risk index
P : Probability of damage value
V, and C: Vulnerability and Consequence indices according to CSA 2014
�$: Spectral acceleration
��: Spectral displacement
��,� : Median value of the spectral displacement
Page 23 of 48
https://mc06.manuscriptcentral.com/cjce-pubs
Canadian Journal of Civil Engineering
Page 25
Draft
24
Ta: Fundamental period
!� : Standard deviation of the lognormal distribution
": Lognormal cumulative standard normal distribution
Page 24 of 48
https://mc06.manuscriptcentral.com/cjce-pubs
Canadian Journal of Civil Engineering
Page 26
Draft
25
10 REFERENCES
ASSSM. 2014. Vivre une île en santé, Rapport annuel de gestion 2013-2014. Montreal:
Agence de la santé et des services sociaux de Montréal.
CSA. 2014. Seismic risk reduction of operational and functional components (OFCs) of
buildings. Mississauga: CSA Group.
Chong, W.H. and Soong, T.T. 2000. Sliding fragility of unrestrained equipment in critical
facilities. Coll. Technical Report MCEER-00-0005. Buffalo: Multidisciplinary
Center for Earthquake Engineering Research, 103 p.
Davidovici, V. 2007. Conception et réalisation d’hôpitaux en zone sismique.
Dhillon, B.S. 1999. Design reliability fundamentals and applications. Boca Raton, FL:
CRC Press.
EERI. 2009. The Mw 7.6 Western Sumatra earthquake of September 30, 2009. In EERI
Special Earthquake Report - Learning from earthquake. Oakland: Earthquake
Engineering Research Institute.
EERI. 2010. The Mw 8.8 Chile earthquake of February 27, 2010. In EERI Special
Earthquake Report - Learning from earthquake. Oakland: Earthquake Engineering
Research Institute.
Filiatrault, A., Aref, A., Bruneau, M., Constantinou, M., Lee, G., Reinhorn, A., and
Whittaker, A. 2003. MCEER’s Research on The Seismic Response Modification
of Structural and Non-Structural Systems and Components in Hospitals. Coll.
Seismic Retrofit of Acute Care Facilities, 25 p
Gupta, A.K., and Krawinkler, H. 1999. Seismic demands for the performance evaluation
of steel moment resisting frame structures. Edited by Stanford University.
Page 25 of 48
https://mc06.manuscriptcentral.com/cjce-pubs
Canadian Journal of Civil Engineering
Page 27
Draft
26
Stanford, CA: The John A. Blume Earthquake Engineering Center, Department of
Civil and Environmental Engineering, Stanford University.
Hanna, J. A. 1993. Disaster Planning for Health Care Facilities. CMAJ: Canadian
Medical Association Journal no. 148 (2):134.
IRC-CNRC. 2010. Code national du bâtiment. Ottawa: Institut de recherche en
construction, Conseil national de recherches du Canada.
Reliability Workbench 11.0.27.0. Isograph Ltd., California.
Johnson, G.S., Sheppard, R.E., Quilici, M.D., Eder, S.J., and Scawthorn, C.R. 1999.
Seismic Reliability Assessment of Critical Facilities: A Handbook, Supporting
Documentation, and Model Code Provisions. In Technical Report MCEER, edited
by EQE International Inc. Buffalo, NY: Multidisciplinary center for earthquake
engineering research (MCEER).
LeBoeuf, D., and Nollet, M. J. 2006. Microzonage et vulnérabilité sismique de la ville de
québec Ville de Québec, (QC): Université Laval, École de technologie supérieure.
Limnios, N. 1991. Arbres de défaillance, Série Diagnostic et Maintenance. Paris: Hermès.
MIL-STD-1629A. 1980. Procedures for performing a failure mode, effects and criticality
analysis. Washington D.C. : U.S. Department of Defense.
Mitchell, D., Tinawi, R., and Law, T. 1990. Damage caused by the November 25, 1988,
Saguenay earthquake. Canadian Journal of Civil Engineering no. 17 (3):338-365.
Myrtle, R.C., Masri, S.F., Nigbor, R.L., and Caffrey, J.P. 2005. Classification and
prioritization of essential systems in hospitals under extreme events. Earthquake
Spectra no. 21 (3):779-802.
Page 26 of 48
https://mc06.manuscriptcentral.com/cjce-pubs
Canadian Journal of Civil Engineering
Page 28
Draft
27
NCREE. 2010. The ML 6.4 Taiwan Earthquake of March 04, 2010. In Reconnaissance
activities, edited by LFE: National Center for Research on Earthquake
Engineering.
NIBS. 2003. HAZUS-MH MR4: Multi-hazard Loss Estimation Methodology Earthquake
Model Technical manual. Washington, D.C, USA: Federal Emergency
Management Agency, National Institute of Building Sciences, Department of
Homeland Security, Emergency Preparedness and Response Directorate.
Nuti, C., and Vanzi, I. 1997. Seismic safety of Abruzzo hospital system. Paper read at
11th European Conference on Earthquake Engineering at Rotterdam.
Paultre, P., Lefebvre, G., Devic, J.-P., and Côté, G. 1993. Statistical analyses of damages
to buildings in the 1988 Saguenay earthquake. Canadian Journal of Civil
Engineering no. 20 (6):988-998.
Perrow, C. 1984. Normal accidents: Living with High-Risk Technologies: New York
Basic Books.
Porter, K.A., Krishnan, S., and Xu, X. 2006. Analysis of Simultaneous Operational
Failure of Critical Facilities due to Earthquake, for a California Utlity. edited by
California Institute of Technology. Pasadena, California: California Institute of
Techonology.
PWGSC. 1995. Guideline on seismic evaluation and upgrading of non-structural building
components. Public Works and Government Services Canada, Ottawa, Ontario.
Rainer, J.H., Allen, D.E., and Jablonski, A.M. 1992. Manuel de sélection des bâtiments
en vue de leur évaluation sismique. NRCC 36943F. Ottawa: Institut de recherche
en construction - Conseil national de recherches Canada, 90 p.
Page 27 of 48
https://mc06.manuscriptcentral.com/cjce-pubs
Canadian Journal of Civil Engineering
Page 29
Draft
28
Rinaldi, S. M., Peerenboom, J. P., and Kelly, T. K. 2001. Identifying, understanding, and
analyzing critical infrastructure interdependencies. Control Systems, IEEE no. 21
(6):11-25.
Saatcioglu, M., Shooshtari, M., and Foo, S. 2013. Seismic screening of buildings based
on the 2010 National Building Code of Canada. Canadian Journal of Civil
Engineering, vol. 40, no 5, p. 483-498.
Scawthorn, C. 2011. Water supply in regard to Fire Following Earthquake. Berkeley:
Pacific Earthquake Engineering Research Center, Seismic Safety Commission
Shinozuka, M., Chang, S.E., Cheng, T-C., Feng, M., O’Rourke, T. D., Saadeghvaziri,
M.A., Dong, X., Jin, X., Wang, Y., and Shi, P. 2004. Resilience of integrated
power and water systems. In, 65-86. Citeseer.
Soong, T.T., Kao, A.S., and Vender, A. 1999. Non-structural damage database. MCEER-
99-0014. Buffalo, N.Y.: Multidisciplinary Center for Earthquake Engineering
Research (MCEER).
Vesely, N.H., Goldberg, F.F., Roberts, N.H., and Haasl, D.F. 1981. Fault tree handbook.
Washington, DC: Systems and Reliability Resarch, US Nuclear Regulatory
Commission, Office of Nuclear Regulatory Research.
Yavari, S., Chang, S. E., and Elwood, K. J. 2010. Modeling Post-Earthquake
Functionality of Regional Health Care Facilities. Earthquake Spectra no. 26
(3):869.
Page 28 of 48
https://mc06.manuscriptcentral.com/cjce-pubs
Canadian Journal of Civil Engineering
Page 30
Draft
29
LIST OF TABLES
Table 1. Damages to hospital buildings during the Saguenay earthquake.............................. 30
Table 2. Analysis framework for hospital systems ................................................................. 31
Table 3. Risk level definitions ................................................................................................ 32
Page 29 of 48
https://mc06.manuscriptcentral.com/cjce-pubs
Canadian Journal of Civil Engineering
Page 31
Draft
30
Table 1. Damages to hospital buildings during the Saguenay earthquake
Adapted from (Mitchell et al. 1990); Paultre et al. (1993)
Distance from epicentre
and accelerations
Observed damages in hospital buildings
Epicentral region ( Hg = 0,156g Vg = 0,102g)
Minor architectural damages
150 km from epicentre (Hg=0,05g)
Significant non-structural damage to two hospitals in Quebec City due to amplification by alluvial deposits - Major cracking to exterior unreinforced masonry walls parallel to the weaker direction of the building - Collapse of two masonry chimneys - Cracked plaster in lift shafts and corridors - Derailment of an elevator shaft (lack of rigidity of the rails) - Shear failure in the concrete beam supporting the rails of a lift (when restarting the elevator) - Shear failure in MNA walls between the openings - Failure of the heating system radiator - Power outage for two hours (dysfunction of the emergency generator)
Page 30 of 48
https://mc06.manuscriptcentral.com/cjce-pubs
Canadian Journal of Civil Engineering
Page 32
Draft
31
Table 2. Analysis framework for hospital systems
Adapted from Rinaldi et al. (2001) et Limnios (1991)
(Limnios
1991)
(Rinaldi et al. 2001) Proposed framework
Problem Dimensions Elements of
interdependencies
Global objectives Models
What are the failure modes of system components?
Type of failure Common cause, cascading Analyze the nature of the disturbance and the vulnerability and fragility of system components
In situ conditions or seismic vulnerability and Probabilistic model or fragility functions
State of operation Normal, repair/restoration, stressed/disrupted
How does the system fail?
Types of interdependencies
Geographic, logical, cyber, physical
Define interdependencies between systems and degree of coupling
Algebraic model: Boolean operators .AND., .OR. (Fault tree analysis)
Coupling and response behavior
Adaptive, inflexible, loose/tight, linear/complex
How likely the system would be dysfunctional?
Environment Social/political, technical, legal/regulatory, economic, health/safety, public/policy, business
Identify the infrastructure (or system) and its exposure to danger.
System representation models (FTA)
Infrastructure characteristics
Organisational, operational, temporal, spatial
Page 31 of 48
https://mc06.manuscriptcentral.com/cjce-pubs
Canadian Journal of Civil Engineering
Page 33
Draft
32
Table 3. Risk level definitions
Level of
risk
Normalized
rank
Structural SRI OFC SRI
Threshold Reference for risk level
threshold
Threshold Reference for risk level
threshold
Slight 0.1 SRI ≤ 2 (LeBoeuf and Nollet 2006)
SRI ≤ 16 CSA-S832-14
Moderate 0.3 2 < SRI ≤ 10 16 < SRI ≤ 64
High 0.5 10 < SRI ≤ 20 Range for structures with any geometric irregularities except site E
64 < SRI ≤ 86 Observations that are not outliers (upper whisker or 95th percentile)
Very high 1.0 SRI > 20 Small buildings with irregularities (all sites) All buildings Sites D and E
SRI > 86 Extreme values (outliers) corresponding to range for Sites D and E
Page 32 of 48
https://mc06.manuscriptcentral.com/cjce-pubs
Canadian Journal of Civil Engineering
Page 34
Draft
33
LIST OF FIGURES
Figure 1. Hospital functional components
Figure 2. Distribution of 31 hospitals facilities on the Island of Montreal
Figure 3. Main distribution plan for case-study hospitals: a) MGH and b) RDPH
Figure 4. Distribution of structural SRI values
Figure 5. Distribution of non-structural SRI values
Figure 6. Fragility curves for drift-sensitive OFCs for special buildings with different height, low (L), medium (M), and high (H)
Figure 7. Fragility curves for acceleration-sensitive OFCs for special buildings
Figure 8. Heating system fault tree
Figure 9. Air conditioning system fault tree
Figure 10. Example of a) domestic supply water system and b) air filter system
Figure 11. Life support system fault tree
Figure 12. Deaggregated PFI for the structure (PFI=PRI)
Figure 13. Deaggregated PFI for HVAC system
Figure 14. Deaggregated PFI for life support system
Figure 15. Risk matrix for PFI interpretation
Page 33 of 48
https://mc06.manuscriptcentral.com/cjce-pubs
Canadian Journal of Civil Engineering
Page 35
Draft
1
Functional
Hospital
Structural system and components
Operational and functionalcomponents
Architectural systems
interior and exterior
Technical components
mechanical,piping system,electrical,
telecommunication
Content/
Equipment
general and specialized
Lifelines and interfaces
Internal lifelines
External lifelines
Hospital
Personnel
Page 34 of 48
https://mc06.manuscriptcentral.com/cjce-pubs
Canadian Journal of Civil Engineering
Page 36
Draft
1
Page 35 of 48
https://mc06.manuscriptcentral.com/cjce-pubs
Canadian Journal of Civil Engineering
Page 37
Draft
1
Page 36 of 48
https://mc06.manuscriptcentral.com/cjce-pubs
Canadian Journal of Civil Engineering
Page 38
Draft
1
Summary statistics
Count 76
Average 18.4
Standard deviation 15.0
Coefficient of variation 82 %
Minimum 3.0
Maximum 63
Range 60
0 20 40 60 80
Col_1Gamme de valeurs de l’échantillonRange of structural SRI
0
10
20
30
40
50
60
70
0 1 2 3 4 5 6
Structural SRI indices
Ta ≤ 0.2
Ta = 0.5
1 ≤ Ta
Ta≤ 0.2
1 ≤ Ta
Ta≤ 0.2
Ta = 0.5
Regular structures
Irregular structures
Site A Site B Site C Site D Site E
Page 37 of 48
https://mc06.manuscriptcentral.com/cjce-pubs
Canadian Journal of Civil Engineering
Page 39
Draft
1
Summary statistics
Count 4044
Average 31.6
Standard deviation 28.9
Coefficient of variation 91.3%
Minimum 0.4
Maximum 222
Range 222
0 40 80 120 160 200 240
Col_1Range of nonstructural SRI
A.VA - T inf à 0,2s
A.VE - T inf à 0,2s
A.VA - T entre 0,2s et 0,5s
A.VE - T entre 0,2s et 0,5s
A.VA - T sup à 0,5s
A.VE - T sup à 0,5s
0 10 20 30 40 50
response
Site A
Site E
Site A
Site E
Site A
Site E
T≤ 0,2s
0,2<T≤ 0,5s
T> 0,5s
Range of nonstructural SRI – 10% in 50 years
B.VA - T inf à 0,2s
B.VE - T inf à 0,2s
B.VA - T entre 0,2s et 0,5s
B.VE - T entre 0,2s et 0,5s
B.VA - T sup à 0,5s
B.VE - T sup à 0,5s
0 30 60 90 120 150
Site A
Site E
Site A
Site E
Site A
Site E
T≤ 0,2s
0,2<T≤ 0,5s
T> 0,5s
Range of nonstructural SRI - 2% in 50 years
Page 38 of 48
https://mc06.manuscriptcentral.com/cjce-pubs
Canadian Journal of Civil Engineering
Page 40
Draft
1
Building
type
Median spectral displacement (cm) and Logstandard deviation (Beta)
Slight Moderate Extensive Complete
Median Beta Median Beta Median Beta Median Beta
Essential facilities – Non-structural drift-sensitive fragility
S1L 0.34 0.81 0.68 0.80 2.12 0.80 4.25 0.94
S1M 0.85 0.73 1.70 0.76 5.30 0.86 10.62 0.98
S1H 1.77 0.71 3.54 0.74 11.05 0.87 22.11 0.98
P[DS] - Drift-sensitive OFCs – S1L
P[DS] - Drift-sensitive OFCs – S1M
P[DS] - Drift-sensitive OFCs – S1H
0,0
0,2
0,4
0,6
0,8
1,0
0,00 1,00 2,00 3,00 4,00 5,00
P [ DS ]
Sd [po]0,0 2,5 5,0 7,5 10,0 12,5
Sd [cm]
Slight
Moderate
Extensive
Complete
0,0
0,2
0,4
0,6
0,8
1,0
0,00 1,00 2,00 3,00 4,00 5,00
P [ DS ]
Sd [po]0,0 2,5 5,0 7,5 10,0 12,5
Sd [cm]
0,0
0,2
0,4
0,6
0,8
1,0
0,00 1,00 2,00 3,00 4,00 5,00
P [ DS ]
Sd [po]0,0 2,5 5,0 7,5 10,0 12,5
Sd [cm]
Page 39 of 48
https://mc06.manuscriptcentral.com/cjce-pubs
Canadian Journal of Civil Engineering
Page 41
Draft
1
Building
type
Median spectral acceleration (g) and Logstandard deviation (Beta)
Slight Moderate Extensive Complete
Median Beta Median Beta Median Beta Median Beta
Essential facilities – Non-structural acceleration-sensitive fragility
S1L 0.30 0.66 0.60 0.68 1.20 0.68 2.40 0.68
S1M 0.30 0.66 0.60 0.68 1.20 0.68 2.40 0.68
S1H 0.30 0.67 0.60 0.67 1.20 0.67 2.40 0.67
P[DS] - Acceleration-sensitive OFCs
0,0
0,2
0,4
0,6
0,8
1,0
0,00 1,00 2,00 3,00 4,00 5,00
P [ DS ]
Sa [g]
Slight
Moderate
Extensive
Complete
Page 40 of 48
https://mc06.manuscriptcentral.com/cjce-pubs
Canadian Journal of Civil Engineering
Page 42
Draft
1
Page 41 of 48
https://mc06.manuscriptcentral.com/cjce-pubs
Canadian Journal of Civil Engineering
Page 43
Draft
1
Page 42 of 48
https://mc06.manuscriptcentral.com/cjce-pubs
Canadian Journal of Civil Engineering
Page 44
Draft
1
Page 43 of 48
https://mc06.manuscriptcentral.com/cjce-pubs
Canadian Journal of Civil Engineering
Page 45
Draft
1
Page 44 of 48
https://mc06.manuscriptcentral.com/cjce-pubs
Canadian Journal of Civil Engineering
Page 46
Draft
1
(a)
(b)
(c)
(d)
Page 45 of 48
https://mc06.manuscriptcentral.com/cjce-pubs
Canadian Journal of Civil Engineering
Page 47
Draft
1
(a)
(b)
(c)
(d)
Page 46 of 48
https://mc06.manuscriptcentral.com/cjce-pubs
Canadian Journal of Civil Engineering
Page 48
Draft
1
(a)
(b)
(c)
(d)
Page 47 of 48
https://mc06.manuscriptcentral.com/cjce-pubs
Canadian Journal of Civil Engineering
Page 49
Draft
1
Complete
Extensive
Moderate
Slight
Slight Moderate High Very high
Level of risk (SRI)
Probability of damage (P)
Unacceptable performance
Life safety
Immediate occupancy
Full
functionality
Page 48 of 48
https://mc06.manuscriptcentral.com/cjce-pubs
Canadian Journal of Civil Engineering