Page 1
Draft
An empirical method for predicting post-construction
settlement of concrete face rockfill dams
Journal: Canadian Geotechnical Journal
Manuscript ID cgj-2016-0193.R1
Manuscript Type: Article
Date Submitted by the Author: 22-Sep-2016
Complete List of Authors: Kermani, Mohammad; Université Laval, Civil and Water Engineering Konrad, Jean-Marie; Université Laval, Smith, Marc; Hydro-Quebec,
Keyword: CFRD, rockfill, time-dependent, settlement prediction, empirical
https://mc06.manuscriptcentral.com/cgj-pubs
Canadian Geotechnical Journal
Page 2
Draft
1
An empirical method for predicting post-construction settlement of concrete
face rockfill dams
Mohammad Kermani1, Jean-Marie Konrad
2, Marc Smith
3
1. Laval University; 1065, avenue de la Médecine, Pavillon Adrien-Pouliot, local 2913
Université Laval, Québec (Québec), G1V 0A6, CANADA;
Email: [email protected]
Telephone: +1 (514) 224 4525
(Corresponding author)
2. Laval University; 1065, avenue de la Médecine, Pavillon Adrien-Pouliot, local 2912-B
Université Laval, Québec (Québec), G1V 0A6, CANADA;
Email: [email protected]
3. Hydro-Quebecc; 75 René-Lévesque Blvd. West, Montréal, Québec H2Z 1A4
Email: [email protected]
Page 1 of 42
https://mc06.manuscriptcentral.com/cgj-pubs
Canadian Geotechnical Journal
Page 3
Draft
2
Abstract:
In this study, employing a database of 19 concrete face rockfill dam (CFRD) cases, two prediction
methods for post-construction settlement of CFRDs are presented. In the first method, post-construction
settlements are estimated using height of the embankment. In the second method, characterization of the
stress-strain behavior of the compacted rockfill layers during construction allows prediction of the
subsequent stress-strain-time behavior of the embankment. Knowledge of rock particles strength is
necessary in both methods. In the presented methods, settlements are estimated separately for each of the
three life-cycle phases: before, during and after impoundment. The presented results show that, in
addition to addressing some limitations of previous methods, the proposed approach is precise and highly
practical. It also allows a better understanding of rockfill deformation mechanisms. Apart from using this
method for predictive purposes, the presented graphs can be used to distinguish unexpected settlement
behavior of a CFRD during its post-construction lifespan.
Keywords: CFRD, rockfill, time-dependent, post-construction, settlement, prediction.
Résumé:
Dans cette étude, à partir d’une base de données de 19 barrages en enrochement avec un masque amont en
béton (CFRD), deux méthodes de prédiction de tassement post-construction de CFRDs sont présentés.
Dans la première méthode, les tassements post-construction sont estimés en fonction de la hauteur du
remblai. Dans la deuxième méthode, le comportement contrainte-déformation de l’enrochement des
remblais lors de la construction permet de prédire le comportement contrainte-déformation-temps
subséquent du barrage. La connaissance de la résistance des particules rocheuses est nécessaire avec les
deux méthodes. Pour ces deux méthodes, les tassements en crête sont estimées séparément pour chacune
des trois phases du cycle de vie d'un barrage: avant, pendant et après la mise en eau du réservoir. Les
résultats présentés montrent qu’en plus de surmonter les difficultés reliées aux méthodes actuelles, les
approches proposées sont précises et très pratiques. Elles permettent, également, une meilleure
Page 2 of 42
https://mc06.manuscriptcentral.com/cgj-pubs
Canadian Geotechnical Journal
Page 4
Draft
3
compréhension des mécanismes de déformation de l’enrochement. En plus de servir d'outil prédictif des
tassements, les relations présentées peuvent être utilisées afin de détecter un comportement atypique d'un
CFRD au cours de sa durée de vie.
Page 3 of 42
https://mc06.manuscriptcentral.com/cgj-pubs
Canadian Geotechnical Journal
Page 5
Draft
4
Introduction
The origin of rockfill dams can be traced back to the mining region of California Sierras, in the 1850s.
Rockfill dams were of the impervious face type, constructed by dumped rockfill, until earth core dams
began to be developed in about 1940. The period from 1850 to 1940 is called the early period by Cooke
(1984). The dumped (in 18 m - 60 m lifts) concrete face rockfill dams (CFRD) performed safely, but the
leakage problem became more serious as dams became higher, due to high compressibility of dumped
rockfill. During the years 1940 to 1970 (called transition period by Cooke 1984) earth core rockfill dams
became more popular due to higher flexibility of earth materials, and consequently more compatibility
with dumped rockfill. Additionally, mostly during the period 1955-1965, a transition developed to the use
of sluiced rockfill in thinner layers of 3-3.6 m subsequently compacted by construction truck and dozer
traffic. The period after 1970, when compacted and sluiced rockfill was used in construction of rockfill
dams of both concrete face and earth core type is called the modern period (ICOLD 2010). This study
addresses the post-construction behavior of CFRDs constructed during the modern period.
CFRDs are widely used because of their cost-effectiveness and the similarity of their constituent
materials. Like other types of rockfill embankments, CFRDs are not highly prone to instability. However,
attention must be paid to their settlement as excessive displacement may cause cracking of the concrete
face, which can result in severe leakage. Some examples of modern CFRDs constructed in the 21st
century which suffered severe leakage are Campos Novos and Barra Grande dams in Brazil, and the
Mohale dam in Lesotho (Marulanda 2013).
Rockfill consists of rock particles having a large diameter (average size of at least 5 centimeters and
maximum size of up to 2 meters) with a variety of particle sizes, shapes and minerals. As a consequence,
full scale experimental study of rockfill material is almost impossible. Scale effects are shown to
influence the representativeness of the results of laboratory experiments on rockfill (Marachi et al. 1969;
Marsal 1973; Ramon et al. 2008; Alonso et al. 2012). Also, limited laboratory samples are not perfect
Page 4 of 42
https://mc06.manuscriptcentral.com/cgj-pubs
Canadian Geotechnical Journal
Page 6
Draft
5
representations of in-situ conditions considering the variety of materials used in different zones or even in
a single zone of a dam. When studying long-term deformations, load application periods are also limited
in the laboratory compared to reality. Moreover, no laboratory experiment can apply the same stress path
to the sample as in the field.
Numerical models must be calibrated using laboratory experiments, which are prone to the above-
mentioned uncertainties. Also, there are uncertainties about using concepts from classical soil mechanics
to evaluate the strength and deformation behavior of rockfill. Accordingly, so far, the design of rockfill
dams has been mostly based on engineering judgment and experience.
There are several studies in the literature in which settlements of different typical rockfill embankments,
including CFRDs, are compared in order to find a settlement prediction method. These studies are
categorized into two groups. The first category consists in studies in which an implicit equation is
suggested to calculate dam crest settlement. These equations are mainly of three types: logarithmic strain
versus time (Sowers et al. 1965), power type (Soydemir and Kjaernsli 1979), or strain rate versus time
(Parkin 1977) relationships.
The second category includes more recent studies, which suggest a qualitative judgment procedure to
predict settlements. For instance, Clements (1984), conducting a study on post construction crest
deformations of 68 rockfill dams, suggested predicting the crest settlements by comparing the dam with
previously monitored dams with similar characteristics. The major drawback of this approach is that there
are many influencing factors which can lead to a high degree of subjectivity. Milligan and Coyne (2005)
prepared a database of 95 rockfill dams, with which they questioned the statements of previous
researchers who claimed that rockfill dams settle a maximum 0.02% of their height per year after three
years from the end of construction. They also concluded that because of the considerable amount of
variables involved, it is unreliable to use the empirical formulas to predict deformations.
One of the most comprehensive and practical studies on post-construction settlement of CFRDs was
Page 5 of 42
https://mc06.manuscriptcentral.com/cgj-pubs
Canadian Geotechnical Journal
Page 7
Draft
6
carried out by Hunter and Fell (2002). They suggested some empirical methods to predict the rockfill
modulus during construction, crest settlement due to impoundment and the rate of time-dependent crest
settlement. They divided the post-construction deformations into two parts: time dependent crest
settlements and crest settlement under stresses from first filling. For the post-construction settlements,
they suggested that the time datum begin at the end of main rockfill zone construction. The crest
settlement attributed to first filling takes place from the beginning of impoundment to a limited time after
the end of impoundment. The two components are shown in Fig. 1 for the Bastyan rockfill dam. Hunter
and Fell (2002) suggested that the rate of long-term crest settlement, α, as well as the crest settlement
attributed to first filling can be estimated considering dam height, the rockfill placement method and the
unconfined compressive strength (UCS) of rockfill materials.
In this study, first, the empirical method for prediction of the post-construction settlements of concrete
face rockfill dams (CFRDs) by (Hunter and Fell 2002) is modified by changing the time datum for the
settlements after impoundment and considering different relative crest settlement rates for the periods
before and after impoundment. Also, using a data base of 19 CFRD cases, a novel prediction method is
presented using behavior of the embankment during construction. Then, comparing the relative settlement
rates before and after impoundment, some aspects of long-term mechanical behavior of compacted
rockfill material are put into perspective. Finally, an example application of the prediction methods is
presented.
Post-construction crest settlement prediction methods
In the method presented here, it is assumed that the post-construction deformations take place in three
phases: 1) time-dependent deformations after construction and before impoundment; 2) deformations
during impoundment; and 3) time-dependent deformations after impoundment (Fig. 2.a). The settlements
attributed to each phase are calculated separately.
For the time-dependent deformations after construction and before impoundment, the time datum is the
Page 6 of 42
https://mc06.manuscriptcentral.com/cgj-pubs
Canadian Geotechnical Journal
Page 8
Draft
7
end of construction. However, for the long-term crest settlements after impoundment, the time datum is
the end of impoundment. This has two major advantages.
First, since the stresses inside the dam body change during the impoundment period and stay almost
constant after the end of impoundment, it is reasonable that the time datum for the time-dependent
deformations be the end of impoundment. Therefore, the settlement rate values (α2 in Fig. 2.b) are more
representative values, when comparing to α values in Fig. 1. This is the same concept as setting the time
to zero for every load increment within an oedometer test.
Second, as it is shown in Fig. 2.a for Bastyan dam and observed in almost all of the case studies, it takes
almost one year after the impoundment for the settlement data points to fall onto a line in semi-log scale.
In the method presented by Hunter and Fell (2002), it is assumed that deformations that take place from
the beginning of impoundment to the end of this time lag attribute to the effect of first filling. Also, no
indication was given how the length of this delay can be calculated. Because of the nature of graphs
drawn by logarithmic scale, this delay changes the crest settlement calculations significantly. Therefore,
making settlement predictions using the method presented by Hunter and Fell (2002) is complicated.
On the contrary, in this study, by changing the time datum, the data points after the impoundment will lie
onto a line in semi-log scale almost right after the end of impoundment (Fig. 2.b). Therefore, if the time
datum is set to the time after which stresses remain almost constant in the embankment, i.e. end of
impoundment, the settlement of the crest will fall onto a line in semi-log graph. This is in-line with the
generally observed behavior of rockfill materials, which show logarithmic creep deformations with time
(e.g., Sowers et al. 1965; Marsal 1973; Clements 1981; Alonso et al. 2005). It also allows using this
approach to predict the post-construction deformations.
Page 7 of 42
https://mc06.manuscriptcentral.com/cgj-pubs
Canadian Geotechnical Journal
Page 9
Draft
8
In order to develop a prediction method, for the two time-dependent phases, the crest settlement rates per
height of embankment (relative crest settlement rates, α1 and α2 in Fig. 2.a and Fig. 2.b, respectively), and
for the reservoir filling phase the maximum crest settlement attributed to impoundment per height of the
embankment (relative crest settlement attributed to impoundment, Simp in Fig. 2.a) are considered. The
crest settlements, as well as dam heights, were normally measured at cross sectional locations with
maximum height for each case. For all the three phases, the crest settlement is shown to be predictable,
knowing unconfined compressive strength of intact rock and one of the following: dam height, or the
rockfill mechanical behavior during construction. To take strength of rockfill particles into account, the
data are presented separately for the dams constructed of high strength rockfill zones, or, of very high
strength rockfill zones as classified by the Australian code (Table 1). This means that the rockfill used in
the construction of the dam has been extracted from quarries, where the intact rock has been characterized
to have the average strength classified as high or very high strength within Table 1.
In this study, no case with dumped rockfill was studied because of the lack of quality and quantity of data
in such cases, and the point that the mechanical behavior of dumped rockfill is considered to differ
entirely form compacted rockfill. Therefore, here, the placement method is not directly considered as an
influencing factor. Also, since the rockfill used in all of the studied cases is of quarried origin, the
influence of shape of particles could not be studied.
The database used in this study is mostly adapted from Hunter and Fell (2002), but also from (Kermani
2016). Nevertheless, the cases with high quality data on post-construction deformations as well as
behavior during construction are chosen. Table 2 presents a summary of properties of embankments as
well as the rockfill used in case studies. The CRFD cases constructed of very high strength rockfill
materials (above) are separated with a line from the cases of high strength rockfill (below).
Page 8 of 42
https://mc06.manuscriptcentral.com/cgj-pubs
Canadian Geotechnical Journal
Page 10
Draft
9
A typical cross section of a modern CFRD is shown in Fig. 3. The main rockfill zones are Zones 3B and
3C. Usually, rockfill is coarser and is placed in thicker layers in zone 3C compared to zone 3B (layer
thickness and maximum rock diameter are usually limited to 1 m for Zone 3B, and 2 m for Zone 3C). The
central variable zone in this figure shows variations in the size of these two zones in design practice
around the world. Zones 1A and 1B are earthfill zones, and Zones 2B and 3A support the concrete face
slab. The data presented in Table 2 mostly associate with rockfill placed in zone 3B and also in Zone 3C.
Post-construction crest settlement prediction method using dam height and rock strength
In the following, the three phases of post-construction settlement are compared with dam height for
different rock strength categories. The adopted concept is the same as Hunter and Fell (2002); however,
here, the time datum for the third phase is moved to the end of impoundment and different rates are
considered for the relative crest settlements before and after impoundment. Additionally, the crest
settlement attributed to first filling is considered to finish by the end of impoundment period. These
changes yield more consistent results and facilitate the application of the prediction method.
Crest settlement rate before beginning of impoundment vs. dam height
Fig. 4 presents relative crest settlement rates after the end of construction and before start of
impoundment versus corresponding dam heights. Despite the lack of data for dams of high strength
rockfill, the graph shows an increase in the relative crest settlement rate with height. The effect of dam
height on the relative crest settlement rates in this phase is associated with the fact that the rate of creep
deformation of rockfill material is a function of stress level.
Extrapolating from the trendlines drawn in Fig. 4, the settlement rate is negligible for dams with heights
of less than around 25 m to 40 m for high strength and very high strength rockfills, respectively. In other
words, at stress levels smaller than certain values rockfill time-dependent deformations are not
significant. This is consistent with the observations in laboratory oedometer and isotropic loading
Page 9 of 42
https://mc06.manuscriptcentral.com/cgj-pubs
Canadian Geotechnical Journal
Page 11
Draft
10
experiments on granular materials that indicate a threshold stress for stresses lower than which, creep
strains are negligible (Marsal 1973; Clements 1981; Colliat-Dangus et al. 1988; Oldecop and Alonso
2007).
Crest settlement attributed to impoundment vs. dam height
In CFRDs, the deformations during the impoundment period are associated with an increase in stresses
inside the dam body due to the reservoir load on the upstream surface. Simple finite element modelling
(further explained in Fig. 12) shows that during impoundment of CFRDs, both mean and deviatoric
stresses increase on the upstream side of the dam body. However, mean stress increases more
significantly and consequently, the shear stress ratio decreases. Therefore, the settlement of the crest in
this phase is considered to occur mostly due to increase in the mean stress.
In addition to the stress level increase, collapse due to wetting might also contribute to the settlements
during impoundment. Wetting collapse occurs in rockfill structures due to the strength loss caused by
increasing the amount of water in contact with rock particles. The rockfill moisture content might increase
due to malfunctions of the concrete face, high downstream water level or penetration of water to
downstream rockfill due to excessive precipitations. However, the effect of rockfill wetting collapse is not
studied in details in this paper.
In this study, in order to obtain the deformations due only to stress increases caused by reservoir loading,
the time-dependent component of settlements was subtracted from the total settlements during
impoundment. To do so, the rate of time-dependent settlement during impoundment period (2nd
phase in
Fig. 2.a) was assumed to be the same as that in the period before impoundment (1st phase in Fig. 2.a); i.e.,
�1.
The relative crest settlements attributed to impoundment values, Simp, are plotted against dam height for
the studied CFRDs in Fig. 5. It can be seen that the relative dam crest settlement due to impoundment
Page 10 of 42
https://mc06.manuscriptcentral.com/cgj-pubs
Canadian Geotechnical Journal
Page 12
Draft
11
generally increases with embankment height. The linear trend lines can be used as a guide for a predictive
purpose.
The Toulnustouc main dam does not follow the general trend in Fig. 5. Although the relative settlement
rates before impoundment (see Fig. 4) and those after impoundment (presented in next section, Fig. 7) are
in the expected range, the relative crest settlement due to impoundment is much higher than other similar
cases. This unusual behavior can be attributed to the fact that according to Fig. 6, the impoundment of the
dam took place mostly in February 2005, but the reservoir reached its maximum level during the
snowmelt season, mid-April to mid-June 2005. Although the reservoir level increased much less during
the snowmelt season comparing to the previous months (20 m vs. 50 m), the crest settled much more
during this period. The reason might be that since the main rockfill zone of the dam was compacted
without watering, the effects of snowmelt, along with the subsequent precipitations increased the wetting
collapse in the downstream rockfill zones during the impoundment period.
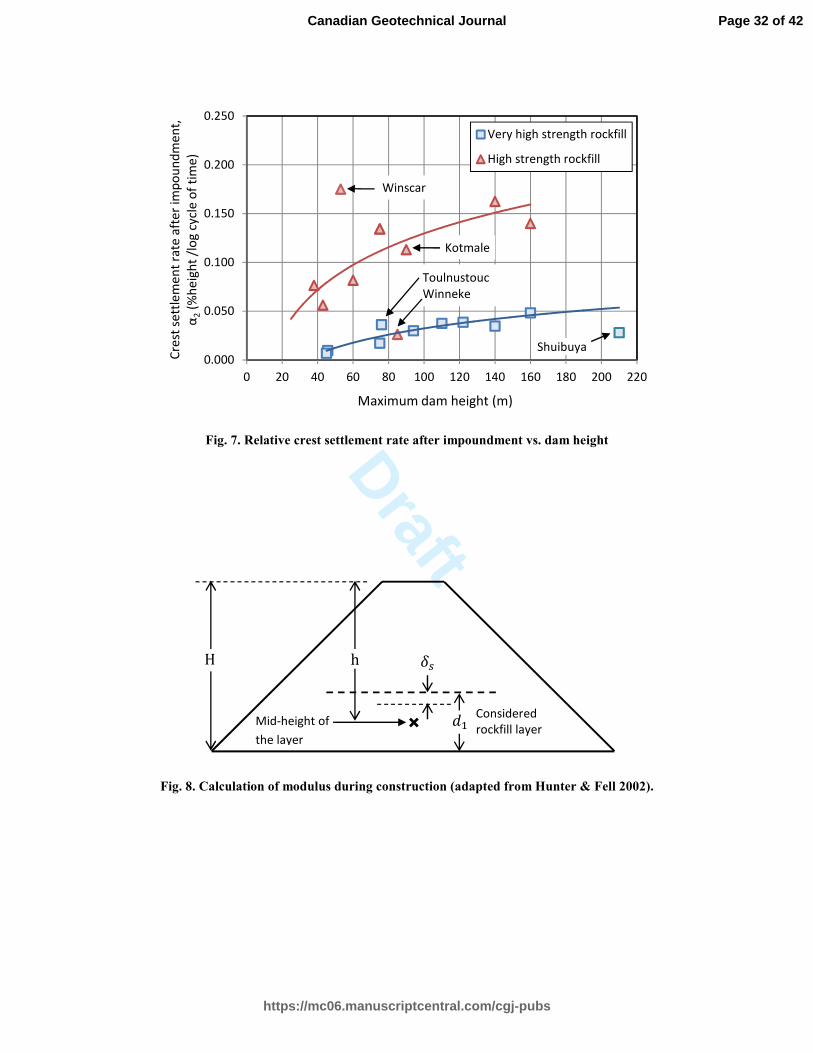
Crest settlement rates after impoundment vs. dam height
Relative crest settlement rates after impoundment (α2) are drawn versus the embankment heights in Fig. 7.
For the dams of very high strength rockfill zones, the relative crest settlement rate increases slightly with
dam height and is almost similar for all of the cases. The value is less than 0.05 for all of the studied
dams. This means that for a 100m high dam, the crest settlement attributed to time-dependent
deformations after impoundment is less than 14cm in 50 years of operation.
In the CFRDs constructed of high strength rockfill, there is a clear tendency of increasing relative long-
term crest settlement rates with dam height. Although Fig. 7 generally correlates with the findings of
Hunter and Fell (2002), when comparing the data with an adjusted time datum with the same data
presented by Hunter and Fell (2002), more consistent values are obtainable for Kotmale and Winneke
dams. Yet, for Winneke, the impoundment began 1.6 years after end of rockfill construction and took 3.8
years to end. Consequently, a large amount of time-dependent deformation had already taken place before
Page 11 of 42
https://mc06.manuscriptcentral.com/cgj-pubs
Canadian Geotechnical Journal
Page 13
Draft
12
and during the impoundment. Therefore, the rate of settlements relative to dam height is lower than
expected for this dam. Additionally, since at the Mangrove Creek dam, the impoundment was still
ongoing at the end of studied period, i.e. 15 years after end of construction, this dam does not yield any
data point in this figure.
Similar to the data presented for post-construction settlements before impoundment, the dependence of
relative settlement rates after impoundment on embankment heights tends to decrease with dam height. In
other words, the evolution of relative settlement rates with dam height is nonlinear. It is also worth noting
that, Shuibuya and Winscar dams fall off the general trend in this figure.
Despite the similarity of the general trend of relative settlement rate versus dam height curves before and
after impoundment, the relative settlement rate values before impoundment are generally smaller
comparing to those after impoundment. This aspect will be further examined in this paper.
Post-construction crest settlement prediction method using rockfill modulus and rock strength
The previously presented method has the following limitations:
- The embankment height does not perfectly represent the dam’s geometry. Embankment slopes and
valley shape are also influencing factors.
- Unconfined compressive strength of intact rock is not the only material parameter which affects the
post-construction settlement of CFRDs. In order to reach a more reliable prediction method, a parameter
shall be defined which also takes into account the shape and gradation of particles and the compaction
method.
Therefore, a novel approach is introduced here, in which the post-construction settlements are determined
using the dam’s deformation behavior during construction. This method is adapted from the well-known
concept that the secondary compression index Cα and compression index Cc are related for different types
of earth materials. In other words, the time-dependent mechanical behavior of a material in constant stress
Page 12 of 42
https://mc06.manuscriptcentral.com/cgj-pubs
Canadian Geotechnical Journal
Page 14
Draft
13
can be estimated through its behavior during loading. The material can be a fine-grained soil (Mesri and
Godlewski 1977), sand (Mesri and Vardhanabhuti 2009) or rockfill (Oldecop and Alonso 2007; Cormier
and Konrad 2015). In the case of rockfill dams, secondary compression index corresponds to post-
construction settlement behavior and compression index corresponds to the rockfill construction period.
In this study, the secant modulus of the main rockfill zone at the end of construction (equation (1) and
Fig. 8) is used to illustrate the behavior during construction. The rockfill secant modulus, for a certain
rockfill layer, at end of construction can be defined by dividing the calculated vertical stresses by the
strains inferred from readings of settlement gauges:
��� =��
/� (1)
where, as shown in Fig. 8, � is thickness of the considered layer, � is the unit weight of the above fill
layers, and, is the vertical displacement of the considered layer. In order to calculate the moduli, the
stress at the mid-height of the layer �� is considered in this paper and is calculated using a simple linear
elastic numerical analysis. In this way, the effect of embankment shape on vertical stress is taken into
account. Other than Shuibuya, Tianshengqiao and Winscar dams for which the moduli are calculated by
the authors, in this section, the values of modulus during construction, ERC, are taken from Hunter and
Fell (2002). These values are calculated for the lower half to one third of the dam height. Note that, this
modulus calculation method differs from that of Fitzpatrick et al. (1985), Pinto and Marques Filho (1998),
and Giudici et al. (2000), in the sense that first, here, the shape of embankment is considered; i.e. the
vertical stress is not simply taken as the multiplication of fill height to fill density. Secondly, in order to
determine the modulus, the vertical stress is calculated in this paper for the mid-height, instead of the top,
of layer. The calculated stress at mid-height is supposed to yield the average vertical stress of layer. An
example of modulus calculation is presented later in this paper.
Page 13 of 42
https://mc06.manuscriptcentral.com/cgj-pubs
Canadian Geotechnical Journal
Page 15
Draft
14
Crest settlement rate before beginning of impoundment vs. rockfill secant modulus
The relative crest settlement rates before impoundment are shown versus rockfill secant modulus at end
of construction in Fig. 9. For the dams where the main rockfill zone is constructed of very high strength
rockfill, there is a slight decrease in the relative crest settlement rate, α1, with secant modulus at the end of
construction. For the dams where the main rockfill zone is constructed of high strength rockfill, the
relative crest settlement rate decreases more clearly with rockfill secant modulus. In other words, the
stiffer the rockfill layers are during construction, the less settlement they undergo in the post-construction
period. A power law curve is fitted to the curve in order to allow its use for predictive purposes.
The Mackintosh dam, which was considered as an outlier in Fig. 4 falls inside the generally expected
trend in Fig. 9. This shows the reliability of this predictive approach. Since the in-situ behavior of the
same structure is being used for prediction, it reduces the shortcomings of the other prediction
approaches.
Crest settlement attributed to impoundment vs. rockfill secant modulus
The concept of linking the load-deformation behavior of the dam during construction to its behavior
afterwards is also used here. Fig. 10 presents the relative crest settlement attributed to impoundment
versus average rockfill secant modulus at end of construction for different CFRDs. Once again, the higher
the secant modulus of the rockfill at the end of construction, the lower the dam’s relative settlement
attributed to impoundment. However, the effect of intact rock strength is not significant here. Except for
one case, CFRDs constructed of both very high and high strength rockfill zones lie along the same general
trend line. In other words, by comparing the settlements caused by impoundment with rockfill secant
modulus, the effect of rock intact strength decreases. Note that, since in the case of CFRDs deformations
during both construction and impoundment represent stress-strain behavior of their materials due to
gradual increases in stress level, the existence of a relationship between the two phases is quite rational.
Page 14 of 42
https://mc06.manuscriptcentral.com/cgj-pubs
Canadian Geotechnical Journal
Page 16
Draft
15
Crest settlement rate after impoundment vs. rockfill secant modulus
Fig. 11 shows the long-term relative crest settlement versus rockfill secant modulus for the studied
CFRDs. The same trend as settlement rates before impoundment (Fig. 9) is observed here. The only
difference is that, after impoundment, the relative settlement rates are generally higher than those in Fig. 9
and the difference between the trend lines, for the two strength categories, is more evident.
It is interesting to note that despite very high strength of rockfill in Foz Do Areia and Reece dams, the
rockfill has low secant modulus at the end of construction, even less than some of the high strength
rockfills. Additionally, as can be seen in Table 2, rockfill void ratio is high for the two cases. Therefore, it
can be inferred that the void ratio affects the rockfill stress-strain behavior during construction more than
the intact strength of rock particles. But, for the time-dependent deformations, the intact strength is more
influential.
Winscar and Shuibuya dams, which were outside the trends observed in the graphs of α2 versus dam
height, fall well inside the trend in Fig. 11. This shows the efficiency of the current method. It is also
worth noting that the Winneke dam, which was outside the trend observed for the long-term relative crest
settlement (after impoundment) of dams constructed of high strength rockfill, is well inside the expected
trend in the other two sections (time-dependent settlements before impoundment and settlements
attributed to impoundment). This validates the hypothesis that its unexpected behavior during the long-
term settlement phase is due to the delay in completion of impoundment.
A summary of the parameters calculated for the studied cases and used in the previous three sections is
presented in Table 3.
Comparison between time-dependent deformations before and after impoundment
In this section, the relative crest settlement rates before and after impoundment are compared to study the
effect of changes in stress distribution and properties of materials on time-dependent deformation of
Page 15 of 42
https://mc06.manuscriptcentral.com/cgj-pubs
Canadian Geotechnical Journal
Page 17
Draft
16
CFRDs. In order to compare the stress state inside an embankment before and after impoundment, a
generic 100m high embankment having slopes of 1 vertical to 1.4 horizontal was modeled using the
Plaxis 2D Hardening soil model. This model, which uses theory of plasticity to reproduce hyperbolic
axial strain-deviatoric stress in a drained triaxial test, and, includes soil dilatancy, is quite common in
modeling rockfill embankments. The mechanical parameters used for the model are presented in Table 4.
In the table, ������
and ������
are the secant modulus in 50% of maximum shear stress and
unloading/reloading stiffness in a standard triaxial test, respectively; �������
is the tangent stiffness for
primary oedometer loading at a reference stress, ����; and m is the power for stress level dependency of
the stiffness moduli:
� ≈ ����(�/����)� (2)
where � is “minimum principal stress” for ������
and ������
and “minimum principal stress over ����” for
�������
. ���� is the �� value for normal consolidation, ��� is the Poisson’s ratio for unloading/reloading and
� is the failure ratio (ultimate over asymptotic deviatoric stress). C, !, and " are cohesion, friction
angle, and dilation angle respectively.
The construction of the generic embankment was modeled using the software’s staged construction option
in which 10 m lifts were considered. After construction modelling, the reservoir load was applied on the
impervious upstream face in a single stage. The computed mean effective stress, deviatoric stress and
relative shear stress (τmob/τmax), before and after application of reservoir load are shown in Fig. 12. τmob is
the mobilized shear strength or the radius of the Mohr circle and τmax is the maximum value of the shear
stress, for the case when the Mohr circle expands and touches the coulomb failure envelope considering a
fixed center. Therefore, τmob/τmax is an indicator of the proximity of an element to the failure envelope and
varies between 0 for isotropic stress state to 1 for failure state. As can be seen, by applying reservoir load,
both mean and deviatoric stresses increase on the upstream side and centerline of the embankment.
However, the mean stress increases more significantly and the relative shear stress, decreases in the
Page 16 of 42
https://mc06.manuscriptcentral.com/cgj-pubs
Canadian Geotechnical Journal
Page 18
Draft
17
upstream side of the embankment. While stresses generally increase inside the embankment, if
considering a Coulomb failure criterion, the material moves away from failure state due to the induced
stresses. This is an advantage of CFRDs compared to other types of embankment dams, where
impoundment increases the risk of slope instability. Additionally, it can be implied that the instantaneous,
as well as long-term deformations, caused by impoundment in a CFRD is mostly due to increase in
confining pressure rather than shear stress.
Returning to the data from studied CFRDs, Fig. 13 shows how the settlement rates before and after
impoundment compare for different cases. Despite some exceptions, the relative settlement rates become
larger after impoundment. Generally, the α2/α1 ratio lies between 0.8 and 2.5. The relative crest settlement
rate after impoundment, α2 is very small for Winneke dam because it has undergone a very long
settlement period before the end of impoundment (5.4 years). Neglecting this case, generally, the dams
constructed of high strength rockfill zones show higher α2/α1 values in comparison with those constructed
of very high strength rockfill. It can be inferred that for the rockfill of lower strength, the strain rate is
more influenced by the stress level than the rockfill of higher strength. This is in accordance with the
results of the previous sections where the relative crest settlement rates of dams constructed of very high
strength rockfill zones show less dependency on the dam height.
Reservoir impoundment has two influences on the behavior of CFRDs: first, as discussed previously, the
stress distribution inside the dam changes due to the load application on the upstream face; second, the
rockfill material undergoes changes, some of the cracks inside the particles propagate, and particles break
and fill the voids. Additionally, some of the asperities of the particles break. The change in properties
throughout the time, and normally stiffening of the material, is called the aging effect. The first aspect
results in larger time-dependent deformations while the second generally leads to smaller deformations.
As can be seen in Fig. 13, in most of the studied cases, the first mechanism is prevailing (right side of
α$ = α line) and in some, the second one is dominant (left side of α$ = α line).
Page 17 of 42
https://mc06.manuscriptcentral.com/cgj-pubs
Canadian Geotechnical Journal
Page 19
Draft
18
In order to study the ageing effect, the ratios of relative crest settlement rates, after and before
impoundment,�$/� , are drawn versus the elapsed time between end of construction and end of
impoundment (start of the third phase) (Fig. 14). A clear trend can be seen in this figure for the dams
constructed of high strength rockfill. As the time interval increases, the ratios of settlement rates decrease.
In other words, the longer the time before start of the third phase (the end of impoundment), the more
significant the effect of aging and the less the dam’s crest settlement in the period afterwards. The
Winneke dam, which was considered an outlier in Fig. 13, falls very well inside the trend in Fig. 14. For
the dams constructed of very high strength rockfill on the other hand, no clear trend is observed. This may
indicate that the aging effect is more influential in the less stiff rockfill, where the particles break more
frequently and the voids fill more often between the rock particles. Therefore, the number of inter-particle
contact points increases and less breakage takes place in the subsequent phase.
Example of post-construction crest settlement prediction
The La Yesca dam in Mexico, a 208m high and 628m long structure, was chosen to permit an actual
prediction of the post-construction settlement of a CFRD. This can be considered as a “class B”
prediction according to (Lambe 1973) since the results are not known at the time prediction is made.
Construction of the dam body began in 2008 and ended in April 2012. As can be implied from the
existing data, the impoundment started right after end of construction and ended in September 2013.
However, no data on post-construction settlements of the dam was found. The material properties and
deformation of the dam during construction are presented in Marengo-Mogollón and Rivera-Constantino
(2012). The typical cross section of the dam includes three major zones (Fig. 15). The main embankment
zones (3A & 3B) are comprised of rockfill and coarse-grained alluvial soil. Therefore, the La Yesca dam
is different from the studied cases in this respect. Despite the lack of detailed data, the UCS of the rockfill
(that is originated from ignimbrites) is assumed to be in the very high strength category.
a) Using dam height and rockfill strength: The height of the maximum section of the dam is 195m at
Page 18 of 42
https://mc06.manuscriptcentral.com/cgj-pubs
Canadian Geotechnical Journal
Page 20
Draft
19
the centerline from the crest to the foundation. Therefore, using Fig. 4, relative crest settlement rate after
construction, � extrapolates 0.055% per log cycle of time. Although the impoundment of the dam
started right after end of construction and the first phase does not exist in this case, � must be used to
calculate the time-dependent deformations during impoundment. So, considering that impoundment
finishes one year and four months (1.33 years) after end of construction, settlement of
&(%�()ℎ+,-ℎ.) = 0.055 × log(1.33/0.1) = 0.06%or12:) (3)
must be summed with the settlements attributed to first filling to estimate total settlement during
impoundment period. The crest settlement attributed to stress increase caused by impoundment can be
calculated extrapolating from Fig. 5. Considering the x value (dam height = 195 m), the &;�< amount is
estimated as 0.05 % of dam height, or 10 cm. Likewise, extrapolating from Fig. 7 (x value = dam height
= 195 m), the relative crest settlement rate after impoundment is estimated as 0.05 % per log cycle of
time. Therefore, for instance, in 50 years of operation after impoundment, the relative crest settlement
would be 0.052 × log(50/0.1) = 0.14% dam height or 27.5 cm. Note that the beginning of the time
interval for estimation of settlements in each phase, t , is considered to be 0.1 years in the calculations
(e.g. in equation (3)) since it yields acceptable results for the studied cases. Considering smaller values
of beginning of the time interval tends to overestimate the settlements.
b) Using rockfill secant modulus and strength: The vertical deformation contours of La Yesca dam
measured with hydraulic levels at end of construction are shown in Fig. 16. As it is indicated, for a layer
located in the bottom one third of the dam, the vertical settlement, , is approximately 80 cm and the
layer thickness, � , equals 65 m. The vertical stress contours relative to dam height, computed from
linear elastic analysis of a generic homogeneous, symmetrical embankment with the same embankment
slopes as La Yesca dam, are presented in Fig. 17. Using this figure, the vertical stress at the mid-height
of the considered layer (supposedly, the average vertical stress of the layer) can be calculated as:
Page 19 of 42
https://mc06.manuscriptcentral.com/cgj-pubs
Canadian Geotechnical Journal
Page 21
Draft
20
��
�?= 0.68 ⇒ �� = 0.68 × 20.1 × 195 = 2,665kN/m$ (4-1)
Thus, the modulus will be:
��� =
��
(/� )=
2861
(0.8/65)= 216,550GH/)$ (4-2)
Conducting the same procedure for two other layers adjacent to the foundation with different thicknesses,
an average modulus of 210 MPa was calculated for prediction.
Now, using the calculated rockfill secant modulus, extrapolating from Fig. 9, α , equals 0.02% per log
cycle of time (time-dependent settlement during impoundment period would equal 0.02% of dam height
using the same method as in equation (3). Likewise, implementing Fig. 10, the crest settlement attributed
to first filling equals 0.02% of dam height, i.e. 4 cm. Also, using Fig. 11, the relative crest settlement rate
after impoundment, α$, equals 0.025% per log cycle of time i.e. 0.07% (or 13.5 cm) in 50 years after
impoundment. The relative settlements calculated using this method are shown in Fig. 18 for the periods
before and after impoundment.
Table 5, presents a summary of estimated parameters for post-construction settlements of La Yesca dam.
The second method yields smaller settlement parameters compared to the first method. The settlements of
La Yesca dam during construction were small compared to similar dams. This yields very large modulus
for rockfill and consequently, small values for post-construction settlement. It is expected that the values
from the modulus method yield more reliable estimations. It must be noted that as the annual rainfall
histogram of the dam indicates, the impoundment period of the dam includes two rainy seasons with
maximum monthly precipitation of 300 mm. Therefore, it can be anticipated that the settlements during
impoundment be higher than the estimated values due to wetting collapse, especially if the rockfill had
not been sluiced during construction.
Page 20 of 42
https://mc06.manuscriptcentral.com/cgj-pubs
Canadian Geotechnical Journal
Page 22
Draft
21
Limitations of the presented methods
In this study, the unconfined compressive strength of intact rock was used to characterize the rock quality.
However, the susceptibility of the rock to lose its strength while in contact with water, which leads to
collapse due to wetting in rockfill, must also be considered. This aspect is of essential importance in areas
with high precipitation and where rockfill is not watered during construction. The Roadford asphaltic
concrete face rockfill (sandstone and mudstone) dam (Charles 2008) and the Martin Gonzalo concrete
face rockfill (slate and greywacke) dam (Justo and Durand 2000) are two examples of impervious
upstream face dams where significant wetting collapse settlement has taken place. Compared to the other
cases evaluated in this study, the moduli at end of construction values are very low for Roadford and
Martin Gonzalo (32MPa and 16MPa respectively). Therefore, low rockfill secant modulus at end of
construction can be also an indicator of susceptibility to wetting collapse. This aspect needs further
investigation.
It must also be noted that the presented method is a phenomenological approach. While all of the
estimations and calculations in this study depend on the definition of the time datum, according to
Leroueil (2001), any change in the time frame datum must not change results of the response of a system
due to the axiom of objectivity. Nevertheless, the guidelines presented here, yield a representative
engineering estimation of the post-construction behavior of the CFRDs.
Conclusions
In the presented study, the post-construction crest settlement of CFRDs is linked to the in-situ mechanical
properties of rockfill during construction and the geometry of the embankment through an empirical
method. The presented methods can be used to overcome some limitations of numerical models and
laboratory experiments such as scale effects, difference between densities and moisture contents in the
field and in laboratory, diversity of materials in a rockfill embankment and complexity of stress paths in
the field. Additionally, after assessment of the time-dependent settlements of the studied cases, ageing is
Page 21 of 42
https://mc06.manuscriptcentral.com/cgj-pubs
Canadian Geotechnical Journal
Page 23
Draft
22
shown to significantly influence the settlement rates for compacted rockfill within the high strength
category.
Acknowledgement
The authors gratefully acknowledge the financial support of the Natural Sciences and Engineering
Research Council of Canada (NSERC) – Hydro-Québec Industrial Research Chair for life cycle
optimization of embankment dams. The authors also extend their appreciation to their industrial partners:
Hydro-Québec, SNC-Lavalin, Qualitas, WSP, Golder Associates, Klohn Crippen Berger, ConeTec, and
Hatch.
Page 22 of 42
https://mc06.manuscriptcentral.com/cgj-pubs
Canadian Geotechnical Journal
Page 24
Draft
23
References
Alonso, E.E., Pinyol, N.M., and Olivella, S. 2005. A review of Beliche Dam. Géotechnique, 55(4),
pp.267–285.
Alonso, E.E., Tapias, M., and Gili, J. 2012. Scale effects in rockfill behaviour. Géotechnique Letters, 2(7–
9), pp.155–160.
Charles, J.A. 2008. The engineering behaviour of fill materials : the use, misuse and disuse of case
histories. Geotechnique, 58(7), pp.541–570.
Clements, R.P. 1984. Post-construction deformation of rockfill dams. ASCE Journal of Geotechnical
Engineering, 110(7), pp.821–840.
Clements, R.P. 1981. The deformation of rockfill; inter-particle behaviour, bulk properties and bebaviour
in dams. King’s College, London.
Colliat-Dangus, J.L., Desrues, J., and Foray, P. 1988. Triaxial Testing of Granular Soil Under Elevated
Cell Pressure. Advanced Triaxial Testing of Soil and Rock, ASTM STP 977, pp.290–310.
Cooke, J.B. 1984. Progress in Rockfill Dams. Journal of Geotechnical Engineering (ASCE), 110(10),
pp.1381–1414.
Cormier, V., and Konrad, J.-M. 2015. Short and long term compressibility of rock particle assemblages.
In Proceedings of the 68th Canadian Geotechnical Conference; GéoQuébec; Sept. 20-23. Quebec.
Fitzpatrick, M.D., Cole, B., Kinstler, F., and Knoop, B. 1985. Design of concrete-faced rockfill dams. In
Proceedings of the Symposium on Concrete Face Rockfill Dams - Design, Construction and
Performance, (Cooke and Sherard ed.) Detroit, Michigan, ASCE New York. pp. 410–434.
Giudici, S., Herweynen, R., and Quinlan, P. 2000. HEC experience in concrete faced rockfill dams - past,
present and future. In Proceedings of the International Symposium on Concrete Faced Rockfill
Dams. Beijing, pp. 29–46.
Hunter, G. and Fell, R. 2002. The Deformation Behaviour of Rockfill. The University Of New South
Page 23 of 42
https://mc06.manuscriptcentral.com/cgj-pubs
Canadian Geotechnical Journal
Page 25
Draft
24
Wales, School Of Civil And Environmental Engineering, Uniciv Report No. R-405, (January).
ICOLD 2010. Concrete face rockfill dams; concepts for design and construction. Bulletin 141.
Justo, J.L., and Durand, P. 2000. Settlement-time behaviour of granular embankments. International
Journal for Numerical and Analytical Methods in Geomechanics, 24(3), pp.281–303.
Kermani, M. 2016. Prediction of post-construction settlements of rockfill dams, based on construction
field data. PhD thesis, Université Laval.
Lambe, T.W. 1973. Predictions in soil engineering. Géotechnique, 23(2), pp.151–202.
Marachi, N.D., Chan, C.K., Seed, H.B., and Duncan, J.M. 1969. Strength and deformation characteristics
of rockfill materials, University of California, Berkeley; Report No. TE-69-5.
Marengo-Mogollón, H., and Rivera-Constantino, R. 2012. Geotechnical design for “ La Yesca ” dam :
description of its behavior during the construction stage and first filling. In CDA Annual
Conference, September 22 -27, 2012. Saskatoon, SK, Canada.
Marsal, R.J. 1973. Mechanical properties of rockfill. Embankment Dam Engineering, (Casagrande
Volume. Hirschfeld, RC and Poulos, SJ, ), pp.109–200.
Marulanda, A. 2013. Recent successful very high CFRD’s. In Annual Canadian Dam Associatin (CDA)
Conference. Montreal, Canada.
Mesri, G. and Godlewski, P.M. 1977. Time- and stress-compressibility interrelationship. ASCE, Journal
of the geotechnical engineering division, 103(GT5), pp.417–430.
Mesri, G. and Vardhanabhuti, B. 2009. Compression of granular materials. Canadian Geotechnical
Journal, 46(4), pp.369–392.
Milligan, V. and Coyne, L. 2005. Review of factors influencing the settlement of rockfill dams. In K.Y.
Lo Symposium, The University of Western Ontario. pp. 1–31.
Oldecop, L.A. and Alonso, E.E. 2007. Theoretical investigation of the time-dependent behaviour of
Page 24 of 42
https://mc06.manuscriptcentral.com/cgj-pubs
Canadian Geotechnical Journal
Page 26
Draft
25
rockfill. Géotechnique, 57(3), pp.289–301.
Parkin, A.K. 1977. The Compression of Rockfill. Australian Geomechanics journal, pp.33–39.
Pinto, N.D.. and Marques Filho, P.L. 1998. Estimating the maximum face deflection in CFRDs.
International Journal on Hydropower and Dams, 5, pp.28–32.
Ramon, A., Alonso, E.E., and Romero, E.E. 2008. Grain size effects on rockfill constitutive behavior. In:
Unsaturated Soils. Advances in Geo-Engineering: Proceedings of the 1st European Conference on
Unsaturated Soils, Durham (U.K.), (2001), pp.341–347. Available at: ISBN 978-0-415-47692-8.
Sowers, G.F., Williams, R.C., and Wallace, T.S. 1965. Compressibility of Broken Rock and the
Settlement of Rockfills. In Proceedings of 6th ICSMFE; vol. 2. Montreal, pp. 561–565.
Soydemir, C., and Kjaernsli, B. 1979. Deformations of membrane-faced rockfill dams. In 7th European
Conference on Soil Mechanics and Foundation Engineering. Brighton, England, pp. 281–284.
Page 25 of 42
https://mc06.manuscriptcentral.com/cgj-pubs
Canadian Geotechnical Journal
Page 27
Draft
26
Figure captions
Fig. 1. Post construction crest settlement of Bastyan dam (adapted from Hunter and Fell 2002)
Fig. 2. Post construction crest settlement of Bastyan dam a) time datum at the end of main rockfill
construction; b) time datum at the end of impoundment (data from Hunter and Fell 2002)
Fig. 3. Typical zoning of concrete face rockfill dams (adapted from ICOLD 2010)
Fig. 4. Relative crest settlement rate before impoundment vs. dam height
Fig. 5. Crest settlement per dam height attributed to impoundment vs. dam height for studied CFRDs
Fig. 6. Evolution of crest settlement per dam height and reservoir water level history of Toulnustouc main
dam in the highest section
Fig. 7. Relative crest settlement rate after impoundment vs. dam height
Fig. 8. Calculation of modulus during construction (adapted from Hunter and Fell 2002).
Fig. 9. Relative crest settlement rate before impoundment vs. rockfill secant modulus at end of construction
Fig. 10. Relative crest settlement attributed to impoundment vs. rockfill secant modulus at end of
construction
Fig. 11. Relative crest settlement rate after impoundment vs. rockfill secant modulus at the end of
construction
Fig. 12. Stress state inside a generic CFRD a) before, b) after impoundment
Fig. 13. Relative crest settlement rates before impoundment (α1) vs. after impoundment (α2)
Fig. 14. The ratio of relative crest settlement rates after and before impoundment vs. time elapsed from the
end of rockfill construction (EoC) to the end of impoundment (EoI)
Fig. 15. Typical cross section of La Yesca dam(adapted from Marengo-Mogollón and Rivera-Constantino
2012)
Fig. 16. Contours of settlements (cm) at La Yesca Dam for the end of construction (modified from Marengo-
mogollón and Rivera-Constantino 2012)
Fig. 17. Contours of vertical stress for a generic embankment with 1 horizontal to 1.4 vertical slope at end of
construction (H = dam height in the section, and γ = fill density)
Page 26 of 42
https://mc06.manuscriptcentral.com/cgj-pubs
Canadian Geotechnical Journal
Page 28
Draft
27
Fig. 18. Post-construction crest settlement prediction of La Yesca dam a) before and b) after the end of
impoundment
Page 27 of 42
https://mc06.manuscriptcentral.com/cgj-pubs
Canadian Geotechnical Journal
Page 29
Draft
Fig. 1. Post construction crest settlement of Bastyan dam (adapted from Hunter & Fell, 2002)
α 1
Page 28 of 42
https://mc06.manuscriptcentral.com/cgj-pubs
Canadian Geotechnical Journal
Page 30
Draft
(a)
(b)
Fig. 2. Post construction crest settlement of Bastyan dam a) time datum at the end of main rockfill
construction; b) time datum at the end of impoundment (data from Hunter and Fell, 2002)
0
0.01
0.02
0.03
0.04
0.05
0.06
0.07
0.1 1 10
Re
lati
ve
cre
st s
ett
lem
en
t (%
he
igh
t)
Time (years since end of main rockfill construction)
Second phase
(impoundment
period)
Start of linear
settlements in
semi-log scale
First phase Third phase
Relative settlement
attributed to
impoundment, Simp
0
0.01
0.02
0.03
0.04
0.05
0.06
0.07
0.1 1 10
Re
lati
ve
cre
st s
ett
lem
en
t (%
he
igh
t)
Time (years since end of impoundment)
Start of linear
settlements in
semi-log scale
1
α1
1
α2
Page 29 of 42
https://mc06.manuscriptcentral.com/cgj-pubs
Canadian Geotechnical Journal
Page 31
Draft
Fig. 3. Typical zoning of concrete face rockfill dams (adapted from ICOLD 2010)
Fig. 4. Relative crest settlement rate before impoundment vs. dam height
0.00
0.05
0.10
0.15
0.20
0.25
0 20 40 60 80 100 120 140 160 180
Cre
st s
ett
lem
en
t ra
te b
efo
re i
mp
ou
nd
me
nt,
α1
(%h
eig
ht
/lo
g c
ycl
e o
f ti
me
)
Maximum dam height (m)
High strength rockfill
Very high strength rockfill
Mackintosh
WinnekeToulnustouc
Zone 3B or 3C
Zone 3B Zone 3C
Large rock dozed to face
Variable based on height of
dam, rock quality and rockfill
grading
Concrete face slab
Zone 2B
Zone 3A
Zone 1A Zone 1B
Page 30 of 42
https://mc06.manuscriptcentral.com/cgj-pubs
Canadian Geotechnical Journal
Page 32
Draft
Fig. 5. Crest settlement per dam height attributed to impoundment vs. dam height for studied CFRDs
Fig. 6. Evolution of crest settlement per dam height and reservoir water level history of Toulnustouc main
dam in the highest section
0
0.05
0.1
0.15
0.2
0.25
0.3
0 20 40 60 80 100 120 140 160 180 200 220
Cre
st s
ett
lem
en
t a
ttri
bu
ted
to
imp
ou
nd
me
nt,
Sim
p(%
da
m h
eig
ht)
Maximum dam height (m)
Very high strength rockfill
High strength rockfill
MackintoshWinneke
Toulnustouc
225
240
255
270
285
300
0
0.05
0.1
0.15
0.2
0.1 1 10
Re
serv
oir
ele
va
tio
n (
m)
Re
lati
ve
cre
st s
ett
lem
en
t (%
da
m
he
igh
t)
Time since first reading (year)
Crest settlement
Reservoir level
mid-April to
mid-June
Page 31 of 42
https://mc06.manuscriptcentral.com/cgj-pubs
Canadian Geotechnical Journal
Page 33
Draft
Fig. 7. Relative crest settlement rate after impoundment vs. dam height
Fig. 8. Calculation of modulus during construction (adapted from Hunter & Fell 2002).
0.000
0.050
0.100
0.150
0.200
0.250
0 20 40 60 80 100 120 140 160 180 200 220
Cre
st s
ett
lem
en
t ra
te a
fte
r im
po
un
dm
en
t,
α2
(%h
eig
ht
/lo
g c
ycl
e o
f ti
me
)
Maximum dam height (m)
Very high strength rockfill
High strength rockfill
Kotmale
Toulnustouc
Winneke
Winscar
Shuibuya
h H ��
�� Mid-height of
the layer
Considered
rockfill layer
Page 32 of 42
https://mc06.manuscriptcentral.com/cgj-pubs
Canadian Geotechnical Journal
Page 34
Draft
Fig. 9. Relative crest settlement rate before impoundment vs. rockfill secant modulus at end of construction
Fig. 10. Relative crest settlement attributed to impoundment vs. rockfill secant modulus at end of
construction
α1 = 1.05 ERC-0.76
α1 = 3.18 ERC-0.96
0.00
0.05
0.10
0.15
0 20 40 60 80 100 120 140 160 180 200
Cre
st s
ett
lem
en
t ra
te b
efo
re
imp
ou
nd
me
nt,
α1
(%h
eig
ht
/lo
g c
ycl
e o
f ti
me
)
Rockfill secant modulus at end of construction, ERC (MPa)
Very high strength rockfill
High strength rockfill
Winneke
Mackintosh
Simp = 0.57 ERC-0.64
Simp = 52.77 ERC-1.58
0
0.05
0.1
0.15
0.2
0.25
0 20 40 60 80 100 120 140 160 180 200 220
Re
lati
ve
cre
st s
ett
lem
en
t
att
rib
ute
d t
o im
po
un
dm
en
t,
Sim
p(%
da
m h
eig
ht)
Rockfill secant modulus at end of construction, ERC (MPa)
Very high strength rockfill
High strength rockfill
Mackintosh
Winneke
Page 33 of 42
https://mc06.manuscriptcentral.com/cgj-pubs
Canadian Geotechnical Journal
Page 35
Draft
Fig. 11. Relative crest settlement rate after impoundment vs. rockfill secant modulus at the end of
construction
α2 = 0.19 ERC-0.38
α2 = 1.02 ERC-0.549
0
0.05
0.1
0.15
0.2
0.25
0 20 40 60 80 100 120 140 160 180 200 220
Cre
st s
ett
lem
en
t ra
te a
fte
r im
po
un
dm
en
t,
α2
(%h
eig
ht
/lo
g c
ycl
e o
f ti
me
)
Rockfill secant modulus at end of construction, ERC (MPa)
Very high strength rockfill
High strength rockfill
Foz Do Areia
Winneke
Reece
Mackintosh
Shuibuya
Winscar
Page 34 of 42
https://mc06.manuscriptcentral.com/cgj-pubs
Canadian Geotechnical Journal
Page 36
Draft
Mean effective stress p′ (kPa)
Mean effective stress p′ (kPa)
Deviatoric stress q (kPa)
Deviatoric stress q (kPa)
τmob/ τmax
τmob/ τmax
(a) (b)
Fig. 12. Stress state inside a generic CFRD a) before, b) after impoundment
Fig. 13. Relative crest settlement rates before impoundment (α1) vs. after impoundment (α2)
0.00
0.05
0.10
0.15
0 0.05 0.1 0.15
α1
(%h
eig
ht/
log
cy
cle
of
tim
e)
α2 (%height/log cycle of time)
High strength rockfill
Very high strength rockfill
Winneke
980 700
420
140
1260 980
700
420
140
880
660 440 220
980
700
420 140
0.6 0.7 0.8 0.9
0.5 0.5
0.6 0.7
0.8
0.9
Page 35 of 42
https://mc06.manuscriptcentral.com/cgj-pubs
Canadian Geotechnical Journal
Page 37
Draft
Fig. 14. The ratio of relative crest settlement rates after and before impoundment vs. time elapsed from the
end of rockfill construction (EoC) to the end of impoundment (EoI)
Fig. 15. Typical cross section of La Yesca dam(adapted from Marengo-Mogollón & Rivera-Constantino 2012)
0
0.5
1
1.5
2
2.5
3
0 1 2 3 4 5 6
α2
/α
1
Time from EoC to EoI (years)
High strength rockfill
Very high strength rockfill
Winneke
Page 36 of 42
https://mc06.manuscriptcentral.com/cgj-pubs
Canadian Geotechnical Journal
Page 38
Draft
Fig. 16. Contours of settlements (cm) at La Yesca Dam for the end of construction (modified from Marengo-
mogollón & Rivera-Constantino, 2012)
Fig. 17. Contours of vertical stress for a generic embankment with 1 horizontal to 1.4 vertical slope at end of
construction (H = dam height in the section, and γ = fill density)
�� 65�
�/��
�/��
Page 37 of 42
https://mc06.manuscriptcentral.com/cgj-pubs
Canadian Geotechnical Journal
Page 39
Draft
(a)
(b)
Fig. 18. Post-construction crest settlement prediction of La Yesca dam a) before and b) after the end of
impoundment
0
5
10
15
20
0
0.02
0.04
0.06
0.08
0.1
0.12
0.1 1
Cre
st s
ett
lem
en
t (c
m)
Re
lati
ve
cre
st s
ett
lem
en
t (%
he
igh
t)
Time (years since end of main rockfill construction)
α1= 0.021
Probable settlement
profile of the crest Estimated relative
settlement attributed
to impoundment, Simp
1.33
2nd phase (impoundment period)
0
5
10
15
20
0
0.02
0.04
0.06
0.08
0.1
0.12
0.1 1 10
Cre
st s
ett
lem
en
t (c
m)
Re
lati
ve
cre
st s
ett
lem
en
t (%
he
igh
t)
Time (years since end of impoundment)
α2=0.025
1
Probable post-
impoundment settlement
profile of the crest 0.07 %
dam
height
50
3rd phase
Page 38 of 42
https://mc06.manuscriptcentral.com/cgj-pubs
Canadian Geotechnical Journal
Page 40
Draft
Tables
Table 1. Classification of unconfined compressive strength of rock according to Australian code: AS 1726-
1993 (from Hunter and Fell 2002)
Strength Descriptor UCS Range (MPa)
Extremely High > 240
Very High 70 to 240
High 20 to 70
Medium 6 to 20
Page 39 of 42
https://mc06.manuscriptcentral.com/cgj-pubs
Canadian Geotechnical Journal
Page 41
Draft
Table 2. List of the studied CFRDs (data mostly from Hunter and Fell 2002)
Dam's name Loca
tio
n
Ye
ar
com
ple
ted
Ma
x d
am
he
igh
t (m
)
Da
m c
rest
len
gth
(m
)
Inta
ct r
ock
str
en
gth
cate
go
ry *
*
Ro
ckfi
ll so
urc
e
Un
con
fin
ed
com
pre
ssiv
e s
tre
ng
th,
UC
S (
MP
a)
Dry
de
nsi
ty (
t/m
3)
Ro
ckfi
ll vo
id r
ati
o
Co
mp
act
ion
spe
cifi
ca2
on
s ‡
Bastyan Tasmania 1983 75 430 EHS to VHS Rhyolite - 2.2 0.23 20% W; 1.0m ; 8p 10t
Cethana Tasmania 1971 110 213 VHS Quartzite - 2.07 0.27 15% W; 0.9m ; 4p 10t
Foz Do Areia Brazil 1979 160 828 HS to VHS Basalt, Basaltic breccia 185.5* 2.12 0.33 25% W; 0.8; 4p 10t
Murchison Tasmania 1982 94 200 VHS Rhyolite 148 2.27 0.23 20% W; 1.0m ; 8p 10t
Outardes 2 main dam Canada 1978 45.7 347.5 VHS Gneiss, Biotite - - - No W; 1.0m; 4p 10t
Reece Tasmania 1986 122 374 EHS to VHS Dolerite 225 * 2.287 0.29 5-10% W ; 1.0m; 4p 10t
Shuibuya China 2007 233 675 VHS? ? - 2.3 0.22 20% W; ? ; ?
Toulnustouc south dyke Canada 2004 46 400 VHS Gneiss 118 - - No W; 0.9m; 4p 15t
Toulnustouc main dam Canada 2004 76 535 VHS Gneiss 118 - - No W; 0.9m; 4p 15t
Kangaroo Creek Australia 1969 60 178 MS to HS Schist 25 2.34 0.20 100% W; 0.9m; 4p 10t
Kotmale Sri Lanka 1984 90 560 HS to VHS Charnockitic/gneissic - 2.2 - 30%W; 1.0m; 4p 15t
Mackintosh Tasmania 1981 75 465 MS to HS Greywacke, some slate 45 2.2 0.24 10%W; 1.0m, 8p 10t
Mangrove Creek Australia 1981 80 380 HS Siltstone, sandstone 49 * 2.24 0.18 7.5% W; 0.45m, 4p 10t
Serpentine Tasmania 1971 38 134 MS to HS Quartz schist - 2.1 0.26 ? W; 0.6m; 4p 9t
Tianshengqiao I China 1999 178 1168 HS Limestone, mudstone 44* 2.2 0.21 ? W; 1.0m; 6p 15t
White Spur Tasmania 1989 43 146 HS to VHS ? Tuff - 2.3 0.21 10%W; 1.0m; 4p 10t?
Winneke Australia 1978 85 1050 HS Siltstone 66 2.07 0.30 15%W; 0.9m; 4-6p 10t
Winscar† England 1974 53 520 HS? Millstone Grit sandstone - 2.03 0.28 ? W; 1.7m; 4p 13.5t
Xingo Brazil 1993 140 850 HS to VHS ? Granite gneiss - 2.15 - 15%W; 1.0m; 4-6p 10t
* Average of different zones of rockfill
** MS, HS, VHS and EHS stand for medium, high, very high and extremely high strength respectively
‡ Volumetric added water; layer thickness; number of passes and weight of roller respec2vely
† Asphal2c concrete face rockfill dam
Page 40 of 42
https://mc06.manuscriptcentral.com/cgj-pubs
Canadian Geotechnical Journal
Page 42
Draft
Table 3. Calculated parameters for the studied CFRDs
Dam's name ER
C (
Mp
a)
α1 (
%
he
igh
t p
er
log
tim
e c
ycl
e)
Sim
p (
% d
am
he
igh
t)
α2 (
%h
eig
ht
pe
r
log
tim
e c
ycl
e)
Tim
e f
rom
Eo
C
to E
oI
(ye
ars
)*
Bastyan 130 0.022 0.016 0.017 1.05
Cethana 137 0.027 0.036 0.038 0.48
Foz Do Areia 47 0.059 0.031 0.048 0.90
Murchison 190 0.022 0.013 0.030 1.09
Outardes 2 main dam - - 0.015 0.017 0.15
Reece 86 0.026 0.045 0.039 1.46
Shuibuya 96.5 - 0.055 0.028 1.07
Toulnustouc south dyke - 0.009 0.015 0.007 1.66
Toulnustouc main dam - 0.028 0.079 0.037 0.53
Kangaroo Creek - - - 0.082 -
Kotmale 61 0.059 0.090 0.113 1.04
Mackintosh 45 0.093 0.115 0.134 2.90
Mangrove Creek 55 - - 0.285 -
Serpentine 92 - 0.051 0.076 2.90
Tianshengqiao I 43 - - 0.140 -
White Spur 180 0.023 0.013 0.056 0.24
Winneke 55 0.064 0.084 0.026 5.40
Winscar 17 - - 0.175 -
Xingo 34 - 0.203 0.163 1.46
* EoC and EoI stand for: end of construction and end of impoundment
Page 41 of 42
https://mc06.manuscriptcentral.com/cgj-pubs
Canadian Geotechnical Journal
Page 43
Draft
Table 4. Hardening Soil model parameters used for modeling a generic embankment
γ (kN/m3) E��
���
(MPa)
E������
(MPa)
E����
(MPa)
νur pref
(kPa) Rf m c (kPa) ϕ (deg) ψ (deg) K���
23 100 100 300 0.2 100.0 0.9 0.5 0.0 45 10 0.5
Table 5. Summary of predicted parameters for La Yesca dam
Parameter used
for prediction
α1 (% per log
cycle of time)
Time-dependent
settlement during
impoundment
Settlement
attributed to impoundment
Settlement
after impoundment
(cm) Simp (% dam
height)
(cm) α2 (% per
log cycle of
time)
(cm in 50
years)
Dam height 0.055 12 0.05 10 0.052 27.5
Rockfill modulus 0.02 4.5 0.02 4 0.025 13.5
Page 42 of 42
https://mc06.manuscriptcentral.com/cgj-pubs
Canadian Geotechnical Journal