Page 1
Draft
ACCURACY OF DETERMINING PRE-CONSOLIDATION
PRESSURE FROM LABORATORY TESTS
Journal: Canadian Geotechnical Journal
Manuscript ID cgj-2016-0203.R1
Manuscript Type: Article
Date Submitted by the Author: 22-Oct-2016
Complete List of Authors: Umar, Muhammad; University of Western Ontario, Civil and Environmental Engineering Sadrekarimi, Abouzar; University of Western Ontario,
Keyword: Clay, pre-consolidation pressure, consolidation test, Compressibility
https://mc06.manuscriptcentral.com/cgj-pubs
Canadian Geotechnical Journal
Page 2
Draft
1
ACCURACY OF DETERMINING PRE-CONSOLIDATION PRESSURE FROM
LABORATORY TESTS
Muhammad Umar, Graduate Student, Department of Civil and Environmental Engineering,
Western University, London, Canada, Email: [email protected]
Abouzar Sadrekarimi, Ph.D., P.Eng., Assistant Professor and Principal Investigator, Department
of Civil and Environmental Engineering, Western University, London, Canada. Tel: +1 (519)
661-2111 (Ext. 80334), Email: [email protected]
A revised paper submitted for review and publication in the Canadian Geotechnical Journal
October 2016
Page 1 of 34
https://mc06.manuscriptcentral.com/cgj-pubs
Canadian Geotechnical Journal
Page 3
Draft
2
ACCURACY OF DETERMINING PRE-CONSOLIDATION PRESSURE FROM
LABORATORY TESTS
Abstract
Shear strength and compressibility of fine-grained soils is strongly influenced by their stress
history and the maximum (pre-consolidation) pressure (σ'p). Accurate determination of σ'p is
thus critical for settlement and stability analysis involving fine-grained soils. Many graphical
techniques are available for estimating σ'p from the interpretation of soil compression in
laboratory consolidation (oedometer) tests. However, the accuracy of these methods has not been
extensively proven or compared with each other. A series of 30 laboratory oedometer tests is
carried out in this study based on controlled-rate of strain and incrementally-loaded testing
techniques. Several Canadian clay specimens are subject to cycles of one-dimensional
compression loading and unloading in order to produce a known stress history and σ'p. The
imposed σ'p are compared with the predictions of 11 methods for determining σ'p. The accuracies
of these methods are subsequently evaluated by comparing their predictions with σ'p imposed
during the consolidation experiments. While these methods mostly overestimate σ'p, it is
determined that a bi-logarithmic graphical approach based on the slopes of the virgin
compression and recompression segments of soil compression curve provides the most accurate
predictions of σ'p. The potential ranges of errors associated with the application of each method
are also presented.
Keywords: clay, pre-consolidation pressure, laboratory consolidation test, plasticity,
compressibility
Page 2 of 34
https://mc06.manuscriptcentral.com/cgj-pubs
Canadian Geotechnical Journal
Page 4
Draft
3
Introduction
Compressible fine-grained soils often exhibit a memory of the past stress history which they
have experienced. This memory of soils is often presented by the pre-consolidation pressure
corresponding to the maximum effective stress ever experienced by a particular soil (Becker, et
al. 1987; Burland, 1990; Casagrande, 1936). Different stress histories can be naturally generated
from a soil's geological stress history, soil erosion, desiccation, excavation, melting of glaciers,
cementation, and sustained seepage forces.
Pre-consolidation pressure (denoted here by “σ'p”) is a pseudo-elastic limit which separates
‘elastic’ pre-yield from ‘plastic’ post-yield behaviour of a soil. This is a key parameter in
geotechnical engineering for analyzing and predicting settlement behavior, overconsolidation
ratio, stress history, and short-term stability problems in soft clays (Jamiolkowski, et al. 1985;
Ladd and Foote 1974; Mesri and Godlewski 1977; Wroth 1984). The results of these analyses
could be questionable if there is significant uncertainty and inaccuracy in determining the value
of σ'p. Therefore, a reliable method that would provide accurate estimates of σ'p is central to
geotechnical engineering analysis and design in fine-grained soils.
Pre-consolidation pressure is often determined from the results of one-dimensional consolidation
tests (“Oedometer tests”). Numerous empirical methods have been developed in the past for
interpreting σ'p of compressible soils from standard oedometer tests (Becker et al. 1987; Boone
2010; Burland 1990; Butterfield 1979; Casagrande 1936; Jacobsen 1992; Janbu 1967; Jose, et al.
1989; Oikawa 1987; Onitsuka et al. 1995; Pacheco Silva 1970; Sridharan 1991; Wang and Frost
2004). This study presents a comprehensive evaluation of the accuracy of these methods for
interpreting σ'p based on a large set of controlled-rate of strain (CRS) and incrementally-loaded
(IL) consolidation tests on clay specimens with known stress histories. This is different than
Page 3 of 34
https://mc06.manuscriptcentral.com/cgj-pubs
Canadian Geotechnical Journal
Page 5
Draft
4
some other investigations in which the pre-consolidation pressure was unknown or limited
comparisons were made based on indirect estimations of σ'p from undrained strength or other
empirical methods (Boone 2010; Schmertmann 1955; Wang and Frost 2004).
Empirical Methods for Predicting σσσσ'p
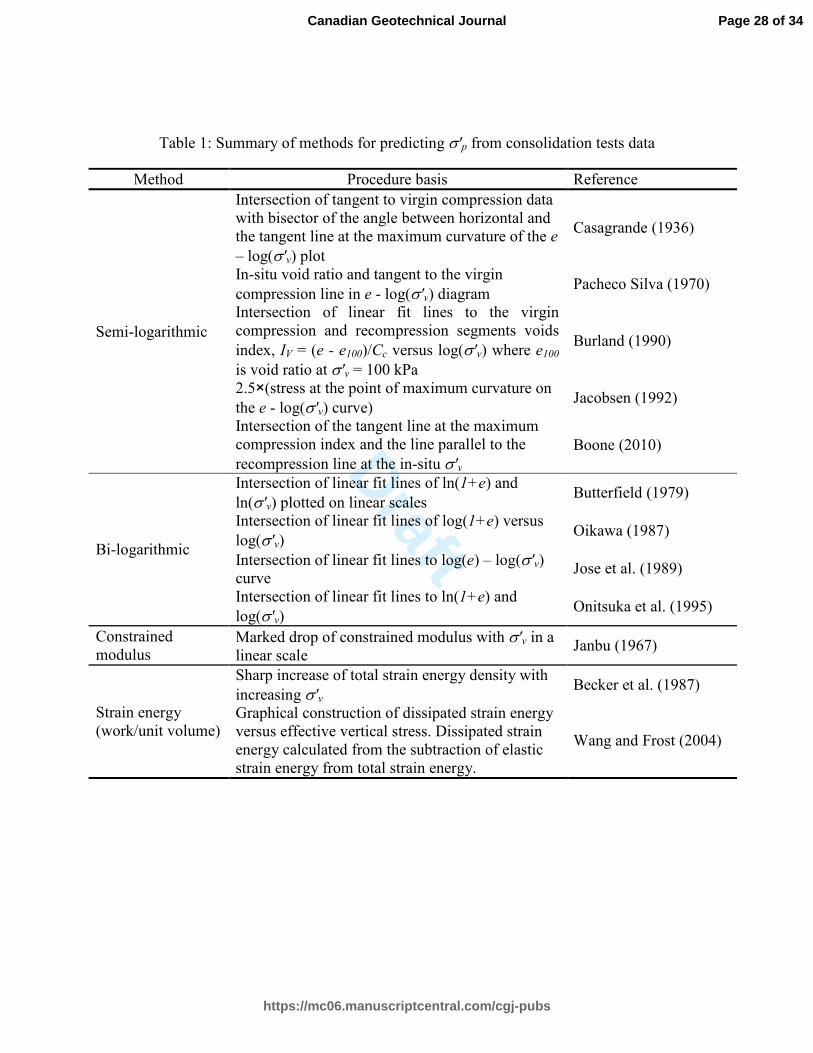
The current approaches for determining soil pre-consolidation pressure from oedometer
consolidation tests are all based on graphical interpretation procedures of void ratio (e) versus
effective vertical stress (σ'v) data. Table 1 provides a brief summary of these methods and their
application procedures. While the classical method of Casagrande (1936) is based on fitting
consolidation data with a bilinear void ratio and log(σ'v) curve, several other investigators have
proposed alternative forms of semi- or bi-logarithmic graphs for determining σ'p. Compared to
semi-logarithmic plots, plotting void ratio and σ'v in a bi-logarithmic scale (Butterfield 1979;
Oikawa 1987; Onitsuka, et al. 1995) can be advantageous by producing better linear
relationships between log(1+e) and log(σ'v). Note that although Sridharan et al. (1991) proposed
an equal approach to that of Oikawa (1987), but here reference is made to Oikawa (1987)
because of its earlier development.
As soil stiffness evolves from small strains to large strains near σ'p, Janbu (1967) suggested
determining σ'p based on the reduction of constrained modulus (M) at σ'p. Since lateral strains
are prevented in an oedometer test, constrained modulus can be directly calculated from the ratio
of load increment (δσ'v) to the increment of volumetric strain (δεvol). Janbu (1967) does not
specify the detailed procedure for determining σ'p, although some clarification is provided by
Lunne et al. (2008).
Page 4 of 34
https://mc06.manuscriptcentral.com/cgj-pubs
Canadian Geotechnical Journal
Page 6
Draft
5
Becker et al. (1987) suggested the concept of using the amount of strain energy (i.e. work)
imposed on a soil specimen for determining σ'p from oedometer consolidation tests. In this
method arithmetic linear relationships are approximately fitted for the cumulative work applied
per unit volume of a specimen (i.e. strain energy) and effective stress data from consolidation
tests. The pre-consolidation pressure is defined at the point of intersection of the initial fitted line
and the linear relationship observed at higher stresses. More recently, Wang and Frost (2004)
suggested to use plastic (irrecoverable) deformations (instead of the total deformation) in order
magnify the contrast between soil consolidation behavior before and after σ'p and employ the
slope of the unloading-reloading curve to reduce sample disturbance effects. They show that the
dissipated strain energy provides a better representation of soil yielding and hardening behavior.
As summarized above, based on the parameters selected for plotting and presenting
consolidation data, the existing methods for determining σ'p can be categorized into four broad
groups of: A) semi-logarithmic, B) bi-logarithmic, C) constrained modulus, and D) strain energy
(work) procedures. All of the aforementioned methods implicitly assume that a particular soil
exhibits a unique relationship between void ratio and σ'v at the end of primary consolidation
(Mesri and Choi 1985; Schmertmann 1955).
Experimental Procedure
A comprehensive series of 23 controlled-rate of strain (CRS) and 7 incrementally-loaded (IL)
one-dimensional consolation tests were carried out on two Canadian clay soils. CRS tests were
employed to apply a continuous and controlled consolidation load on a soil specimen and
provide a more precise measurement of soil consolidation behavior (Sheahan and Watters 1997).
In order to build-in a known σ'p, the specimens were subjected to cycles of consolidation loading
Page 5 of 34
https://mc06.manuscriptcentral.com/cgj-pubs
Canadian Geotechnical Journal
Page 7
Draft
6
to a predetermined σ'p, unloading and then reloading. The details of the experiments are
described below.
Tested Clays
A number of block samples of Port Colborne and Sombra silty clays and several thin-walled tube
samples of another silty clay from North Toronto were tested in this study. Laboratory tests
including Atterberg limit, sieve analysis, and hydrometer tests were carried out on these samples
according to the ASTM standard procedures (ASTM 2007,2010). Scanning Electron Microscopy
(SEM) and X-ray Diffraction (XRD) analyses were also conducted on several specimens in order
to determine their composition and mineralogy. Based on these analyses, it was determined that
Port Colborne and Sombra clay samples were essentially composed of Kaolinite and Illite
particles, whereas the North Toronto silty clay was mostly made of carbonates, followed by
feldspar, quartz, Kaolonite, and Illite particles. As shown in Table 2, plasticity indices (PI) of the
samples range from 9 to 24, with initial water contents (ωo) of 19% to 52%. According to the
Unified Soil Classification System (ASTM 2011b), the samples were low plasticity clays (CL).
Specimen Preparation
Trimming of the specimens to fit the consolidation ring was carefully done using a wire saw to
minimize sample disturbance. A stainless steel consolidation ring (50 mm in diameter and 19
mm height) was then pushed slowly onto the specimens from its sharp edge. The inside surface
of the consolidation ring was lubricated with low-friction silicon grease in order to minimize
friction and specimen disturbance. A straightedge with a sharp cutting edge was used for the
final trim and leveling both top and bottom surfaces of the specimen. Any small voids were
carefully filled with remolded soil without disturbing the specimen. The consolidation ring and
Page 6 of 34
https://mc06.manuscriptcentral.com/cgj-pubs
Canadian Geotechnical Journal
Page 8
Draft
7
the soil were then carefully weighed for the accurate computation of void ratio at the beginning
of each test. Excess soil was also used for determining water content and soil classification.
Finally, a thin disc fitted on the consolidation ring was used to push the top surface of the
specimen about 2 mm into the ring in order for the porous stone and the loading cap to properly
seat on the specimen. The porous stones were saturated by boiling them in water for about 20
minutes prior to specimen preparation.
IL Tests
In order to minimize the effect of secondary compression and the development of quasi-
preconsolidation pressure (Leonards and Altschaeffl 1964; Mesri and Shahien 1994),
incrementally-loaded (IL) consolidation tests were conducted following Method B of the ASTM
standard procedure (ASTM 2011a). In these experiments, the axial stress was applied by dead
weights via a lever ratio of 10 to 1. The magnitude of the axial stress was increased stepwise at a
load-increment ratio (LIR) of 1 and each load increment was sustained for 60 minutes at which
the specimen deformation reached a stabilized low rate (indicating the completion of primary
consolidation as determined from log-time constructions). Since the duration of secondary
compression was minimized by adopting short (60 minutes) load increment durations (instead of
24 hours waiting periods typically used in consolidation testing), the void ratio at the end of each
load increment was used for constructing a consistent End-of-Primary (EOP) consolidation
diagram as recommended by the ASTM standard procedure.
Page 7 of 34
https://mc06.manuscriptcentral.com/cgj-pubs
Canadian Geotechnical Journal
Page 9
Draft
8
CRS Tests
CRS tests were carried out using an automated computer-controlled apparatus (manufactured by
GEOTAC TRAUTWEIN, Texas, USA) following the ASTM D4186 standard procedure (ASTM
2012). The CRS apparatus includes an axial loading frame, a servo-controlled axial loading jack,
pore water pressure and displacement (LVDT) transducers, and a CRS consolidation cell. After
specimen preparation, the CRS cell was filled with deaired water for the application of cell
pressure and the bottom pore pressure transducer was flushed and saturated to measure excess
pore water pressure. A back-pressure was then applied in order to saturate the specimen. Prior to
consolidation loading, the base drain valve was closed and the initial pore water pressure was
recorded to evaluate specimen saturation. A pore pressure parameter (B) value of 98% or higher
was achieved in all experiments. The specimen was subsequently consolidated by applying an
axial load at a constant-strain rate while time, axial deformation, normal stress, and specimen
base pore water pressure were measured. According to the ASTM standard method (ASTM
2012), a strain rate should be selected to produce a base excess pore pressure ratio of 3% to 15%
at the end of the loading phase in order to measure hydraulic conductivity and the coefficient of
consolidation. Therefore, trial tests were performed in order to determine the appropriate strain
rate for each soil type. As a result, Port Colborne and Sombra clay specimens were loaded at
constant strain rates of 1.5%/hr and 0.5%/hr, respectively. However, because of the high
carbonate content, lower PI, and relatively more permeable specimens of the North Toronto silty
clay, very little excess pore pressure developed even at a higher strain rate of 5%/hour. Greater
strain rates (> 5%/hr) however were not employed in order to comply with the ASTM standard
(ASTM 2012) and avoid strain rate and dynamic loading effects. Moreover, hydraulic
conductivity and coefficient of consolidation measurements were not required for this study.
Page 8 of 34
https://mc06.manuscriptcentral.com/cgj-pubs
Canadian Geotechnical Journal
Page 10
Draft
9
Imposing Pre-consolidation Pressures
In both CRS and IL experiments, the specimens were loaded beyond their in-situ pre-
consolidation pressures (σ'p,o) and therefore the effects of σ'p,o, in-situ fabric, and sample
disturbance on the results of this study were eliminated. A pre-consolidation pressure (σ'p,i >
σ'p,o) was built-in by maintaining a load for a period of 2 to 3 hours in order to complete primary
consolidation and ensure full dissipation of excess pore water pressure. The specimens were
unloaded and then consolidated (reloaded) to stresses exceeding σ'p,i. This procedure was
repeated for some specimens in order to produce different σ'p,i and evaluate the predictive
methods for multiple magnitudes of σ'p,i. The ensuing consolidation behavior would thus reflect
soil compressibility behavior without any effects of stress relief or fabric disturbance
(Schmertmann 1955). Minor corrections were also made to account for equipment deflection (for
CRS and IL tests) and piston uplift force (for CRS tests). At the end of the experiments, each
specimen was unloaded, removed from the consolidation cell and its final mass and moisture
content were determined.
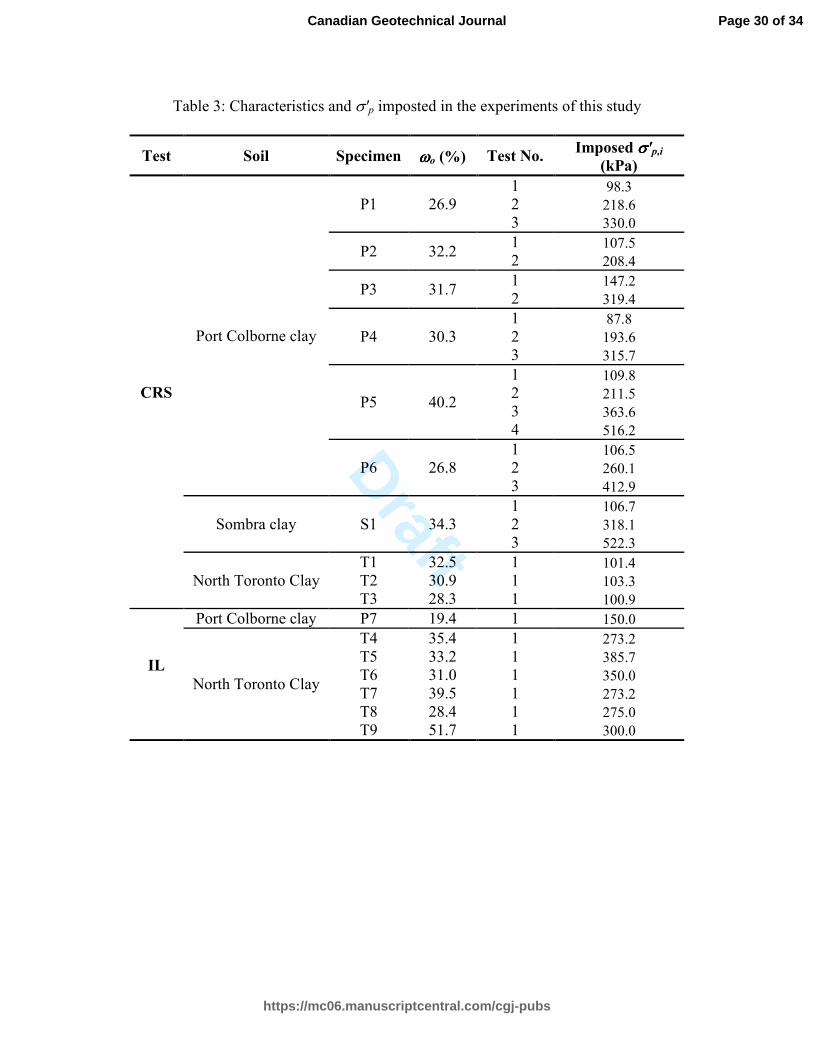
Experimental Results and Interpretations
Table 3 summarizes the characteristics of the experiments, and Figs. 1 and 2 present typical end-
of-primary consolidation (EOP) e - log(σ'v) stress paths from the CRS and IL consolidation tests
of this study. The graphical procedures of Table 1 are used to estimate the pre-consolidation
pressures (σ'p). For consistency, the same ranges of σ'v are chosen for recompression and
compression segments (and their tangents) for each method. The pre-consolidation pressures
(σ'p) estimated for the experiments of Table 3 are summarized in Tables 4 to 6. As examples, the
Page 9 of 34
https://mc06.manuscriptcentral.com/cgj-pubs
Canadian Geotechnical Journal
Page 11
Draft
10
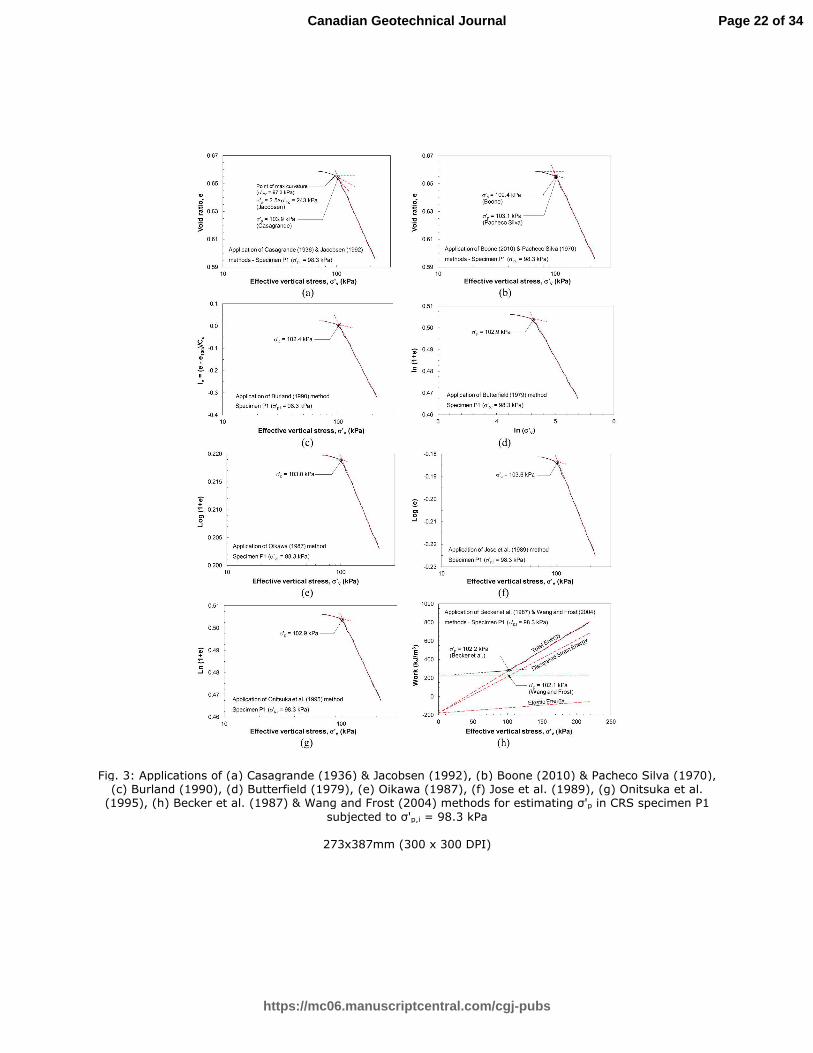
applications of the graphical procedures of Table 1 are illustrated for CRS (for specimen P1) and
IL (for specimen P7) tests in Figs. 3 and 4. Note that Janbu’s procedure is quite sensitive to the
slope of the σ'v – εvol curve for determining M. As a result of the limited data points (in IL tests)
and the large variation of M with subtle changes in the slope of the σ'v – εvol curve (in CRS tests),
fitting of straight lines to the M - σ'v plot was quite subjective and the determination of σ'p
became inconclusive for the soils of this study.
Discussion
Figs. 5 to 7 compare the imposed σ'p,i with those predicted by the empirical procedures for each
category of Table 1. CRS and IL consolidation tests data from several other studies (Becker et al.
1987; Grozic, et al. 2003; Grozic et al. 2005; Jose et al. 1989; Sridharan 1991) are also included
in these figures in order to supplement the analyses of this study and extend the comparisons to a
wider range of PI (= 9 – 87). The absolute errors for each predictive method are presented
according to the following equation:
�������������%� = ��′� − �′�,�� [Eq. 1]
In which, σ'p and σ'p,i are the predicted and imposed (measured) pre-consolidation pressures,
respectively. In general, as shown in Figs. 5 to 7, all methods tend to overestimate σ'p which can
lead to an unsafe stability analysis or the underestimation of consolidation settlement of
structures overlying compressible clay deposits.
These plots further indicate comparatively higher inaccuracies in predicting σ'p of samples with
lower PI. This is due to the greater ambiguity in identifying the point of maximum curvature of
Page 10 of 34
https://mc06.manuscriptcentral.com/cgj-pubs
Canadian Geotechnical Journal
Page 12
Draft
11
these samples. For example, as illustrated in Fig. 2(b), a rounded curvature was observed in the e
- log(σ'v) consolidation plot of North Toronto silty clay specimen (PI = 11.0) which produced a
relatively gentle transformation from recompression to virgin compression behavior compared to
the Port Colborne clay specimen (PI = 14.8) in Fig. 2(a). The lack of a sharp curvature obscured
the point of significant change in consolidation behavior and hence σ'p. More plastic clays
(higher PI) exhibit sharp curvatures in e – log (σ'v) diagrams with well-defined breaks at the
vicinity of σ'p and this would produce an overall higher degree of accuracy.
In order to facilitate comparison of the overall accuracies of the methods employed in this study,
the magnitudes of errors are aggregated using the Root Mean Square Error (RMSE) as below:
��� = �∑ ����,� ���!"#$% [Eq. 2]
RMSE presents the standard deviation (residuals) of the differences between σ'p and σ'p,i
(Hyndman and Koehler 2006). Table 7 ranks the overall accuracies of the methods analyzed here
based on each method’s RMSE from both IL and CRS test results. The ranges and average
magnitudes of errors (σ'p – σ'p,i) are also provided for comparison, which can be used as a
guideline for reporting the possible overestimation (positive error) or underestimation (negative
error) of σ'p determined from each of the empirical methods. Fig. 8 further provides a clearer
comparison of the RMSE and average errors for all methods.
According to Table 7 and Fig. 8, the first seven methods (Becker, et al. 1987; Boone, 2010;
Burland 1990; Butterfield 1979; Jose et al. 1989; Oikawa 1987; Onitsuka et al. 1995) show
more-or-less comparable errors in predicting σ'p, with the Oikawa (1987) and Burland (1990)
Page 11 of 34
https://mc06.manuscriptcentral.com/cgj-pubs
Canadian Geotechnical Journal
Page 13
Draft
12
procedures providing the lowest overall RMSE and average error, respectively. These methods
provided more accurate estimations of σ'p (with lower average errors and RMSE), and hence
their applications would be safer and more conservative. In fact, careful examination of data in
Tables 4 to 6 indicates that these procedures (in particular Oikawa, Onitsuka et al. Butterfield,
and Boone methods) provide similar estimates of σ'p. Previous studies (Boone 2010; Grozic, et
al. 2003; Jose et al. 1989; Onitsuka et al. 1995; Sridharan 1991) have often compared the
accuracy of some of these methods based on different recompression and compression ranges of
σ'v for each method and they have proposed an apparently improved graphical method using
biased ranges of recompression and compression segments to show a higher accuracy. Whereas
in this study, precisely the same recompression, compression, and maximum curvature points
(for Casagrande and Jacobsen methods) are consistently used with all methods in order to make
an unbiased comparison of σ'p estimates.
The aforementioned methods are followed by Casagrande (1936), Pacheco Silva (1970), and
Wang and Frost (2004) techniques with increasing RMSE and average errors. Note that σ'p
estimated based on Jacobsen’s method displayed extremely large errors and they are not shown
in the histograms of Fig. 8. Among the work/energy methods (in Fig. 7), Becker et al.’s method
provides better predictions of σ'p (with an average error of 15.6 kPa) compared to the newer and
updated method of Wang and Frost (2004) displaying an average error of 23.5 kPa. Note that
despite the smaller average error (= 15.6 kPa) of Becker et al.’s method, its greater range of
deviation (164.1 to -43.2 kPa) leads to its poorer overall RMSE and accuracy. Moreover,
although Casagrande’s method (with an average deviation of 33.1 kPa) is often recommended in
most textbooks, codes (ASTM 2011a), and laboratory manuals, the accuracy of its predictions
are among the lowest. The inferior accuracy of Casagrande’s and Jacobsen’s procedures is
Page 12 of 34
https://mc06.manuscriptcentral.com/cgj-pubs
Canadian Geotechnical Journal
Page 14
Draft
13
particularly associated with their high emphasize placed on data points close to σ'p where the e -
log(σ'v) curve displays it’s greatest non-linearity. As a result, the perceived point of maximum
curvature of the e - log(σ'v) data and hence the determination of σ'p become dependent on the
scale of the void ratio axis. The higher inaccuracy of Jacobsen’s method is not surprising
considering its arbitrary suggestion of σ'p equal to 2.5 times the stress at the point of maximum
curvature of the e - log(σ'v) diagram. These can significantly limit the confidence and reliability
of σ'p determination from these approaches, in particular by less experienced analysts and
engineers. However, all of the other methods are free of these defects as they do not require the
maximum curvature point.
Furthermore, as compared in Fig. 8, the continuous compression curves from CRS tests were
generally effective in reducing the amount of errors in most methods. However, a number of
methods (Boone 2010; Butterfield 1979; Pacheco Silva 1970; Wang and Frost 2004) show
particularly greater errors in predicting σ'p from IL tests that those from CRS tests. These
methods are thus better suited for interpreting CRS tests which provide continuous data
(compared to limited load increments in IL tests). One the other hand, Oikawa (1987), Jose et al.
(1989), and Becker et al. (1987) exhibit similar performances in predicting σ'p from CRS and IL
tests.
It is finally noted that cementation bonds and aging may develop during and after sedimentation
in the field, and produce an apparent preconsolidation effect and increase the in-situ
preconsolidation pressure (Lunne et al. 2006). On the other hand, disturbance during sampling,
transportation and laboratory specimen preparation could partly destroy the effects of aging and
cementation. Hence sample disturbance could partly compensate the general overestimation of
Page 13 of 34
https://mc06.manuscriptcentral.com/cgj-pubs
Canadian Geotechnical Journal
Page 15
Draft
14
σ'p by the predictive methods examined here. Although, precise quantification of sample
disturbance effects can be difficult and variable.
Conclusions
The accuracies of 11 methods for interpreting pre-consolidation pressure from laboratory
consolidation tests were evaluated in this study. A total of 30 controlled-rate of strain (CRS) and
incrementally-loaded (IL) consolidation tests were carried on three Canadian silty clays.
Compared to incremental loading, CRS tests provided significantly more data points which
facilitated the interpretation procedures and improved their overall prediction accuracy. The
comparisons indicated that all methods would mostly overestimate σ'p, which can reduce the
conservatism of settlement or stability analysis in fine-grained soils. The overall accuracy of σ'p
predictions improved with increasing plasticity (PI) because of the sharper curvature of the
consolidation curve, and hence the higher confidence in detecting the point of maximum
curvature from consolidation data.
The accuracies of σ'p predictions from different methods were compared based on the aggregated
root mean square errors (RMSE) as well as the averages and the ranges of errors for each
method. Among the 11 methods examined in this study, a bi-logarithmic graphical technique
suggested by Oikawa (1987) was found to provide the most accurate predictions of σ'p with an
average overestimation potential of 16.8 kPa. According to this method, σ'p is simply established
from oedometer tests at the intersection point of tangent lines to the recompression and
compression segments of soil compression data in a log(1+e) versus log(σ'v) plot. Oikawa’s
method therefore provided an ideal combination of simplicity, quick interpretation and improved
accuracy, and it is recommended in this study for determining σ'p. This was verified by the
Page 14 of 34
https://mc06.manuscriptcentral.com/cgj-pubs
Canadian Geotechnical Journal
Page 16
Draft
15
extensive database of one-dimensional consolidation experiments on several clay samples in this
study. Next to Oikawa (1987), a number of other bi-linear plotting methods also provided close
estimates of the known pre-consolidation pressures. On the other hand, Casagrande (1936)
classical method provided relatively inaccurate predictions of σ'p, with an average deviation of
33.1 kPa. The average and the ranges of errors established in this study further provide an
opportunity to recognize the potential inaccuracy of each method and devise adequate safety
factors for settlement or stability analysis.
References:
ASTM 2007. "Standard D422: Standard Test Method for Particle-Size Analysis of Soils."
Annual Book of ASTM Standards, ASTM International, West Conshohocken, PA.
ASTM 2010. "Standard D4318: Standard Test Methods for Liquid Limit, Plastic Limit, and
Plasticity Index of Soils." Annual Book of ASTM Standards, ASTM International, West
Conshohocken, PA.
ASTM 2011a. "Standard D2435: Standard Test Methods for One-Dimensional Consolidation
Properties of Soils Using Incremental Loading." Annual Book of ASTM Standards,
ASTM International, West Conshohocken, PA.
ASTM 2011b. "Standard D2487: Standard Practice for Classification of Soils for Engineering
Purposes (Unified Soil Classification System)." Annual book of ASTM Standards, ASTM
International, West Conshohocken, PA.
ASTM 2012. "Standard D4186: Standard Test Method for One-Dimensional Consolidation
Properties of Saturated Cohesive Soils Using Controlled-Strain Loading." Annual Book of
ASTM Standards, ASTM International, West Conshohocken, PA.
Page 15 of 34
https://mc06.manuscriptcentral.com/cgj-pubs
Canadian Geotechnical Journal
Page 17
Draft
16
Becker, D. E., Crooks, J. H. A., Been, K., and Jefferies, M. G. 1987. "Work as a criterion for
determining in situ and yield stresses in clays." Canadian Geotechnical Journal, 24, 549
- 564.
Boone, S. J. 2010. "A critical reappraisal of ‘‘preconsolidation pressure’’ interpretations using
the oedometer test." Canadian Geotechnical Journal, 47, 281 - 296.
Burland, J. B. 1990. "On the compressibility and shear strength of natural clays." Geotechnique,
40(3), 329 - 378.
Butterfield, R. 1979. "A natural compression law for soils (an advance on e-log p')."
Geotechnique, 29(4), 469 - 480.
Casagrande, A. 1936. "Determination of preconsolidation load and its practical significance."
First International Conference on Soil Mechanics and Foundation Engineering,
Cambridge, Massachusetts, 22-26 June, 1936, 60 - 64.
Grozic, J. L. H., Lunne, T., and Pande, S. 2003. "An oedometer test study on the
preconsolidation stress of glaciomarine clays." Canadian Geotechnical Journal, 40(5),
857 - 872.
Grozic, J. L. H., Lunne, T., and Pande, S. 2005. "Reply to the discussion by Clementino on ‘‘An
oedometer test study on the preconsolidation stress of glaciomarine clays"." Canadian
Geotechnical Journal, 42(3), 975 - 976.
Hyndman, R. J., and Koehler, A. B. 2006. "Another look at measures of forecast accuracy."
International Journal of Forecasting, 22(4), 679 - 688.
Jacobsen, H. M. 1992. "Bestemmelse af forbelastningstryk I laboratoriet." Nordiske
Geotecknikermøde NGM-92, Aalborg, 28–30 May 1992, 455 - 460.
Page 16 of 34
https://mc06.manuscriptcentral.com/cgj-pubs
Canadian Geotechnical Journal
Page 18
Draft
17
Jamiolkowski, M., Ladd, C. C., Germaine, J. T., and Lancelotta, R. 1985. "New developments in
field and laboratory testing of soils." Proc., Proceedings of the 11th
International
Conference on Soil Mechanics and Foundation Engineering, A.A.Balkema, 57-153.
Janbu, N. 1967. "Settlement calculations based on the tangent modulus concept." Soil Mechanics
and Foundation Engineering, The Technical University of Norway, Trondheim, 32.
Jose, B. T., Sridharan, A., and Abraham, B. M. 1989. "Log-Log method for determination of
preconsolidation pressure." Geotechnical Testing Journal, ASTM, 12(3), 230 - 237.
Ladd, C. C., and Foote, R. 1974. "A new design procedure for stability of soft clays." Journal of
the Geotechnical Engineering Division, ASCE, 100(GT7), 763 - 786.
Leonards, G. A., and Altschaeffl, A. G. 1964. "Compressibility of clay." Journal of Soil
Mechanics and Foundations Division, ASCE, 90(SM5), 133 - 155.
Lunne, T., Berre, K. H., Andersen, M., Sjursen, M., and Mortensen, N. 2008. "Effects of sample
disturbance on consolidation behaviour of soft marine Norwegian clays." Proc., Third
International Conference on Site Characterization, ISC'3, Taylor & Francis Group,
London, UK, 1471 - 1479.
Lunne, T., Berre, T., Andersen, K. H., Strandvik, S., and Sjursen, M. 2006. "Effects of sample
disturbance and consolidation procedures on measured shear strength of soft marine
Norwegian clays." Canadian Geotechnical Journal, 43, 726 - 750.
Mesri, G., and Choi, Y. K. 1985. "The uniqueness of the end-of-primary (EOP) void ratio-
effective stress relationships." Proceedings of International Conference of Soil
Mechanics and Foundation Engineering (ICSMFE), San Francisco, 587-590.
Mesri, G., and Godlewski, P. M. 1977. "Time- and stress-compressibility interrelationship."
Journal of the Geotechnical Engineering Division, 103(GT5), 417-430.
Page 17 of 34
https://mc06.manuscriptcentral.com/cgj-pubs
Canadian Geotechnical Journal
Page 19
Draft
18
Mesri, G., and Shahien, M. 1994. "Discussion: Preconsolidation versus aging behvaior of
Kaolinite clay." Journal of Geotechnical Engineering, ASCE, 120(9), 1643 - 1645.
Oikawa, H. 1987. "Compression curve of soft soils." Soils and Foundations, 27(3), 99 - 104.
Onitsuka, K., Hong, Z., Hara, Y., and Shigeki, Y. 1995. "Interpretation of oedometer test data for
natural clays." Soils and Foundations, 35(3), 61 - 70.
Pacheco Silva, F. 1970. "A new graphical construction for determination of the pre-consolidation
stress of a soil sample." Proceedings of the 4th
Brazilian Conference on Soil Mechanics
and Foundation Engineering, Rio de Janeiro, Brazil, 225 - 232.
Schmertmann, J. N. M. 1955. "The undisturbed consolidation behavior of clay." From Research
to Practice in Geotechnical Engineering, Transactions of the American Society of Civil
Engineers, American Society of Civil Engineers (ASCE), 1201-1233.
Sheahan, T. C., and Watters, P. J. 1997. "Experimental verification of CRS consolidation
theory." Journal of Geotechnical and Geoenvironmental Engineering, ASCE, 123(5), 430
- 437.
Sridharan, J. B. T. 1991. "Improved technique for estimation of preconsolidation pressure."
Geotechnique, 41(2), 263 - 268.
Wang, L. B., and Frost, J. D. 2004. "Dissipated strain energy method for determining
preconsolidation pressure." Canadian Geotechnical Journal, 41, 760 - 768.
Wroth, C. P. 1984. "The interpretation of in situ soil tests." Geotechnique, 34(4), 449 - 489.
Page 18 of 34
https://mc06.manuscriptcentral.com/cgj-pubs
Canadian Geotechnical Journal
Page 20
Draft
19
Figure Captions
Fig. 1: EOP consolidation curves for CRS consolidation tests P1 and S1 and the imposed pre-
consolidation pressures (σ'p,i)
Fig. 2: EOP consolidation curves for IL consolidation tests P7 and T5 and the imposed pre-
consolidation pressures (σ'p,i)
Fig. 3: Applications of (a) Casagrande (1936) and Jacobsen (1992), (b) Boone (2010) and
Pacheco Silva (1970), (c) Burland (1990), (d) Butterfield (1979), (e) Oikawa (1987), (f) Jose
et al. (1989), (g) Onitsuka et al. (1995), (h) Becker et al. (1987) and Wang and Frost (2004)
methods for estimating σ'p in CRS specimen P1 subjected to σ'p,i = 98.3 kPa
Fig. 4: Applications of (a) Casagrande (1936) and Jacobsen (1992), (b) Boone (2010) and
Pacheco Silva (1970), (c) Burland (1990), (d) Butterfield (1979), (e) Oikawa (1987), (f) Jose
et al. (1989), (g) Onitsuka et al. (1995), (h) Becker et al. (1987) and Wang and Frost (2004)
methods for estimating σ'p in IL specimen P7 subjected to σ'p,i = 150.0 kPa
Fig. 5: Comparisons of (a) σ'p,i with predictions, and (b) the ranges of absolute errors with PI for
the semi-logarithmic methods
Fig. 6: Comparisons of (a) σ'p,i with predictions, and (b) the ranges of absolute errors with PI for
the bi-logarithmic methods
Fig. 7: Comparisons of (a) σ'p,i with predictions, and (b) the ranges of absolute errors with PI for
the strain energy methods
Fig. 8: Comparison of (a) RMSE and (b) average errors of different methods in predicting σ'p
from CRS and IL tests.
Page 19 of 34
https://mc06.manuscriptcentral.com/cgj-pubs
Canadian Geotechnical Journal
Page 21
Draft
Fig. 1: EOP consolidation curve for CRS consolidation tests P1 and S1 and the imposed pre-consolidation pressures (σ'p,i)
142x223mm (300 x 300 DPI)
Page 20 of 34
https://mc06.manuscriptcentral.com/cgj-pubs
Canadian Geotechnical Journal
Page 22
Draft
Fig. 2: EOP consolidation curve for IL consolidation tests P7 and T5 and the imposed pre-consolidation pressures (σ'p,i)
142x223mm (300 x 300 DPI)
Page 21 of 34
https://mc06.manuscriptcentral.com/cgj-pubs
Canadian Geotechnical Journal
Page 23
Draft
Fig. 3: Applications of (a) Casagrande (1936) & Jacobsen (1992), (b) Boone (2010) & Pacheco Silva (1970), (c) Burland (1990), (d) Butterfield (1979), (e) Oikawa (1987), (f) Jose et al. (1989), (g) Onitsuka et al.
(1995), (h) Becker et al. (1987) & Wang and Frost (2004) methods for estimating σ'p in CRS specimen P1
subjected to σ'p,i = 98.3 kPa
273x387mm (300 x 300 DPI)
Page 22 of 34
https://mc06.manuscriptcentral.com/cgj-pubs
Canadian Geotechnical Journal
Page 24
Draft
Fig. 4: Applications of (a) Casagrande (1936) & Jacobsen (1992), (b) Boone (2010) & Pacheco Silva (1970), (c) Burland (1990), (d) Butterfield (1979), (e) Oikawa (1987), (f) Jose et al. (1989), (g) Onitsuka et al. (1995), (h) Becker et al. (1987) & Wang and Frost (2004) methods for estimating σ'p in IL specimen P7
subjected to σ'p,i = 150.0 kPa
273x387mm (300 x 300 DPI)
Page 23 of 34
https://mc06.manuscriptcentral.com/cgj-pubs
Canadian Geotechnical Journal
Page 25
Draft
Fig. 5: Comparisons of (a) σ'p,i with predictions, and (b) the ranges of absolute errors with PI for the semi-logarithmic methods
142x224mm (300 x 300 DPI)
Page 24 of 34
https://mc06.manuscriptcentral.com/cgj-pubs
Canadian Geotechnical Journal
Page 26
Draft
Fig. 6: Comparisons of (a) σ'p,i with predictions, and (b) the ranges of absolute errors with PI for the bi-logarithmic methods
141x223mm (300 x 300 DPI)
Page 25 of 34
https://mc06.manuscriptcentral.com/cgj-pubs
Canadian Geotechnical Journal
Page 27
Draft
Fig. 7: Comparisons of (a) σ'p,i with predictions, and (b) the ranges of absolute errors with PI for the strain energy methods
141x223mm (300 x 300 DPI)
Page 26 of 34
https://mc06.manuscriptcentral.com/cgj-pubs
Canadian Geotechnical Journal
Page 28
Draft
Fig. 8: Comparison of (a) RMSE and (b) average errors of different methods in predicting σ'p from CRS and IL tests.
142x224mm (300 x 300 DPI)
Page 27 of 34
https://mc06.manuscriptcentral.com/cgj-pubs
Canadian Geotechnical Journal
Page 29
Draft
Table 1: Summary of methods for predicting σ'p from consolidation tests data
Method Procedure basis Reference
Semi-logarithmic
Intersection of tangent to virgin compression data
with bisector of the angle between horizontal and
the tangent line at the maximum curvature of the e
– log(σ'v) plot
Casagrande (1936)
In-situ void ratio and tangent to the virgin
compression line in e - log(σ'v) diagram Pacheco Silva (1970)
Intersection of linear fit lines to the virgin
compression and recompression segments voids
index, IV = (e - e100)/Cc versus log(σ'v) where e100
is void ratio at σ'v = 100 kPa
Burland (1990)
2.5×(stress at the point of maximum curvature on
the e - log(σ'v) curve) Jacobsen (1992)
Intersection of the tangent line at the maximum
compression index and the line parallel to the
recompression line at the in-situ σ'v
Boone (2010)
Bi-logarithmic
Intersection of linear fit lines of ln(1+e) and
ln(σ'v) plotted on linear scales Butterfield (1979)
Intersection of linear fit lines of log(1+e) versus
log(σ'v) Oikawa (1987)
Intersection of linear fit lines to log(e) – log(σ'v)
curve Jose et al. (1989)
Intersection of linear fit lines to ln(1+e) and
log(σ'v) Onitsuka et al. (1995)
Constrained
modulus Marked drop of constrained modulus with σ'v in a
linear scale Janbu (1967)
Strain energy
(work/unit volume)
Sharp increase of total strain energy density with
increasing σ'v Becker et al. (1987)
Graphical construction of dissipated strain energy
versus effective vertical stress. Dissipated strain
energy calculated from the subtraction of elastic
strain energy from total strain energy.
Wang and Frost (2004)
Page 28 of 34
https://mc06.manuscriptcentral.com/cgj-pubs
Canadian Geotechnical Journal
Page 30
Draft
Table 2: Basic characteristics of the clay samples used in this study
Clay Silt (%) Clay (%) LL PL PI
Port Colborne clay 93.3 6.7 35.1 20.3 14.8
Sombra clay 71.0 29.0 46.0 22.0 24.0
North Toronto clay 55 – 87 12 – 45 32 – 48 11 – 23 9 – 23
Page 29 of 34
https://mc06.manuscriptcentral.com/cgj-pubs
Canadian Geotechnical Journal
Page 31
Draft
Table 3: Characteristics and σ'p imposted in the experiments of this study
Test Soil Specimen ωωωωo (%) Test No. Imposed σσσσ'p,i
(kPa)
CRS
Port Colborne clay
P1 26.9
1 98.3 2 218.6 3 330.0
P2 32.2 1 107.5 2 208.4
P3 31.7 1 147.2 2 319.4
P4 30.3
1 87.8 2 193.6 3 315.7
P5 40.2
1 109.8 2 211.5 3 363.6 4 516.2
P6 26.8
1 106.5 2 260.1 3 412.9
Sombra clay S1 34.3
1 106.7 2 318.1 3 522.3
North Toronto Clay
T1 32.5 1 101.4 T2 30.9 1 103.3 T3 28.3 1 100.9
IL
Port Colborne clay P7 19.4 1 150.0
North Toronto Clay
T4 35.4 1 273.2 T5 33.2 1 385.7 T6 31.0 1 350.0 T7 39.5 1 273.2 T8 28.4 1 275.0 T9 51.7 1 300.0
Page 30 of 34
https://mc06.manuscriptcentral.com/cgj-pubs
Canadian Geotechnical Journal
Page 32
Draft
Table 4: Summary of pre-consolidation pressures obtained using the semi-logarithmic predictive
methods
σ'p,i
(kPa) PI
σ'p (kPa)
Boone
(2010)
Burland
(1990)
Casagrande
(1936)
Jacobsen
(1992)
Pacheco
Silva (1970)
98.3 14.8 102 102 104 243 103
218.6 14.8 222 222 236 559 226
330.0 14.8 326 326 361 808 342
107.5 14.8 104 104 120 245 112
208.4 14.8 220 217 234 521 224
147.2 14.8 144 144 170 370 159
319.4 14.8 303 310 311 400 328
87.8 14.8 94 94 103 242 95
193.6 14.8 195 195 203 377 204
315.7 14.8 318 318 353 731 350
109.8 14.8 101 101 117 193 109
211.5 14.8 217 217 246 521 238
363.6 14.8 378 378 373 669 389
516.2 14.8 520 521 534 1027 539
106.5 14.8 122 122 134 262 124
260.1 14.8 261 263 278 615 270
412.9 14.8 413 415 447 894 450
106.7 24.0 110 110 129 292 114
318.1 24.0 257 258 267 366 282
522.3 24.0 520 523 525 985 518
101.4 10.0 158 158 179 255 194
103.3 10.0 106 106 108 269 105
100.9 12.0 223 221 246 191 270
150.0 14.8 174 174 200 375 197
273.2 19.0 357 358 380 342 426
385.7 11.0 436 436 518 964 461
350.0 15.0 308 308 350 875 313
273.2 23.0 337 332 357 546 343
275.0 12.0 307 307 332 688 312
300.0 22.0 283 283 286 750 283
Page 31 of 34
https://mc06.manuscriptcentral.com/cgj-pubs
Canadian Geotechnical Journal
Page 33
Draft
Table 5: Summary of pre-consolidation pressures obtained using the bi-logarithmic predictive
methods
σ'p,i
(kPa) PI
σ'p (kPa)
Butterfield
(1979)
Jose et al.
(1989)
Oikawa
(1987)
Onitsuka et al.
(1995)
98.3 14.8 103 104 103 103
218.6 14.8 222 224 224 223
330.0 14.8 329 329 328 327
107.5 14.8 105 106 105 105
208.4 14.8 222 223 221 221
147.2 14.8 145 147 145 145
319.4 14.8 303 305 303 304
87.8 14.8 94 95 94 94
193.6 14.8 195 196 195 195
315.7 14.8 319 320 319 319
109.8 14.8 102 103 102 102
211.5 14.8 219 219 218 218
363.6 14.8 379 380 379 379
516.2 14.8 523 526 523 523
106.5 14.8 122 124 123 123
260.1 14.8 263 262 263 261
412.9 14.8 414 417 415 414
106.7 24.0 112 113 112 112
318.1 24.0 259 261 259 259
522.3 24.0 522 524 521 522
101.4 10.0 165 174 165 165
103.3 10.0 108 109 107 107
100.9 12.0 229 241 228 228
150.0 14.8 176 181 176 176
273.2 19.0 364 373 364 364
385.7 11.0 448 466 448 448
350.0 15.0 309 310 309 309
273.2 23.0 343 373 344 344
275.0 12.0 309 313 309 309
300.0 22.0 285 288 286 286
Page 32 of 34
https://mc06.manuscriptcentral.com/cgj-pubs
Canadian Geotechnical Journal
Page 34
Draft
Table 6: Summary of pre-consolidation pressures obtained using the strain energy predictive
methods
σ'p,i
(kPa) PI
σ'p (kPa)
Becker et al.
(1987)
Wang and Frost
(2004)
98.3 14.8 102 102
218.6 14.8 223 221
330.0 14.8 336 335
107.5 14.8 110 111
208.4 14.8 224 221
147.2 14.8 152 148
319.4 14.8 316 306
87.8 14.8 96 93
193.6 14.8 199 198
315.7 14.8 329 328
109.8 14.8 109 108
211.5 14.8 227 224
363.6 14.8 383 382
516.2 14.8 534 533
106.5 14.8 128 139
260.1 14.8 266 264
412.9 14.8 423 424
106.7 24.0 115 114
318.1 24.0 275 275
522.3 24.0 531 525
101.4 10.0 206 205
103.3 10.0 107 106
100.9 12.0 265 264
150.0 14.8 187 187
273.2 19.0 399 400
385.7 11.0 525 522
350.0 15.0 316 316
273.2 23.0 336 337
275.0 12.0 318 318
300.0 22.0 282 283
Page 33 of 34
https://mc06.manuscriptcentral.com/cgj-pubs
Canadian Geotechnical Journal
Page 35
Draft
Table 7: Comparison of accuracy and RMSE values of the empirical methods evaluated in this
study
Accuracy
ranking Method
No. of
Analysis
Average
Error (kPa)
Error Range
(kPa) RMSE
1 Oikawa (1987) 55 16.8 127.1 to -59.2 33.2
2 Burland (1990) 34 11.6 120.3 to -60.6 34.1
3 Boone (2010) 30 11.7 210.0 to -60.7 36.6
4 Onitsuka et al. (1995) 34 13.1 127.3 to -59.0 36.8
5 Jose et al. (1989) 45 16.8 139.9 to -57.1 37.7
6 Butterfield (1979) 31 15.8 127.8 to -59.0 40.3
7 Becker et al. (1987) 58 15.6 164.1 to -43.2 41.2
8 Casagrande (1936) 75 33.1 145.4 to -50.7 44.3
9 Pacheco Silva (1970) 34 23.9 168.9 to -36.6 49.5
10 Wang and Frost (2004) 31 23.5 163.5 to -43.5 52.5
11 Jacobsen (1992) 30 276.9 578.7 to -48.3 317.7
Page 34 of 34
https://mc06.manuscriptcentral.com/cgj-pubs
Canadian Geotechnical Journal