45
| 1 DRAFTKINGS INVESTOR DAY MARCH 2021

| 1
DRAFTKINGS INVESTOR DAYMARCH 2021
| 2
Legal disclaimer
No Offer or Solicitation
This presentation does not constitute a solicitation of a proxy, consent or authorization with respect to any securities of DraftKings Inc. (“DraftKings”, “the Company”, “we” or “us”). This presentation also doesnot constitute an offer to sell or the solicitation of an offer to buy securities, nor will there be any sale of securities in any state or jurisdiction in which such offer, solicitation or sale would be unlawful prior toregistration or qualification under the securities laws of any such jurisdiction. No offering of securities will be made except by means of a prospectus meeting the requirements of Securities Act of 1933, asamended, or an exemption therefrom.
Industry and Market Data
This presentation includes information and statistics regarding market participants in the sectors in which DraftKings competes and other industry data which was obtained from third-party sources, includingreports by market research firms and company filings.
Trademarks
This presentation may contain trademarks, service marks, trade names and copyrights of other companies, which are the property of their respective owners. Solely for convenience, some of the trademarks,service marks, trade names and copyrights referred to in this presentation may be listed without the TM, SM © or ® symbols, but we will assert, to the fullest extent under applicable law, the rights of theapplicable owners, if any, to these trademarks, service marks, trade names and copyrights.
Use of Non-GAAP Financial Matters
This presentation includes non-GAAP financial measures, including EBITDA and Adjusted EBITDA. We believe that these non-GAAP measures are useful to investors for two principal reasons. First, we believethese measures may assist investors in comparing performance over various reporting periods on a consistent basis by removing from operating results the impact of items that do not reflect core operatingperformance. Second, these measures are used by DraftKings’ management to assess its performance and may (subject to the limitations described below) enable investors to compare the performance of theCompany to its competition. We believe that the use of these non-GAAP financial measures provides an additional tool for investors to use in evaluating ongoing operating results and trends. These non-GAAPmeasures should not be considered in isolation from, or as an alternative to, financial measures determined in accordance with GAAP. Other companies may calculate these non-GAAP financial measuresdifferently, and therefore such financial measures may not be directly comparable to similarly titled measures of other companies.
Projected Financial Information
This presentation contains financial forecasts, which were prepared in good faith by DraftKings on a basis believed to be reasonable. Such financial forecasts have not been prepared in conformity with generallyaccepted accounting principles (“GAAP”). DraftKings’ independent auditors have not audited, reviewed, compiled or performed any procedures with respect to the projections for the purpose of their inclusionin this presentation, and accordingly, they have not expressed an opinion nor provided any other form of assurance with respect thereto for the purpose of this presentation. These projections are for illustrativepurposes only and should not be relied upon as being necessarily indicative of future results. Certain of the above-mentioned projected information has been provided for purposes of providing comparisonswith historical data. The assumptions and estimates underlying the prospective financial information are inherently uncertain and are subject to a wide variety of significant business, economic and competitiverisks and uncertainties that could cause actual results to differ materially from those contained in the prospective financial information. Projections are inherently uncertain due to a number of factors outside ofDraftKings’ control. Accordingly, there can be no assurance that the prospective results are indicative of the future performance of DraftKings or that actual results will not differ materially from those presentedin the prospective financial information. Inclusion of the prospective financial information in this presentation should not be regarded as a representation by any person that the results contained in theprospective financial information will be achieved.
| 3
Legal disclaimer (continued)
Forward-Looking Statements and Non-GAAP Financial Measures
This presentation, and the accompanying oral presentation, contain forward-looking statements within the meaning of Section 21E of the Securities Exchange Act of 1934, as amended, and the Private
Securities Litigation Reform Act of 1995, about us and our industry that involve substantial risks and uncertainties. All statements other than statements of historical facts contained in this presentation,
including statements regarding guidance, our future results of operations or financial condition, business strategy and plans, user growth and engagement, product initiatives, and objectives of
management for future operations, and the impact of the COVID-19 pandemic on our business and the economy as a whole, are forward-looking statements.
In some cases, you can identify forward-looking statements because they contain words such as “anticipate,” “believe,” “contemplate,” “continue,” “could,” “estimate,” “expect,” “forecast,” “going to,”
“intend,” “may,” “plan,” “potential,” “predict,” “project,” “propose”, “should,” “target,” “will,” or “would” or the negative thereof or comparable terminology, or by discussions of vision, strategy or
outlook. We caution you that the foregoing may not include all of the forward-looking statements made in this presentation.
You should not rely on forward-looking statements as predictions of future events. We have based the forward-looking statements contained in this presentation on our current expectations and
projections about future events and trends, including the ongoing COVID-19 pandemic, that we believe may affect our business, financial condition, results of operations, and prospects. These
forward-looking statements are subject to risks, uncertainties, and other factors, including those described in our filings with the Securities and Exchange Commission (the “SEC”), which are available
on the SEC’s website at www.sec.gov.
In addition, the forward-looking statements in this presentation relate only to events as of the date on which the statements are made and are based on information available to us as of the date of
this presentation. We undertake no obligation to update any forward-looking statements made in this presentation to reflect events or circumstances after the date of this presentation or to reflect
new information or the occurrence of unanticipated events, including future developments related to the COVID-19 pandemic, except as required by law. We may not actually achieve the plans,
intentions, or expectations disclosed in our forward-looking statements, and you should not place undue reliance on our forward-looking statements. Our forward-looking statements do not reflect
the potential impact of any future acquisitions, mergers, dispositions or investments.

| 4
EXECUTIVE SUMMARY
| 5
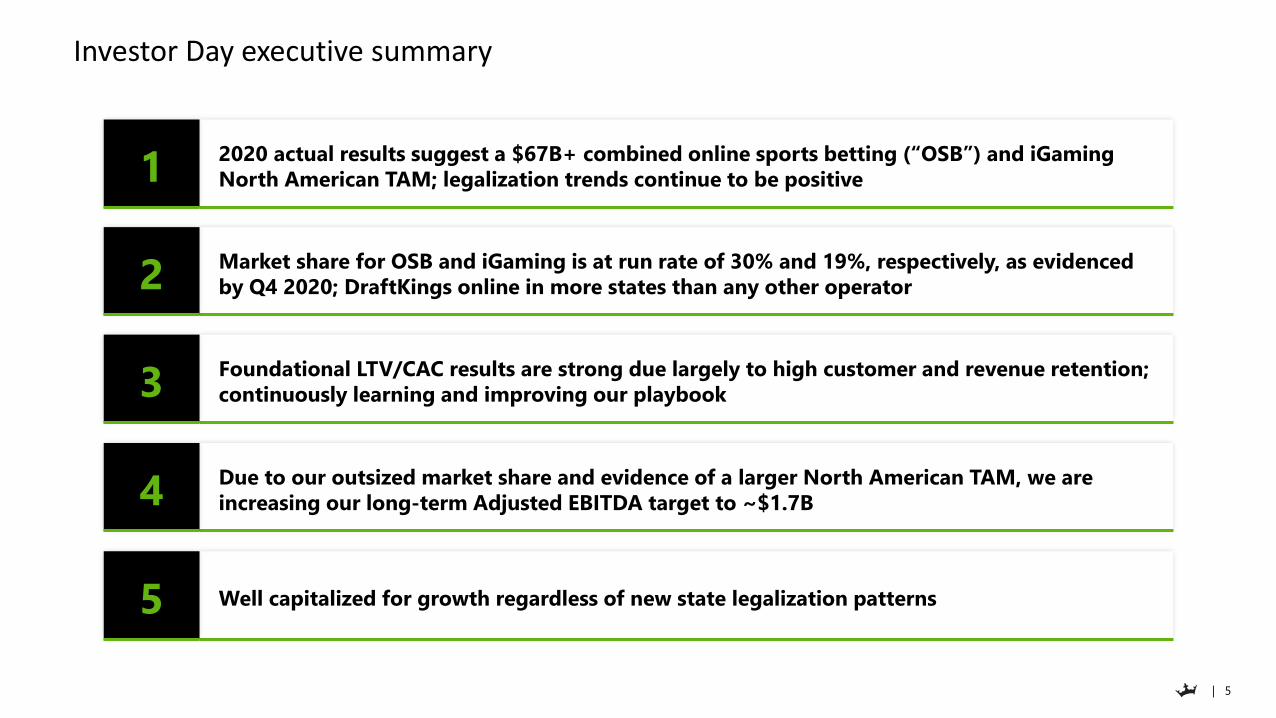
Investor Day executive summary
2020 actual results suggest a $67B+ combined online sports betting (“OSB”) and iGaming
North American TAM; legalization trends continue to be positive
Market share for OSB and iGaming is at run rate of 30% and 19%, respectively, as evidenced
by Q4 2020; DraftKings online in more states than any other operator
Foundational LTV/CAC results are strong due largely to high customer and revenue retention;
continuously learning and improving our playbook
Due to our outsized market share and evidence of a larger North American TAM, we are
increasing our long-term Adjusted EBITDA target to ~$1.7B
Well capitalized for growth regardless of new state legalization patterns
1
2
3
4
5

| 6
TAM AND LEGALIZATION
| 7
$23 $24 $24
$36
$29
$22
UK AU U.S.
Population Method GDP Method
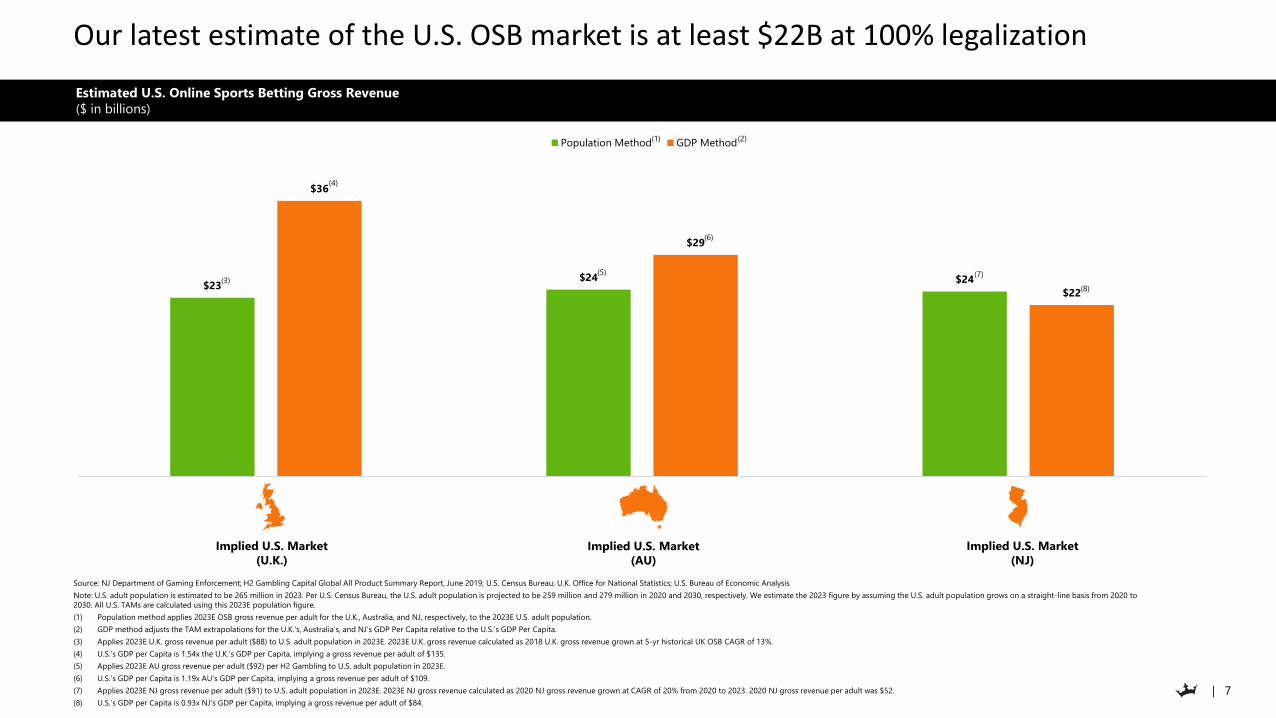
Estimated U.S. Online Sports Betting Gross Revenue
($ in billions)
Our latest estimate of the U.S. OSB market is at least $22B at 100% legalization
Source: NJ Department of Gaming Enforcement; H2 Gambling Capital Global All Product Summary Report, June 2019; U.S. Census Bureau; U.K. Office for National Statistics; U.S. Bureau of Economic Analysis
Note: U.S. adult population is estimated to be 265 million in 2023. Per U.S. Census Bureau, the U.S. adult population is projected to be 259 million and 279 million in 2020 and 2030, respectively. We estimate the 2023 figure by assuming the U.S. adult population grows on a straight-line basis from 2020 to
2030. All U.S. TAMs are calculated using this 2023E population figure.
(1) Population method applies 2023E OSB gross revenue per adult for the U.K., Australia, and NJ, respectively, to the 2023E U.S. adult population.
(2) GDP method adjusts the TAM extrapolations for the U.K.’s, Australia’s, and NJ’s GDP Per Capita relative to the U.S.’s GDP Per Capita.
(3) Applies 2023E U.K. gross revenue per adult ($88) to U.S. adult population in 2023E. 2023E U.K. gross revenue calculated as 2018 U.K. gross revenue grown at 5-yr historical UK OSB CAGR of 13%.
(4) U.S.’s GDP per Capita is 1.54x the U.K.’s GDP per Capita, implying a gross revenue per adult of $135.
(5) Applies 2023E AU gross revenue per adult ($92) per H2 Gambling to U.S. adult population in 2023E.
(6) U.S.’s GDP per Capita is 1.19x AU’s GDP per Capita, implying a gross revenue per adult of $109.
(7) Applies 2023E NJ gross revenue per adult ($91) to U.S. adult population in 2023E. 2023E NJ gross revenue calculated as 2020 NJ gross revenue grown at CAGR of 20% from 2020 to 2023. 2020 NJ gross revenue per adult was $52.
(8) U.S.’s GDP per Capita is 0.93x NJ’s GDP per Capita, implying a gross revenue per adult of $84.
Implied U.S. Market
(NJ)
Implied U.S. Market
(U.K.)
Implied U.S. Market
(AU)
(1) (2)
(3)
(4)
(5)
(6)
(7)
(8)
| 8
$7.33
$12.88 $12.24
$11.87 $11.48
$6.03 $5.50
$3.50 $3.36 $3.29
$2.50
NJ NH CO IN IL PA D.C. OR WV IA RI
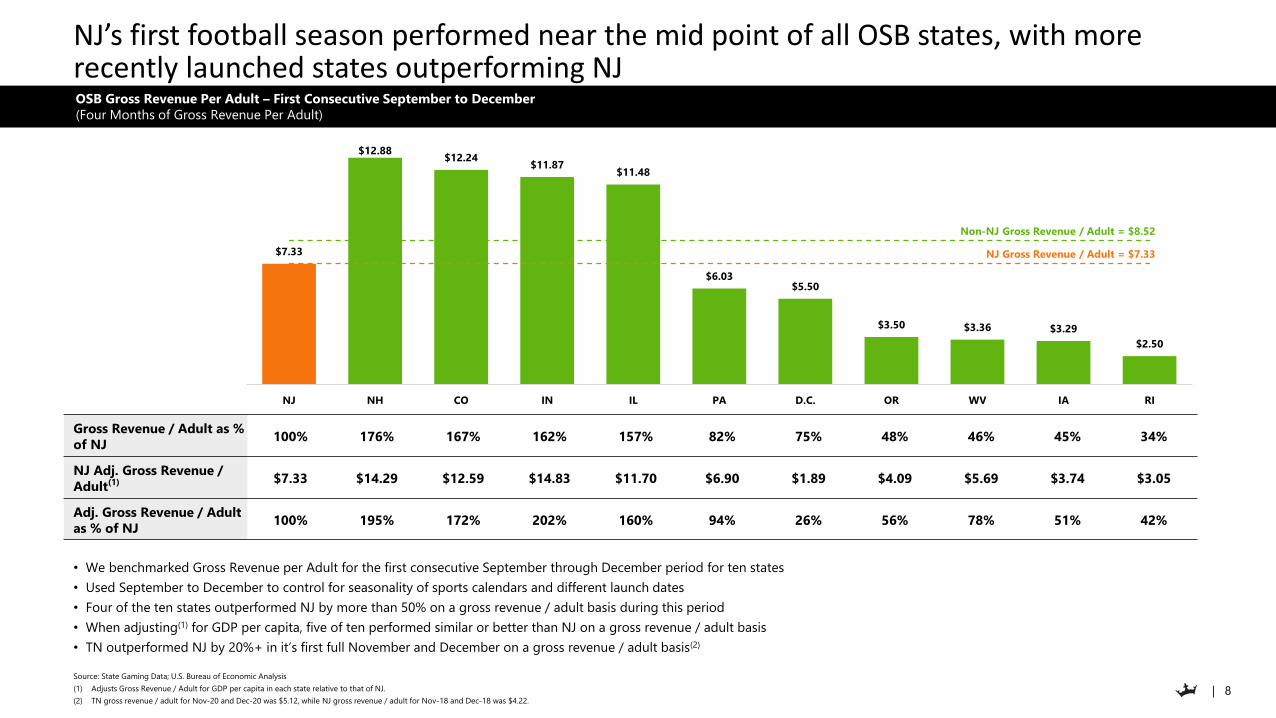
NJ’s first football season performed near the mid point of all OSB states, with more recently launched states outperforming NJ
• We benchmarked Gross Revenue per Adult for the first consecutive September through December period for ten states
• Used September to December to control for seasonality of sports calendars and different launch dates
• Four of the ten states outperformed NJ by more than 50% on a gross revenue / adult basis during this period
• When adjusting(1) for GDP per capita, five of ten performed similar or better than NJ on a gross revenue / adult basis
• TN outperformed NJ by 20%+ in it’s first full November and December on a gross revenue / adult basis(2)
Source: State Gaming Data; U.S. Bureau of Economic Analysis
(1) Adjusts Gross Revenue / Adult for GDP per capita in each state relative to that of NJ.
(2) TN gross revenue / adult for Nov-20 and Dec-20 was $5.12, while NJ gross revenue / adult for Nov-18 and Dec-18 was $4.22.
NJ Gross Revenue / Adult = $7.33
Non-NJ Gross Revenue / Adult = $8.52
OSB Gross Revenue Per Adult – First Consecutive September to December
(Four Months of Gross Revenue Per Adult)
Gross Revenue / Adult as %
of NJ100% 176% 167% 162% 157% 82% 75% 48% 46% 45% 34%
NJ Adj. Gross Revenue /
Adult(1) $7.33 $14.29 $12.59 $14.83 $11.70 $6.90 $1.89 $4.09 $5.69 $3.74 $3.05
Adj. Gross Revenue / Adult
as % of NJ100% 195% 172% 202% 160% 94% 26% 56% 78% 51% 42%
| 9
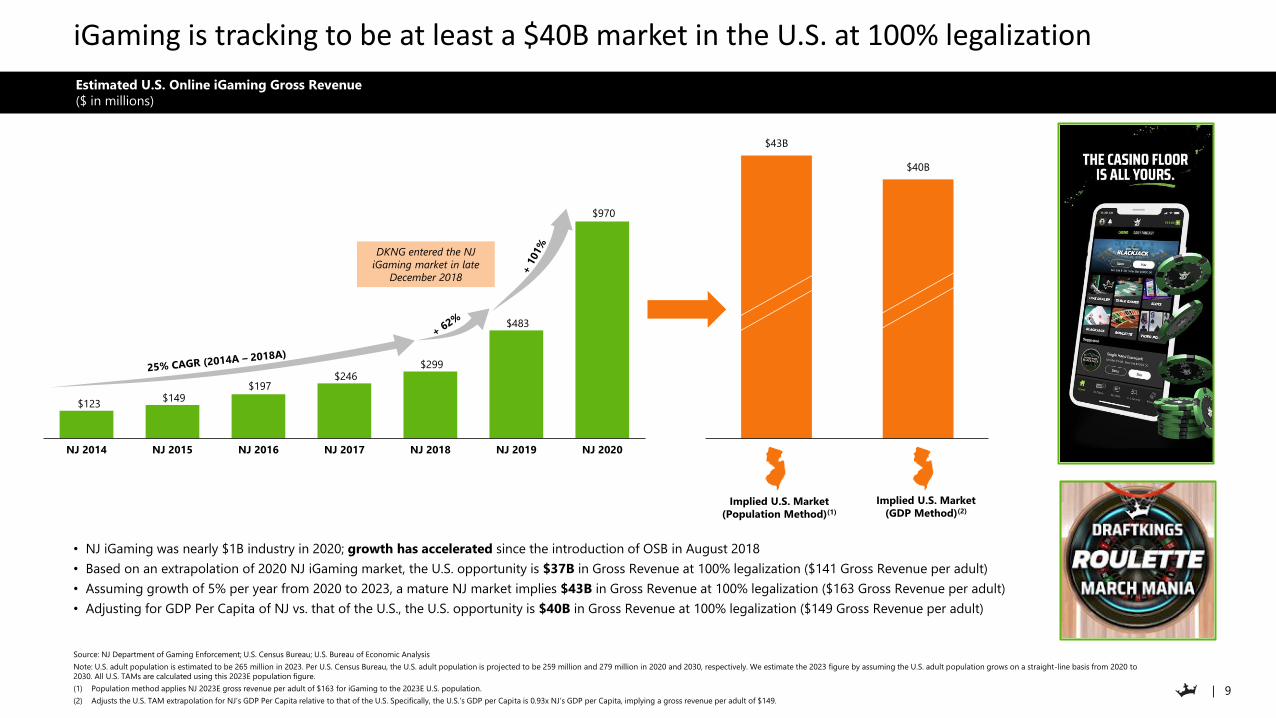
iGaming is tracking to be at least a $40B market in the U.S. at 100% legalization
• NJ iGaming was nearly $1B industry in 2020; growth has accelerated since the introduction of OSB in August 2018
• Based on an extrapolation of 2020 NJ iGaming market, the U.S. opportunity is $37B in Gross Revenue at 100% legalization ($141 Gross Revenue per adult)
• Assuming growth of 5% per year from 2020 to 2023, a mature NJ market implies $43B in Gross Revenue at 100% legalization ($163 Gross Revenue per adult)
• Adjusting for GDP Per Capita of NJ vs. that of the U.S., the U.S. opportunity is $40B in Gross Revenue at 100% legalization ($149 Gross Revenue per adult)
Source: NJ Department of Gaming Enforcement; U.S. Census Bureau; U.S. Bureau of Economic Analysis
Note: U.S. adult population is estimated to be 265 million in 2023. Per U.S. Census Bureau, the U.S. adult population is projected to be 259 million and 279 million in 2020 and 2030, respectively. We estimate the 2023 figure by assuming the U.S. adult population grows on a straight-line basis from 2020 to
2030. All U.S. TAMs are calculated using this 2023E population figure.
(1) Population method applies NJ 2023E gross revenue per adult of $163 for iGaming to the 2023E U.S. population.
(2) Adjusts the U.S. TAM extrapolation for NJ’s GDP Per Capita relative to that of the U.S. Specifically, the U.S.’s GDP per Capita is 0.93x NJ’s GDP per Capita, implying a gross revenue per adult of $149.
Estimated U.S. Online iGaming Gross Revenue
($ in millions)
$123 $149
$197 $246
$299
$483
$970
NJ 2014 NJ 2015 NJ 2016 NJ 2017 NJ 2018 NJ 2019 NJ 2020
$43B
$40B
NJ NJ
(GDP / Capita Adj.)
Implied U.S. Market
(Population Method)(1)
Implied U.S. Market
(GDP Method)(2)
DKNG entered the NJ
iGaming market in late
December 2018
| 10
Source: U.S. Census Bureau
Note: States within each category sorted by launch date where applicable. Live DKNG states sorted by DKNG launch date. Washington, DC is considered a state for the purposes of this page.
(1) Indicates states that have legalized sports betting in some form.
(2) Indicates states with online sportsbooks.
(3) Indicates states with legalized iGaming. Nevada has online poker only.
(4) Tennessee is the only state without retail sportsbooks.
(5) In New Mexico and Washington, sports betting is limited to provision by Native American tribes.
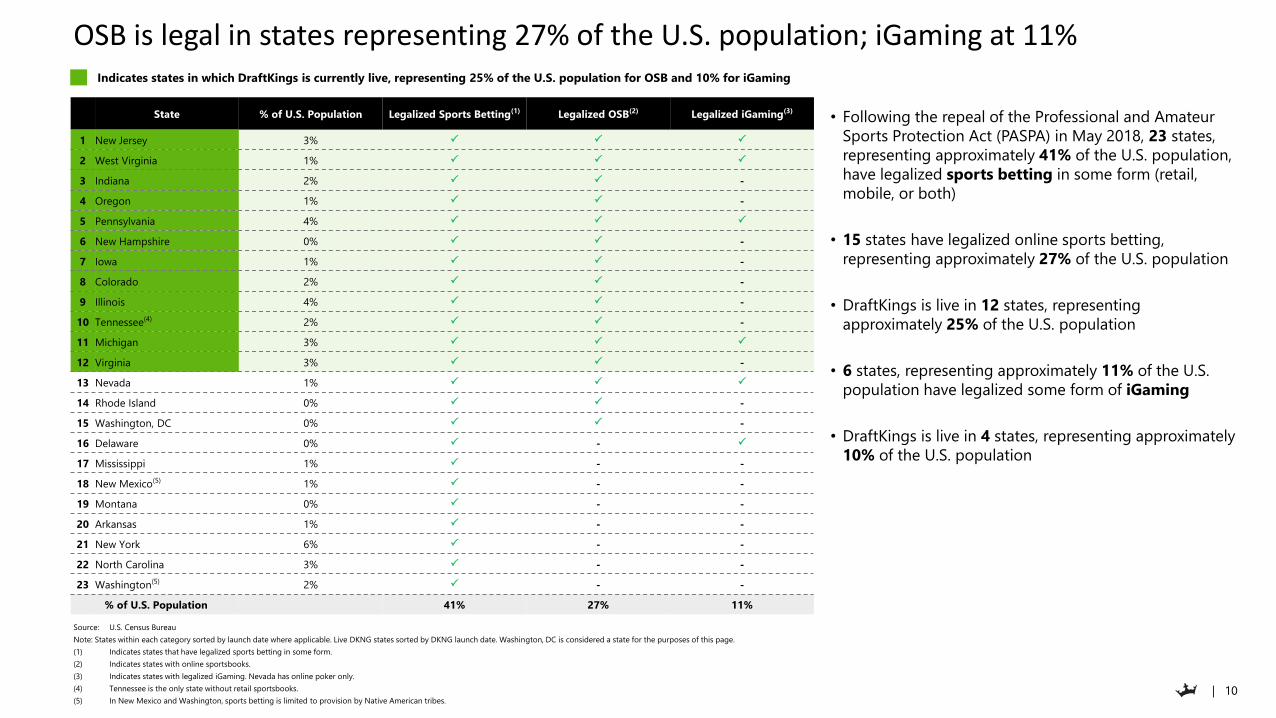
OSB is legal in states representing 27% of the U.S. population; iGaming at 11%
• Following the repeal of the Professional and Amateur
Sports Protection Act (PASPA) in May 2018, 23 states,
representing approximately 41% of the U.S. population,
have legalized sports betting in some form (retail,
mobile, or both)
• 15 states have legalized online sports betting,
representing approximately 27% of the U.S. population
• DraftKings is live in 12 states, representing
approximately 25% of the U.S. population
• 6 states, representing approximately 11% of the U.S.
population have legalized some form of iGaming
• DraftKings is live in 4 states, representing approximately
10% of the U.S. population
Indicates states in which DraftKings is currently live, representing 25% of the U.S. population for OSB and 10% for iGaming
State % of U.S. Population Legalized Sports Betting(1) Legalized OSB(2) Legalized iGaming(3)
1 New Jersey 3% P P P
2 West Virginia 1% P P P
3 Indiana 2% P P -
4 Oregon 1% P P -
5 Pennsylvania 4% P P P
6 New Hampshire 0% P P -
7 Iowa 1% P P -
8 Colorado 2% P P -
9 Illinois 4% P P -
10 Tennessee(4) 2% P P -
11 Michigan 3% P P P
12 Virginia 3% P P -
13 Nevada 1% P P P
14 Rhode Island 0% P P -
15 Washington, DC 0% P P -
16 Delaware 0% P - P
17 Mississippi 1% P - -
18 New Mexico(5) 1% P - -
19 Montana 0% P - -
20 Arkansas 1% P - -
21 New York 6% P - -
22 North Carolina 3% P - -
23 Washington(5) 2% P - -
% of U.S. Population 41% 27% 11%

| 11
Canadian OSB and iGaming TAM of $5B to $8B is a meaningful upside opportunity
Estimated Canadian Online Sports Betting and iGaming Gross Revenue
($ in billions)
• There was significant legislative momentum in Canada on both the federal and provincial level in 2020
• Legislation has been introduced at the federal level in Canada to legalize single event sports wagering
• The Ontario government’s 2020 provincial budget has paved the way for the province to authorize, license and regulate a competitive online sports betting and iGaming market
Source: U.S. Census Bureau; New Jersey Division of Gaming Enforcement; Statistics Canada; U.S. Bureau of Economic Analysis; World Bank
Note: Per Statistics Canada, the Canadian adult population is projected to be 31 million in 2023. All Canadian TAMs are calculated using this 2023E population figure.
(1) Population method applies NJ 2023E gross revenue per adult of $91 and $163 for OSB and iGaming, respectively, to the 2023E Canadian population.
(2) GDP method adjusts the TAM extrapolation for NJ’s GDP Per Capita relative to Canada’s GDP Per Capita. Specifically, Canada’s GDP per Capita is 0.66x NJ’s GDP per Capita, implying a gross revenue per adult of $59 and $107 for OSB and iGaming, respectively.
$3
$5
$2
$3
OSB iGaming
Population Method GDP Method
(2)
(1)
(1)
(2)
(1) (2)
| 12
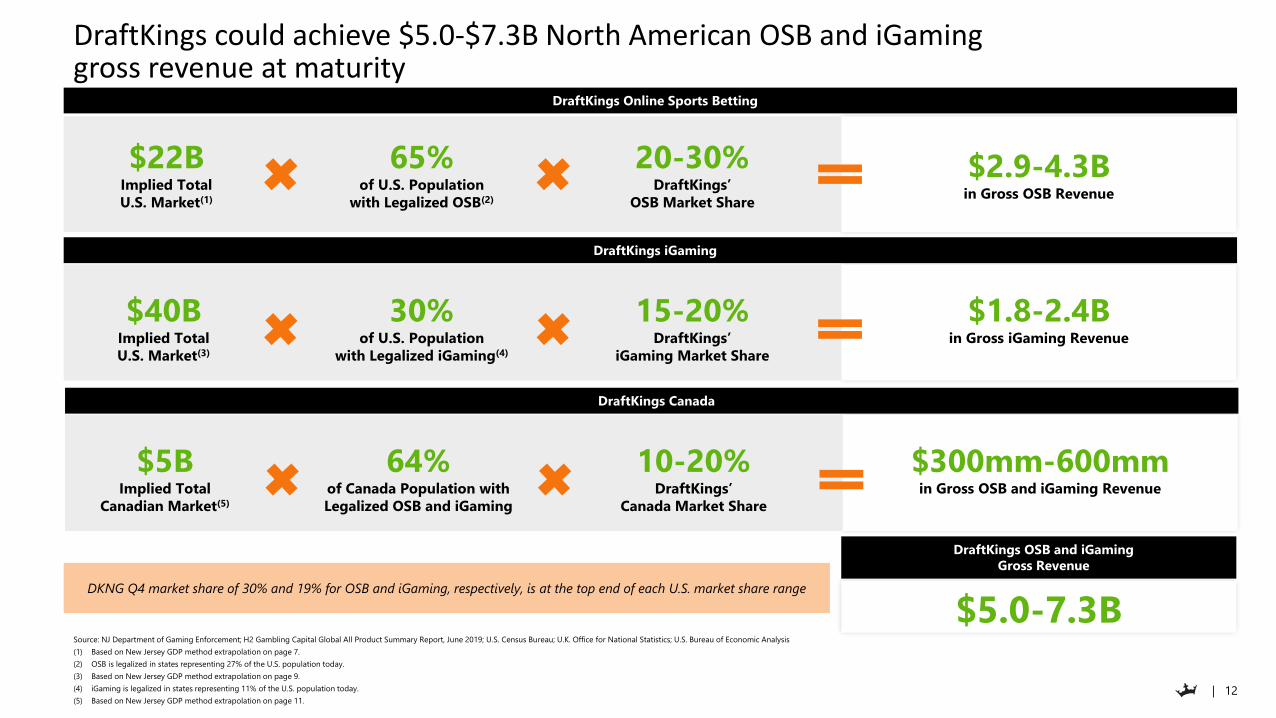
DraftKings could achieve $5.0-$7.3B North American OSB and iGaming gross revenue at maturity
Source: NJ Department of Gaming Enforcement; H2 Gambling Capital Global All Product Summary Report, June 2019; U.S. Census Bureau; U.K. Office for National Statistics; U.S. Bureau of Economic Analysis
(1) Based on New Jersey GDP method extrapolation on page 7.
(2) OSB is legalized in states representing 27% of the U.S. population today.
(3) Based on New Jersey GDP method extrapolation on page 9.
(4) iGaming is legalized in states representing 11% of the U.S. population today.
(5) Based on New Jersey GDP method extrapolation on page 11.
$5.0-7.3B
$22BImplied Total
U.S. Market(1)
65%of U.S. Population
with Legalized OSB(2)
20-30%DraftKings’
OSB Market Share
$2.9-4.3Bin Gross OSB Revenue
$40BImplied Total
U.S. Market(3)
30%of U.S. Population
with Legalized iGaming(4)
15-20%DraftKings’
iGaming Market Share
$1.8-2.4Bin Gross iGaming Revenue
DraftKings OSB and iGaming
Gross Revenue
DraftKings iGaming
DraftKings Online Sports Betting
DKNG Q4 market share of 30% and 19% for OSB and iGaming, respectively, is at the top end of each U.S. market share range
$5BImplied Total
Canadian Market(5)
64%of Canada Population with
Legalized OSB and iGaming
10-20%DraftKings’
Canada Market Share
$300mm-600mmin Gross OSB and iGaming Revenue
DraftKings Canada

| 13
MARKET SHARE
| 14
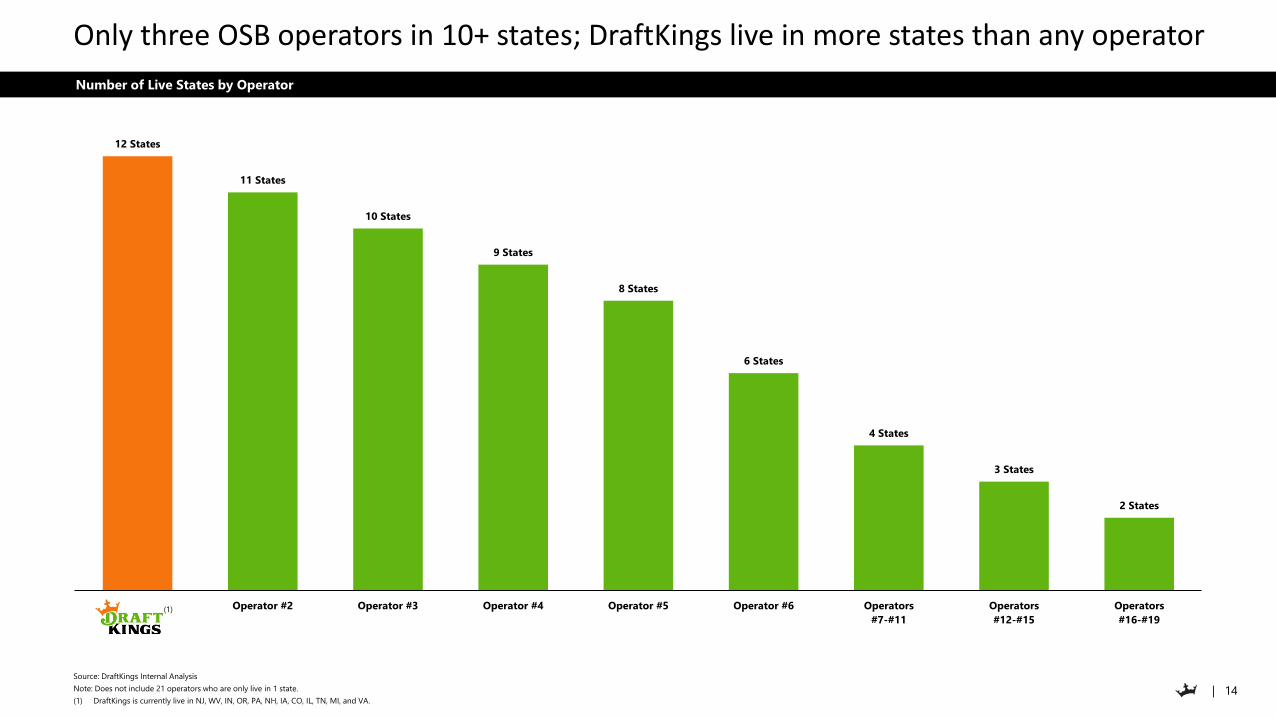
Number of Live States by Operator
12 States
11 States
10 States
9 States
8 States
6 States
4 States
3 States
2 States
Operator #2 Operator #3 Operator #4 Operator #5 Operator #6 Operators
#7-#11
Operators
#12-#15
Operators
#16-#19
Only three OSB operators in 10+ states; DraftKings live in more states than any operator
Source: DraftKings Internal Analysis
Note: Does not include 21 operators who are only live in 1 state.
(1) DraftKings is currently live in NJ, WV, IN, OR, PA, NH, IA, CO, IL, TN, MI, and VA.
(1)
| 15
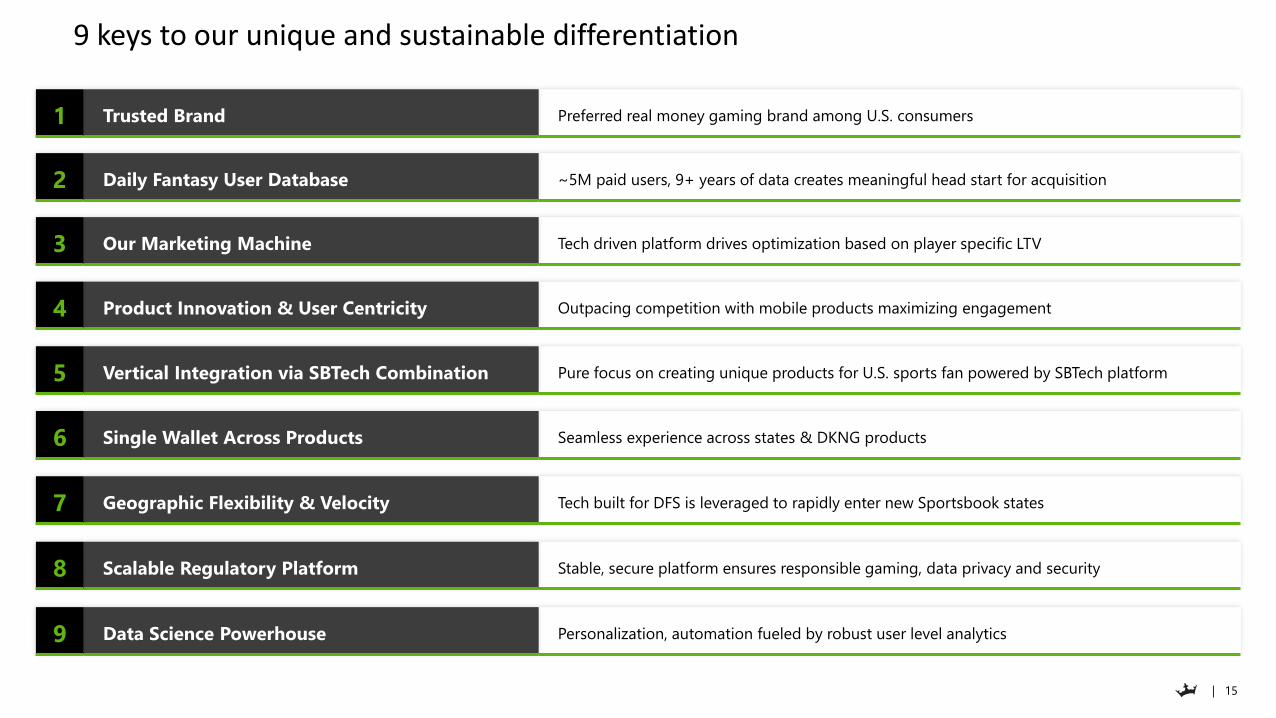
9 keys to our unique and sustainable differentiation
Preferred real money gaming brand among U.S. consumers
~5M paid users, 9+ years of data creates meaningful head start for acquisition
Tech driven platform drives optimization based on player specific LTV
Outpacing competition with mobile products maximizing engagement
Pure focus on creating unique products for U.S. sports fan powered by SBTech platform
Seamless experience across states & DKNG products
Tech built for DFS is leveraged to rapidly enter new Sportsbook states
Stable, secure platform ensures responsible gaming, data privacy and security
Personalization, automation fueled by robust user level analytics
Trusted Brand
Daily Fantasy User Database
Our Marketing Machine
Product Innovation & User Centricity
Vertical Integration via SBTech Combination
Single Wallet Across Products
Geographic Flexibility & Velocity
Scalable Regulatory Platform
Data Science Powerhouse
1
2
3
4
5
6
7
8
9
| 16
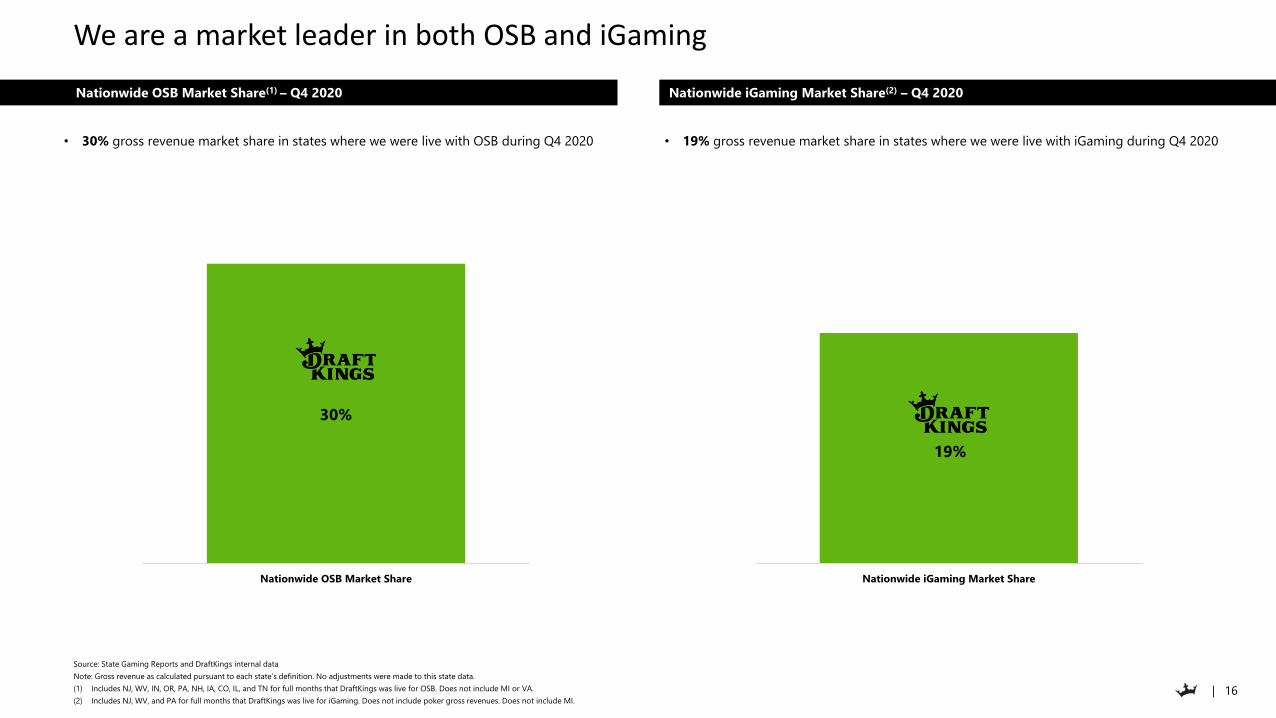
Nationwide OSB Market Share(1) – Q4 2020
• 30% gross revenue market share in states where we were live with OSB during Q4 2020 • 19% gross revenue market share in states where we were live with iGaming during Q4 2020
Nationwide iGaming Market Share(2) – Q4 2020
30%
Nationwide OSB Market Share
We are a market leader in both OSB and iGaming
Source: State Gaming Reports and DraftKings internal data
Note: Gross revenue as calculated pursuant to each state’s definition. No adjustments were made to this state data.
(1) Includes NJ, WV, IN, OR, PA, NH, IA, CO, IL, and TN for full months that DraftKings was live for OSB. Does not include MI or VA.
(2) Includes NJ, WV, and PA for full months that DraftKings was live for iGaming. Does not include poker gross revenues. Does not include MI.
19%
Nationwide iGaming Market Share

| 17
MARKETING AND BRAND

| 18
5%
2%
23%
46%
36%
4%
4%
4%
15%
29%
3%
3%
6%
14%
25%
Sugarhouse
Parx
betMGM
FD
DraftKings
Top of Mind Preferred Unaided Awareness
33%
8%
9%
42%
57%
5%
4%
6%
27%
29%
5%
3%
4%
25%
31%
Others (6)
bet365
William Hill
FanDuel
DraftKings
Top of Mind Preferred Unaided Awareness
11%
31%
39%
53%
67%
3%
12%
12%
22%
38%
1%
8%
10%
24%
34%
CBS
ESPN
Yahoo!
FanDuel
DraftKings
Top of Mind Preferred Unaided Awareness
DraftKings is the most recognized and preferred app across DFS, OSB, and iGaming
Source: Q4 2020 Quarterly Brand Tracker Commissioned by DraftKings, fielded by ProdegeMR using sampling that is independent of DraftKings’ database
Note: DFS Tracker: N=250 (Played a DFS product in the past 12 months (“P12M”) who live in a state where DFS is legal); Sportsbook Tracker: N=520 (Placed a wager on an online sportsbook in the P12M who live in a state where DraftKings Sportsbook is live); Casino Tracker: N= 204 (Placed a wager on an
online casino in the P12M who live in a state where DraftKings Online Casino is live).
(1) Q (Top of Mind): When you think about fantasy sports sites (both season-long and daily)/ websites/apps that you can wager on sports or casino, what is the first site that comes to mind?
(2) Q (Preferred): Which of the following fantasy sports sites/ sports wagering sites/ online casino sites is your preferred site for playing fantasy sports/ sports wagering/ online casino? (please select one)
(3) Q: (Unaided): What other sites/apps come to mind?
(2)(1) (2)(1) (2)(1)
Other
Operators (6)iGaming
Operator #5
DFS
Operator #2
DFS
Operator #3
DFS
Operator #4
DFS
Operator #5
OSB
Operator #2
OSB
Operator #3
OSB
Operator #4
iGaming
Operator #2
iGaming
Operator #3
iGaming
Operator #4
DFS Sportsbook iGaming
(3) (3) (3)

| 19
DraftKings has established key relationships across the sports and entertainment space
Select League Deals
Select Teams and Venues Deals
Select Media and Other Deals
| 20
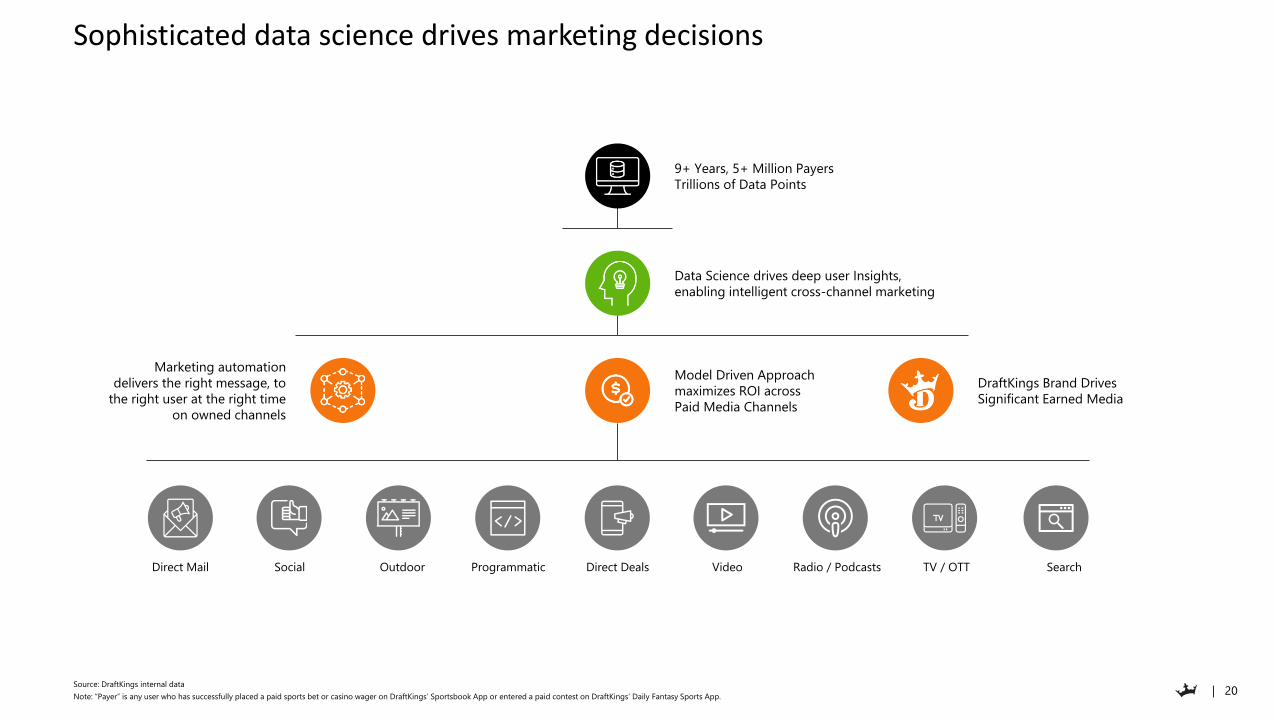
Sophisticated data science drives marketing decisions
Source: DraftKings internal data
Note: “Payer” is any user who has successfully placed a paid sports bet or casino wager on DraftKings’ Sportsbook App or entered a paid contest on DraftKings’ Daily Fantasy Sports App.
SocialDirect Mail Programmatic Direct Deals Video Radio / Podcasts TV / OTT SearchOutdoor
9+ Years, 5+ Million Payers
Trillions of Data Points
Data Science drives deep user Insights,
enabling intelligent cross-channel marketing
Model Driven Approach
maximizes ROI across
Paid Media Channels
Marketing automation
delivers the right message, to
the right user at the right time
on owned channels
DraftKings Brand Drives
Significant Earned Media
| 21
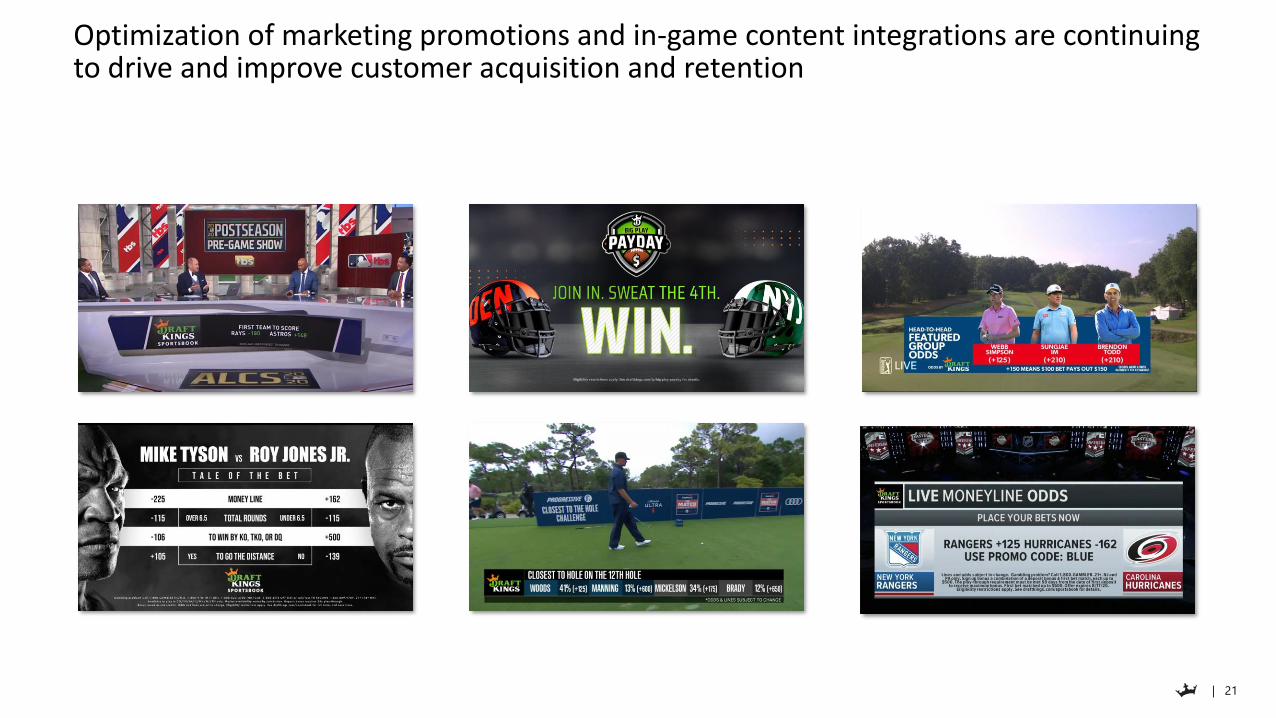
Optimization of marketing promotions and in-game content integrations are continuing to drive and improve customer acquisition and retention

| 22
PRODUCT & TECHNOLOGY
| 23
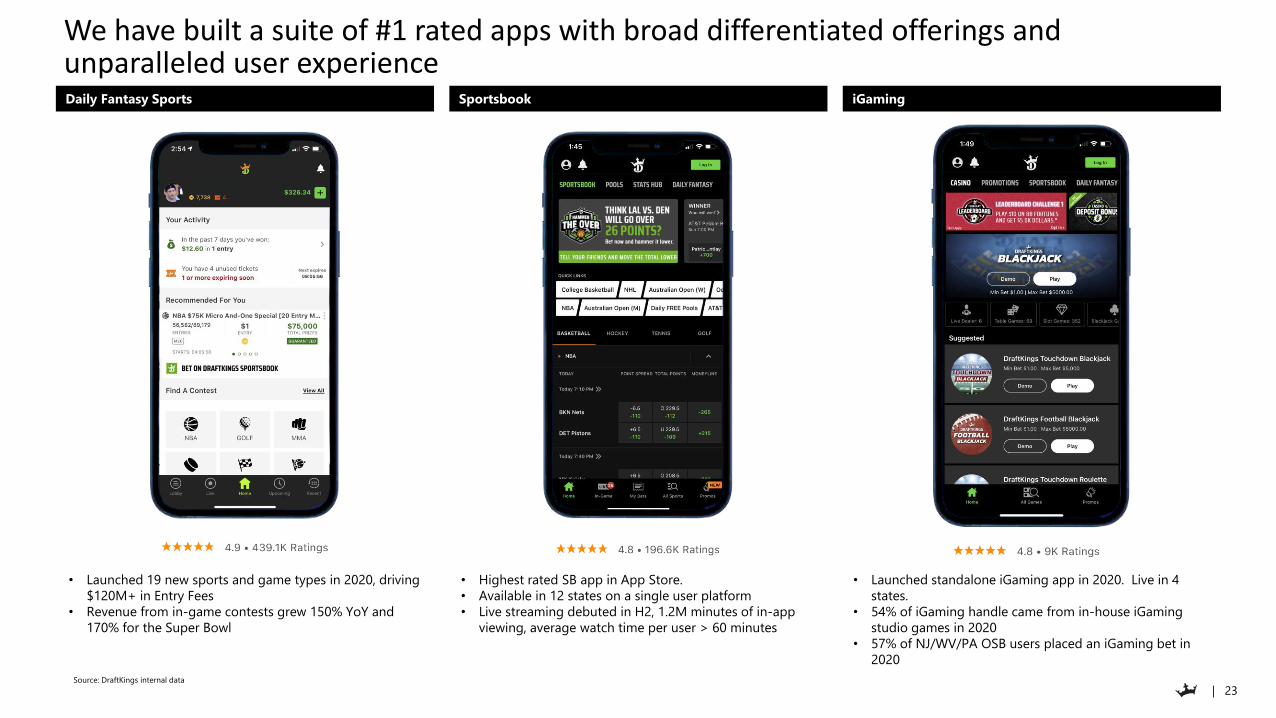
We have built a suite of #1 rated apps with broad differentiated offerings and unparalleled user experience
Source: DraftKings internal data
• Launched 19 new sports and game types in 2020, driving
$120M+ in Entry Fees
• Revenue from in-game contests grew 150% YoY and
170% for the Super Bowl
• Highest rated SB app in App Store.
• Available in 12 states on a single user platform
• Live streaming debuted in H2, 1.2M minutes of in-app
viewing, average watch time per user > 60 minutes
• Launched standalone iGaming app in 2020. Live in 4
states.
• 54% of iGaming handle came from in-house iGaming
studio games in 2020
• 57% of NJ/WV/PA OSB users placed an iGaming bet in
2020
Daily Fantasy Sports Sportsbook iGaming
| 24
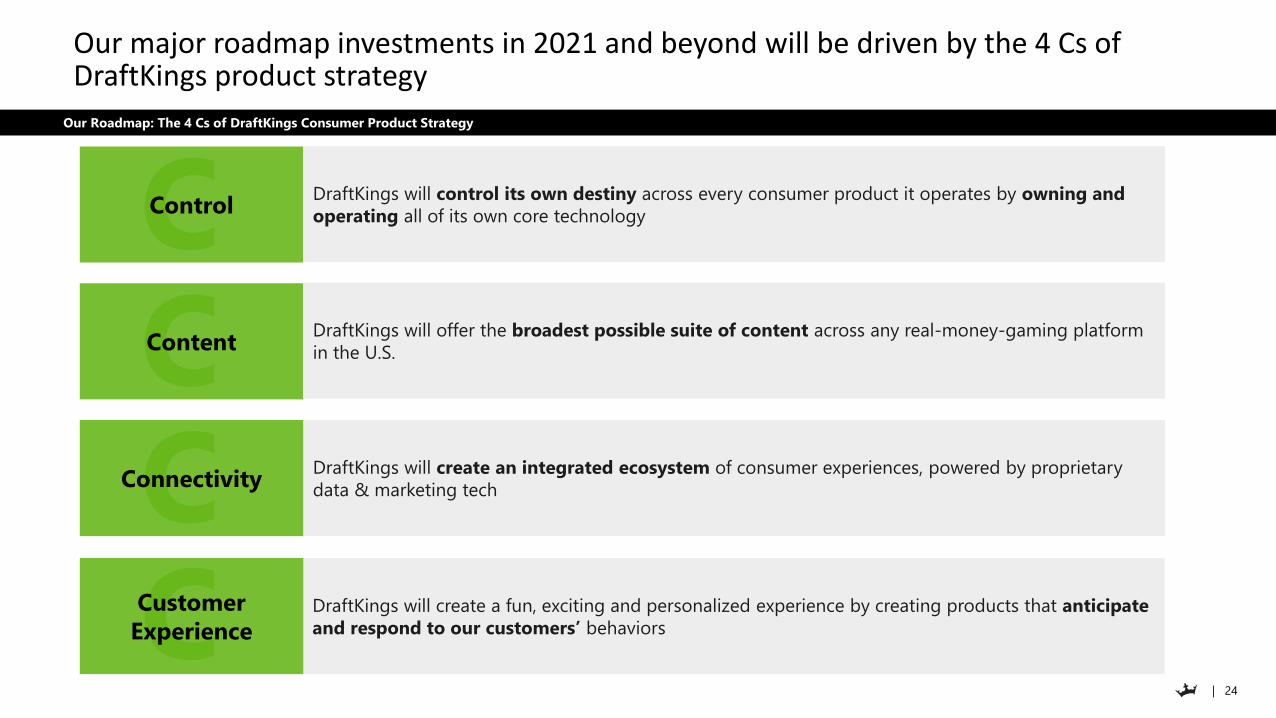
Our major roadmap investments in 2021 and beyond will be driven by the 4 Cs of DraftKings product strategy
CControlDraftKings will control its own destiny across every consumer product it operates by owning and
operating all of its own core technology
CContentDraftKings will offer the broadest possible suite of content across any real-money-gaming platform
in the U.S.
DraftKings will create an integrated ecosystem of consumer experiences, powered by proprietary
data & marketing techCConnectivity
Our Roadmap: The 4 Cs of DraftKings Consumer Product Strategy
C DraftKings will create a fun, exciting and personalized experience by creating products that anticipate
and respond to our customers’ behaviors
Customer
Experience
| 25
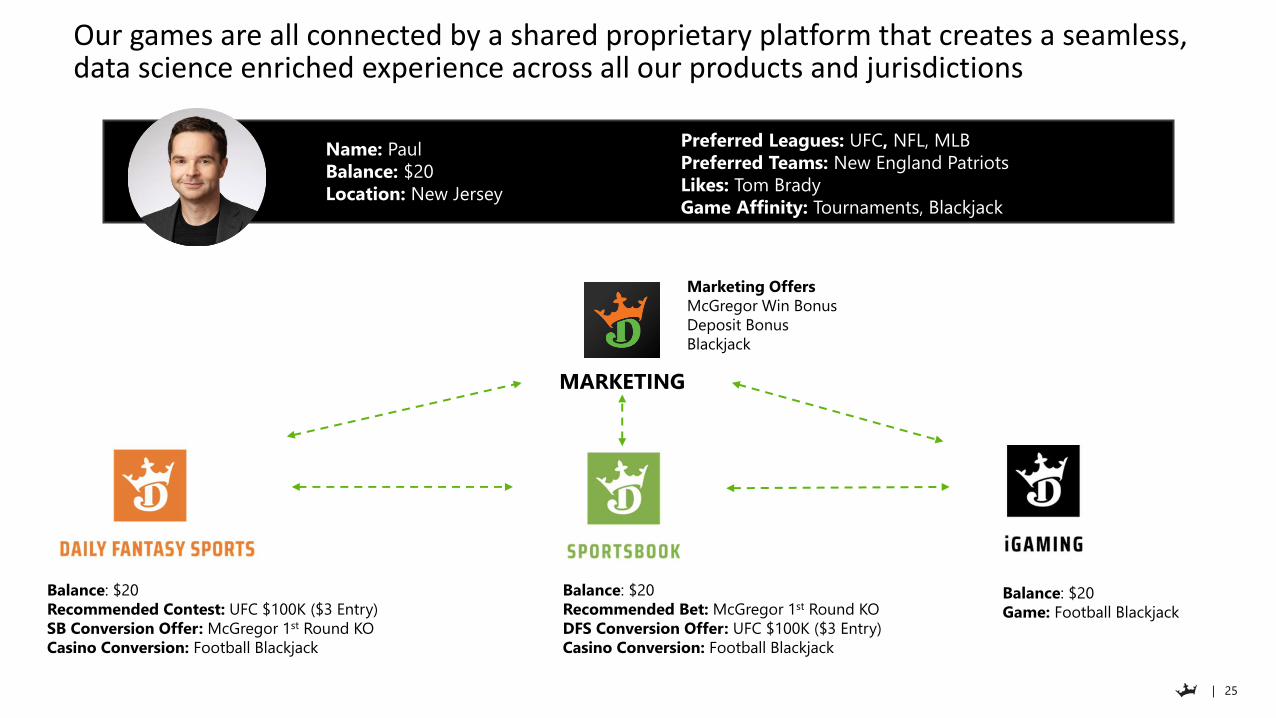
Our games are all connected by a shared proprietary platform that creates a seamless, data science enriched experience across all our products and jurisdictions
Name: Paul
Balance: $20
Location: New Jersey
Balance: $20
Recommended Contest: UFC $100K ($3 Entry)
SB Conversion Offer: McGregor 1st Round KO
Casino Conversion: Football Blackjack
Balance: $20
Recommended Bet: McGregor 1st Round KO
DFS Conversion Offer: UFC $100K ($3 Entry)
Casino Conversion: Football Blackjack
Balance: $20
Game: Football Blackjack
Preferred Leagues: UFC, NFL, MLB
Preferred Teams: New England Patriots
Likes: Tom Brady
Game Affinity: Tournaments, Blackjack
MARKETING
Marketing Offers
McGregor Win Bonus
Deposit Bonus
Blackjack

| 26
Our vertically integrated iGaming product is differentiated and driving outsized results
• $14.2B(1) total wagered since launch, with more than half on DraftKings homegrown games(2)
• 26 DraftKings games built in 2019 and 2020, with 20+ more planned to launch in 2021
• Cross-Sell is a key driver to iGaming playbook, with 57% of OSB users placing a Casino bet in 2020
• Proprietary marketing technology like leaderboards and autonomous gaming credits have driven tremendous value and customer engagement
Slider Blackjack March Mania Roulette Baccarat
Source: DraftKings internal data
(1) From December 17, 2018 to March 3, 2021.
(2) DraftKings Casino launched December 17, 2018 in NJ, while DK Games Launched September 1, 2019.
| 27
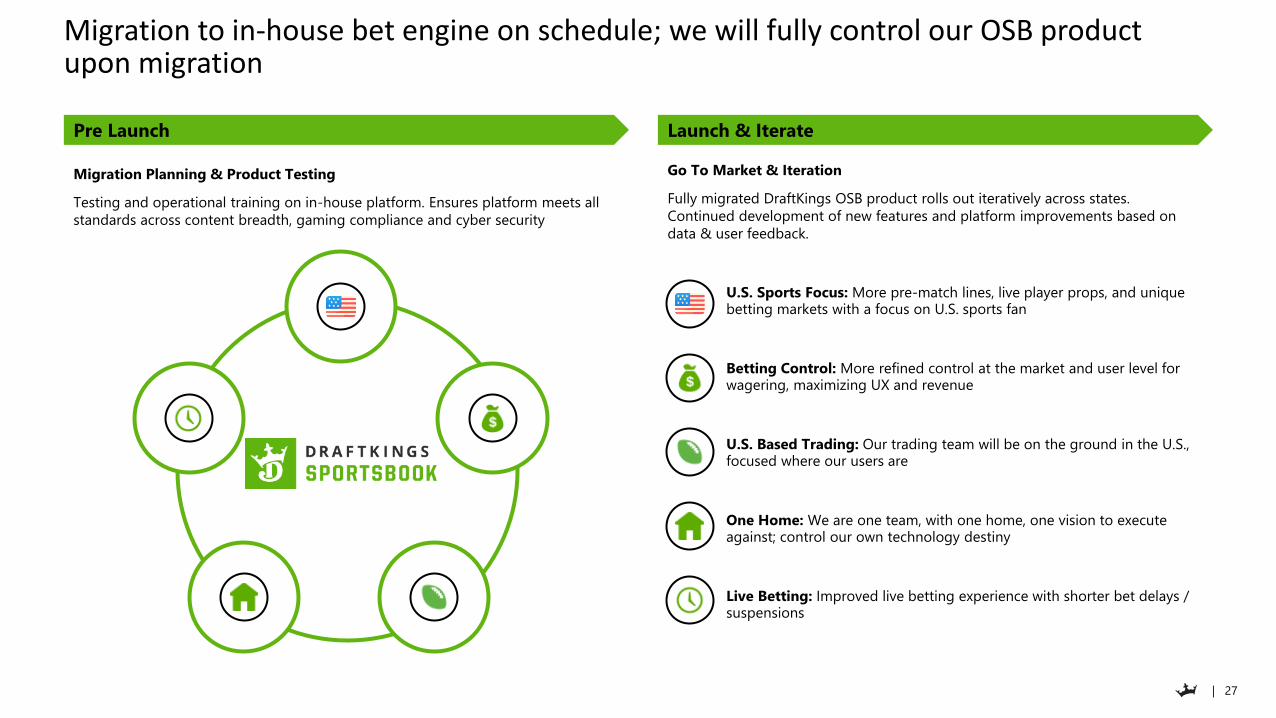
Migration to in-house bet engine on schedule; we will fully control our OSB product upon migration
• U.S. Sports Focus: More pre-match lines, live player props, and unique betting markets with a focus on U.S. sports fan
• Betting Control: More refined control at the market and user level for wagering, maximizing UX and revenue
• U.S. Based Trading: Our trading team will be on the ground in the U.S., focused where our users are
• One Home: We are one team, with one home, one vision to execute against; control our own technology destiny
• Live Betting: Improved live betting experience with shorter bet delays / suspensions
Pre Launch
Migration Planning & Product Testing
Testing and operational training on in-house platform. Ensures platform meets all
standards across content breadth, gaming compliance and cyber security
Go To Market & Iteration
Fully migrated DraftKings OSB product rolls out iteratively across states.
Continued development of new features and platform improvements based on
data & user feedback.
Launch & Iterate

| 28
UNIT ECONOMICS
| 29
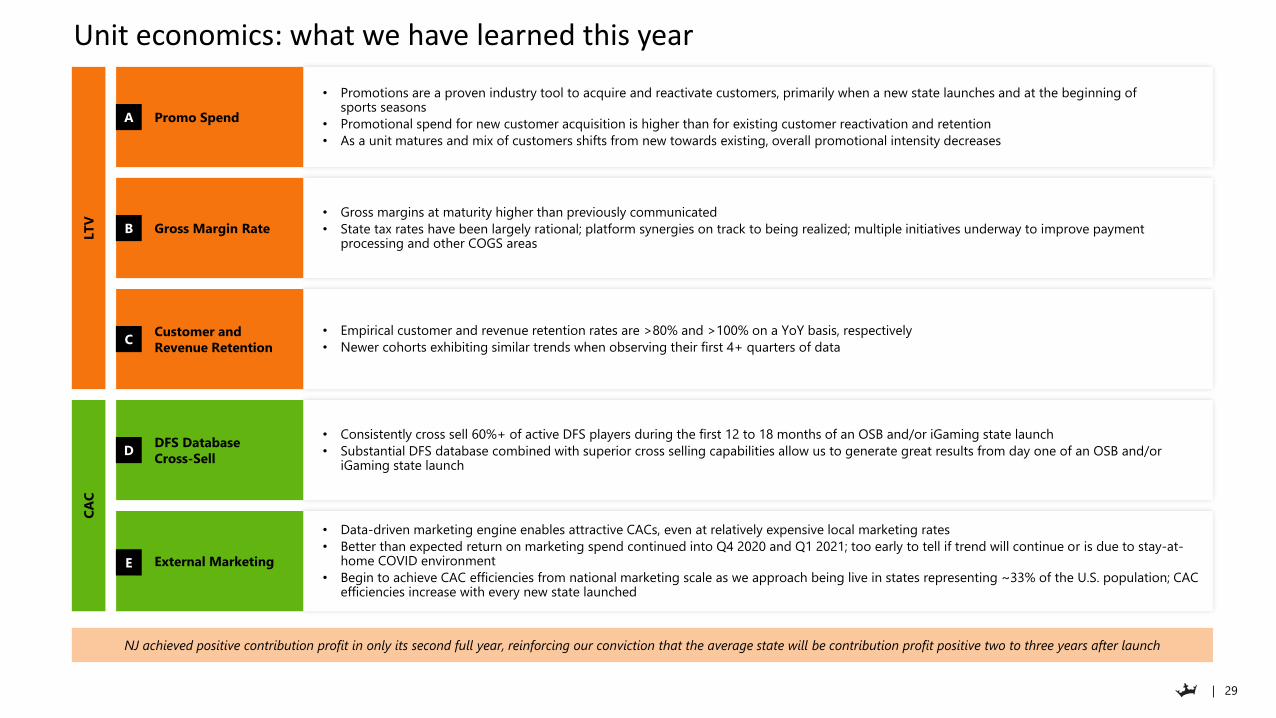
Unit economics: what we have learned this year
NJ achieved positive contribution profit in only its second full year, reinforcing our conviction that the average state will be contribution profit positive two to three years after launch
LT
VC
AC
• Consistently cross sell 60%+ of active DFS players during the first 12 to 18 months of an OSB and/or iGaming state launch
• Substantial DFS database combined with superior cross selling capabilities allow us to generate great results from day one of an OSB and/or iGaming state launch
• Data-driven marketing engine enables attractive CACs, even at relatively expensive local marketing rates
• Better than expected return on marketing spend continued into Q4 2020 and Q1 2021; too early to tell if trend will continue or is due to stay-at-home COVID environment
• Begin to achieve CAC efficiencies from national marketing scale as we approach being live in states representing ~33% of the U.S. population; CAC efficiencies increase with every new state launched
• Promotions are a proven industry tool to acquire and reactivate customers, primarily when a new state launches and at the beginning of sports seasons
• Promotional spend for new customer acquisition is higher than for existing customer reactivation and retention
• As a unit matures and mix of customers shifts from new towards existing, overall promotional intensity decreases
• Gross margins at maturity higher than previously communicated
• State tax rates have been largely rational; platform synergies on track to being realized; multiple initiatives underway to improve payment processing and other COGS areas
• Empirical customer and revenue retention rates are >80% and >100% on a YoY basis, respectively
• Newer cohorts exhibiting similar trends when observing their first 4+ quarters of data
Promo Spend
Gross Margin Rate
Customer and
Revenue Retention
DFS Database
Cross-Sell
External Marketing
A
B
C
D
E
| 30
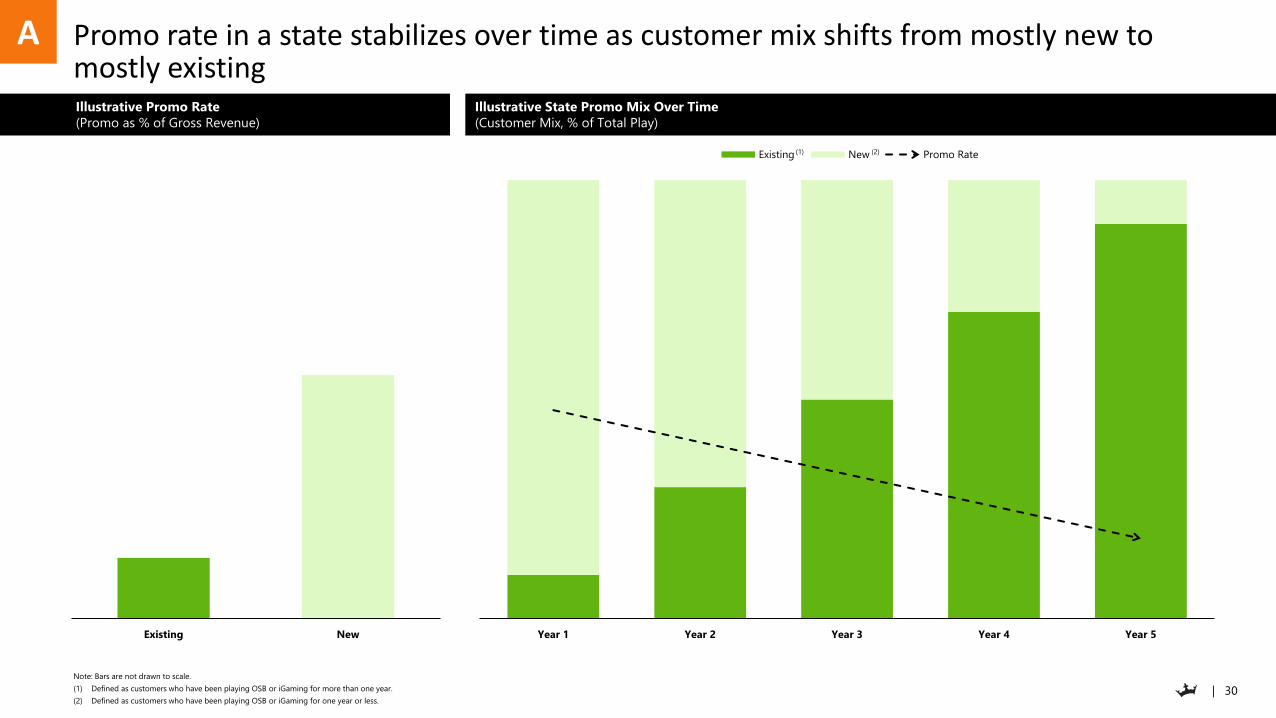
Year 1 Year 2 Year 3 Year 4 Year 5
Existing New Promo Rate
Promo rate in a state stabilizes over time as customer mix shifts from mostly new to mostly existing
Note: Bars are not drawn to scale.
(1) Defined as customers who have been playing OSB or iGaming for more than one year.
(2) Defined as customers who have been playing OSB or iGaming for one year or less.
(2)(1)
Existing New
A
Illustrative Promo Rate
(Promo as % of Gross Revenue)
Illustrative State Promo Mix Over Time
(Customer Mix, % of Total Play)
| 31
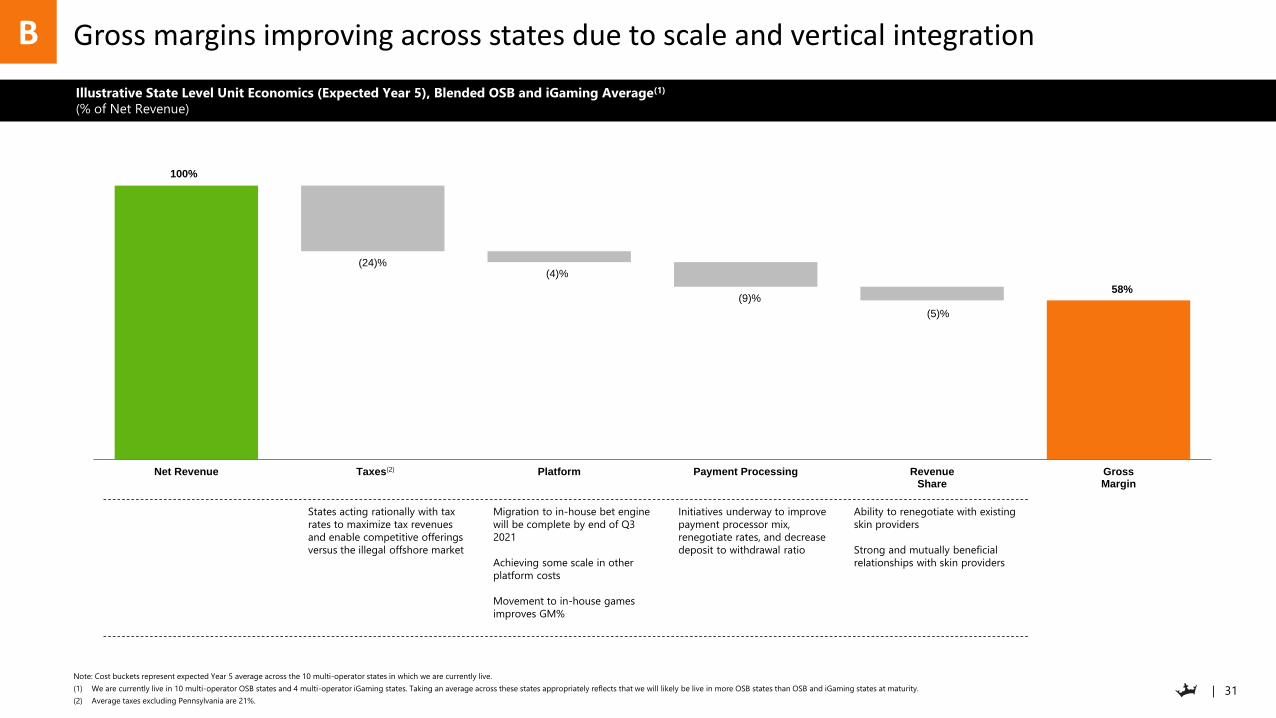
58%
Net Revenue Taxes Platform Payment Processing RevenueShare
GrossMargin
(24)%
(9)%
(5)%
(4)%
100%
Gross margins improving across states due to scale and vertical integration
Note: Cost buckets represent expected Year 5 average across the 10 multi-operator states in which we are currently live.
(1) We are currently live in 10 multi-operator OSB states and 4 multi-operator iGaming states. Taking an average across these states appropriately reflects that we will likely be live in more OSB states than OSB and iGaming states at maturity.
(2) Average taxes excluding Pennsylvania are 21%.
• States acting rationally with tax
rates to maximize tax revenues
and enable competitive offerings
versus the illegal offshore market
• Migration to in-house bet engine
will be complete by end of Q3
2021
• Achieving some scale in other
platform costs
• Movement to in-house games
improves GM%
• Initiatives underway to improve
payment processor mix,
renegotiate rates, and decrease
deposit to withdrawal ratio
Ability to renegotiate with existing
skin providers
Strong and mutually beneficial
relationships with skin providers
(2)
B
Illustrative State Level Unit Economics (Expected Year 5), Blended OSB and iGaming Average(1)
(% of Net Revenue)
| 32
100%
108%
Year 1 Year 2 Revenue Indexed to Year 1
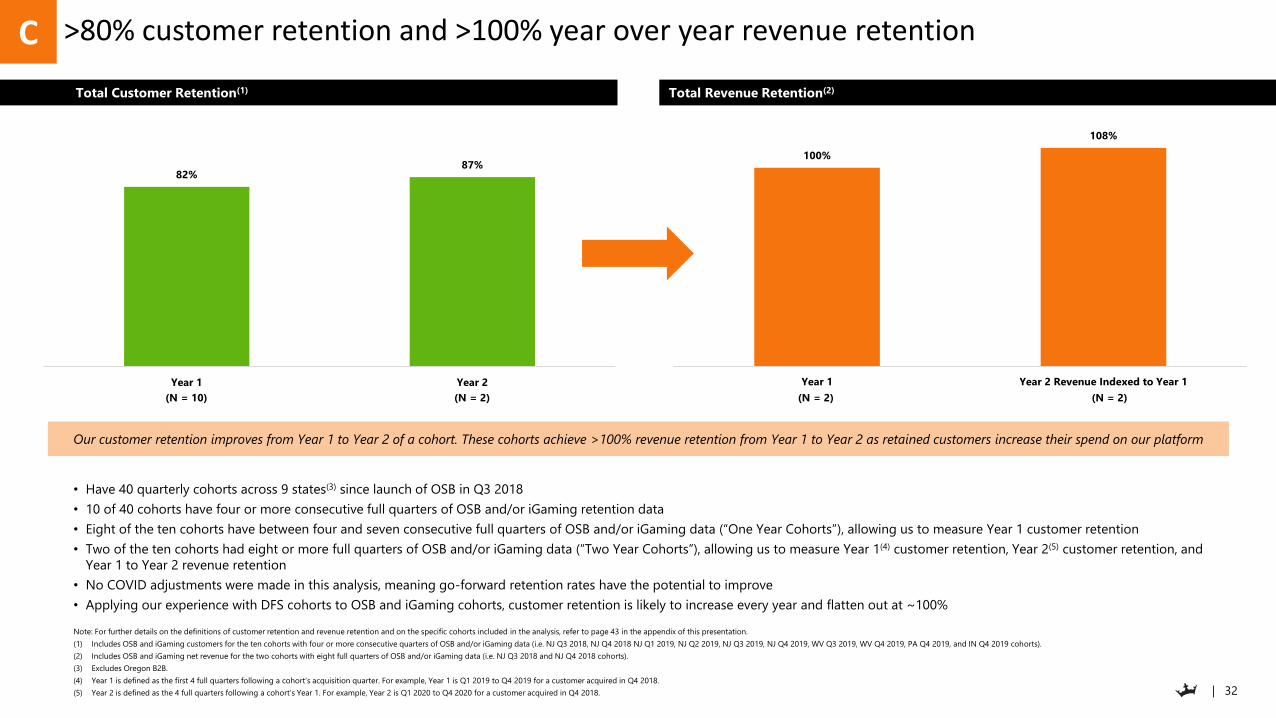
>80% customer retention and >100% year over year revenue retention
• Have 40 quarterly cohorts across 9 states(3) since launch of OSB in Q3 2018
• 10 of 40 cohorts have four or more consecutive full quarters of OSB and/or iGaming retention data
• Eight of the ten cohorts have between four and seven consecutive full quarters of OSB and/or iGaming data (“One Year Cohorts”), allowing us to measure Year 1 customer retention
• Two of the ten cohorts had eight or more full quarters of OSB and/or iGaming data (“Two Year Cohorts”), allowing us to measure Year 1(4) customer retention, Year 2(5) customer retention, and
Year 1 to Year 2 revenue retention
• No COVID adjustments were made in this analysis, meaning go-forward retention rates have the potential to improve
• Applying our experience with DFS cohorts to OSB and iGaming cohorts, customer retention is likely to increase every year and flatten out at ~100%
Note: For further details on the definitions of customer retention and revenue retention and on the specific cohorts included in the analysis, refer to page 43 in the appendix of this presentation.
(1) Includes OSB and iGaming customers for the ten cohorts with four or more consecutive quarters of OSB and/or iGaming data (i.e. NJ Q3 2018, NJ Q4 2018 NJ Q1 2019, NJ Q2 2019, NJ Q3 2019, NJ Q4 2019, WV Q3 2019, WV Q4 2019, PA Q4 2019, and IN Q4 2019 cohorts).
(2) Includes OSB and iGaming net revenue for the two cohorts with eight full quarters of OSB and/or iGaming data (i.e. NJ Q3 2018 and NJ Q4 2018 cohorts).
(3) Excludes Oregon B2B.
(4) Year 1 is defined as the first 4 full quarters following a cohort’s acquisition quarter. For example, Year 1 is Q1 2019 to Q4 2019 for a customer acquired in Q4 2018.
(5) Year 2 is defined as the 4 full quarters following a cohort’s Year 1. For example, Year 2 is Q1 2020 to Q4 2020 for a customer acquired in Q4 2018.
82%87%
Year 1 Year 2
Our customer retention improves from Year 1 to Year 2 of a cohort. These cohorts achieve >100% revenue retention from Year 1 to Year 2 as retained customers increase their spend on our platform
(N = 10) (N = 2) (N = 2)(N = 2)
C
Total Customer Retention(1) Total Revenue Retention(2)
| 33
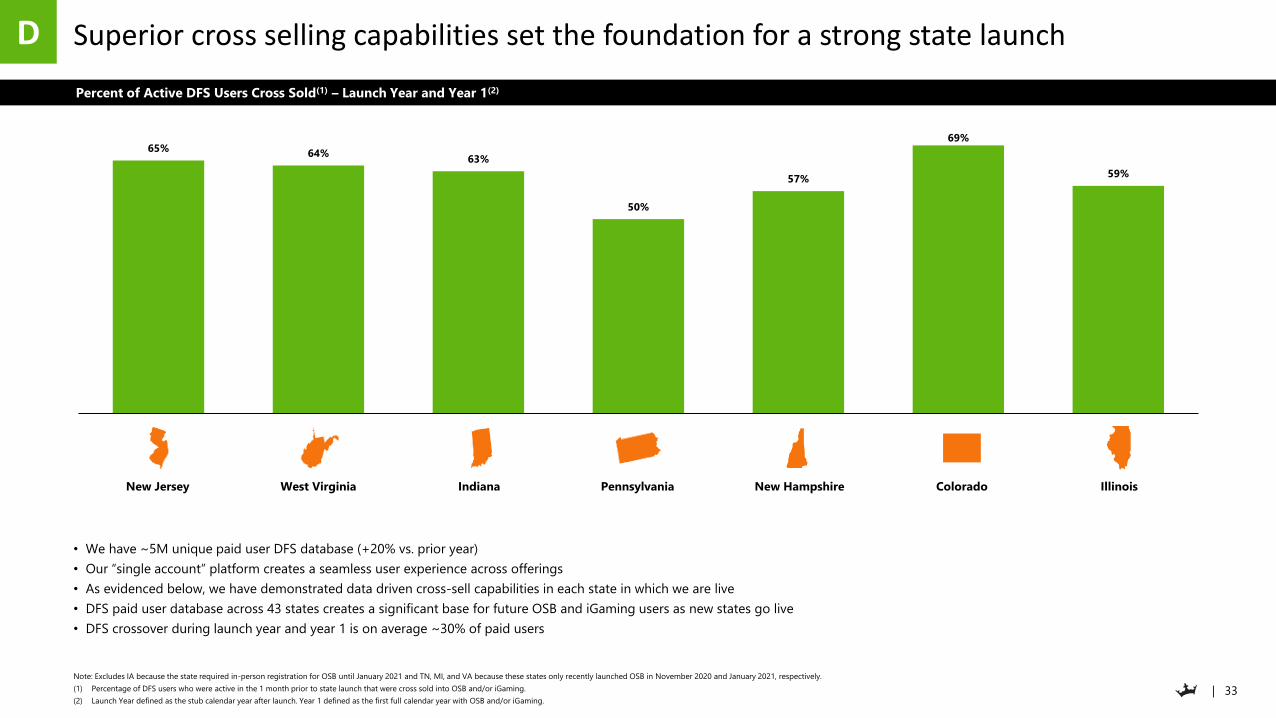
65% 64%
63%
50%
57%
69%
59%
NJ WV IN PA NH CO IL
Superior cross selling capabilities set the foundation for a strong state launch
• We have ~5M unique paid user DFS database (+20% vs. prior year)
• Our “single account” platform creates a seamless user experience across offerings
• As evidenced below, we have demonstrated data driven cross-sell capabilities in each state in which we are live
• DFS paid user database across 43 states creates a significant base for future OSB and iGaming users as new states go live
• DFS crossover during launch year and year 1 is on average ~30% of paid users
Note: Excludes IA because the state required in-person registration for OSB until January 2021 and TN, MI, and VA because these states only recently launched OSB in November 2020 and January 2021, respectively.
(1) Percentage of DFS users who were active in the 1 month prior to state launch that were cross sold into OSB and/or iGaming.
(2) Launch Year defined as the stub calendar year after launch. Year 1 defined as the first full calendar year with OSB and/or iGaming.
New Jersey IndianaWest Virginia Pennsylvania New Hampshire Colorado Illinois
D
Percent of Active DFS Users Cross Sold(1) – Launch Year and Year 1(2)

| 34
We expect to achieve significant CAC efficiencies as we reach national scale
(1) eCPM calculated as average CPM divided by marketing efficiency.
Marketing spend is still relatively inefficient; less than 3
years since the repeal of the PASPA
Opportunity to realize regional benefits from
overlapping DMAs (e.g., Philadelphia / South Jersey and
New York City / North Jersey)
Efficiencies from national advertising start once we are
live in 33% of the U.S. population; CAC efficiencies
increase with every new state launched
We have a proven track record of being first to new
OSB and iGaming markets, leading to further CAC
advantage as more states go live
25% OSB Live 33% OSB Live 50% OSB Live 75% OSB Live
Local Spend National Spend
We achieve further marketing efficiencies every time we launch OSB in a new state
E
Illustrative Marketing Efficiency At Scale
Average Effective Cost per Thousand (“eCPM”)(1)
| 35
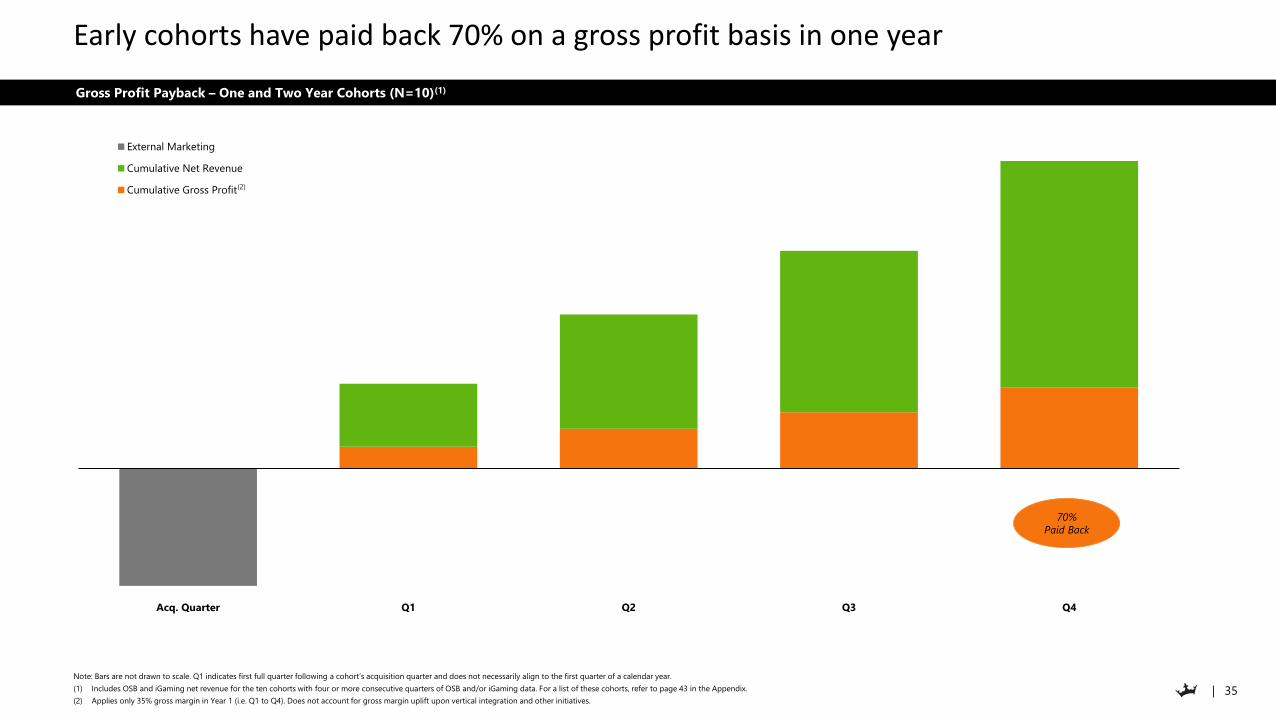
Gross Profit Payback – One and Two Year Cohorts (N=10)(1)
Acq. Quarter Q1 Q2 Q3 Q4
External Marketing
Cumulative Net Revenue
Cumulative Gross Profit
Early cohorts have paid back 70% on a gross profit basis in one year
Note: Bars are not drawn to scale. Q1 indicates first full quarter following a cohort’s acquisition quarter and does not necessarily align to the first quarter of a calendar year.
(1) Includes OSB and iGaming net revenue for the ten cohorts with four or more consecutive quarters of OSB and/or iGaming data. For a list of these cohorts, refer to page 43 in the Appendix.
(2) Applies only 35% gross margin in Year 1 (i.e. Q1 to Q4). Does not account for gross margin uplift upon vertical integration and other initiatives.
70%
Paid Back
(2)

| 36
Gross Profit Payback – Two Year Cohorts (N=2)(1)
Acq. Quarter Q1 Q2 Q3 Q4 Q5 Q6 Q7 Q8
External Marketing
Cumulative Net Revenue
Cumulative Gross Profit
Two Year Cohorts have easily paid back on a gross profit basis in two years
Note: Bars are not drawn to scale. Q1 indicates first full quarter following a cohort’s acquisition quarter and does not necessarily align to the first quarter of a calendar year.
(1) Includes OSB and iGaming net revenue for the two cohorts with eight full quarters of OSB and/or iGaming data. For a list of these cohorts, refer to page 43 in the Appendix.
(2) Applies only 35% gross margin in Year 1 and only 45% gross margin in Year 2. Does not account for gross margin uplift upon vertical integration and other initiatives.
(2)
254%
Paid Back
| 37
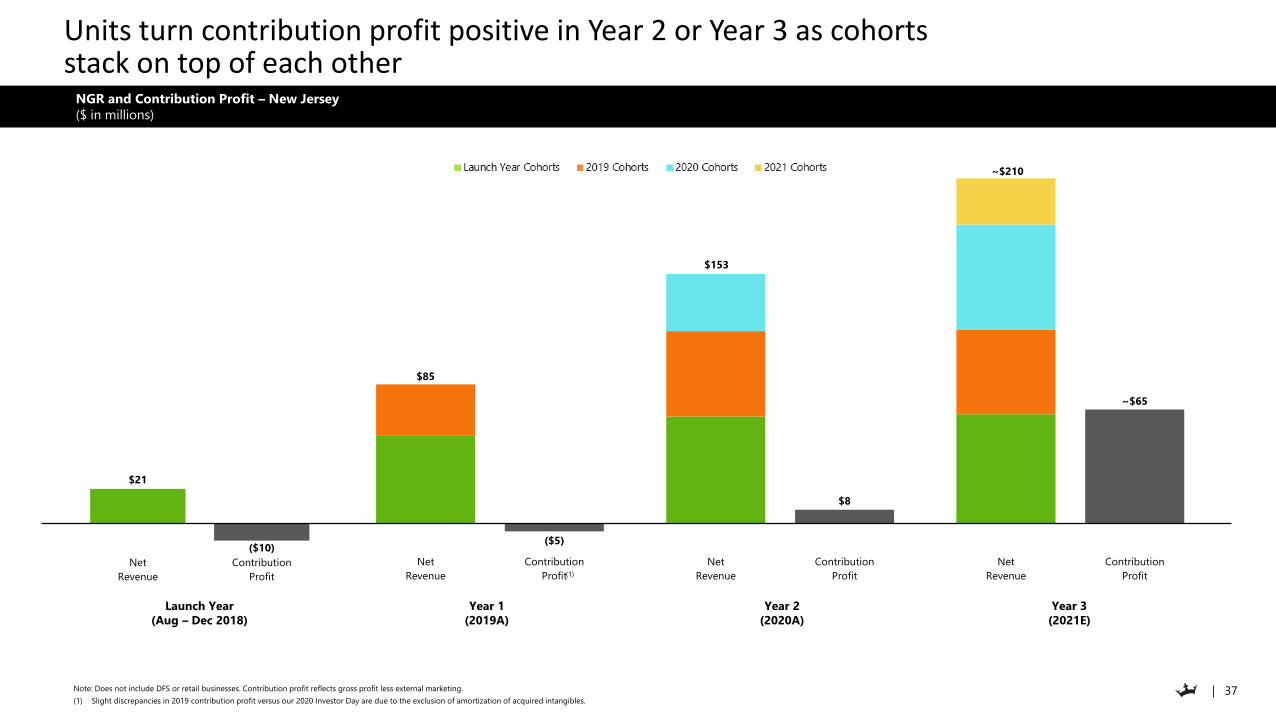
~$210
~$65
Net
Revenue
Contribution
Profit
$153
$8
Net
Revenue
Contribution
Profit
$21
($10)
Net
Revenue
Contribution
Profit
$85
($5)
Net
Revenue
Contribution
Profit
Units turn contribution profit positive in Year 2 or Year 3 as cohorts stack on top of each other
Note: Does not include DFS or retail businesses. Contribution profit reflects gross profit less external marketing.
(1) Slight discrepancies in 2019 contribution profit versus our 2020 Investor Day are due to the exclusion of amortization of acquired intangibles.
Launch Year
(Aug – Dec 2018)
Year 1
(2019A)
Year 2
(2020A)
Year 3
(2021E)
(1)
NGR and Contribution Profit – New Jersey
($ in millions)

| 38
ENTERPRISE EBITDA

| 39
$ 0.4
$ 2.8
$ 1.6
$ 0.4
$ 0.2
$ 5.4
$(2.4)
$ 3.0
$(0.5)
$ 2.5
$(1.1)
$ 0.2 $ 1.7
Net Revenue COGS Gross Profit External Marketing Contribution Profit SG&A Synergies Adjusted EBITDA
Increasing long-term Adjusted EBITDA estimate to $1.7B
• Assumes 65% of U.S. population has live OSB and 30% of U.S. population has live iGaming, and then rolls forward 5 years to “maturity”
• Assumes DKNG has 25% and 17.5% market share in U.S. OSB and U.S. iGaming, respectively
• Assumes 64% of Canada population legalizes OSB and iGaming and DKNG achieves 15% share across OSB and iGaming; 50% flow through of DKNG’s Canada net revenue to EBITDA
• SG&A at scale in most functions; will continue to invest in product & technology functions to drive differentiated user experience
• Only includes existing product verticalsNote: Figures may not foot due to rounding.
(1) Includes B2B, media, and retail revenue streams.
(2) Assumes 64% of Canadian population has access to legalized OSB and iGaming with DraftKings achieving 15% market share. Net of promotional allowances (22% of gross revenues).
(3) Assumes 30% of U.S. population has access to legalized iGaming with DraftKings achieving 17.5% market share. Net of promotional allowances (22% of gross revenues).
(4) Assumes 65% of U.S. population has access to legalized sports betting with DraftKings achieving 25% market share. Net of promotional allowances (22% of gross revenues).
(5) Based on bottoms up build from internal management plan, analyzing fixed vs. variable vs. semi-variable cost centers. SG&A includes compensation and non-compensation costs for Sales & Marketing, Product & Technology, and G&A expenses.
DFS
On
lin
e S
po
rts
Bo
ok
(4)
iGa
min
g(3
)O
ther(1
)
At 30% of U.S.
Population
Legalized
At 65% of U.S.
Population
Legalized
(5)
($ in billions)
Ca
na
da
(2)
At 64% of Canada
Population
Legalized

| 40
CAPITAL STRUCTURE
| 41
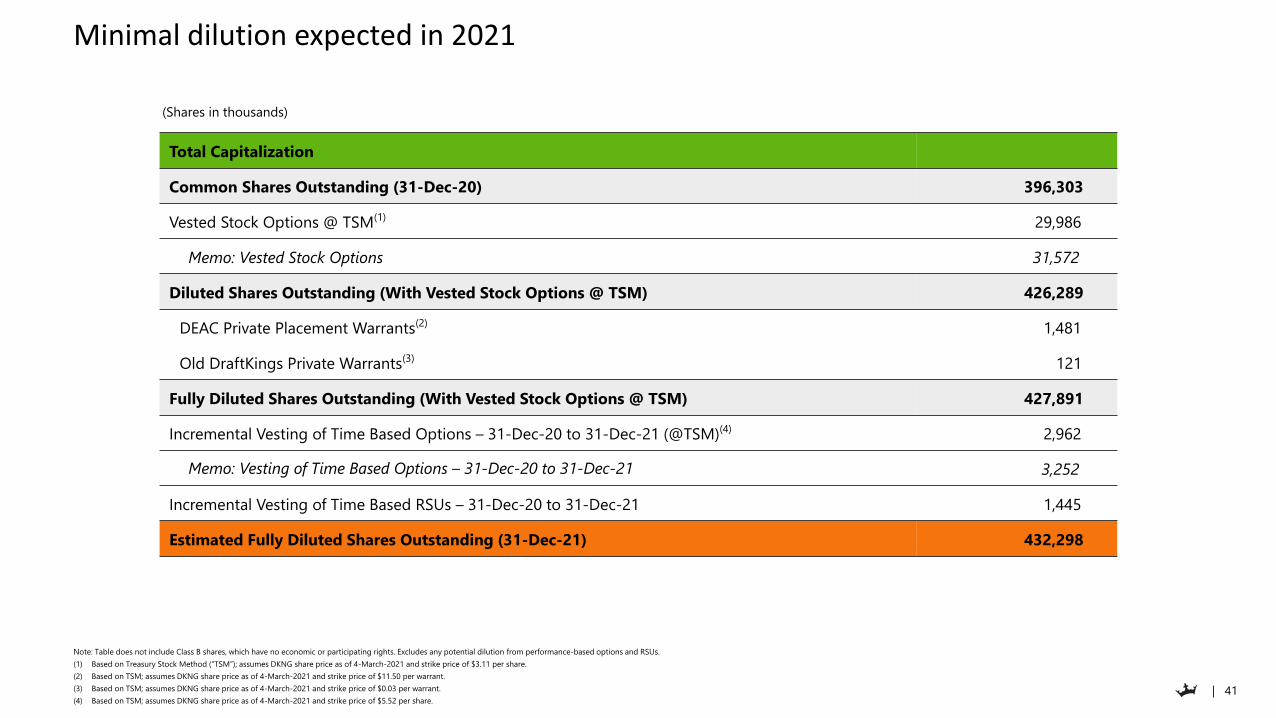
Minimal dilution expected in 2021
Note: Table does not include Class B shares, which have no economic or participating rights. Excludes any potential dilution from performance-based options and RSUs.
(1) Based on Treasury Stock Method (“TSM”); assumes DKNG share price as of 4-March-2021 and strike price of $3.11 per share.
(2) Based on TSM; assumes DKNG share price as of 4-March-2021 and strike price of $11.50 per warrant.
(3) Based on TSM; assumes DKNG share price as of 4-March-2021 and strike price of $0.03 per warrant.
(4) Based on TSM; assumes DKNG share price as of 4-March-2021 and strike price of $5.52 per share.
(Shares in thousands)
Total Capitalization
Common Shares Outstanding (31-Dec-20) 396,303
Vested Stock Options @ TSM(1) 29,986
Memo: Vested Stock Options 31,572
Diluted Shares Outstanding (With Vested Stock Options @ TSM) 426,289
DEAC Private Placement Warrants(2) 1,481
Old DraftKings Private Warrants(3) 121
Fully Diluted Shares Outstanding (With Vested Stock Options @ TSM) 427,891
Incremental Vesting of Time Based Options – 31-Dec-20 to 31-Dec-21 (@TSM)(4) 2,962
Memo: Vesting of Time Based Options – 31-Dec-20 to 31-Dec-21 3,252
Incremental Vesting of Time Based RSUs – 31-Dec-20 to 31-Dec-21 1,445
Estimated Fully Diluted Shares Outstanding (31-Dec-21) 432,298

| 42
APPENDIX
| 43
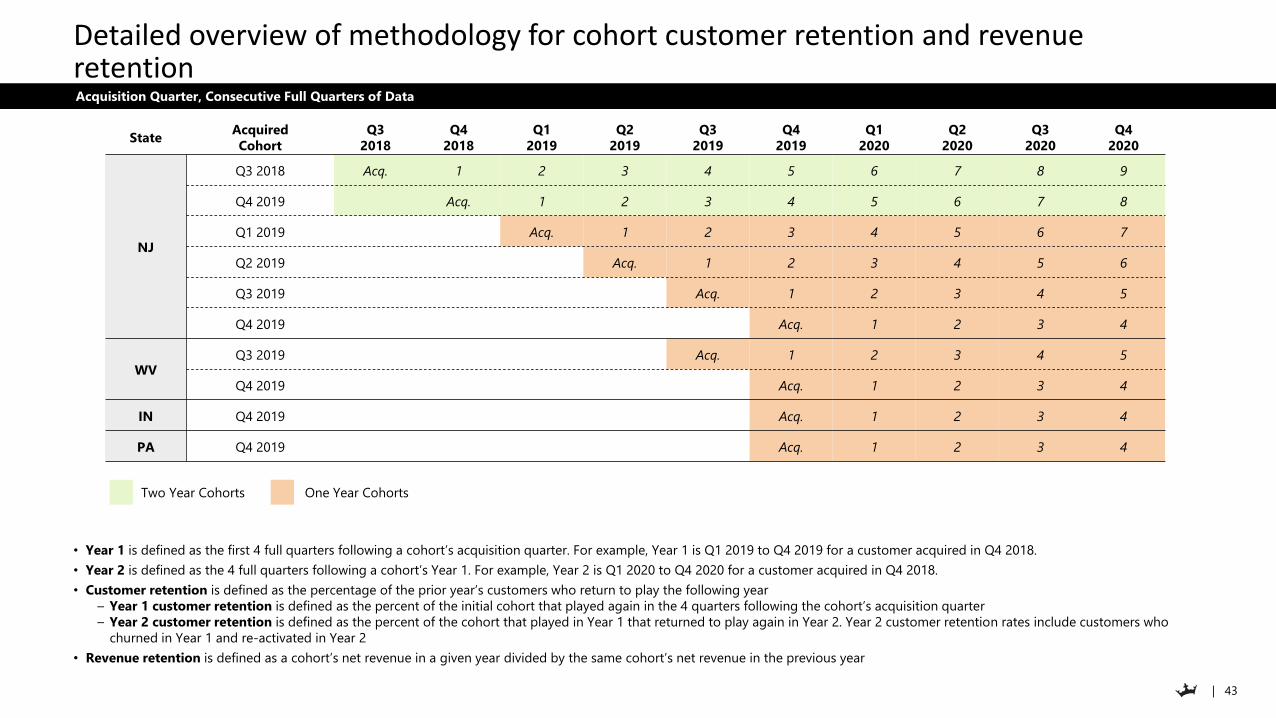
Detailed overview of methodology for cohort customer retention and revenue retention
• Year 1 is defined as the first 4 full quarters following a cohort’s acquisition quarter. For example, Year 1 is Q1 2019 to Q4 2019 for a customer acquired in Q4 2018.
• Year 2 is defined as the 4 full quarters following a cohort’s Year 1. For example, Year 2 is Q1 2020 to Q4 2020 for a customer acquired in Q4 2018.
• Customer retention is defined as the percentage of the prior year’s customers who return to play the following year
– Year 1 customer retention is defined as the percent of the initial cohort that played again in the 4 quarters following the cohort’s acquisition quarter
– Year 2 customer retention is defined as the percent of the cohort that played in Year 1 that returned to play again in Year 2. Year 2 customer retention rates include customers who
churned in Year 1 and re-activated in Year 2
• Revenue retention is defined as a cohort’s net revenue in a given year divided by the same cohort’s net revenue in the previous year
StateAcquired
Cohort
Q3
2018
Q4
2018
Q1
2019
Q2
2019
Q3
2019
Q4
2019
Q1
2020
Q2
2020
Q3
2020
Q4
2020
NJ
Q3 2018 Acq. 1 2 3 4 5 6 7 8 9
Q4 2019 Acq. 1 2 3 4 5 6 7 8
Q1 2019 Acq. 1 2 3 4 5 6 7
Q2 2019 Acq. 1 2 3 4 5 6
Q3 2019 Acq. 1 2 3 4 5
Q4 2019 Acq. 1 2 3 4
WVQ3 2019 Acq. 1 2 3 4 5
Q4 2019 Acq. 1 2 3 4
IN Q4 2019 Acq. 1 2 3 4
PA Q4 2019 Acq. 1 2 3 4
One Year CohortsTwo Year Cohorts
Acquisition Quarter, Consecutive Full Quarters of Data

| 44
QUESTION AND ANSWER SESSION

| 45
THANK YOU
![PM 2014 investor day 2014-06-26-CEO Investor Day Slides [FINAL]](https://static.documents.pub/doc/80x56/577cbc651a28aba7118da313/pm-2014-investor-day-2014-06-26-ceo-investor-day-slides-final.jpg)


