DRAFT: PLEASE DO NOT CITE OR CIRCULATE WITHOUT THE AUTHOR’S PERMISSION 1 Out of Sight, Out of Mind? Measuring the Relationship Between Privatization and Medicaid Self-Reporting This study uses Medicaid as a test case for measuring whether privatization of a prominent government program influences awareness of program use. To measure whether privatization impacts the relationship between Medicaid enrollment and knowledge of Medicaid receipt, it uses Medicaid administrative records that have been linked to self-reports of Medicaid enrollment in the American Community Survey. It then tests whether these findings are replicated among self-reports in the National Longitudinal Study of Adolescent to Adult Health (Add Health). Variation in Medicaid at the state level enables this research to examine the consequences of privatization within the same policy area along a continuous, rather than dichotomous, scale. This analysis found that the reporting of Medicaid enrollment among a state’s Medicaid population decreases as commercial Medicaid managed care organization (MCO) penetration increases and as the Medicaid population in MCOs that share the name of private insurance companies grows. It also finds that when underreporting of Medicaid enrollment occurs, these respondents are more likely to report enrollment in private insurance, but not a lack of insurance. Having controlled for alternative explanations, these results identify when privatization, via Medicaid managed care, obscures the recognition of government's personal relevance.
Transcript
DRAFT: PLEASE DO NOT CITE OR CIRCULATE WITHOUT THE AUTHOR’S PERMISSION
1
Out of Sight, Out of Mind? Measuring the Relationship Between Privatization and Medicaid Self-Reporting
This study uses Medicaid as a test case for measuring whether privatization of a
prominent government program influences awareness of program use. To measure whether privatization impacts the relationship between Medicaid enrollment and knowledge of Medicaid receipt, it uses Medicaid administrative records that have been linked to self-reports of Medicaid enrollment in the American Community Survey. It then tests whether these findings are replicated among self-reports in the National Longitudinal Study of Adolescent to Adult Health (Add Health). Variation in Medicaid at the state level enables this research to examine the consequences of privatization within the same policy area along a continuous, rather than dichotomous, scale. This analysis found that the reporting of Medicaid enrollment among a state’s Medicaid population decreases as commercial Medicaid managed care organization (MCO) penetration increases and as the Medicaid population in MCOs that share the name of private insurance companies grows. It also finds that when underreporting of Medicaid enrollment occurs, these respondents are more likely to report enrollment in private insurance, but not a lack of insurance. Having controlled for alternative explanations, these results identify when privatization, via Medicaid managed care, obscures the recognition of government's personal relevance.
DRAFT: PLEASE DO NOT CITE OR CIRCULATE WITHOUT THE AUTHOR’S PERMISSION
2
The American government is both expanding and disappearing from sight. These
paradoxical developments can be attributed to the growth of the “submerged” state: programs
that by nature of their design can be difficult for the mass public, as well as program recipients,
to identify as a government program and a social program (Mettler 2011). These programs, and
the policies that create them, are alternatively referred to as part of the “hidden,” “anti-
bureaucratic,” or “delegated” state (see Howard 1999; Skocpol and Finegold 1982; Morgan and
Campbell 2011). The size of the submerged state is staggering. Since the 1960s, government
spending has increased fivefold, adjusted for inflation, yet the number of federal employees has
remained roughly constant (DiIulio 2014). Submerged policy designs are particularly pervasive
in the healthcare arena (Morgan and Campbell 2011). Recent controversies, including the Health
Insurance Exchange rollout and mismanagement at Veterans Affairs hospitals, have highlighted
government’s reliance on private actors and the dearth of government personnel in these areas.
By definition, submerged state policies influence the visibility of government. Research
measuring the effects of submerged policy designs on a policy’s target population, however, has
overwhelmingly relied on self-reports of program enrollment to measure receipt of government
benefits (Earle and Gehlbach 2003; Mettler 2011; Morgan and Campbell 2011), creating a strong
potential for these enrollment estimates to be biased downward. Although this reliance is a
shortcoming of existing research, self-reports also present a unique opportunity. Rather than
interpreting self-reports as a measure of program use, I treat them as a consequence of program
design. Specifically, I use state-level variation in Medicaid administration to test whether and
when privatizing social policy decreases awareness of program enrollment and government
involvement.
DRAFT: PLEASE DO NOT CITE OR CIRCULATE WITHOUT THE AUTHOR’S PERMISSION
3
Using Medicaid for this inquiry also allows me to consider a potential cause of the
phenomenon known as the “Medicaid undercount.” The Medicaid undercount refers to the
finding that surveys of Medicaid enrollment drastically undercount the size of the Medicaid
population (Klerman et al. 2009). This paper probes whether Medicaid privatization can help to
explain the underreporting of Medicaid in surveys. To measure the relationship between reports
of Medicaid enrollment and Medicaid privatization, I utilize Medicaid administrative data on
program enrollment that has been linked to the American Community Survey (ACS), a Census
survey that contains questions on health insurance. This administrative data provides a measure
of Medicaid enrollment that is untainted by the biases of self-reports, which allows the linked
self-reported data to function as a measure of awareness of program enrollment. My analysis of
this linked data shows that commercial MCO penetration, and the naming of managed care plans,
are related to decreased Medicaid reporting. I then test for this relationship in self-reports of
Medicaid enrollment in the National Longitudinal Study of Adolescent to Adult Health (Add
Health). The results of the ACS analysis were mirrored in the Add Health survey data. Through
highlighting these relationships, this research calls attention to a profound consequence of
privatization: its ability to mask government’s personal relevance. These findings also
demonstrate the importance of disaggregating the policy mechanisms that are used in
privatization initiatives in order to clarify when and how privatization impacts government
visibility.
Medicaid and the Submerged State
“Submerged” policies can be distinguished from “direct” policies based on the potential
difficulties they create for public recognition of government involvement. The administrative
mechanisms used by submerged policies include deferral of administrative capacity to non-
DRAFT: PLEASE DO NOT CITE OR CIRCULATE WITHOUT THE AUTHOR’S PERMISSION
4
governmental organizations (i.e. privatization) and reliance on the tax code for wealth transfers,
rather than directly providing benefits (Mettler 2011).1 The implementation of these measures
has allowed government to address a range of policy agendas without a corresponding increase
in the size of formal institutions within the federal government (DiIulio 2014). The extent of the
submerged state in U.S. health care policy is exemplified by the “Mildred paradox.” Mildred
was the mother-in-law of political scientist Don Kettl. In the last few years of her life, a
combination of Medicaid and Medicare paid for Mildred’s extensive health care needs, including
her annual $85,000 a year nursing home. Despite the numerous government-funded health care
services she received, Mildred never encountered a government employee (Kettl 2009). Stories
like hers are increasingly common as governments shift more responsibility for service provision
to private actors.
The growth of submerged program characteristics has been attributed to two
contradictory demands: the need for adequate social provisions and a desire for smaller
government (Morgan and Campbell 2011). Morgan and Campbell use the 2009 health care
reform legislation and the development of Medicare Part D to show how powerful special
interests and conflicting public preferences helped to propel the delegation of administrative
authority to non-state actors (2011). Perceptual biases in favor of privatization can also bolster
support for the submerged state (Lerman Forthcoming). According to Lerman, people are more
likely to think that a well-performing municipal service is privately administered. Conversely,
poorly run services are more likely to be perceived as publically administered, regardless of
whether they were actually publicly or privately administered. These misperceptions were found
1 These policy mechanisms also contribute to the “delegated welfare state” (Morgan and Campbell 2011) and "government by proxy" (DiIulio 2014). Government-by-proxy refers specifically to the phenomenon whereby the federal government defers administrative responsibility to state and local governments, nonprofit organizations, and for-profit companies (DiIulio 2014).
DRAFT: PLEASE DO NOT CITE OR CIRCULATE WITHOUT THE AUTHOR’S PERMISSION
5
to be held by Democrats and Republicans alike and stemmed from stereotypes of government
incompetence.
Along with identifying the growth of and causes for submerged state policies, researchers
have begun to untangle these policies’ effects on the public’s attitudes and behaviors (see Bendz
2015; Mettler 2011; Pierce et al. 2014). In her influential work on the submerged state, Mettler
used this approach to test how the visibility of a social policy influences public opinion on the
policy (Mettler 2011). While this research analyzed a range of submerged state policies, it
focused on state programs involving wealth transfers located in the tax code rather than
privatization initiatives. Mettler found that compared to direct state policies, submerged state
policies were less likely to encourage participants to engage with government and make political
donations. This research also found that increasing knowledge of submerged state policies and
their distributional benefits resulted in changed attitudes and engendered greater opinion
formation. These conclusions were in part based on an assessment of the 2008 Social and
Governmental Issues and Participation Study. This survey, however, relied entirely on self-
reports of program use. Therefore, while this research did much to identify and further our
understanding of the submerged state, we still lack a rigorous test of when and how a proposed
mechanism of the submerged state – privatization – influences government visibility among a
program’s target population.
Although privatization is theorized to be a leading policy mechanism that obscures
awareness of government’s involvement in a program or service, a broad range of policies are
referred to under the label of privatization, further complicating how we understand the
relationship between privatization and the submerged state. At its most fundamental,
privatization involves a transfer of responsibility from government to the private sector
DRAFT: PLEASE DO NOT CITE OR CIRCULATE WITHOUT THE AUTHOR’S PERMISSION
6
(Lundqvist 1988). Lundqvist clarifies that in this formulation, “it is the direction that counts…
not some final or eternal location of that which is transferred” (1988: 4). In other words,
privatization is not a dichotomous phenomenon; rather, the degree to which programs are
privatized moves along a continuum. This suggests that privatization could have varying effects
on visibility based on how it is implemented. Some forms of privatization are more obvious to
recipients than others, which may serve to clarify government’s role in the delegation of
administration to non-state actors. A recent study of the Milwaukie school voucher program
showed that parents of children who utilized school vouchers were more likely to feel that
government impacted their child’s education and that this interaction taught them about
government (Fleming 2014).2 This finding suggests that privatization qua vouchers reminds
people that government is responsible for privatized public services. However, Mettler’s
research suggests that privatization of government social programs can diminish recipients’
awareness of their interaction with the state (2011). These divergent findings show that
additional research is needed to determine if and when privatization submerges the state. They
also indicate that inquiries into the consequences of privatization should account for the variety
of forms that privatization initiatives can take.
Medicaid presents a unique opportunity to assess the relationship between privatization,
program design, and awareness of government. Its prominence in state budgets, the health care
system, and political rhetoric underscore the program’s central role in U.S. social policy. This
suggests that Medicaid could be a difficult program to obscure from the public consciousness
(see e.g. Moore 2015). However, Medicaid can also be a confusing program: it is jointly
administered by federal and state governments as a federal-state partnership program; eligibility
2 This study also concluded that school vouchers may reduce support for public schools (Fleming 2014).
DRAFT: PLEASE DO NOT CITE OR CIRCULATE WITHOUT THE AUTHOR’S PERMISSION
7
and coverage differ by state and recipient group; and the name of Medicaid programs differ
between and within states. Similarity between the names of the Medicaid and Medicare
programs, as well as overlap between the two program populations, adds to the confusion over
what Medicaid is and who it serves. The confusion surrounding Medicaid suggests that if
privatization affects perceptions of government’s role in people’s lives, Medicaid is a policy area
where we should expect to find evidence of this trend. Given these divergent implications, this
paper tests whether the submersion of a program that looms large in government budgets and
national discourse, but whose administration is fragmented, can impact recipients’ awareness of
this government intervention in their lives.
Variation in Medicaid administration also allows this research to identify the
consequences of different degrees of privatization within the same policy area. I do so by
creating an index of the various elements of Medicaid privatization. Identifying these specific
features can help to clarify when, if at all, Medicaid privatization impacts government visibility.
This index also enables me to test whether elements of Medicaid privatization are implemented
in tandem. One of the earliest moves toward Medicaid privatization dates back to the 1980s with
the introduction of managed care plans. Under Medicaid managed care, states contract with
managed care organizations (MCOs). States provide MCOs with a set monthly payment
(capitation), and the MCOs provide health insurance benefits to the enrollees. MCOs currently
represent the most widespread form of Medicaid privatization in terms of enrollment (CMS 2013
Managed Care Enrollment Report).3 Accordingly, this study focuses on Medicaid privatization
via managed care. In a managed care arrangement, Medicaid enrollees receive their health
3 A voucher system did not become an approved form of Medicaid delivery until 2013, when states applied to the CMS for waivers to use vouchers in their plans to expand Medicaid eligibility in accordance with the Affordable Care Act (Kaiser Family Foundation “Medicaid Expansion in Arkansas” February 12, 2015).
DRAFT: PLEASE DO NOT CITE OR CIRCULATE WITHOUT THE AUTHOR’S PERMISSION
8
insurance from a nongovernmental entity called a Managed Care Organization (MCO). The
added institutional layer of the MCO moves Medicaid administration away from the government
by creating a new, nongovernmental (i.e. private), organization that directly interfaces with the
Medicaid recipient. The introduction of MCOs also made many of these Medicaid plans look
more like private insurance, which by this time had increased its reliance on a managed care
model.
States determine whether and how to implement managed care, and can require managed
care enrollment for a broader share of the Medicaid population under the Section 1915(b) waiver
program. Section 1115 of the Social Security Act allows states to apply for waivers that grant
additional flexibility in administering Medicaid programs. These measures provide states with
substantial latitude in managed care implementation, which has created significant between-state
variation in MCO reliance and administration. For instance, some states have nearly 100% of
their Medicaid population in MCOs while others have no Medicaid MCO penetration (CMS
Medicaid Managed Care Report 2015). In this paper, I test whether variation in Medicaid
managed care implementation affects whether recipients are aware that they are enrolled in
Medicaid. National surveys of Medicaid use, including Census surveys, drastically
underestimate Medicaid enrollment compared to administrative records (Call et al. 2013).
Inquiries into this Medicaid undercount have centered on two of the most prominent surveys
used to measure Medicaid enrollment: the Census’s American Community Survey (ACS) and the
Current Population Survey (CPS) (see, for instance, Abraham, Karaca-Mandic, and Boudreaux
2013; Boudreaux et al. 2015; Call et al. 2008; Davern et al. 2009). These studies show that
although it is seemingly straightforward to measure who receives Medicaid – just ask – the
resulting responses can underestimate the size of the Medicaid population by more than 40%
DRAFT: PLEASE DO NOT CITE OR CIRCULATE WITHOUT THE AUTHOR’S PERMISSION
9
(Davern et al. 2009). Leading explanations of the Medicaid undercount attribute this
mismeasurement largely to question wording and survey design. However, the theoretical
connection between privatization and confusion over government’s presence suggests that
Medicaid privatization may also contribute to the Medicaid undercount. There are a number of
studies that examine the relationship between Medicaid managed care and the Medicaid
undercount. Eberely et al. found that managed care usage reduced the accuracy of self-reports
(2009). Similarly, Chattopadhyay and Bindman studied Medicaid managed care enrollment
within the state of California and found that increased Medicaid managed care penetration
correlated with lower estimates of Medicaid enrollment (2006). Yet, other researchers
conversely found that including a variable for use of managed care plans versus fee-for-service
Medicaid failed to predict, or even lessened, the Medicaid undercount (Call et al. 2008;
Kincheloe et al. 2006). More recently, Plotzke, Klerman, and Davern (2010) used individual-
level data matched to administrative records and found that managed care usage did not have a
statistically significant effect on the accuracy of Medicaid reporting in the CPS. Among persons
who had Medicaid but did not use medical services in the past year, however, managed care
enrollees were more likely than fee-for-service enrollees to correctly report their Medicaid status.
Although these aforementioned studies present disparate findings, they are identical in
that they all treat Medicaid managed care as a dichotomous variable. They measure whether or
not a plan is an MCO, without accounting for variation between managed care plans. I attempt
to make sense of the conflict in the Medicaid undercount literature by identifying and measuring
the aspects of managed care plans that are the most theoretically relevant to the submerged state
literature and, in turn, the underreporting of Medicaid enrollment. The submerged state literature
theorizes that privatization should lead to the decreased visibility of the state. It predicts that as a
DRAFT: PLEASE DO NOT CITE OR CIRCULATE WITHOUT THE AUTHOR’S PERMISSION
10
state’s Medicaid program is privatized, government’s role in this health insurance becomes less
clear. Cantor et al. theorized that Medicaid MCO enrollees may misperceive the public nature of
their Medicaid plans because of their interactions with the managed care company and their
familiarity with their plan’s (non-Medicaid) name (Cantor et al. 2007). I test Cantor’s prediction
by measuring whether the name of the managed care company and the composition of who the
managed care company serves are related to the underreporting of Medicaid enrollment. Some
Medicaid MCO plans include the name of the insurance company administering the plan in the
plan name, other MCOs keep Medicaid or the name of the geographic region being served in the
plan name, and still other plans do neither. It stands to reason that plans which keep the
geographic unit served in the plan’s name, such as the Health Plan of San Joaquin (the Medicaid
managed care entity for California’s San Joaquin county) are more likely to be recognized as a
Medicaid plan than Medicaid MCOs that have the name of private insurance companies in their
plan name, such as Indiana’s Anthem MCO. In terms of Medicaid MCO enrollment, the Centers
for Medicare and Medicaid Services (CMS) divides managed care organizations into seven
different types of entities. Plans that provide full insurance coverage to an enrollee are classified
as comprehensive-care entities. This is in contrast to partial-care insurance plans, which only
provide limited forms of coverage, such as contraceptive coverage. The two most prevalent
types of comprehensive-care MCOs are commercial MCOs and Medicaid-only MCOs.
Medicaid-only MCOs provide services to Medicaid beneficiaries only. Commercial MCOs
provide services “to both Medicaid and commercial and/or Medicare” enrollees (CMS 2008
Managed Care Enrollment Report). Commercial MCOs may be more likely to cause confusion
about Medicaid enrollment because these MCOs are also providing services to non-Medicaid
enrollees and as such, their representatives and plan materials engage with and are targeted
DRAFT: PLEASE DO NOT CITE OR CIRCULATE WITHOUT THE AUTHOR’S PERMISSION
11
toward a broader population. Commercial MCOs also create the potential to allow Medicaid
enrollees to remain with the same insurance provider as they switch from private to public health
insurance.
Given the theorized relationship between submerged policy designs and awareness of
program use, I test the hypothesis that as Medicaid becomes increasingly privatized within a
state, the state’s Medicaid population is less likely to report their Medicaid enrollment. I
operationalize Medicaid privatization using the following indicators:
• MCO penetration in the Medicaid population • The construction of Medicaid MCO plan names • The member composition of the Medicaid MCO, i.e. commercial MCOs or Medicaid-
only MCOs.
Data and Methods:
To test this hypothesis, I build on a previously conducted linkage of Medicaid enrollment
records to survey self-reports. The American Community Survey (ACS) is a nationally
representative survey, conducted by the Census Bureau, which contains a battery of questions on
health insurance. The ACS questions on Medicaid enrollment describe Medicaid as a
government program. In 2013, the State Health Access Data Assistance Center (SHADAC), in
conjunction with the U.S. Census Bureau, matched ACS insurance data to Medicaid Statistical
Information System (MSIS) administrative records. They conducted this linkage using an
anonymized version of the internal Census ACS survey, which contains over 4 million personal
records for the 2008 survey. These records were then linked to MSIS records via Protected
Identification Keys (PIKs), which were developed by the Census Bureau. Through this linkage,
these researchers were able to estimate the size of the Medicaid undercount in the 2008 ACS
(Boudreaux et al. 2015). For each state and the District of Columbia they calculated the
Medicaid undercount using the following ratio:
DRAFT: PLEASE DO NOT CITE OR CIRCULATE WITHOUT THE AUTHOR’S PERMISSION
12
The number of persons who reported having Medicaid in the ACS ___and who were enrolled in Medicaid according to the MSIS___
The number of persons who were enrolled in Medicaid according to the MSIS
I use this output – the size of the Medicaid undercount in each state – as my dependent variable.4
Due to disclosure concerns, this linked data could not be released at any geographic unit smaller
than the state level (Boudreaux et al. 2015).
My key explanatory variable is a state-level measure of Medicaid privatization. This
variable is constructed from an index based on each state’s managed care arrangements. All
items in this index are calculated at the state-level and they include:
• The percent of the Medicaid population enrolled in managed care. • The percent of the Medicaid population enrolled in a commercial MCO. • The percent of the Medicaid population enrolled in a MCO with the private insurance
company’s name in the plan name. For clarity, this measure will be referred to as “privately-named Medicaid MCOs.”
The index of these three measures has a Cronbach’s alpha of .45. Given the moderate degree of
internal consistency shown by this measure of scale reliability, I analyze the components of this
measure together as an index, but I also analyze each item of the index separately. By testing the
measures separately, I can identify whether particular privatization design elements are driving
my findings.
Next, I specified relevant control variables to better ensure that any apparent correlation
between privatization and the Medicaid undercount is not the product of a correlated state-level
variable. One such potential feature is the size of a state’s elderly population. Persons aged 65
4 The published SHADAC paper recodes this variable so that higher values indicate lower levels of state-level Medicaid reporting (i.e. a larger Medicaid undercount). It also separates the state-level Medicaid reporting into two different categories for adult and child Medicaid recipients. To make interpretation of the data more easily comprehensible, I arranged the coding of the dependent variable so that higher values indicate higher levels of state-level Medicaid reporting. I also analyze all populations together, but include a variable to capture the percent of the state’s population that is over 65.
DRAFT: PLEASE DO NOT CITE OR CIRCULATE WITHOUT THE AUTHOR’S PERMISSION
13
and older are eligible for Medicare. Persons who are eligible both for Medicare, because of their
age, and Medicaid, because of their financial status, may be particularly vulnerable to
misreporting due to their dual-eligible status. However, their Medicare eligibility may also give
them a heightened awareness of, and attention to, government’s role in their health insurance.
To control for the potential that this population behaves differently than the population at large, I
included a variable that measures the percent of the Medicaid population that is 65 or older in
each state, as they would also be eligible for Medicare.
Another concern is that potential language barriers could harm Medicaid reporting. One
item in the privatization index concerns Medicaid plan names. It is possible that non-English
speakers, or persons with only limited English-language skills, would be affected disparately by
these language-based name cues. To control for this possibility, I included a measure that
captures the percent of the state’s population that speaks English “not well” or “not at all”
according to ACS survey estimates.5
5 Given the correlation between the size of a state’s population that speaks English less than well and the size of a state’s Hispanic population, I also specified a version of this model that includes a measure of the percent of a state’s Medicaid population that identifies as Hispanic. The inclusion of this variable did not affect any of the substantive findings of this paper. I also tested for a number of additional control variables not listed in the main text, none of which impacted my findings. Regression output with these additional control variables can be found in Appendix A. These additional control variables are described as follows. (1) A variable measuring the percent of the population in each state that lives below 200% of the federal poverty level. Boudreaux et al. found that persons with incomes below 200% of the federal poverty level were more likely to report their Medicaid enrollment when they have Medicaid, according to the MSIS, than persons with higher incomes. (2) A measure of the percent of the population in a state that is on Medicaid. It is possible that living in a community where Medicaid is more commonly used can improve Medicaid reporting. Including this measure of Medicaid penetration also helps to control for the Medicaid generosity of each state, given that poverty levels are also included in this regression. Moreover, having already accounted for the percent of the population that lives below 200% of the poverty line, the Medicaid penetration variable captures Medicaid generosity (i.e. the expansiveness of the state’s Medicaid eligibility) and not simply the number of low-income residents in the state. Accordingly, this measure of Medicaid penetration helps to control for a potential correlation between Medicaid generosity and the decision to implement Medicaid managed care programs. I also address this concern by including a measure of average Medicaid spending per adult enrollee.
DRAFT: PLEASE DO NOT CITE OR CIRCULATE WITHOUT THE AUTHOR’S PERMISSION
14
I also include a measure of the adult population enrolled in Temporary Aid to Needy
Families (TANF). Until the Personal Responsibility and Work Opportunity Act of 1996
(PRWOA), Medicaid eligibility was linked to Aid to Families with Dependent Children (AFDC),
a federal program that provided financial assistance to low-income families. AFDC was a highly
stigmatized program and this stigma spread to Medicaid, impacting how Medicaid was
structured (Pracht 2007; Soss and Schram 2007). In particular, the size of the adult AFDC
population was shown to influence states’ decisions to switch to Medicaid managed care (Pracht
2007). According to Pracht, the social stigma toward adults on government welfare encouraged
politicians to promote Medicaid managed care, as it was considered a less generous alternative to
fee-for-service care (2007). As AFDC has since been restructured as TANF, and there is a close
correlation between the two populations (Gilens 2009), controlling for the size of the adult
TANF population can help to control for an element of the political calculus that is related to
privatization initiatives.
The historical development of Medicaid also suggests that racial identity has the potential
to influence willingness to report Medicaid enrollment. In the latter half of the 20th century,
attitudes on welfare became strongly correlated with attitudes on race (Kellstedt 2003). In this
process, welfare became a pejorative term that could conjure racialized images of an undeserving
non-white population dependent on government largess (Gilens 2000; Katz and Thomas 1998).
The race-coding of AFDC was ultimately a key motivating factor in the push to remake AFDC
into TANF (Meyerson 1996). However, TANF and Medicaid at least partially retained the
perception that they were programs for poor African-Americans (Gilens 2009; Soss and Schram
(3) A measure of the percent of each state’s employed population that is in a union. Strong union membership was shown to be correlated with resistance to managed care initiatives (Pracht 2007).
DRAFT: PLEASE DO NOT CITE OR CIRCULATE WITHOUT THE AUTHOR’S PERMISSION
15
2007). Given this continued racialization, I include a measure of the state’s Medicaid population
that lists their racial identity as black or African American in my regression analysis.
Education levels may also influence the accuracy of survey reporting. As education
levels increase, people should be increasingly capable of shouldering the cognitive burden
imposed by survey questions. Given this, I added a measure that captures the percent of the
population in each state that has at least a high school diploma. Lastly, I included a measure of
state ideology. This measure is taken from the state ideology index created by Tausanovitch and
Warshaw (Tausanovitch and Warshaw 2013). This is a particularly critical measure because it
allows me to establish that state privatization levels are not merely a proxy for state ideology.
The inclusion of this control variable is also necessary considering that another explanation for
the Medicaid undercount, aside from lack of awareness or confusion, is that respondents are
consciously misreporting their Medicaid use. It is possible that the stigma attached to this public
benefit may encourage the misreporting of Medicaid enrollment. This form of error is only a
concern for my analysis to the extent that these conscious misreports are correlated with the
state’s degree of privatization. The most plausible mechanism through which the two would be
connected is political ideology. Accordingly, the state-level political ideology variable helps to
control for the effects of this alternative cause of misreporting.
To summarize, I use the following model, model one, to measure the consequences of
Y = Percent of the state’s Medicaid population that reports Medicaid in the ACS X1 = State’s degree of Medicaid privatization X2 = Percent of the Medicaid population that is over 65 years of age X3 = Percent of the state adult population that receives TANF
DRAFT: PLEASE DO NOT CITE OR CIRCULATE WITHOUT THE AUTHOR’S PERMISSION
16
X4 = Percent of the state population that speaks English less than well or not at all X5 = Percent of the state Medicaid population that identifies as African American X6 = Percent of the state population that received a high school diploma X7 = State political ideology My analyses of this model use robust standard errors. Estimating regression parameters using
robust regression analysis protects the resulting estimates from being unduly impacted by
deviations from modeling assumptions created by heteroscedasticity and outliers (Western
1995).
Next, I test whether these privatization measures relate to decreased levels of Medicaid
self-reporting in wave three of the National Longitudinal Survey of Adolescent to Adult Health
(Add Health). 6 This analysis uses state-level privatization variables as my explanatory variables
of interest. For the dependent variable, however, I use individual-level measures of Medicaid
reporting. I moved this variable to the individual-level by first constructing a measure of
Medicaid eligibility. I determined Medicaid eligibility based on whether the respondent met
state eligibility limits concerning total household income, parental status, employment, and
qualifying health conditions. I then limited my analysis to survey respondents who were eligible
for Medicaid in their state. The dependent variable in this analysis is a dichotomous measure of
whether or not the Medicaid-eligible respondent reported Medicaid, and as such, I use a logistic
regression model. In analyzing the Add Health data, I use the same control variables listed in
model one. A salient distinction from the ACS model, however, is that the Add Health survey
data allows me to measure the control variables – TANF enrollment, language skills, race,
education, and political ideology – at the individual level. Given the previously-discussed
theoretical connection between state-level political environment and Medicaid reporting, I
6 Wave 3 of the Add Health in-home survey was conducted from August 2001- April 2002.
DRAFT: PLEASE DO NOT CITE OR CIRCULATE WITHOUT THE AUTHOR’S PERMISSION
17
include both state and individual-level measures of political ideology.7 In the Add Health
analysis, I also omit the variable measuring recipients aged 65 and over because the Add Health
sample was limited to respondents aged 18-28. Accordingly, the model used to analyze the Add
Y = Whether or not a Medicaid-eligible respondent reported Medicaid enrollment X1 = State’s Degree of Medicaid Privatization X2 = TANF Enrollment X3 = Language Proficiency9 X4 = Identification as African-American X5 = Highest Educational attainment10 X6 = Political Ideology X7 = State Political Ideology I account for heteroscedasticity created by the inclusion of state-level variables by clustering
standard errors at the state level. I also re-analyze model two as a multilevel model. Multilevel
modeling accounts for individual and group-level variation when estimating regression
coefficients, such as as state-level Medicaid privatization, at the group level (Gelman and Hill
2006: 246). It models the clustering of respondents within states by treating each state as a
separate context, the “fixed effects” component of the model, and specifying a variance
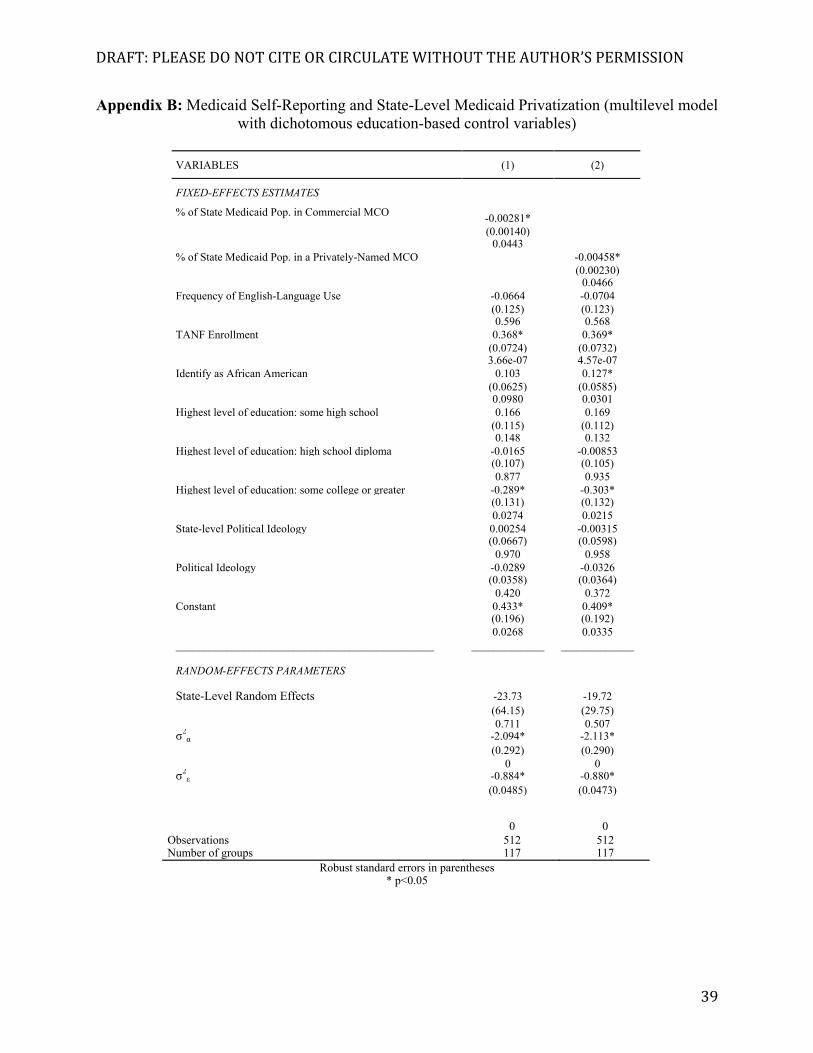
7 Although I include these variables because of their theoretical relevance, omitting them from the analysis does not impact the findings. 8 As the Add Health data does not include a measure of union membership, and as the sample size was already limited to persons under 200% FPL, I did not include these addition control measures from model one in re-analyzing the Add Health output. 9 The Add Health measures of language proficiency focus on frequency of use of a non-English language. This creates a discrepancy between the ACS and the Add Health models. As with model one, I re-ran model two with a measure of Hispanic identification. Output with this additional control variable is included in Appendix B. 10 I also re-measured education using a series of dichotomous variables that indicate one’s highest level of educational achievement (some high school, a high school diploma, some college, and a college degree or greater). These indicator variables did not change my findings. Output with these measures is included in Appendix B.
DRAFT: PLEASE DO NOT CITE OR CIRCULATE WITHOUT THE AUTHOR’S PERMISSION
18
component that allows the intercept to vary according to respondents’ state of residency, the
“random effects” component of the model. The multilevel analysis used in model 3 in defined
Model three uses the same dependent and independent variables specified in model two.
Findings
My first series of analyses use the linked aggregate ACS data. To ensure that any
observed relationship between privatization and Medicaid underreporting is not a product of
copious control variables, I first tested for a bivariate relationship between Medicaid reporting
and privatization. I found a statistically significant relationship between Medicaid reporting and
commercial MCO penetration (p=.022), with Medicaid reporting decreasing as commercial
MCO penetration increased. Recall, by decreased Medicaid reporting, I am referring to
decreased Medicaid reporting among persons who were enrolled in Medicaid according to MSIS
Medicaid administrative data. Similarly, increased penetration of privately-named MCOs
related to decreased Medicaid reporting (p=.027). The index variable, which was constructed
from all three privatization measures, was also statistically significant at the .05 level (p=.019).
However, I failed to find evidence of a statistically-significant bivariate relationship between
managed care penetration and Medicaid reporting (p= .948).
< Table One Here >
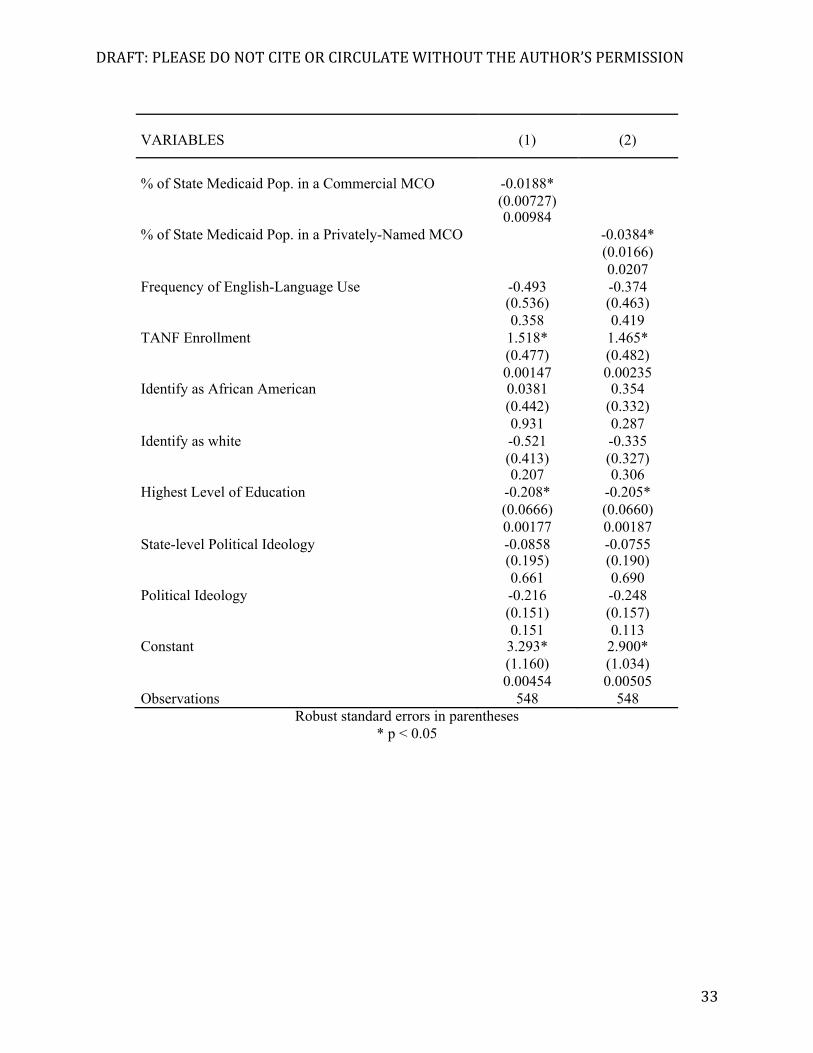
Next, I reanalyzed this data with the set of control variables listed in model one. These
results, detailed in table two, are consistent with my findings from the bivariate analysis. As the
percent of the Medicaid population that uses a commercial MCO grows, the size of a state’s
DRAFT: PLEASE DO NOT CITE OR CIRCULATE WITHOUT THE AUTHOR’S PERMISSION
19
Medicaid undercount (i.e. the underreporting of Medicaid enrollment) grows (p=.013).
Similarly, as the percent of the Medicaid population enrolled in privately-named plans grows, the
underreporting of Medicaid enrollment increases (p=.006).
< Table Two Here >
The privatization index also relates to Medicaid underreporting, with increased privatization
levels correlating with decreased Medicaid reporting (p=.007). However, I fail to find evidence
of a statistically significant relationship between managed care penetration and Medicaid
underreporting (p=.896).
These findings show that the form of the privatization matters. When I measure
privatization simply using managed care enrollment, which is the most widely-used measure of
Medicaid privatization in studies of the Medicaid undercount, I fail to find a significant
relationship. However, when I specify design features of Medicaid managed care that should
theoretically be expected to cause confusion about the public nature of Medicaid (specifically,
Medicaid plan names and commercial MCO penetration) these design features are related to
Medicaid underreporting. The significance of the commercial MCO variable is particularly
noteworthy given the construction of this variable. According to the 2008 CMS Managed Care
Report, an MCO is defined as commercial if it provides services to the non-Medicaid population,
the Medicare population, or both. This means that the commercial MCO variable also accounts
for plans that serve the Medicare population. I would expect this to attenuate the effects of the
commercial MCO variable because I cannot disaggregate the non-Medicare commercial MCOs
from Medicare commercial MCOs. Compared to plans that serve the general, non-Medicaid
population, I would not expect for plans that serve the Medicare population to look significantly
more like commercial plans than Medicaid-only MCOs. This finding is all the more notable
DRAFT: PLEASE DO NOT CITE OR CIRCULATE WITHOUT THE AUTHOR’S PERMISSION
20
given that I control for the potential confusion created by the Medicaid-Medicare overlap, and
that a larger dual eligible population is related to improved Medicaid reporting.
With respect to the size of this impact, my findings suggest that, for every 1% increase in
the commercial MCO population, .06% fewer Medicaid recipients are reporting their enrollment.
Similarly, for every 1% increase in the number of Medicaid recipients in privately-named
MCOs, .082% fewer Medicaid recipients are reporting their enrollment. This suggests that the
size of the effect of these individual privatization measures is very modest. However, the
coefficient of the index variable is substantially larger. For every 1% increase in the degree of
privatization, Medicaid reporting decreases by approximately 1.07%. This indicates that the
impact of privatization grows as these different features of Medicaid managed care are
implemented in tandem.
These results, however, should be interpreted with caution. First, it is important to stress
that although these findings demonstrate a correlation between privatization and Medicaid
underreporting, this does not prove causation. While I have included theoretically-relevant
control variables in an attempt to account for other potential causal explanations, this does not
eliminate the possibility that the patterns demonstrated in this research are caused by a correlated
alternative factor. Moreover, this analysis uses aggregate data, which limits what these findings
can say about individual-level behavior with respect to privatization and Medicaid
underreporting. To address the concerns created by the use of aggregate data for these analyses,
I retest my hypothesis using Medicaid reporting in the Add Health survey. In this analysis, I use
individual-level measures of Medicaid reporting paired with state-level measures of Medicaid
privatization. This use of individual-level dependent variables allows me to make inferences
with respect to individual-level behavior. I begin my analysis by once again testing for a
DRAFT: PLEASE DO NOT CITE OR CIRCULATE WITHOUT THE AUTHOR’S PERMISSION
21
bivariate relationship between Medicaid reporting and Medicaid privatization. As the
independent variable of interest is a state-level variable, I cluster the standard errors at the state
level to account for heterogeneity in the error terms. Here, I find a statistically significant
correlation between both commercial MCO enrollment and the size of the Medicaid undercount
(p=.025), and enrollment in privately-named plans and the size of the Medicaid undercount
(p=.022).
< Table Three Here >
Table four shows that this relationship holds when I run this analysis with the full list of
control variables detailed in model two. As the percent of a state’s Medicaid population in a
commercial MCO increases, Medicaid-eligible respondents become less likely to report
Medicaid enrollment (p=.010). Likewise, as the percent of a state’s Medicaid population in
privately-named MCOs increases, Medicaid-eligible respondents become less likely to report
Medicaid enrollment (p=.021).
< Table Four Here >
The results of my analysis using the multilevel model, model three, are detailed in table
five. These findings confirm my previous results. Increased penetration of commercial MCO
enrollment and increased penetration of privately-named plans relate to a decrease in Medicaid
reporting among Medicaid-eligible recipients in the bivariate model (p =.042, and p =.032,
respectively), as well as the model with the full set of control variables (p = .044, and p = .038,
respectively).
< Tables Five and Six Here >
These results, however, do not tell me how these Medicaid eligible respondents are
misreporting their insurance status. Are the respondents who do not report Medicaid enrollment
DRAFT: PLEASE DO NOT CITE OR CIRCULATE WITHOUT THE AUTHOR’S PERMISSION
22
reporting that they are uninsured or are they reporting a different type of insurance coverage,
such as private insurance? To get at this question, I keep the sample limited to Medicaid-eligible
respondents, but I create a new dichotomous dependent variable that measures whether a
respondent reports Medicaid or the respondent reports having private insurance. By private
insurance, I am referring to health insurance that is provided by a source other than government.
Using this measure, I find that increased commercial MCO enrollment, as well as increased
enrollment in privately-named plans, relate to a greater propensity to report private insurance
(compared to reporting Medicaid enrollment) among the Medicaid-eligible population. This
output is detailed in table six.
I also re-ran this analysis using a dependent variable that measures whether a respondent
reports Medicaid or a respondent reports having no health insurance. With this measure of the
dependent variable, I failed to find a statistically-significant relationship between commercial
MCO enrollment, or enrollment in privately-name plans, and Medicaid reporting (see table
seven). In other words, among the Medicaid-eligible population, neither an increase in
commercial MCO enrollment nor increased enrollment in privately-named plans correlates with
an increased likelihood of reporting being uninsured. This finding holds for both the logistic
regression model and the multilevel analysis. Output from these models is detailed below.
< Table Seven & Eight Here >
Viewed together with my previous finding, this suggests that Medicaid privatization may
increase the number of Medicaid enrollees who report having private insurance, but that I do not
find a connection between privatization and estimates of the uninsured.11 This distinction is
11 This finding is in line with Boudreaux et al.’s conclusion that respondents who misreported their Medicaid status were more likely to report having private health insurance rather than reporting no health insurance (2015). This suggests that my finding is not merely an artifact of how I constructed the Medicaid-eligibility variable.
DRAFT: PLEASE DO NOT CITE OR CIRCULATE WITHOUT THE AUTHOR’S PERMISSION
23
consistent with my expectation for why Medicaid privatization should impact the Medicaid
undercount. I theorized that privatization had the potential to influence Medicaid reporting by
obscuring the visibility of government’s presence. Rather than making people think that they
lack health insurance, the relationship between Medicaid privatization and the increased
reporting of private insurance suggests that privatization hampers Medicaid recipients’
recognition of the public origins of their health insurance.
Discussion
Overall, this research demonstrates that the privatization of a major social program can be
related to decreased awareness of program use. Just as critically, it also shows that not all
privatization initiatives have the same effects and that the form of the privatization matters. The
finding that increased reliance on commercial MCOs and privately-named MCOs correlate with
higher levels of Medicaid underreporting makes intuitive sense. It indicates that forms of
privatization that scramble signals of government involvement drive the relationship between
privatization and underreporting Medicaid. This finding emphasizes the necessity of treating
privatization as more than a dichotomous measure in research on the effects of program
privatization. However, the analysis used in this research establishes a correlation, but not
necessarily causation. Accordingly, I cannot definitively claim that privatization causes this
underreporting. Rather, this research identifies a pattern showing that an increase in design
features that obscure government’s role in Medicaid corresponds with a larger portion of the
Medicaid population failing to recognize and report their enrollment. That this pattern persisted
in two different data sets and with multiple modeling specifications, however, indicates the
robustness of this relationship. This finding also cautions more broadly against interpreting self-
DRAFT: PLEASE DO NOT CITE OR CIRCULATE WITHOUT THE AUTHOR’S PERMISSION
24
reports as an unbiased measure of program use, particularly for programs that are theorized to be
a part of submerged state policies.
In identifying this relationship, this research suggests that estimates of Medicaid
enrollment which rely on self-reports should be corrected to account for states’ levels of
privatization, specifically their joint reliance on commercial MCOs and privately-named MCO
plans. The Congressional Budget Office (CBO), along with state governments, use Medicaid
enrollment statistics from Census surveys to estimate the cost of, and compliance with,
legislation (see, for example, CBO Long-Term Budget Outlook, 2015; Legislative Budget Board
Staff Estimate, 2013). Inaccurate measurement can lead to inefficient, and less effective, policy
administration. Although the size of the aggregate misreporting identified in this research is
modest, the growth in Medicaid managed care reliance is not. Some of the most populous states
in the country, such as Florida, are transferring their Medicaid population almost entirely to
MCOs, meaning that these privatization initiatives affect a rapidly growing portion of the
population (CMS 2016). This paper provides guidance on which elements of managed care
policy designs to account for when generating corrected estimates of Medicaid enrollment.
The civic consequences of this research, however, extend beyond inaccurate
measurement. Medicaid is the largest source of public health insurance in the country. It is
directly responsible for the health care of communities at the margins of American society:
children, their parents, the elderly, and the disabled living below or near the poverty line. My
findings suggest that Medicaid enrollees may have an increasingly difficult time recognizing
their enrollment, and consequently, government’s personal relevance. Aside from creating
unrecognized material changes, submerging the public origins of people’s health insurance
makes it more difficult for Medicaid recipients to have informed civic responses to this major
DRAFT: PLEASE DO NOT CITE OR CIRCULATE WITHOUT THE AUTHOR’S PERMISSION
25
government intervention in their lives. When people fail to recognize that they are interacting
with government, conceptions of government’s personal relevance are – by definition –
distorted. This research suggests that this distortion is connected to policy design. The hope is
that calling attention to this phenomenon, and government’s role in its creation, encourages
scholars to investigate the ways in which this submersion impacts the target population’s civic
understandings and behaviors.
DRAFT: PLEASE DO NOT CITE OR CIRCULATE WITHOUT THE AUTHOR’S PERMISSION
26
References
Abraham, Jean M., Pinar Karaca-Mandic, and Michel Boudreaux. 2013. “Sizing Up the
Individual Market for Health Insurance A Comparison of Survey and Administrative Data Sources.” Medical Care Research and Review 70 (4): 418–33.
Bendz, Anna. 2015. “Paying Attention to Politics: Public Responsiveness and Welfare Policy
Change.” Policy Studies Journal 43 (3): 309–32. Boudreaux, Michel H., Kathleen Thiede Call, Joanna Turner, Brett Fried, and Brett O’Hara.
2015. “Measurement Error in Public Health Insurance Reporting in the American Community Survey: Evidence from Record Linkage.” Health Services Research, 50 (6): 1973–95.
Call, Kathleen T., Michael E. Davern, Jacob A. Klerman, and Victoria Lynch. 2013. “Comparing
Errors in Medicaid Reporting across Surveys: Evidence to Date.” Health Services Research 48 (2pt1): 652–64.
Call, Kathleen Thiede, Gestur Davidson, Michael Davern, and Rebecca Nyman. 2008.
“Medicaid Undercount and Bias to Estimates of Uninsurance: New Estimates and Existing Evidence.” Health Services Research 43 (3): 901–14.
Cantor, Joel C, Alan C Monheit, Susan Brownlee, and Carl Schneider. 2007. “The Adequacy of
Household Survey Data for Evaluating the Nongroup Health Insurance Market.” Health Services Research 42 (4): 1739–57.
Centers for Medicare and Medicaid Services. 2015. "Medicaid Managed Care Enrollment and
Program Characteristics, 2013." Winter. Available at: https://www.medicaid.gov/medicaid-chip-program-information/by-topics/data-and-systems/medicaid-managed-care/downloads/2013-managed-care-enrollment-report.pdf
Centers for Medicare and Medicaid Services. 2008. "Medicaid Managed Care Enrollment Report
and Summary Statistics as of June 30, 2008." June 30. Available at: http://communityplans.net/ResourceCenter/MedicaidManagedCareData/tabid/361/Default.aspx
Chattopadhyay, Arpita, and Andrew B. Bindman. 2006. “The Contribution of Medicaid
Managed Care to the Increasing Undercount of Medicaid Beneficiaries in the Current Population Survey.” Medical Care 44 (9): 822–26.
Congressional Budget Office. 2015. “The 2015 Long-Term Budget Outlook." Congress of the
United States. Available at: https://www.cbo.gov/sites/default/files/114th-congress-2015-2016/reports/50250-LongTermBudgetOutlook-4.pdf
DRAFT: PLEASE DO NOT CITE OR CIRCULATE WITHOUT THE AUTHOR’S PERMISSION
27
Davern, Michael, Jacob Alex Klerman, David K. Baugh, Kathleen Thiede Call, and George D. Greenberg. 2009. “An Examination of the Medicaid Undercount in the Current Population Survey: Preliminary Results from Record Linking.” Health Services Research 44 (3): 965–87.
DiIulio, John. 2014. Bring Back the Bureaucrats: Why More Federal Workers Will Lead to
Better (and Smaller!) Government. Templeton Press. Earle, John S., and Scott Gehlbach. 2003. “A Spoonful of Sugar: Privatization and Popular
Support for Reform in the Czech Republic.” Economics and Politics 15 (1): 1–32. Eberly, Todd, Mary Beth Pohl, and Stacey Davis. 2009. “Undercounting Medicaid Enrollment in
Maryland: Testing the Accuracy of the Current Population Survey.” Population Research and Policy Review 28 (2): 221–36.
Fleming, David J. 2014. “Learning from Schools: School Choice, Political Learning, and Policy
Feedback.” Policy Studies Journal 42 (1): 55–78. Gelman, Andrew and Jennifer Hill. 2006. Data Analysis Using Regression and ……….Multilevel/Hierarchical Models. 1 edition. Cambridge: Cambridge University Press. Gilens, Martin. 2000. Why Americans Hate Welfare: Race, Media, and the Politics of
Antipoverty Policy. 1 edition. Chicago: University of Chicago Press. ———. 2009. “Racial Attitudes and Opposition to Welfare.” The Journal of Politics 57 (04):
994. Howard, Christopher. 1999. The Hidden Welfare State: Tax Expenditures and Social Policy in
the United States. Princeton, NJ: Princeton University Press. Katz, Michael B., and Lorrin R. Thomas. 1998. “The Invention of ‘Welfare’ in America.”
Journal of Policy History 10 (04): 399–418. Kaiser Family Foundation. 2015 "Medicaid Expansion in Arkansas," February 12. Available at:
http://kff.org/medicaid/fact-sheet/medicaid-expansion-in-arkansas Kaiser Family Foundation. 2016 "Status of State Action on the Medicaid Expansion Decision," ………March 14. Available at: http://kff.org/health-reform/state-indicator/state-activity-………around-expanding-medicaid-under-the-affordable-care-act/ Kellstedt, Paul M. 2003. The Mass Media and the Dynamics of American Racial Attitudes.
Cambridge University Press. Kettl, Donald F. 2009. The Next Government of the United States: Why Our Institutions Fail Us
and How to Fix Them. W. W. Norton & Company.
DRAFT: PLEASE DO NOT CITE OR CIRCULATE WITHOUT THE AUTHOR’S PERMISSION
28
Kincheloe, Jennifer, E. Richard Brown, Janice Frates, Kathleen Thiede Call, Wei Yen, and Jim Watkins. 2006. “Can We Trust Population Surveys To Count Medicaid Enrollees And The Uninsured?” Health Affairs 25 (4): 1163–67.
Klerman, Jacob A., Michael Davern, Kathleen Thiede Call, Victoria Lynch, and Jeanne D.
Ringel. 2009. “Understanding The Current Population Survey’s Insurance Estimates And The Medicaid ‘Undercount.’” Health Affairs 28 (6): 991–1001.
Care Act (ACA) Optional Medicaid Expansion: Fiscal Impact Estimate for Texas, State Fiscal Years (SFYs) 2014-2013." Texas State Legislature. Available at http://www.lbb.state.tx.us/Documents/Appropriations_Bills/83/ Decision_Docs/Expansion%20Estimate%20March%2004%202013.pdf
Lerman, Amy. “Garbage In, Garbage Out: Information, Experience, and Public Attitudes toward
Privatization.” Manuscript in Preparation. Lundqvist, Lennart J. 1988. “Privatization: Towards a Concept for Comparative Policy
Analysis.” Journal of Public Policy 8 (01): 1. Medicaid.gov. 2016. "Medicaid: Managed Care." Accessed at: https://www.medicaid.gov/ ………medicaid-chip-program-information/by-topics/delivery-systems/managed-care/managed-………care-site.html Mettler, Suzanne. 2011. The Submerged State: How Invisible Government Policies Undermine
American Democracy. Chicago Studies in American Politics. Chicago: University of Chicago Press.
Meyerson, Harold. 1996. “Wither the Democrats.” The American Prospect. April-March.
Accessed at: http://prospect.org/article/wither-democrats. Moore, Colin D. 2015. “Innovation without Reputation: How Bureaucrats Saved the Veterans’
Health Care System.” Perspectives on Politics 13 (02): 327–44. Morgan, Kimberly J., and Andrea Louise Campbell. 2011. The Delegated Welfare State:
Medicare, Markets, and the Governance of Social Policy. Oxford University Press, USA. Pierce, Jonathan J., Saba Siddiki, Michael D. Jones, Kristin Schumacher, Andrew Pattison, and
Holly Peterson. 2014. “Social Construction and Policy Design: A Review of Past Applications.” Policy Studies Journal 42 (1): 1–29.
Plotzke, Michael R., Jacob Alex Klerman, and Michael Davern. 2010. “How Does Medicaid-
Managed Care Impact Reporting of Medicaid Status?: Medicaid-Managed Care.” Health Services Research 45 (5p1): 1310–23.
DRAFT: PLEASE DO NOT CITE OR CIRCULATE WITHOUT THE AUTHOR’S PERMISSION
29
Pracht, Etienne E. 2007. “State Medicaid Managed Care Enrollment: Understanding the Political Calculus That Drives Medicaid Managed Care Reforms.” Journal of Health Politics, Policy & Law 32 (4): 685–731.
Skocpol, Theda, and Kenneth Finegold. 1982. “State Capacity and Economic Intervention in the
Early New Deal.” Political Science Quarterly 97 (2): 255–78. Soss, Joe, and Sanford F. Schram. 2007. “A Public Transformed? Welfare Reform as Policy
Feedback.” American Political Science Review 101 (01): 111–27. Tausanovitch, Chris, and Christopher Warshaw. 2013. “Measuring Constituent Policy
Preferences in Congress, State Legislatures, and Cities.” The Journal of Politics 75 (02): 330–42. Available at: http://www.americanideologyproject.com/.
Western, Bruce. 1995. “Concepts and Suggestions for Robust Regression Analysis.” American
Journal of Political Science, 786–817.
DRAFT: PLEASE DO NOT CITE OR CIRCULATE WITHOUT THE AUTHOR’S PERMISSION
30
Tables for Paper Manuscript: Out of Sight, Out of Mind? Measuring the Relationship Between Privatization and Medicaid Self-Reporting
Table One: Privatization and Medicaid Reporting (bivariate analysis)
VARIABLES (1) (2) (3) (4)
% of State Medicaid Population in a Commercial MCO
-0.0932*
(0.0383) 0.0187 % of State Medicaid Population in a Privately-Named MCO
-0.123*
(0.0471) 0.0118 % of State Medicaid Population with Managed Care
DRAFT: PLEASE DO NOT CITE OR CIRCULATE WITHOUT THE AUTHOR’S PERMISSION
32
Table Three: Medicaid Self-Reporting and State-level Medicaid Privatization (bivariate
analysis)
Table Four: Medicaid Self-Reporting and State-Level Medicaid Privatization
VARIABLES (1) (2)
% of State Medicaid Pop. in a Commercial MCO -0.0152* (0.00674) 0.0243 % of State Medicaid Pop. in a Privately-Named MCO -0.0518* (0.0226) 0.0219 Constant -0.175 -0.219 (0.165) (0.146) 0.289 0.134 Observations 570 570
Robust standard errors in parentheses * p < 0.05
!
DRAFT: PLEASE DO NOT CITE OR CIRCULATE WITHOUT THE AUTHOR’S PERMISSION
33
VARIABLES (1) (2)
% of State Medicaid Pop. in a Commercial MCO -0.0188* (0.00727) 0.00984 % of State Medicaid Pop. in a Privately-Named MCO -0.0384* (0.0166) 0.0207 Frequency of English-Language Use -0.493 -0.374 (0.536) (0.463) 0.358 0.419 TANF Enrollment 1.518* 1.465* (0.477) (0.482) 0.00147 0.00235 Identify as African American 0.0381 0.354 (0.442) (0.332) 0.931 0.287 Identify as white -0.521 -0.335 (0.413) (0.327) 0.207 0.306 Highest Level of Education -0.208* -0.205* (0.0666) (0.0660) 0.00177 0.00187 State-level Political Ideology -0.0858 -0.0755 (0.195) (0.190) 0.661 0.690 Political Ideology -0.216 -0.248 (0.151) (0.157) 0.151 0.113 Constant 3.293* 2.900* (1.160) (1.034) 0.00454 0.00505 Observations 548 548
Robust standard errors in parentheses * p < 0.05
!
DRAFT: PLEASE DO NOT CITE OR CIRCULATE WITHOUT THE AUTHOR’S PERMISSION
34
Table Five: Medicaid Self-Reporting and State-Level Medicaid Privatization (multilevel model)
VARIABLES
(1)
(2)
FIXED-EFFECTS ESTIMATES
% of State Medicaid Pop. in a Commercial MCO -0.00354* (0.00174) 0.0416 % of State Medicaid Pop. in a Privately-Named MCO
(0.0623) (0.0639) 0 0 Observations 302 302 Number of groups 106 106
Robust standard errors in parentheses; * p < 0.05 !
DRAFT: PLEASE DO NOT CITE OR CIRCULATE WITHOUT THE AUTHOR’S PERMISSION
38
Appendix A: Privatization and Medicaid Underreporting (with additional control variables)
!
VARIABLES (1) (2) (3) (4)
% of State Medicaid Population in a Commercial MCO
-0.0611*
(0.0208) 0.00563 % of State Medicaid Population in a Privately-Named MCO
-0.0667*
(0.0306) 0.0356 % of State Medicaid Population with Managed Care
0.000650
(0.0231) 0.978 State's Degree of Privatization -0.984* (0.368) 0.0112 % of Medicaid Population Over 65 Years of Age
1.047* 1.054* 1.006* 1.055*
(0.269) (0.284) (0.306) (0.275) 0.000411 0.000699 0.00227 0.000490 % of Medicaid Population: African American
-0.0401 -0.0342 -0.0295 -0.0376
(0.0279) (0.0278) (0.0297) (0.0277) 0.159 0.227 0.328 0.183 % of State with High School Degree 0.156 0.153 0.218 0.148 (0.287) (0.299) (0.302) (0.293) 0.591 0.612 0.476 0.617 % of State Adult Population on TANF 1.845 1.696 0.883 1.842 (1.595) (1.781) (2.201) (1.632) 0.255 0.347 0.691 0.267 State Ideology -0.0226 -0.0244 -0.0245 -0.0234 (0.0194) (0.0201) (0.0218) (0.0197) 0.252 0.233 0.268 0.241 % of State That Speaks English Less Than Very Well
-0.670* -0.681* -0.741* -0.670*
(0.178) (0.168) (0.234) (0.167) 0.000587 0.000257 0.00309 0.000297 % of State Population on Medicaid 0.374* 0.363* 0.381* 0.367* (0.103) (0.113) (0.123) (0.107) 0.000875 0.00289 0.00369 0.00154 % of State Population Under 200% FPL 0.188 0.179 0.213 0.180 (0.118) (0.128) (0.129) (0.124) 0.120 0.172 0.108 0.155 % of Medicaid Population: Hispanic 0.0283 0.0242 0.0392 0.0249 (0.0535) (0.0522) (0.0648) (0.0519) 0.600 0.647 0.549 0.634 % of State in Labor Union 0.107 0.0888 0.0848 0.0990 (0.0956) (0.0978) (0.114) (0.0963) 0.269 0.370 0.463 0.311 Average Spending Per Adult Medicaid Enrollee
DRAFT: PLEASE DO NOT CITE OR CIRCULATE WITHOUT THE AUTHOR’S PERMISSION
39
Appendix B: Medicaid Self-Reporting and State-Level Medicaid Privatization (multilevel model with dichotomous education-based control variables)
VARIABLES (1) (2)
FIXED-EFFECTS ESTIMATES
% of State Medicaid Pop. in Commercial MCO
-0.00281*
(0.00140) 0.0443 % of State Medicaid Pop. in a Privately-Named MCO -0.00458* (0.00230) 0.0466 Frequency of English-Language Use -0.0664 -0.0704 (0.125) (0.123) 0.596 0.568 TANF Enrollment 0.368* 0.369* (0.0724) (0.0732) 3.66e-07 4.57e-07 Identify as African American 0.103 0.127* (0.0625) (0.0585) 0.0980 0.0301 Highest level of education: some high school 0.166 0.169 (0.115) (0.112) 0.148 0.132 Highest level of education: high school diploma -0.0165 -0.00853 (0.107) (0.105) 0.877 0.935 Highest level of education: some college or greater -0.289* -0.303* (0.131) (0.132) 0.0274 0.0215 State-level Political Ideology 0.00254 -0.00315 (0.0667) (0.0598) 0.970 0.958 Political Ideology -0.0289 -0.0326 (0.0358) (0.0364) 0.420 0.372 Constant 0.433* 0.409* (0.196) (0.192) ______________________________________________ RANDOM-EFFECTS PARAMETERS