DRAGONFLY FLIGHT: POWER REQUIREMENTS AT HIGHSPEED AND ACCELERATION
BY MICHAEL L. MAY
Department of Entomology, New Jersey Agricultural Experiment Station, CookCollege, Rutgers University, New Brunswick, NJ 08903, USA
Accepted 28 February 1991
Summary
Most studies of insect flight deal primarily with hovering or with forward flightat constant, moderate speed. This paper reports investigations of flight character-istics that are especially relevant to the performance of dragonflies at high and/orchanging velocity. Dragonflies were filmed in free flight in the field to determinevelocity and acceleration. The power required for repeated acceleration is shownto be large, in some circumstances, relative to the estimated maximum availablepower and probable top power requirements for steady flight. Distributions ofvelocity and acceleration, and concomitant power requirements, differ markedlyamong species, however. In addition, parasite drag was measured in winds of2-7ms" 1 and drag coefficients determined to be about 0.40 at Reynolds numbergreater than 104. This result implies substantially lower power requirements athigh speeds, compared to previous estimates. Other aspects of power output,including the probable magnitude of inertial power, are considered in relation topublished data.
Introduction
Recent analyses of insect flight, including both metabolism (Kammer andHeinrich, 1978; Casey, 1988; Ellington et al. 1990) and aerodynamic and mechan-ical requirements (Ellington, 1984, 1985; Dudley and Ellington, 1990a,b; Caseyand Ellington, 1989), have substantially advanced our understanding of thephenomenon. Most studies, however, consider only hovering flight, although afew have investigated forward flight at moderate, nearly constant speed. Rela-tively little is known about the performance of insects near their upper limits ofvelocity and power or during rapid acceleration, or about behavioral contexts inwhich high performance is employed.
Dragonflies (Odonata: Anisoptera) have long excited aesthetic admiration andscientific interest because of their unusual aerial agility. Their remarkable flight is,nevertheless, based on morphologically primitive thoracic and wing structure(Matsuda, 1970) and probably on unusual aerodynamic mechanisms, at leastduring hovering (Weis-Fogh, 1973; Norberg, 1975; Savage et al. 1979; Somps and
|fCey words: acceleration, drag, dragonfly, flight, Odonata, power output.
326 M. L. M A Y
Luttges, 1985). Recently Azuma etal. (1985) and Azuma and Watanabe (1988)analyzed free forward flight of dragonflies in a wind tunnel, presenting a powercurve and preliminary estimates of maximum power output and flight velocity forAnax parthenope. Marden (1987) experimentally estimated maximum lift inseveral species, while Polcyn (1988) measured oxygen consumption of dragonfliesduring hovering and/or attempted escape flights from metabolism chambers.Finally, Riippell (1989) used cinematography to determine flight velocities andaccelerations of dragonflies in the field, with descriptions of associated wingmovements. Thus, a picture is beginning to emerge of the flight performance andpower output and input of which dragonflies are capable.
My aim in this paper is to augment this picture with further information onvelocity and acceleration during unhindered flight in the field and with data onparasite drag from several species of Odonata. The power required to overcomeparasite drag on the body may become an important component of aerodynamicpower at high flight speed. Similarly, the power required for acceleration may besignificant during the rapid maneuvers so characteristic of Anisoptera. I have alsotried to bring together, from a variety of sources, other information pertinent tothe relationship between power requirements and power availability in dragon-flies. Thus, the results reported here are steps towards a more completedescription of high-performance flight in Odonata.
Materials and methodsFlight characteristics
Flight speed in the field was determined for four species: Micrathyria atra(Libellulidae), Epitheca (Tetragoneuria) cynosura (Corduliidae), Macromiataeniolata (Macromiidae) and Anax junius (Aeshnidae). The insects were notindividually marked, but data for E. cynosura probably all pertain to a singleterritorial male; in other species, at least five individuals were filmed on 2-3different days. All species were filmed at mating rendezvous sites (Corbet, 1980),where nearly all individuals were males. Anax junius were also filmed while swarmfeeding over beach dunes; roughly two-thirds of these insects were probablyfemales.
Except for feeding A. junius, flying individuals were filmed from above using aCanon Auto Zoom 814 Super 8 mm cine" camera aimed vertically downwards,about 3-4 m above their usual plane of flight. Patrolling dragonflies remainedwithin a horizontal plane about 0.3-1.0 m above water level (brief upwardexcursions occurred but were not filmed), so errors in measuring frame-to-framedisplacement due to parallax or to vertical components of movement are small.Distance measurements were calibrated by suspending an object of knowndimensions in the flight plane at the beginning of each film. Interframe interval(nominally 1/24 or 1/40 s) was calibrated by filming a stopwatch. Feeding A.junius did not all fly in the same horizontal plane. The average body length of theinsects was assumed to be 7.5 cm (Needham and Westfall, 1955) and was used asj
Dragonfly flight 327
the distance standard for each flight; no correction for vertical movementcomponents was attempted. All filming was carried out under nearly still windconditions and, except for feeding A. junius, at sheltered sites. Also, the headingand course of the insects usually coincided quite closely, except in E. cynosuraduring very slow flight. Wind speed and direction were not determined, however,so magnitudes of flight velocity are actually ground speeds. I assume that theseapproximate to air speed under the conditions described.
Films were viewed frame by frame either using an 8 mm film editor and plottingposition on overlaid acetate sheets or using a binocular microscope fitted with acamera lucida and plotting each position on paper. Small shifts in the field of viewwere corrected by superimposing images of stationary objects within succeedingframes. Final images were 0.07-0.1 times life size (0.03-0.1 times for feeding A.junius).
Position records (cumulative distances along the flight path from the firstsighting, ignoring direction) were smoothed, as described by Lanczos (1957) andRayner and Aldridge (1985). Smoothed velocity and acceleration were thencalculated, also as described by those authors except that, owing to the slowfilming speed, I assumed piecewise time-constant acceleration, or change inacceleration, over only three adjacent points and adjusted the smoothing formulaeaccordingly, following the derivation in Lanczos (1957). This procedure isequivalent to calculating a two-point running average of the frame-by-frame valueof each quantity. The filming speeds I used cannot resolve very rapid changes inacceleration, such as those reported by Riippell (1989), and the smoothingprocedure may result in considerable oversmoothing (high sampling frequencyerror in the terminology of Harper and Blake, 1989). Thus, these results shouldnot be taken as instantaneous values but as two-frame averages, i.e. averages overabout 2-4 wingbeats depending on species and filming speed (see Table 1). Forcewas estimated by multiplying smoothed values of acceleration for each interval bythe average mass of the species sampled at the filming location. Power require-ments were calculated as force times smoothed velocity for each interval.
Parasite drag
I removed the wings from dead male dragonflies, fixed the legs and other partsin a natural flight posture using small drops of glue, and dried the bodies untilrigid. They were suspended upside down, parallel to an airstream, by gluing thethoracic venter to a force transducer (see below). Wind was generated by an open-circuit, open-section wind tunnel with an aperture of 20cmx20cm (Wilkin, 1990);velocity was controlled by altering fan speed with a variable transformer. Swirl andturbulence were slight at the center of the working section, as judged by theappearance of parallel smoke streams. Wind velocity was measured near the testobject using an Alnor thermo-anemometer (hot wire).
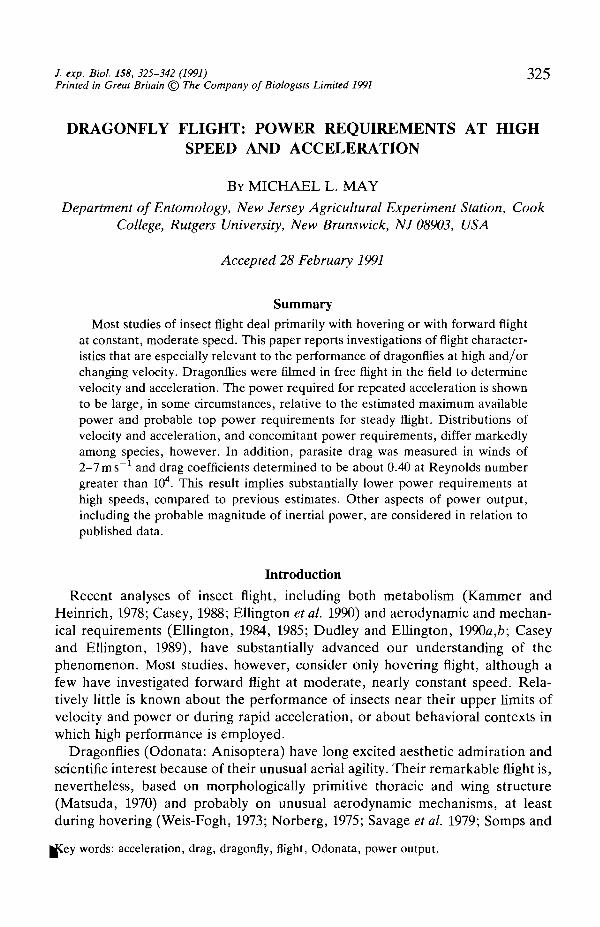
Drag was measured using an apparatus consisting of a tubular metal arm about40 cm long and 0.6 cm o.d., connected via a 15 cm length of fine cotton thread,
kinder slight tension, to a rigidly mounted aluminum strain-gauge transducer
328 M. L. MAY
K To polygraphvia bridge circuit
D
Fig. 1. Schematic diagram of apparatus used for parasite drag measurements; not toscale. A, aperture of wind tunnel; B, body of dragonfly; C, upper shielding; D, lowershielding, moved down to expose test object; E, mounting rod; F, freely swinging arm;G, pivot; H, thread, under tension; /, strain gauge transducer; J, strain gauges; K,fixed support of transducer.
(Fig. 1). The arm pivoted freely on a thin brass rod 3 cm from its upper end. At theother end, a 7.5 cm length of brass rod (1.3 mm diameter) was glued parallel to thetube; a small (2 mmx3 mm) brass plate soldered to the end of the rod allowed thetest body to be glued on firmly. The tube and rod were shielded from wind towithin about 3 cm of the end by a sheet of brass shim stock bent to form astreamlined section. The end of the rod and the test object were similarly shieldedprior to each measurement; this lower shielding could be moved down out of theairstream to expose the object to wind. The transducer was a tapered aluminumrod with four semiconductor strain gauges (BLH Electronics) glued along asection at the base that had been machined flat. Output was recorded with a GrassPolygraph.
The apparatus was calibrated by orienting it horizontally, using a leadcounterweight to balance the arm, and suspending small weights (25-391 mg) fromthe end of the rod. Bridge output (mV) was a linear function of force (r2=0.999).Drag on the exposed end of the supporting rod was measured as described belowand subtracted from the measured drag of each test object; support drag was about40% of the drag of the smallest dragonflies and about 15% that of the largest.Drag on three smooth plastic spheres was also determined, to check the accuracyof the method.
Wind velocity took about 1 min to stabilize after the fan had been started, andthe transducer output tended to drift slowly and almost linearly, so the followingprocedure was adopted. The test object was positioned on the arm at the center of|
Dragonfly flight 329
the tunnel aperture with the upper shield in place. Wind velocity was adjusted tothe desired level (nominally 2-7 ms"1). The lower shield was moved up and bridgeoutput was recorded with the object shielded until the trace stabilized, after whichthe lower shield was removed. A transient oscillation persisted for several secondsafter initial exposure to wind, but then the record again stabilized or continued todrift slowly. The response (in mV) was determined by linear extrapolation of thetrace to the instant of first wind exposure. Each drag value represents the mean ofat least five (spheres) or seven (dragonflies) responses at each velocity.
The area of maximum transverse section (5) of the dragonflies was estimated bymeasuring maximum head width and maximum height from the mesothoracic wingbase to the ventral surface of the folded legs and assuming an elliptical crosssection. Equivalent flat plate areas (A) and drag coefficients (CD) were calculatedfrom drag measurements after Pennycuick (1969).
ResultsFlight characteristics in the field
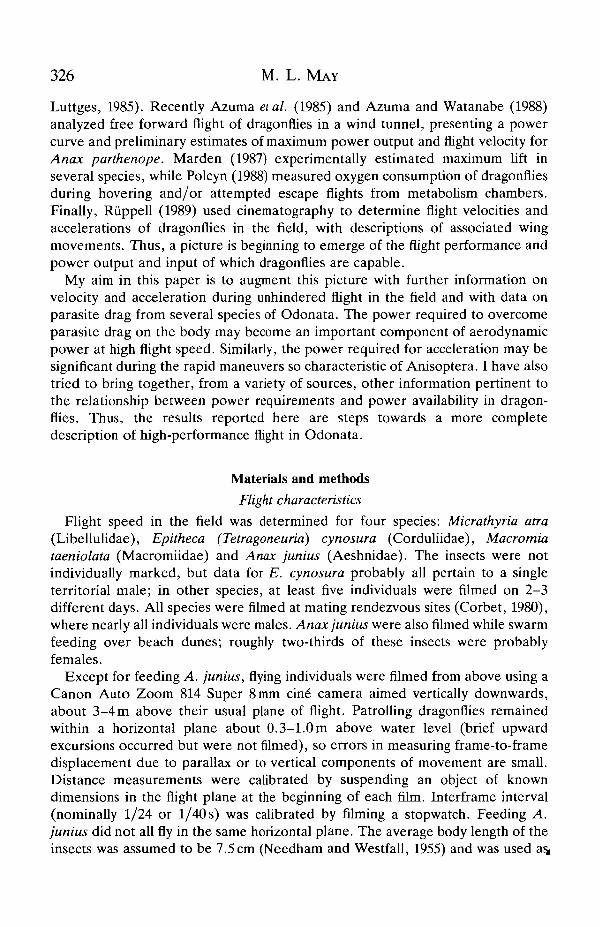
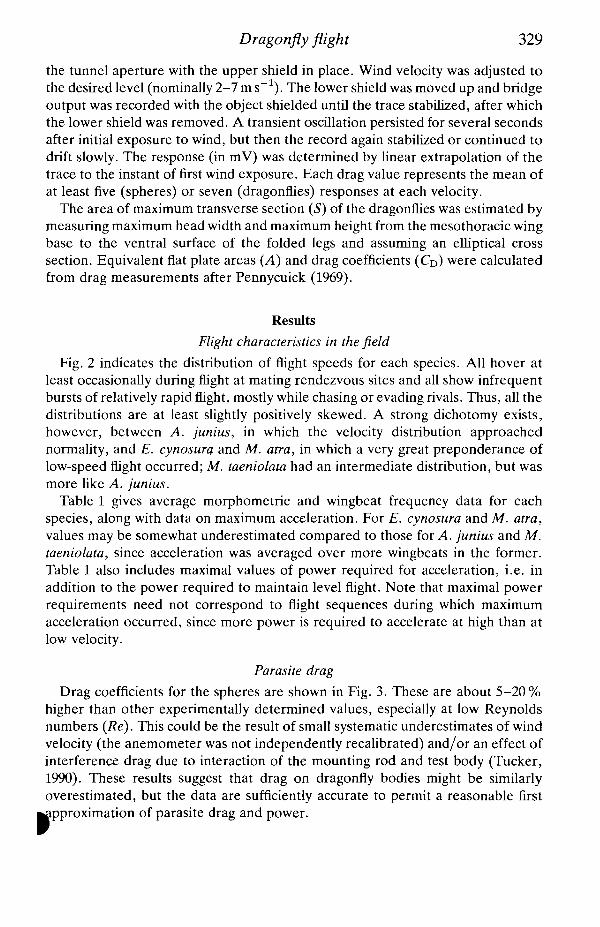
Fig. 2 indicates the distribution of flight speeds for each species. All hover atleast occasionally during flight at mating rendezvous sites and all show infrequentbursts of relatively rapid flight, mostly while chasing or evading rivals. Thus, all thedistributions are at least slightly positively skewed. A strong dichotomy exists,however, between A. junius, in which the velocity distribution approachednormality, and E. cynosura and M. atra, in which a very great preponderance oflow-speed flight occurred; M. taeniolata had an intermediate distribution, but wasmore like A. junius.
Table 1 gives average morphometric and wingbeat frequency data for eachspecies, along with data on maximum acceleration. For E. cynosura and M. atra,values may be somewhat underestimated compared to those for A. junius and M.taeniolata, since acceleration was averaged over more wingbeats in the former.Table 1 also includes maximal values of power required for acceleration, i.e. inaddition to the power required to maintain level flight. Note that maximal powerrequirements need not correspond to flight sequences during which maximumacceleration occurred, since more power is required to accelerate at high than atlow velocity.
Parasite drag
Drag coefficients for the spheres are shown in Fig. 3. These are about 5-20%higher than other experimentally determined values, especially at low Reynoldsnumbers (Re). This could be the result of small systematic underestimates of windvelocity (the anemometer was not independently recalibrated) and/or an effect ofinterference drag due to interaction of the mounting rod and test body (Tucker,1990). These results suggest that drag on dragonfly bodies might be similarlyoverestimated, but the data are sufficiently accurate to permit a reasonable first
approximation of parasite drag and power.
330 M. L. MAY
0.5 1.0 1.5 2.0 2.5 3.0
Flight velocity (ms"1)
70
60
3? 50
£p 40-
I 30-
10-
0
Micrathvria atra
• •-..-.0 0.5 1.0 1.5 2.0 2.5 3.0
Flight velocity (ms"1)
Flight velocity (ms"1)
50
^ 40
X. 30c
§• 20
£ io
0
Anas juniusrendezvous
Lk.1 2 3 4
Flight velocity (ms"1)
1 2 3 4 5
Flight velocity (ms"1)
Fig. 2. Flight velocity distributions for four species of dragonflies filmed in the field.Note that axes for Epitheca cynosura and Micrathyria atra are different from those forAnax junius and Macromia taeniolata. The means (±S.D.) , medians and skewness ofthe distributions and number of frames sampled for each species are as follows: E.cynosura, 0.43±0.43ms~\ 0.29ms"1, 2.31, 566; M. atra, 0.38±0.66ms~1, 0msUlfU, V.JO-LU.UU 111 » , UUIb
1.79, 634; M. taeniolata, 1.89±0.78ms~\ 1.82ms"1, 0.14, 242; A. junius at rendez-vous site, 1.60±0.93ms0.24, 560.
- l 1.60ms"1, 0.44, 241; A. junius feeding, 1.73±0.45, 1.73,
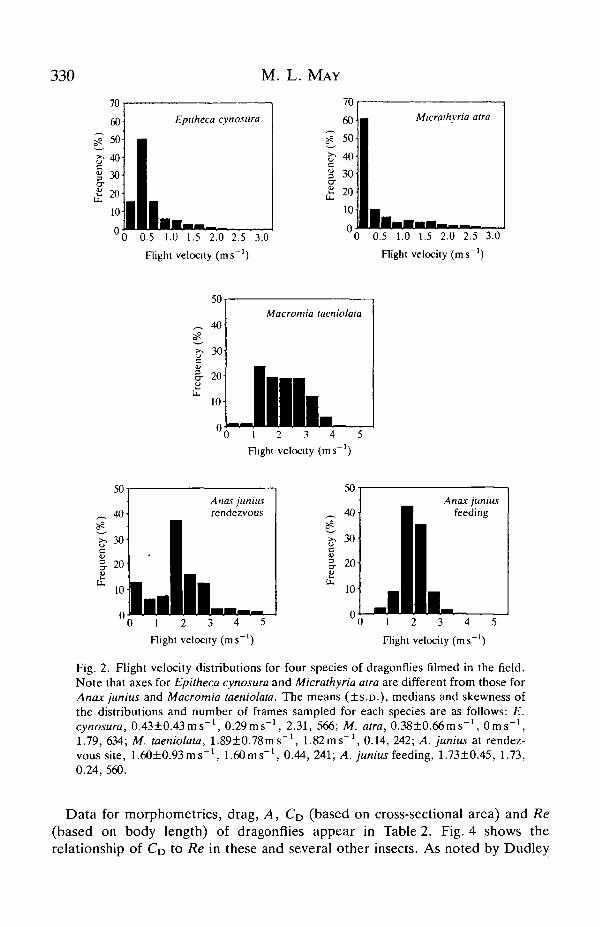
Data for morphometrics, drag, A, CD (based on cross-sectional area) and Re(based on body length) of dragonflies appear in Table 2. Fig. 4 shows therelationship of CD to Re in these and several other insects. As noted by Dudley
Tab
le 1
. M
orph
olog
ical
and
flig
ht c
hara
cter
istic
s of
spe
cies
film
ed i
n th
e fie
ld
Acc
eler
atio
n M
axim
um
Win
gbea
t (m
sP
2)
pow
erb
(W x
ld)
M
ass
(+s.
D.)
M
uscl
e m
ass
avai
labl
e po
weP
fr
eque
ncy
Spe
cies
(k
g x
1@)
(kg
x lo
4)
(W x
id)
(H
z)
Max
imum
C
90X
d
Max
imum
C
90%
* M
eanC
Epi
thec
a cy
nosr
rra
1.7
5f 0
.22
0.77
N
=69
M
icra
thyr
ia a
traf
2.
14k0
.23
1.09
N
=14
A
nar
jrr
ni~
+~
8.
04k0
.70
3.37
N
=ll
A
nax
juni
usf.'
10
.38k
2.29
3
.9
N=
43
Mac
rom
ia t
aeni
olat
d 11
.&0+
0.67
5.
65
N=
35
Dat
a on
mas
s w
ere
obta
ined
for
spe
cim
ens
from
the
sam
e po
pula
tion
as
thos
e fi
lmed
, but
not
the
sam
e in
divi
dual
s.
3
0s'
W
ingb
eat
freq
uenc
ies
are
expe
cted
mea
n va
lues
for
the
sam
e (o
r in
the
cas
e of
M.
atra
, sim
ilar
) sp
ecie
s fr
om M
ay (
1981
b),
assu
min
g th
orac
ic
tem
pera
ture
s of
abo
ut 3
7°C
. "A
ssum
ing
a m
axim
um s
peci
fic
pow
er o
f 10
0 W
kg-
' (E
llin
gton
, 19
85).
C
alcu
late
d as
est
imat
ed m
ass
(fro
m c
olum
n l)
~ac
cele
rati
on
xv
elo
city
, usin
g sm
ooth
ed v
alue
s of
vel
ocity
and
acc
eler
atio
n as
des
crib
ed in
the
te
xt.
"Mea
n (r
ange
) of
fiv
e hi
ghes
t m
easu
rem
ents
. 90
th p
erce
ntil
e va
lue.
'A
vera
ge
of a
ll va
lues
, as
sum
ing
no p
ower
cos
t fo
r de
cele
rati
on.
'Fil
med
at
24 f
ram
es s
-'.
Til
med
at
40 fr
ames
s-'
. A
t m
atin
g re
ndez
vous
sit
e.
' Fee
ding
.
332 M. L. MAY
Fig. 3. Drag coefficient (CD) of plastic spheres as a function of Reynolds number (Re).Spheres were 7.8, 9.5 or 12.5 mm in diameter and each was run at nominal windvelocities of 2.0, 3.0, 4.0, 5.0 and 7.0ms"1 (±2% maximum deviation from mean).The solid line is based on a large body of published data, from Goldstein (1965; hisFig. 2).
0.2
0 1-
0.0-
-0 .1 -
g> - 0 . 2 H
-0.3
-0.4-
-0 .5 -
-0 .6 '
5X10³Re
lxlO4
M
3.6
4xlO4
:1.5
-1.0
-0.75
A
a
+ D
° o
h0.5
3.8 4.0 4.2logfle
4.40.25
4 6
Fig. 4. Drag coefficient (CD) as a function of Reynolds number (Re) of dragonflybodies. Each specimen is represented by a different symbol (see Table 2). Windvelocities were as in Fig. 3. Letters indicate drag coefficients of other insects: 5,Schistocerca gregaria (desert locust; Weis-Fogh, 1956); B, Bombus terrestris (bumble-bee; Dudley and Ellington, 1990ft); M, Melolontha vulgaris (cockchafer beetle;Nachtigall, 1964); A, Acilus sulcatus; and D, Dytiscus marginalis (dytiscid beetles;Nachtigall, 1977).
Dragonfly flight 333
Table 2. Morphology and drag characteristics of dried dragonfly bodies determined asdescribed in the text
SpeciesMass"
(kgxlO3)AQ Drag
RexlO'3 (NxlO4)
Pachydiplaxlongipennis (D)
Pachydiplaxlongipennis (•)
TrameaCarolina (+)
Boyeriavinosa (*)
Libellulaluctuosa (A)
Macromiataeniolata (A)
0.135
0.221
0.364
2.46
3.52
4.96
0.391 6.28
0.398 4.64
Anax junius (O) 0.870 8.96
Anax junius {%) 1.004 9.45
1.197 11.4
2.071.231.521.41
2.842.301.871.95
3.072.672.382.10
2.823.602.713.13
3.302.912.112.43
4.064.043.493.31
4.564.954.114.00
6.126.335.435.42
4.496.8411.315.6
5.327.7913.018.4
6.7910.317.323.9
8.3212.721.629.9
6.079.1615.020.9
9.4314.324.132.9
9.8614.424.133.2
11.016.727.335.6
0.480.662.223.95
0.691.242.695.58
0.721.453.656.15
0.641.904.149.17
0.791.603.126.93
0.952.195.349.44
1.142.656.1711.4
1.503.558.1715.5
0.840.500.620.57
0.810.650.530.55
0.620.530.480.42
0.450.570.430.50
0.710.630.450.52
0.450.450.390.37
0.480.520.430.42
0.530.550.470.47
Wind velocities were nominally 2.0, 3.0, 5.0 and 7.0ms l (±2% maximum deviation from mean).The symbol beside a name is the key to symbols in Figs 4 and 5.a Fresh mass of whole insect.b Area of maximum transverse section, calculated as described in the text.c Equivalent flat plate area (Pennycuick, 1969).d Parasite drag coefficient based on cross-sectional (frontal) area.
Reynolds number.
334 M. L. MAY
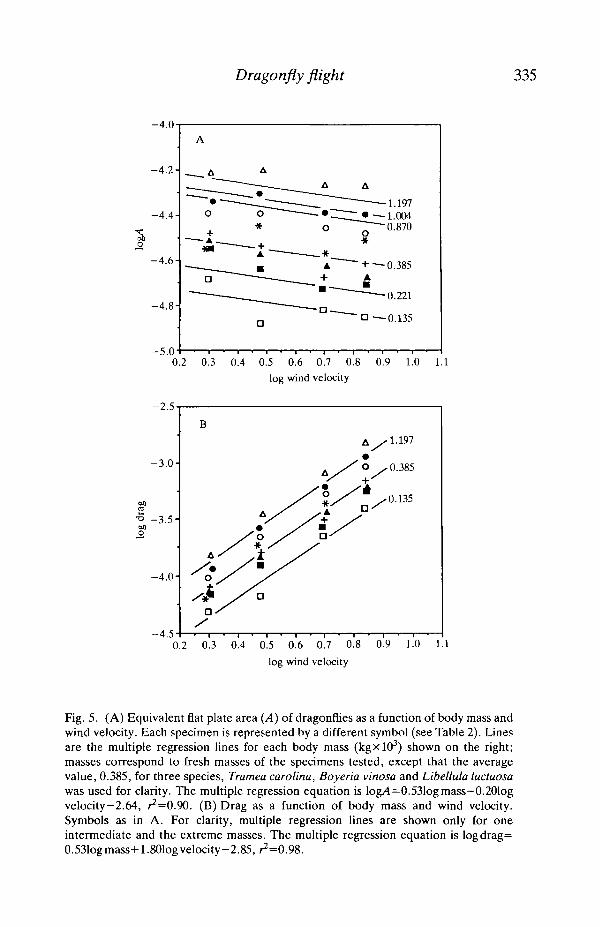
and Ellington (19906), CD consistently declines as Re increases. To facilitateextrapolation to other dragonflies, drag and A are plotted in Fig. 5 as a function ofbody mass and wind velocity.
Discussion
Velocity and acceleration in the field
Anax junius and M. taeniolata patrol widely at rendezvous sites, interactingaggressively with conspecific males wherever they are encountered. The other twospecies, however, are strongly localized and apparently territorial. Epithecacynosura, like A. junius and M. taeniolata, is a 'flier' as defined by Corbet (1963),but individuals hover or fly slowly for extended periods in a small area, chasingother dragonflies when they approach closely. Micrathyria atra is a 'percher'(except at low air temperature) and flies for only about 40 % of its time on territory(May, 1977); clearly, from Fig. 2, most of this flight time is spent hovering.
In both territorial species, the films only recorded the beginning of chases and,once, a close approach of two individuals of M. atra. The single E. cynosura was inan area of relatively low population density, so chases may have been less frequentthan usual. Even in the patrolling species, intense chases were recorded rarely andphysical clashes not at all. Thus, it is very likely that the films did not recordmaximum velocity or acceleration. The two larger species rarely exceeded 4 ms"1,while maximum velocity for the smaller species was less than 3ms"1 . Riippell(1989) reported maximum speeds of 7.5 ms" 1 in A. junius and 10 ms" 1 in Aeshnacyanea, although average flight velocities were much lower. Most large species areprobably capable of speeds close to or exceeding 10 m s"1, but they apparently flyat high velocity only rarely.
Azuma and Watanabe (1988) estimated aerodynamic plus inertial powerrequirements over a range of speeds for Anax parthenope, a species very similar insize and morphology to A. junius. Their analysis contrasts with the conclusions ofsome others about aerodynamic mechanisms in dragonflies (Norberg, 1975; Sompsand Luttges, 1985) and about the form of the power curve in other insects [inparticular, no strong minimum in power requirements at intermediate velocity wasfound by Dudley and Ellington (19906) and Ellington et al. (1990)]. Nevertheless,their curve provides a useful point of departure for assessing relative effects ofvelocity and acceleration.
The average velocity of A. junius, during both patrolling and feeding, and of M.taeniolata is close to the velocity predicted to minimize the rate of energyexpenditure in Anax parthenope (cf. Fig. 6; Azuma and Watanabe, 1988). In part,this is an accidental effect of periods of hovering being averaged with rapid flight,but in A. junius the modal and median speeds are also close to this value, and bothspecies should benefit from maximizing time aloft. If dragonflies exhibit a powercurve with a strong minimum, as Azuma and Watanabe (1988) suggest, then'cruising speed' in these situations may, in fact, be adjusted to minimize flightcosts, with periods of more expensive hovering and chasing being interspersed^
Dragonfly flight 335
-4.0
-4 .2 -
-4.4-
-4 .6-
-4 .8-
-5.00.2 0.3 0.4 0.5 0.6 0.7 0.8 0.9 1.0 1.1
log wind velocity
-4.50.2 0.3 0.4 0.5 0.6 0.7 0.8 0.9 1.0 1.1
log wind velocity
Fig. 5. (A) Equivalent flat plate area (A) of dragonflies as a function of body mass andwind velocity. Each specimen is represented by a different symbol (see Table 2). linesare the multiple regression lines for each body mass (kgxlO3) shown on the right;masses correspond to fresh masses of the specimens tested, except that the averagevalue, 0.385, for three species, Tramea Carolina, Boyeria vinosa and Libellula luctuosawas used for clarity. The multiple regression equation is log/4=0.531og mass—0.201ogvelocity—2.64, ^=0.90. (B) Drag as a function of body mass and wind velocity.Symbols as in A. For clarity, multiple regression lines are shown only for oneintermediate and the extreme masses. The multiple regression equation is logdrag=0.531ogmass+1.801ogvelocity-2.85, ^=0.98.
336 M. L. MAY
0.06
0.05
3 0.04
S 0.03
I0.O2
0.01
Muscle=25% body mass
Specific power=260 W kg"'
Azuma and /Watanabe /
Muscle=45% body mass c u r v e / /
\specific power= 100 W k g " " / / , . . ,\ b / /Modified\ yf/ curve
. A . . . 3 . . .7 V
* 1
-^p.r for CD= 1.25
^ ^ a r for CD=0.4
2 3 4 5 6 7
Flight velocity (ms"1)
10
Fig. 6. Analysis and proposed modifications to the power curve of Azuma andWatanabe (1988) for Anax parthenope (heavy solid line). The lower curves showparasite power requirements (Ppar), calculated according to Pennycuick (1969) forCD=1.25, as assumed by Azuma and Watanabe, and for Co values for A. junius fromthe present study (Table 2). The dashed curve is a power curve recalculated by simplysubtracting the difference between the two parasite power curves from Azuma andWatanabe's original curve. The horizontal dotted lines represent estimates ofmaximum available power from the flight muscles, based on assumptions that flightmuscle is 25 % of body mass and specific power is 260 W kg"1 muscle vs 45 % of bodymass and 100 Wkg"1. Circles indicate values of inertial power required, assuming noelastic storage, for the four flights filmed by Azuma and Watanabe; the calculationsfollowed Ellington (1984) and were based on wing moments of inertia from May(1981a). The open triangles on the left axis represent estimates of inertial power forwing mass (a) plus wing virtual mass (b) in an Anax hovering with stroke angle andfrequency equal to those observed in Aeshna juncea by Norberg (1975). The closedtriangles on the right represent inertial power required to move the wing mass (1) pluswing virtual mass, (2) plus parasite power requirements (3) for an Anax flying at7.5ms"1 with stroke characteristics observed for A. junius flying at that speed(Ruppell, 1989).
In the two small, territorial species, modal velocities are near zero, presumablyindicating that selection for strong localization and territorial defense is moreimportant than potential energy savings. Of course, if the power curve at lowspeed is nearly flat, as found by Dudley and Ellington (1990b) for bees, littleadditional cost is associated with hovering, but if the curve is qualitatively similarto that proposed by Azuma and Watanabe (1988), the energy costs of territorialvigilance, aside from actual fighting, are substantial, possibly double the theoreti-cal minimum.
In general, the magnitude of the higher accelerations observed here werecomparable to, and often slightly greater than, those recorded by Ruppell (1989)for acceleration averaged over several wingbeats. All species are capable of
Dragonfly flight 337
abrupt deceleration. It is not known whether this was always energetically passive,resulting, for example, from twisting the wings to maximize air resistance, or insome cases required active production of negative thrust.
In the films of feeding A. junius, measurement errors obviously occurred as aresult individual size variation, especially since both males and females werefilmed and because the insects were moving (causing slight blurring) and may notalways have been oriented exactly normal to the camera. The last problem waslargely obviated by the fact that they flew horizontally most of the time, althoughdifferent individuals flew at quite different altitudes. During actual pursuit of prey,however, abrupt maneuvers away from a horizontal plane occurred. Dragonfliesoften climbed suddenly, briefly maintained position, then dived back to theoriginal plane of flight. Thus, some apparent decelerations actually representchanges of direction, some accelerations may have been assisted by gravity, andpower expended to attain upward velocity is not accounted for. I think that thevelocities recorded are generally representative of the true velocity of the insects,but clearly their translation into acceleration and power demand is less accuratethan for the other situations filmed.
A. junius did not hover during feeding, and the velocity distribution is nearlynormal, with a standard deviation much lower than that of A. junius at arendezvous site. The mean is again close to the predicted velocity for minimumenergy expenditure (Fig. 6), and, since prey were probably not being seriouslydepleted and were apparently not highly clumped (both conclusions based onobservation of the dragonflies' behavior), maximizing time aloft for a given energycost might be more advantageous than, for example, minimizing cost of transport.I emphasize that this is not, in itself, a strong argument for a power curve with adistinct minimum, however, since other physical or ecological factors might alsoselect for a well-defined modal velocity.
Parasite power
Dragonflies are fairly well streamlined compared to other insects (Fig. 4),especially since wetted surface area is probably high and Re based on length isinflated compared to that of some other groups (Vogel, 1983), owing to the long,narrow bodies of Odonata. Although clearly far from those of an ideallystreamlined body (Dudley and Ellington, 19906), values of CD are less than halfthat of a locust at comparable Re (Weis-Fogh, 1956); the lowest values, at Revalues greater than 104, are lower than those previously measured for any insectexcept dytiscid beetles (Nachtigall, 1977). Streamlining may, in part, be theaccidental consequence of a body form that evolved for reasons unrelated to drag(e.g. large rounded eyes for visual acuity, elongate abdomen for passive flightstability), but it probably also reflects selection by requirements for rapid flight.
The power required to overcome parasite drag (Pennycuick, 1969) can probablybe regarded as nearly negligible for large insects operating at or below theirnormal cruising speed (e.g. Dudley and Ellington, 1990/?). At high speeds,
J^wever, parasite power may become a substantial fraction of total power. The Co
338 M. L. MAY
estimated by Azuma and Watanabe (1988) was 1.25, 2-3 times my values, basedon the assumption that drag on the body of a dragonfly is about twice that on asmooth cylinder of similar dimensions (A. Azuma, personal communication,1990). Fig. 6 shows the effect on their power curve of substituting the lower valuesof CD. The power reduction at their estimated top speed is about 20 %, resulting inan increase in maximal speed of about 1.5 ms"1. Drag and parasite power will, ofcourse, be higher if the body is not parallel to the relative wind, but during high-speed level flight, the body angle of dragonflies is usually very close to horizontal(Azuma and Watanabe, 1988; M. L. May, personal observation).
Available power and its allocation
Substantial uncertainties affect estimates of maximum power and velocity, asAzuma and Watanabe (1988) noted. For example, they assumed that muscle massis about 25 % of body mass, but 40-45 % is a much more realistic figure (Marden,1987; M. L. May, unpublished data). This could increase available powerestimates to about 0.095 W and estimated maximum speed to well above 10 m s"1.In contrast, Ellington (1985) argued that, for locust muscle, and, by inference, forother insects with synchronous flight muscle, maximum specific power outputshould be about 80Wkg"\ rather than 260 W kg"1 as assumed by Azuma andWatanabe (1988), following Weis-Fogh and Alexander (1977). Ellington's figureseems to be borne out by recent direct measurements (Stevenson and Josephson,1990). Allowing for the fact that only about 7% of dragonfly muscle volume issarcoplasmic reticulum (Smith, 1966), rather than 20 % as in locust, but assumingthat shortening speed and strain rate are similar to those of locust muscle, specificpower may be roughly 100 Wkg"1. If so, the power available to A. parthenopewould be less than 0.04 W.
A further complication is that inertial power may be spared to an unknowndegree by elastic recovery of kinetic energy of the wings (Weis-Fogh, 1972;Ellington, 1985). Maximum power savings for the flights measured by Azuma andWatanabe (1988) could be about 30 % (Fig. 6; these estimates do not include theeffects of wing virtual mass, since they were not considered in calculating theoriginal power curve). Inertial costs are lower compared to aerodynamic costs indragonflies than in bumblebees (Dudley and Ellington, 19906), probably becausewingbeat amplitude is unusually low in dragonflies (Azuma and Watanabe, 1988;Norberg, 1975), and because moments of inertia per wing.(and thus, roughly, perunit of aerodynamic surface) tend to be low relative to wing length (estimatedfrom May, 1981a, and compared to data for Diptera, Hymenoptera and Lepidop-tera from Ellington, 1984).
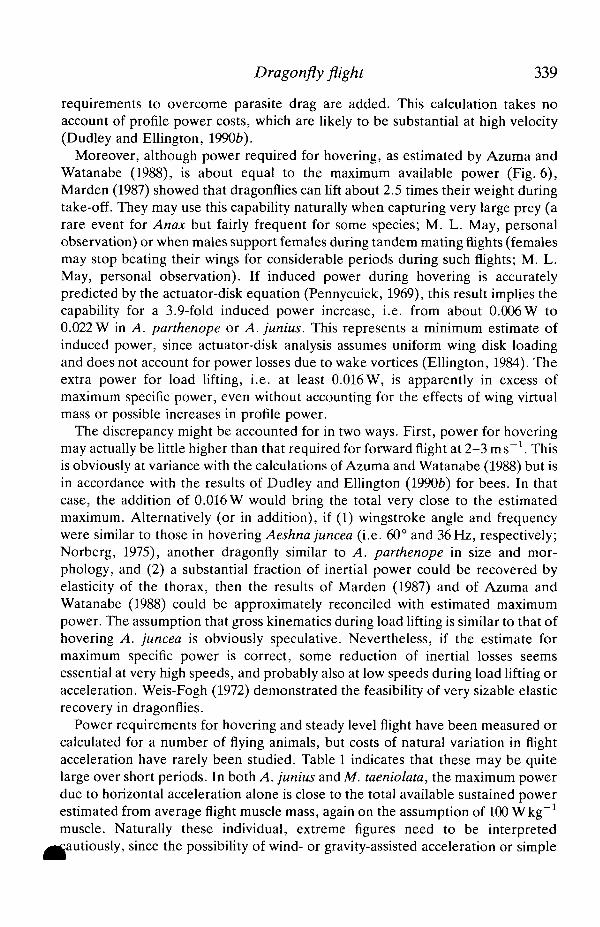
Inertial power requirements might continue to increase at high velocity and/oracceleration, since Riippell (1989) found marked increases in both wingbeatfrequency and stroke amplitude under such conditions. Based on his data forA. junius flying at 7.5 ms"1 , I calculated approximate inertial power require-ments, assuming no elastic energy storage; these results also appear in Fig. 6. Thetotal markedly exceeds the predicted maximum available power, particularly w
Dragonfly flight 339
requirements to overcome parasite drag are added. This calculation takes noaccount of profile power costs, which are likely to be substantial at high velocity(Dudley and Ellington, 19906).
Moreover, although power required for hovering, as estimated by Azuma andWatanabe (1988), is about equal to the maximum available power (Fig. 6),Marden (1987) showed that dragonflies can lift about 2.5 times their weight duringtake-off. They may use this capability naturally when capturing very large prey (arare event for Anax but fairly frequent for some species; M. L. May, personalobservation) or when males support females during tandem mating flights (femalesmay stop beating their wings for considerable periods during such flights; M. L.May, personal observation). If induced power during hovering is accuratelypredicted by the actuator-disk equation (Pennycuick, 1969), this result implies thecapability for a 3.9-fold induced power increase, i.e. from about 0.006W to0.022 W in A. parthenope or A. junius. This represents a minimum estimate ofinduced power, since actuator-disk analysis assumes uniform wing disk loadingand does not account for power losses due to wake vortices (Ellington, 1984). Theextra power for load lifting, i.e. at least 0.016W, is apparently in excess ofmaximum specific power, even without accounting for the effects of wing virtualmass or possible increases in profile power.
The discrepancy might be accounted for in two ways. First, power for hoveringmay actually be little higher than that required for forward flight at 2-3 ms"1. Thisis obviously at variance with the calculations of Azuma and Watanabe (1988) but isin accordance with the results of Dudley and Ellington (19906) for bees. In thatcase, the addition of 0.016 W would bring the total very close to the estimatedmaximum. Alternatively (or in addition), if (1) wingstroke angle and frequencywere similar to those in hovering Aeshna juncea (i.e. 60° and 36Hz, respectively;Norberg, 1975), another dragonfly similar to A. parthenope in size and mor-phology, and (2) a substantial fraction of inertial power could be recovered byelasticity of the thorax, then the results of Marden (1987) and of Azuma andWatanabe (1988) could be approximately reconciled with estimated maximumpower. The assumption that gross kinematics during load lifting is similar to that ofhovering A. juncea is obviously speculative. Nevertheless, if the estimate formaximum specific power is correct, some reduction of inertial losses seemsessential at very high speeds, and probably also at low speeds during load lifting oracceleration. Weis-Fogh (1972) demonstrated the feasibility of very sizable elasticrecovery in dragonflies.
Power requirements for hovering and steady level flight have been measured orcalculated for a number of flying animals, but costs of natural variation in flightacceleration have rarely been studied. Table 1 indicates that these may be quitelarge over short periods. In both A. junius and M. taeniolata, the maximum powerdue to horizontal acceleration alone is close to the total available sustained powerestimated from average flight muscle mass, again on the assumption of 100 W kg"1
muscle. Naturally these individual, extreme figures need to be interpretedy, since the possibility of wind- or gravity-assisted acceleration or simple
340 M. L. MAY
measurement error cannot be ruled out. Nevertheless, in 10% of measurements,calculated power expenditures for acceleration were at least 27 % of availablepower and, for Anax, about equal to Azuma and Watanabe's (1988) estimate ofthe minimum cost of steady flight. Thus, large fast-flying species may operate neartheir maximum power capacity for a significant fraction of the time, even whenflying at moderate speed.
The average power expended on acceleration, assuming that deceleration wasentirely passive, was 9.8-11.5 % of estimated available power for A. junius andM. taeniolata. The significance of this power requirement to the energy budget oflarge patrollers is uncertain, but these average expenditures would be 25-30% ofthe minimum power requirements of Anax estimated by Azuma and Watanabe(1988) during level flight.
Power associated with acceleration was substantially lower in proportion toestimated available power for E. cynosura and M. atra (2.0 and 3.7%, respect-ively), not because these species accelerated less rapidly but because their averagevelocity during acceleration was much lower. As noted above, the films probablymissed the periods when extra power demands were greatest, but it seemsreasonable that these were less frequently very high and had less overall effect onenergy budget than in the large patrollers.
In summary, flight at speeds sometimes recorded in the field probably pushespower output close to its upper limit, despite relatively well-streamlined bodiesthat reduce parasite drag below previous estimates; hovering or rising with a loadmay also require near-maximal power. Horizontal acceleration at moderatespeeds can greatly increase power demand for brief periods and, in some species,might contribute appreciably to total energy expenditures. Rapid climbs andmaneuvers, not studied here, must add still more to power requirements. Itappears likely that dragonflies routinely, albeit for short intervals, operate neartheir maximum sustainable power output during flight.
A portion of this work was supported by NASA grant NSD 2099 to J. E. Heath.I thank Dr Heath and the University of Illinois for the use of equipment andfacilities. Dr D. F. Caccamise provided invaluable assistance in computing andanalyzing smoothed flight parameters. Dr A. Azuma was most helpful in clarifyingsome details of his analyses of dragonfly flight, and Dr T. M. Casey critically readan earlier version of the manuscript. New Jersey Agricultural Experiment StationPublication D-08155-16-90, supported by State and US Hatch Act funds.
ReferencesAZUMA, A., AZUMA, S., WATANABE, I. AND FURUTA, T. (1985). Flight mechanics of a dragonfly.
J. exp. Biol. 116, 79-107.AZUMA, A. AND WATANABE, T. (1988). Flight performance of a dragonfly. J. exp. Biol. 137,
221-252.CASEY, T. M. (1988). Oxygen consumption during flight. In Insect Flight (ed. G. Goldsworthy
and C. Wheeler), pp. 257-272. Boca Raton: CRC Press.CASEY, T. M. AND ELLINGTON, C. P. (1989). Energetics of insect flight. In Energy Exchange it±
Dragonfly flight 341
Cells and Organisms (ed. W. Weiser and E. Gnaiger), pp. 200-210. Stuttgart: Georg ThiemeVerlag.
CORBET, P. S. (1963). A Biology of Dragonflies. Chicago: Quadrangle.CORBET, P. S. (1980). Biology of Odonata. A. Rev. Ent. 25, 189-217.DUDLEY, R. AND ELLINGTON, C. P. (1990a). Mechanics of forward flight in bumblebees.
I. Kinematics and morphology. J. exp. Biol. 148, 19-52.DUDLEY, R. AND ELLINGTON, C. P. (1990b). Mechanics of forward flight in bumblebees.
II. Quasi-steady lift and power requirements. J. exp. Biol. 148, 53-88.ELLINGTON, C. P. (1984). The aerodynamics of hovering insect flight. I.-VI. Phil. Trans. R. Soc.
Ser. B 305, 1-181.ELLINGTON, C. P. (1985). Power and efficiency of insect flight muscle. /. exp. Biol. 115,293-304.ELLINGTON, C. P., MACHIN, K. E. AND CASEY, T. M. (1990). Oxygen consumption of
bumblebees in forward flight: the U-shaped curve is flat. Nature 347, 472-473.GOLDSTEIN, S. (ed.) (1965). Modern Developments in Fluid Mechanics. New York: Dover.
(Reprint of 1938 edition.)HARPER, D. G. AND BLAKE, R. W. (1989). A critical analysis of the use of high-speed film to
determine maximum accelerations offish. /. exp. Biol. 142, 465-471.KAMMER, A. E. AND HEINRICH, B. (1978). Insect flight metabolism. Adv. Insect Physiol. 13,
133-228.LANCZOS, C. (1957). Applied Analysis. Englewood Cliffs, NJ: Prentice Hall.MARDEN, J. H. (1987). Maximum lift production during takeoff in flying animals. J. exp. Biol.
130, 235-258.MATSUDA, R. (1970). Morphology and evolution of the insect thorax. Mem. ent. Soc. Can. 76,
1-431.MAY, M. L. (1977). Thermoregulation and reproductive activity in tropical dragonflies of the
genus Micrathyria. Ecology 58, 787-798.MAY, M. L. (1981a). Allometric analysis of body and wing dimensions of male Anisoptera.
Odonatologica 10, 279-291.MAY, M. L. (19816). Wingstroke frequency of dragonflies (Odonata: Anisoptera) in relation to
temperature and body size. /. comp. Physiol. 144, 219-240.NACHTIGALL, W. (1964). Zur Aerodynamik des Coleopterenfluges: wirken die Elytren als
Tragflugel? Verh. dt. zool. Ges. 58, 319-326.NACHTIGALL, W. (1977). Swimming mechanics and energetics of variously sized water beetles -
Dytiscidae, body length 2 to 35 mm. In Scale Effects in Animal Locomotion (ed. T. J. Pedley),pp. 269-283. London: Academic.
NEEDHAM, J. G. AND WESTFALL, M. J. (1955). A Manual of the Dragonflies of North America.Berkeley: University of California Press.
NORBERG, R. A. (1975). Hovering flight of the dragonfly Aeschna juncea L., kinematics andaerodynamics. In Swimming and Flying in Nature, vol. 2 (ed. T. Y.-T. Wu, C. J. Brokaw andC. Brennan), pp. 763-781. New York: Plenum Press.
PENNYCUICK, C. J. (1969). The mechanics of bird migration. Ibis 111, 525-556.POLCYN, D. M. (1988). The thermal biology of desert dragonflies. PhD dissertation, University
of California, Riverside.RAYNER, J. M. AND ALDRIDGE, H. D. J. N. (1985). Three-dimensional reconstruction of animal
flight paths and the turning flight of microchiropteran bats. /. exp. Biol. 118, 247-265.RUPPELL, G. (1989). Kinematic analysis of symmetrical flight manoeuvres of Odonata. J. exp.
Biol. 144, 13-42.SAVAGE, S. B., NEWMAN, B. G. AND WONG, D. T.-M. (1979). The role of vortices and unsteady
effects during the hovering flight of dragonflies. J. exp. Biol. 83, 59-77.SMITH, D. S. (1966). The organization of flight muscle fibers in the Odonata. /. Cell Biol. 28,
109-126.SOMPS, C. AND LUTTGES, M. (1985). Dragonfly flight: novel uses of unsteady separated flows.
Science 228, 1326-1329.STEVENSON, R. D. AND JOSEPHSON, R. K. (1990). Effects of operating frequency and
temperature on mechanical power output from moth flight muscle. /. exp. Biol. 149, 61-78.TUCKER, V. A. (1990). Body drag, feather drag and interference drag of the mounting strut in a
peregrine falcon, Falco peregrinus. J. exp. Biol. 149, 449-468.
342 M. L. MAY
VOGEL, S. (1983). Life in Moving Fluids. Princeton: Princeton University Press.WEIS-FOGH, T. (1956). Biology and physics of locust flight. II. Flight performance of the desert
locust {Schistocerca gregaria). Phil. Trans. R. Soc. Ser. B 239, 459-510.WEIS-FOGH, T. (1972). Energetics of hovering flight in hummingbirds and in Drosophila. J. exp.
Biol. 56, 79-104.WEIS-FOGH, T. (1973). Quick estimates of flight fitness in hovering animals, including novel
mechanisms for lift production. /. exp. Biol. 59, 169-230.WEIS-FOGH, T. AND ALEXANDER, R. M. (1977). The sustained power output from striated
muscle. In Scale Effects in Animal Locomotion (ed. T. J. Pedley), pp. 511-525. London:Academic Press.
WILKIN, P. J. (1990). The instantaneous force on a desert locust, Schistocerca gregaria, flying in awind tunnel. /. Kansas, ent. Soc. 63, 316-328.


![An Experimental Investigation on a Bio-inspired Corrugated ......dragonfly wings in steady flow or gliding flight [4-11] have led to a surprising conclusion: a corrugated dragonfly](https://static.documents.pub/doc/80x56/6132c91ddfd10f4dd73aac1f/an-experimental-investigation-on-a-bio-inspired-corrugated-dragonfly-wings.jpg)


