Research Library Research Library Resource management technical reports Natural resources research 2008 Drainage benchmarking in the Northern Agricultural Region : Drainage benchmarking in the Northern Agricultural Region : landholder survey landholder survey Alison Beattie Angela Stuart-Street Follow this and additional works at: https://researchlibrary.agric.wa.gov.au/rmtr Part of the Agriculture Commons, Environmental Indicators and Impact Assessment Commons, Environmental Monitoring Commons, Fresh Water Studies Commons, Hydrology Commons, Natural Resources Management and Policy Commons, Soil Science Commons, and the Water Resource Management Commons Recommended Citation Recommended Citation Beattie, A, and Stuart-Street, A. (2008), Drainage benchmarking in the Northern Agricultural Region : landholder survey. Department of Primary Industries and Regional Development, Western Australia, Perth. Report 328. This report is brought to you for free and open access by the Natural resources research at Research Library. It has been accepted for inclusion in Resource management technical reports by an authorized administrator of Research Library. For more information, please contact [email protected].
Transcript
Research Library Research Library
Resource management technical reports Natural resources research
2008
Drainage benchmarking in the Northern Agricultural Region : Drainage benchmarking in the Northern Agricultural Region :
landholder survey landholder survey
Alison Beattie
Angela Stuart-Street
Follow this and additional works at: https://researchlibrary.agric.wa.gov.au/rmtr
Part of the Agriculture Commons, Environmental Indicators and Impact Assessment Commons,
Environmental Monitoring Commons, Fresh Water Studies Commons, Hydrology Commons, Natural
Resources Management and Policy Commons, Soil Science Commons, and the Water Resource
Management Commons
Recommended Citation Recommended Citation Beattie, A, and Stuart-Street, A. (2008), Drainage benchmarking in the Northern Agricultural Region :
landholder survey. Department of Primary Industries and Regional Development, Western Australia, Perth. Report 328.
This report is brought to you for free and open access by the Natural resources research at Research Library. It has been accepted for inclusion in Resource management technical reports by an authorized administrator of Research Library. For more information, please contact [email protected].
Drainage Benchmarking in the NorthernAgricultural Region
Landholder Survey
RESOURCE MANAGEMENT TECHNICAL REPORT 328
ISSN 1039-7025
Resource Management Technical Report 328
Drainage Benchmarking in the Northern Agricultural Region
Landholder Survey
Alison Beattie and Angela Stuart-Street
October 2008
DRAINAGE BENCHMARKING IN THE NORTHERN AGRICULTURAL REGION – LANDHOLDER SURVEY
2
Acknowledgements
The authors would like to acknowledge all the landholders involved in the study and thank them for finding the time to share the information and experiences about their drains. Additionally, we would like to thank: Peter Whale for his valued participation throughout the project; Buddy Wheaton and Andrew Watson of the Office of the Commissioner for Soil Conservation for their feedback during the project; Russell Speed, Mike Clarke, Don Bennett and Paul Findlater for their peer review comments; and Jennifer Bairstow who worked on the project at its beginning. This project was funded by the State and Federal Governments and administered by the Northern Agricultural Catchments Council (NACC).
Cover Photo: Examining a drain with the landholder near Piawanning.
DISCLAIMER While all reasonable care has been taken in the preparation of the material in this document, the Western Australian Government and its officers accept no responsibility for any errors or omissions it may contain, whether caused by negligence or otherwise, or for any loss, however caused, sustained by any person who relies on it.
DRAINAGE BENCHMARKING IN THE NORTHERN AGRICULTURAL REGION – LANDHOLDER SURVEY
Summary
To better understand impacts of drains over time, 20 landholders across the Northern Agricultural Region were interviewed to determine their perceptions on the effectiveness of drains dug on their properties.
Many landholders interviewed were motivated to drain by the very wet year of 1999 experienced across the region. Many witnessed rapidly expanding areas of salt affected land and waterlogging as a result of this event. The land that the drains went into was often described as previously highly productive and the growing salinity and waterlogging were impacting on arable land and creating areas of degradation.
The interviews revealed that primary sources of advice about drainage were other landholders with drains and/or drainage contractors. Adequate preliminary site assessments were not undertaken in most cases and many landholders did not know the level of the watertable at the site of the drain prior to its installation. The outcome of these factors may have been uneconomic investment in drains by some landholders due to poor or inadequate information to base their decisions on.
One quarter of the landholders interviewed had received funding for their drains and the remainder were funded solely by the landholder. Many of the drains crossed roads and required culverts to be installed. This led to a variety of arrangements among Shires as well as within some Shires.
Many landholders report improved productivity of the land around their drains, varying from patchy crops to good harvests. Many found that soil workability has also improved since drain installation, although some stated that these improvements may be due to the recent dry seasons. Most of the landholders reported that they liked their drain because it reduced waterlogging, removed water, improved farm viability, stopped the spread of salinity and/or improved production. The majority also thought that their drains were both effective and value for money, although economic models suggest that drains are unlikely to be economically viable. A minority of landholders interviewed saw no change after the drain was installed, with continued salinity expansion and decline in the vegetation.
These findings are largely consistent with research done in other regions of the wheatbelt which use drainage as a tool to manage salinity. Because landholders report variable levels of satisfaction with drainage, it is important that detailed and independent site investigation is undertaken in salinity management to diagnose the problem and design the appropriate remedy for each situation. This must include information about watertables and trends on the site. This information is essential to ensure the best investment is made by landholders to correctly target the solution.
3
DRAINAGE BENCHMARKING IN THE NORTHERN AGRICULTURAL REGION – LANDHOLDER SURVEY
Table of Contents Summary ................................................................................................................... 2
DRAINAGE BENCHMARKING IN THE NORTHERN AGRICULTURAL REGION – LANDHOLDER SURVEY
1. Introduction
The problems of secondary dryland salinity and its implications are widely understood in Western Australia. Numerous reports have dealt with a variety of aspects associated with this problem over at least the past three decades. The installation of drains to intercept groundwater as an engineering solution to manage salinity has also been studied in detail. The subject is still contentious, however, as there has been much debate on the effectiveness of drains and their widespread promotion.
This study aims to better understand impacts of drains in the Northern Agricultural Region and how some landholders arrived at their initial decision to dig drains as well as their observations and perceptions on the effectiveness of the drain they have installed.
Because the project investigated the impacts of drains over time, landholders with drains were targeted. This may understandably give a bias to the responses about drains and drainage in general. The results presented here, therefore, may not be representative of the region as a whole as the sample size involved in this study is too small and too targeted. This report presents the results and discussion linked with landholder interviews. The other areas of this study include field work which examined the physical aspects of the drain and the soil around the drain. Additionally, bore transects next to new drains were established to measure actual changes in the watertable after installation. These technical data are presented in a separate report by Stuart-Street et al. (in prep.).
Note: throughout this report, the term drains is used to mean a structure which is excavated to intercept and manage groundwater. While the majority in the survey are double-leveed deep drains, there are also two which are buried.
1.1 Study area
The study area involved in the project was the Northern Agricultural Region (NAR) of Western Australia (Figure 1). The NAR extends from Gingin in the south to Kalbarri in the north and extends eastwards to Kalannie, covering over eight million hectares. It is dominated by agricultural land uses and is comprised of 18 Shires and includes the City of Geraldton-Greenough as its regional centre.
The climate of the region is typically Mediterranean with hot, dry summers and cool, wet winters. Annual rainfall ranges from 225 mm in the north east of the region to 700 mm in the south west. The landscape is highly diverse due to the four distinct geological provinces: the Yilgarn Craton, the Perth Basin, the Northampton Block and the southern Carnarvon Basin. Each province also exhibits its own hydrological characteristics.
The region was considered suitable for this research as it has extensive areas of land affected by salinity and numerous landholders who have put forward Notices of Intent to Drain submissions. Hunt and Patterson (2004) used Land Monitor Project data to estimate that four per cent of land in the entire region was affected by salinity at that time. This was projected to increase to a total of 17 per cent in the future. Most of the current extent of dryland salinity (and the majority of the drains involved in the project) occurs on the Yilgarn Craton (east of the Darling fault) where it was predicted to expand to 25 per cent of the area. However, these predictions may need revision in the light of reduced rainfall possibly linked with climate change in the region. Information from the Department of Agriculture and Food’s (DAFWA) bore monitoring network suggests that groundwater levels are now falling in many areas (Speed and Kendle 2008). This may indicate a reduced risk of salinity
5
DRAINAGE BENCHMARKING IN THE NORTHERN AGRICULTURAL REGION – LANDHOLDER SURVEY
expansion in the future, but ongoing monitoring will be required to confirm the implications of this trend.
Figure 1: Location of farms participating in the project
6
DRAINAGE BENCHMARKING IN THE NORTHERN AGRICULTURAL REGION – LANDHOLDER SURVEY
2. Method
The main objective of this study was to report on how landholders felt their drains were performing. To achieve this, landholders who already had established drains or were planning to install one during the time of the project were interviewed. To locate these DAFWA’s drain database and Notice of Intent to Drain (NOID) files submitted by landholders from the Northern Agricultural Region were assessed. A range of landscapes were targeted to observe any variations in performance and condition. Therefore, landholders were targeted from across the region in as many soil-landscape zones as feasible.
In summary, 28 landholders were contacted by phone which resulted in face to face interviews with 20 landholders (Figure 1). The remaining eight landholders contacted declined to take part in the study. Three were not interested; two had not dug their drain and were not sure if it would be done in the near future; two did not think their drain would be of interest to the project (one because it was mainly just a conveyance for his neighbour’s drain and the other because it had not been effective); the last landholder initially agreed and then changed his mind and decided not to partake in the project. A drain belonging to one of the landholders who did not have an interview was included in the field assessment part of this study. At the time of writing, one of the landholders interviewed is yet to install his drain.
A structured questionnaire of forty questions was compiled (Appendix 1) using a combination of open-ended and fixed choice questions (Wadsworth 1997). The questionnaire was peer reviewed and the draft was pilot tested with two landholders. The interviews took place between November 2006 and December 2007. Interviews were conducted face to face and answers to questions were recorded by the interviewer.
The majority of drains in the study were established after 1997, as this is the year that the NOID process began. However, some older drains were captured in the survey where extensions or additional drains had been dug on the sites post 1997 and an NOID had been submitted.
This survey should not be considered as representative of all drains in the region. It is a small subset of a targeted group of landholders who had lodged NOIDs. Because of the small sample size used in this project and the basic level of information required, the data have been presented in aggregation form only, without statistical analysis.
For presentation purposes, the questions have been grouped into six themes. These are based on questions which:
a. Investigate the site conditions where the drain was dug and alternative treatments tried for waterlogging or salinity before the drain was established. The purpose of the questions in this section was to try and ascertain some of the history of the land surrounding the drain. Were drains a first choice for salinity amelioration or were other techniques tried, and what level of success had been attained. How productive was the land before it became saline, what did it look like before the drain went in, and did landholders know what level the groundwater table was prior to the drain’s installation (Section 3.1).
b. Focus on the decision and planning processes the landholder went through and what influenced his decision. The purpose of this group of questions was to determine the landholders’ individual motivations and thought processes behind their decision to install a drain. The aim was to investigate the steps that were taken from deciding to install a drain to having it dug, including who provided them with advice, what site assessments were done beforehand, and what delays were experienced (Section 3.2).
7
DRAINAGE BENCHMARKING IN THE NORTHERN AGRICULTURAL REGION – LANDHOLDER SURVEY
c. Provide details about the technicalities of the drain and its installation. This section attempted to capture the on-ground details of the drain, including how long it had been in place, how much it had cost, whether it required maintenance and the reasoning for the drain location. This was done to gain a clearer picture of the technicalities of installing drains (Section 3.3).
d. Investigate changes to the site and to the drain itself after it was installed. This includes changes to site management and any changes planned in the future. The focus was on determining what the landholders had observed on their land since the drain was installed. Any changes in the management of the land since the drain was installed were investigated, including the maintenance of the drain over time (Section 3.4).
e. Determine how the drain impacts on the day to day running of the farm. The purpose was to ascertain how the drain fitted into the running of the farm – whether it created problems or if it provided new opportunities (Section 3.5).
f. Determine landholder satisfaction of the drain. This section investigated whether the landholders were happy with their choice to install a drain, and what they felt did and did not work (Section 3.6).
To capture landholder’s thoughts about drains not picked up through the formal questions, an opportunity was given to landholders to make extra comments (Section 3.7). As part of this, landholders were also asked if they kept rainfall records for their farm and how long they had been keeping them. It was planned to collect this data and use it to determine if the property had experienced heavy rainfall events since their drain’s construction to suggest if flushing of salt from the profile may have occurred. Additionally it was intended to investigate if there had been a discernable change in the rainfall patterns over the time they were recorded. Unfortunately this was not feasible due to the inequity of the records being kept.
8
DRAINAGE BENCHMARKING IN THE NORTHERN AGRICULTURAL REGION – LANDHOLDER SURVEY
3. Results
3.1 Site condition and alternative treatments.
3.1.1 Condition of the site.
The state of the area before the drains went in varied from property to property and within properties as well. Some of the paddock descriptions include:
o Bare and damp
o Varied from bare salt scald to salt bush and barley grass and some very low production areas
o Very waterlogged in the winter
o Waterlogged, virtually no crop as it was so wet, no salt as yet
o Salt scalds; low to no germination of crop which leads to weeds like spear and brome grass
o Patchy crop with salt tolerant plants growing in it
o Bare salt patches, iceplant and barley grass growing; waterlogged
o Patchy waterlogged pasture
o Patchy barley grass with salt tolerant shrubs and some bare patches
o Iceplant and old man salt bush growing in patches; native vegetation in lower part of valley dying off
3.1.2 Productivity of the site.
Not all landholders clearly described what the productivity of the site was before salinity or waterlogging became a problem. Those that did, said the site was very productive, or even the best land on their property.
Once salinity and/or waterlogging became a problem, half of the landholders described the area as unproductive or that they were unable to crop it. The productivity at some sites was described as:
o Patchy, with low productivity occurring in affected small patches
o Gradually declining or getting worse over time.
o Dependant on the season and how waterlogged the site became.
3.1.3 Alternative treatments tried.
Many landholders had planted trees or perennials prior to digging the drain, often with mixed results, particularly with establishment (Table 1). In many cases, the trees just didn’t survive. Others had tried surface water control structures, but had little success with them – one landholder felt they were creating the problem. Another landholder had planted salt bush but in the long term wanted to reclaim land to cropping and felt he couldn’t do this with salt bush.
9
DRAINAGE BENCHMARKING IN THE NORTHERN AGRICULTURAL REGION – LANDHOLDER SURVEY
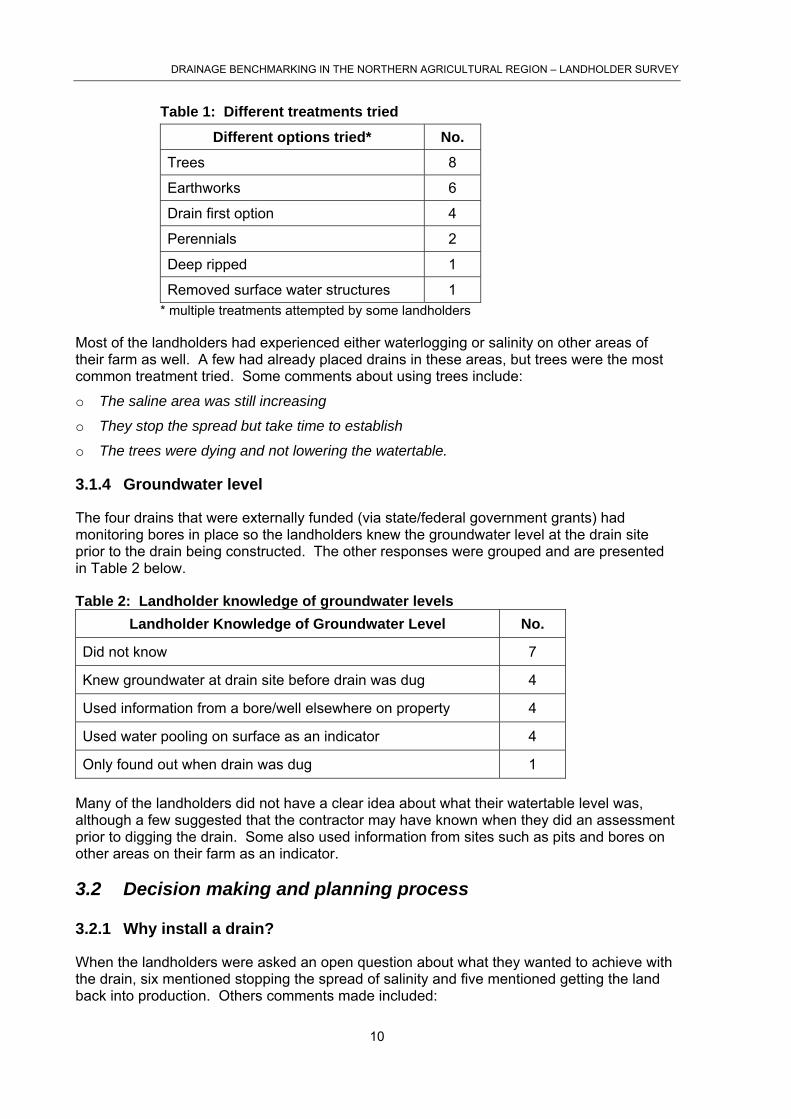
Table 1: Different treatments tried
Different options tried* No.
Trees 8
Earthworks 6
Drain first option 4
Perennials 2
Deep ripped 1
Removed surface water structures 1 * multiple treatments attempted by some landholders
Most of the landholders had experienced either waterlogging or salinity on other areas of their farm as well. A few had already placed drains in these areas, but trees were the most common treatment tried. Some comments about using trees include:
o The saline area was still increasing
o They stop the spread but take time to establish
o The trees were dying and not lowering the watertable.
3.1.4 Groundwater level
The four drains that were externally funded (via state/federal government grants) had monitoring bores in place so the landholders knew the groundwater level at the drain site prior to the drain being constructed. The other responses were grouped and are presented in Table 2 below.
Table 2: Landholder knowledge of groundwater levels Landholder Knowledge of Groundwater Level No.
Did not know 7
Knew groundwater at drain site before drain was dug 4
Used information from a bore/well elsewhere on property 4
Used water pooling on surface as an indicator 4
Only found out when drain was dug 1
Many of the landholders did not have a clear idea about what their watertable level was, although a few suggested that the contractor may have known when they did an assessment prior to digging the drain. Some also used information from sites such as pits and bores on other areas on their farm as an indicator.
3.2 Decision making and planning process
3.2.1 Why install a drain?
When the landholders were asked an open question about what they wanted to achieve with the drain, six mentioned stopping the spread of salinity and five mentioned getting the land back into production. Others comments made included:
10
DRAINAGE BENCHMARKING IN THE NORTHERN AGRICULTURAL REGION – LANDHOLDER SURVEY
o Protect infrastructure in the area.
o Lower the watertable.
o Drain the waterlogged area.
o Get the watertable to a level where it was useful not detrimental.
Table 3: Main motivation for deciding to drain
Main motivation on deciding to drain No.
Climatic event (mainly 1999 high rainfall year) 7
Neighbour had drain 7
Stop spread of salinity 3
No single event or influence 3
Seven landholders were influenced to drain by problems encountered on their properties after the very wet year experienced across the region in 1999 (Table 3). Many had serious waterlogging problems and increasing salinity. They saw arable areas of their land decline and a reduction in productivity as a result. Influences from the actions of neighbours were prominent in the decision making process. Seven observed others’ drains and investigated the results before going ahead with their own. Some landholders had a range of influences that prompted their decision.
3.2.2 Planning time and delays
Landholders were asked for how long they thought about installing a drain before the contractor started digging (Figure 2). For the majority it was a relatively short process, within two years, while others took longer to decide, or had delays in starting.
0
1
2
3
4
5
6
7
≤ 6 months 1-2 years 3-5 years >5 years
No. o
f lan
dhol
ders
Figure 2: Amount of time between making decision and digging drain
11
DRAINAGE BENCHMARKING IN THE NORTHERN AGRICULTURAL REGION – LANDHOLDER SURVEY
The landholders were also asked if there was any delay in installing the drain after they decided to go ahead with it and what were the reasons for the delay. The main cause for delay was paperwork, such as that needed for the NOID submission (Figure 3).
Main causes of delays
0
2
4
6
8
10
12
delay no delay
No.
of l
andh
olde
rs
Paperwork/NOID Negotiations with neighbour and/or Shire
Money Weather Drain was not a priority
Figure 3: Main causes of delays before drain was dug
3.2.3 Sources of Advice and Assistance
When first getting advice and assistance on deep drainage, 11 sourced their information from more than one place. Two did not seek any advice. Contractors and neighbours were the main sources of advice (Figure 4).
12
DRAINAGE BENCHMARKING IN THE NORTHERN AGRICULTURAL REGION – LANDHOLDER SURVEY
0
2
4
6
8
10
12
14
16
Consultant
Drainage contractorDAFWA EEI*
Landcare/catchment groupNeighbour None
No.
of f
arm
ers
Figure 4: Sources of advice used before drain installed (*EEI – Engineering Evaluation
Initiative)
The initial questions some of the landholders asked before going ahead with drainage included:
o Where should the drain go, what depth should it be, and what gradient?
o Would the drain block up? Would it draw water from far enough away?
o How much water would the drains run? What maintenance is needed?
o How well do they work? Would this type of land drain? How much fall is needed, and is there enough [fall] on the land?
o What type of soil responds? What is the cost?
o Are they effective?
Responses provided to these questions were usually optimistic. This is also borne out by the responses in Section 3.2.5 which includes additional comments made by contractors to landholders.
A number of the landholders did not ask specific questions before going ahead with their drains for a number of reasons. These included: having experience with drains on their property; they had a lot of faith in the contractor; and/or they had picked up a lot of knowledge on the subject already from neighbours.
3.2.4 Site assessment
The level of pre-construction site assessment varied considerably between the 20 properties (Table 4). The four drains that were externally funded had detailed assessments carried out as a requirement of their funding.
13
DRAINAGE BENCHMARKING IN THE NORTHERN AGRICULTURAL REGION – LANDHOLDER SURVEY
Table 4: Level of pre-drain site assessments Level of assessment No.
Detailed assessment by contractor/funding body 9
Visual/minor assessment by landholder 5
Minor assessment by contractor 3
No assessment done 3
Detailed assessments by contractors included digging pits to look at soil type, inflow rates and watertable levels. Minor assessments by contractors were to survey the site to get the correct gradient for the drain. Five of the landholders did their own site assessment, which included visual assessments, divining for water, site survey for levels and a few test pits. Three of the landholders did no site assessment prior to digging.
3.2.5 Time frame
Many of the landholders did not have a set time frame in mind for how long they thought it would be before the drain had the impact they were hoping for. Many had no time frame while some said a “few” years. One landholder was just trying to stop the spread and wasn’t so focussed on recovery, stating that:
“…it took 50 years to go salty so will probably take 50 years to recover.”
Of those that did set a time frame, several hoped to see impacts very soon. Five believed there would be an impact straight away to within one year. Other landholders had longer time frames, such as two who believed it would be 4-5 years before the drain had an impact. There was one landholder with a very set time frame - he had a target of 10 years and if he had seen no improvement after that he would leave that property.
Three landholders went on to say that the contractor had advised them on how long it would be before they saw an impact. Two were told by their contractor that they could probably crop the area again within a few years while the other was told he would probably see the difference within a year on the sandplain and longer on the clay land.
3.3 Technicalities of the drain and its installation
3.3.1 Year of Construction
The drains which were studied during the project were installed between 1980 and 2007. Some properties have had multiple drains constructed at different times, or have had large extensions added over time. Figure 5 shows the range of years that the drains were constructed (this includes the multiple drains and extensions, hence the total is more than 20).
14
DRAINAGE BENCHMARKING IN THE NORTHERN AGRICULTURAL REGION – LANDHOLDER SURVEY
0
1
2
3
4
1980
1986
1987
1988
1997
1998
1999
2000
2001
2002
2003
2004
2005
2006
2007
Year drain constructed
Num
ber o
f dra
ins
Figure 5: Range of years drains constructed
3.3.2 Cost of Construction
The cost of construction varied from $2000 - $8000/km, with the average being $4700/km. Variations in cost came from factors including: design of the drain, whether the drain was fenced, the soil type it was being dug through, the year it was constructed, and the number of culverts. One landholder said that his culverts cost $1000-$3000 each. Another landholder stated that the cost of one of his culverts was $34,000.
3.3.3 Contractor
The 19 landholders whose drains had been constructed by the end of the study period mainly used three contractors. One contractor had dug drains on nine properties. The remaining landholder who is yet to install his drain is planning on doing the work himself.
3.3.4 Drain Design and Placement
Eighteen of the drains are deep drains, and two are buried. The drains, including the one yet to be constructed, vary in length from 700m to 27km with the average being approximately 7 km.
Fifteen of the landholders positioned their drains either in the valley floor or just off set from it. Reasons given for this choice included that:
o This was the natural drainage line
o There was no way for water to naturally drain out of these low points without the drain
o Contractor’s advice
o Would have had to dig the drain deeper if it was placed further out of the valley floor
o When the drain is just offset from the valley floor it will cut off the spread of salt from the valley floor.
Some of the landholders mentioned that spurs were added to target other affected areas. Two stated that they chose the alignment not based on topography but to pick up problem
15
DRAINAGE BENCHMARKING IN THE NORTHERN AGRICULTURAL REGION – LANDHOLDER SURVEY
areas. One of the drains was dug at the break of slope where the soil type changes. This design was chosen so that the drain would pick up the lateral groundwater flow.
All of the drains studied (aside from the buried drains) have some sort of levee or spoil bank. The spoil can form a levee on both sides of the drain (double levee), one side of the drain (single levee), or placed in piles on one or both sides of the drain that don’t form a continuous levee (i.e. alternate levee). In this study there were drains using all three of these designs (Figure 6). Levees are designed to prevent surface water from entering the drain to help reduce erosion and siltation.
Levee design for drains
0
2
4
6
8
10
12
double single alternate double and single
Levee design
No.
of d
rain
s
Figure 6: Range of levee designs encountered during the study
The drains which feature both single and double levee sections had the single levee sections strategically placed in areas where surface water is not able to flow into the drain. For example, if the drain is traversing a slope then the spoil is placed on the upper side only. Three of those with double leveed drains said that this design was chosen because it is what was stipulated to them as part of the NOID design requirements.
Of the two buried drains, one is constructed from slotted and unslotted PVC pipes. The pipes are spaced roughly 40m apart and connect into main drains, in a herringbone pattern, covering approximately 130ha. This system was chosen by the landholder as he did not want to lose land to the drain and spoil banks which would have been the case with a regular deep drain system. This system is more expensive but the extra cost was justified by the landholder as a majority of the farm infrastructure is located within the area that was salt affected.
The second buried drain is constructed from plastic sheets that act to intercept lateral groundwater flow and direct it to a natural surface water channel. This design was chosen because the sandy soil type and landscape position meant it would not be suitable for a conventional drain because it would be very susceptible to erosion. In total there are four sections of drain each approximately 2 km long, comprised of the buried plastic sheet and an overlying grade bank.
3.3.5 Road Crossings Thirteen of the landholders have drains that cross roads. Not all of those landholders elaborated but nine did say that they had contact with their Shire prior to installation. In some cases the Shire developed drainage plans and regulations. Some landholders made use of road culverts that were already in place, while others had to get culverts installed.
16
DRAINAGE BENCHMARKING IN THE NORTHERN AGRICULTURAL REGION – LANDHOLDER SURVEY
There was a mixture of arrangements with Shires in terms of who did the work and maintained them, and who would pay for them. Some of the arrangements include:
o The Shire paid for half the cost of the culvert up to $2000
o The Shire paid for 1/3 of the cost
o The Shire provided the materials but the landholder was responsible for installation
o The Shire agreed to the culvert and the landholder was responsible for all costs and labour
o The Shire installed the culvert.
3.3.6 Financial assistance Of the four who receive financial assistance to install their drain, one was part of the Engineering Evaluation Initiative (EEI) and the other three were involved in catchment scale drainage systems implemented by a local catchment group. When the four landholders with funded drains were asked if the financial assistance influenced their decision to install their drain two said they wouldn’t have dug it without the funding. The other two said they would have still dug their drain but the timing would have been different.
3.3.7 Scale of drainage Most of the drains studied cross property boundaries, with a mix of catchment group coordinated schemes and negotiations across fences by neighbours who were not involved in a group (Table 5).
Table 5: Scale of drains Drain located on one
property Drain located across multiple properties
Catchment group coordinated
Neighbour consultation 9
5 6
3.4 Changes in the site and the drain.
3.4.1 Changes in the soil and productivity
Apart from three recently dug drains, most of the other landholders reported improvements in the soil surrounding their drain. Drier soils were a common improvement that was observed (Table 6). Comments about this included:
o Soil is softer and dries quicker after rain
o Can work it now because it is drier and can now grow a crop and pasture
o The soil’s dried out. You can drive on areas you couldn’t before
o The soil drains and dries out faster. It has also lost some structure as well.
17
DRAINAGE BENCHMARKING IN THE NORTHERN AGRICULTURAL REGION – LANDHOLDER SURVEY
Table 6: Observed changes in soil Changes in soil since drain
installed No.
Drier 11
Easier to work 2
Drier and easier to work 3
No change 1
Too early to tell 3
Two landholders who talked about the soil drying out did say that this could also be due to the recent dry seasons. A few landholders also mentioned they had noticed a loss of soil structure.
Most of the landholders reported an improvement in productivity in the land around the drain since installation. This ranged from a big difference such as cropping for the first time in years, to a small difference or gradual improvement over time. A few say it is either too early or difficult to tell due to the lack of rain in recent seasons. Three landholders, however, say that productivity has not improved (the remaining landholder still has not dug his drain).
Two of the landholders with buried drains are now cropping or growing pasture up to and over the top of their drains. The majority of the landholders with drains are now cropping as close as practicable to the edge of the drain spoil. This ranges from approximately 50 m away from the drain to the edge of the drain spoil. The two landholders not yet cropping in the drained area had their drains dug in 2007.
3.4.2 Changes in the vegetation and land
There has been a variety of changes in vegetation (other than crops) that the landholders have observed in the land surrounding the drains (Table 7).
Table 7: Observed changes in vegetation Changes noticed in vegetation* No.
Native bush and planted trees surviving and regenerating 7
Grasses appearing 5
Little/no change in vegetation or still dying off 7
Too early to tell 3 * multiple observations were given by some landholders
Most of the observations have been positive, and include:
o The area of salt scald is two thirds what it was. It’s not back to full production, but it’s not bare anymore
o There are now very few bare patches
o The land has dried out, the samphire is dying off and the trees that had been planted are doing better
o Some land is close to total recovery
18
DRAINAGE BENCHMARKING IN THE NORTHERN AGRICULTURAL REGION – LANDHOLDER SURVEY
o Grasses are now growing on what were bare patches
o Big improvement in the vegetation due to a combination of the drain, fences and stock control
o Trees adjacent to the drain and out to 150m are doing better
o There has been improvement in the remnant vegetation. The York gums were slowly dying off before the drain went in, all those in the salinity affected areas are now recovering.
Some of the landholders, however, have not seen improvements in the vegetation since the drain was installed, rather it remains much as it was before. Some observations include:
o The remnant vegetation in the lower part of the valley was dying off before and continues to die off now.
o No real changes, trees that were dying haven’t come back.
o Salt scald is still there.
o Little change in the large patch of vegetation around the older drain, some trees are dying.
3.4.3 Changes in water flow and water table
When asked about observed changes to the watertable, half of the landholders did not know the current depth of the watertable. The other half took the water level from various sources including bores near the drain, bores at other locations on the property, from the water level in the drain itself, the presence of water on the surface and signs that banks and soil had dried out.
Most of the landholders observed that their drains now have a much reduced flow compared to when they were first installed. They have mainly noticed that the drains, which initially used to run all year, have now slowed or only flow seasonally in winter. A few of the landholders said that their drains never had a decent flow since installation.
Due to the design of the buried plastic sheet drain, the current water flow and fluctuations in water flow over time could not be determined.
3.4.4 Changes in outlet area
When asked if they had observed any changes to the outlet area where the drain discharges, or the land surrounding it since the drain was installed, not all of the participants answered this question. Half of the landholders had not seen any changes and three said it was too early to tell. One landholder had never seen the outlet area because the drain ran into a neighbour’s property before discharging into a natural salt lake system. Another observed that there was more water at the discharge site but there had been no change in the vegetation.
3.4.5 Changes in management and long term management plans
The most common changes in agronomic management of the land surrounding the drains were the application of gypsum and deep ripping. Eleven landholders have, or plan to, deep rip the site and eight have, or plan to apply gypsum,. Many have not made any changes to the management of the site. Other changes they spoke of include:
o Application of lime
19
o Keeping stock off
DRAINAGE BENCHMARKING IN THE NORTHERN AGRICULTURAL REGION – LANDHOLDER SURVEY
o Controlling iceplant
o Planting barley on the saltier parts and wheat on the better land
o Changing direction of cultivation to help surface water flow
o Reducing paddock size to manage grazing.
When asked what their long term management plans for the site included, the most common response was to get or keep the land in full production in their cropping and/or pasture rotation.
o Hope to get back into full production. In slower recovery areas we’ll deep rip and apply gypsum
o Get the land back into full production, and stop more spread of salinity
o Hope to regain the whole area to crop and pasture. Not planning on fencing areas or putting in perennials like salt bush.
Some also said they would like to get part of the land back into production and would target other areas for revegetation and perennials. Their comments included:
o Hope to get the areas that became salt affected later back into full production. Other areas might be used for mallees or salt bush, depends on how the land recovers.
o Planning on fencing the most severe parts and planting trees.
o Some areas will come back into full production. Have to be realistic and target other areas for different uses.
o Revegetate some areas, fence all the creek systems and revegetate them. Other areas will be bought back into full production.
Other long term plans included:
o Adding in stage two of the drainage plan and continuing with pasture improvement.
o Monitor the drains, may need to add spurs.
3.4.6 Maintenance
When questioned about the maintenance of their drains, half of the landholders answered that they have not done any maintenance since they were constructed (their drains were constructed between 1987 and 2007). The other half has done maintenance, however the type and degree varies. The main reason for maintenance was when a big rain had silted the drain up they got it cleaned out. Otherwise, they often waited until they had the funds and when the contractor was in the area. A few landholders only cleared out specific spots on the drain, such as culverts. Many felt that more extensive maintenance was not required along the entire length of the drain.
The costs incurred for maintenance ranged from $1000/km to over $2000/km. The landholder with the buried pipe drain has had no maintenance costs so far but had running costs (for pumps) of approximately $1500/year.
Four of the landholders said they had not seen any changes in the condition of their drains, which were dug in 1980, 2002, 2006 and 2007. Other comments from landholders who had observed changes in the appearance of the drain include:
o There is erosion on the side walls, and spoil is washing back into the drain.
o There’s a little bit of sludge of in the bottom and some small rills.
20
DRAINAGE BENCHMARKING IN THE NORTHERN AGRICULTURAL REGION – LANDHOLDER SURVEY
o Some banks and sides have subsided and the drain has become silted.
o There is erosion and slumping, some areas held up better than others. It’s dependant on the soil type.
o Noticed slumping on the square wall section, but not on the newer section which has sloped walls.
These landholders suggested the reasons for these changes included (in decreasing order of importance): rain, stock, soil type, design and water flow.
3.4.7 Expected impact of the drain in the future
Most of the landholders believe their drains will continue to have a positive impact in the future. The impacts they hope for include:
o Keeping the watertable down
o Maintaining soil quality
o Maintaining the status quo
o Preventing the spread of salinity.
One landholder said the drain would have no impact in the future, and another said it was dependant on the seasons and rainfall. A few said it was too early to tell, with one of these adding that a couple more seasons were needed before they could judge it.
3.5 Impacts of the drain on the operations of the farm
3.5.1 Impact on day-to-day operations The majority of landholders say the drain has impacted on the day-to-day operations of their farm. Most problems relate to access for machinery and moving stock. This includes the landholder with the buried plastic sheet drain, as he said there had been some difficulty with chasing stock over the surface drain component of the system. The impacts varied from minor to a “considerable inconvenience”. Several landholders had added culverts after the initial construction, or are planning to add extra culverts to help overcome these problems. One landholder said he had thought of replacing one drain section with buried pipe to reduce the impact.
A few landholders say that their drain has had no impact on the day-to-day operations of their farm. This includes two with leveed drains and one farm using the buried drain coil. Five landholders said they have had to change the shape of paddocks, however not all of them see this as a negative impact. One of these said he now has smaller paddocks that are better for running sheep in.
3.5.2 Stock and fencing Almost half of the landholders have had stock get into the drains. This was an incentive for four landholders to fully fence their drains as a result. Others were not so concerned (Table 8). Fencing drains and having stock getting into them were not issues for the two landholders with buried drains.
21
DRAINAGE BENCHMARKING IN THE NORTHERN AGRICULTURAL REGION – LANDHOLDER SURVEY
Table 8: Fencing of drains Fencing of drains No.
Fully fenced 4 Partly fenced 4 Not fenced but considering it in future 5 Not fenced and not planning to 5
3.6 Landholder satisfaction with their drain.
3.6.1 Things liked most about the drain
When asked what they like most about their drain, answers were mainly about how they saw the drain was improving viability and productivity and reducing waterlogging (Table 9).
Table 9: Things liked about drains Things liked most about the drain No.
Recovers land/helps productivity & viability 11
Reduces waterlogging 3
Control of big water flows 2
Nothing at all 2
Can’t see it (buried drain) 1
Some comments include:
o It improves the running and viability of the property
o It’s effective at keeping the waterlogging minimal
o It keeps the farm viable
o Instant result, quicker than trees
o That in time it can get unproductive areas and areas at threat into production
o It won’t make money but it will help save the land.
3.6.2 Things least liked about the drain Landholders were also asked what they like least about their drain. Responses are presented in Table 10. One landholder answered that there was nothing he didn’t like and wanted to see the drain extended.
22
DRAINAGE BENCHMARKING IN THE NORTHERN AGRICULTURAL REGION – LANDHOLDER SURVEY
Table 10: Things least liked about drains Issues Least Liked about Drain* No.
Inconvenience to cropping and stock activities on farm 10
Appearance 3
Cost 3
Maintenance 3
Not working well (in whole or part) 2
Nothing disliked 1 * multiple responses were given by landholders
Answers included:
o The cost, you don’t get the return on investment
o The physical barrier it creates as well as the appearance
o Ease of working in the area is reduced and driving stock is more difficult
o Sheep get stuck in the mud in the bottom
o The cost
o Inconvenience of working around and crossing over them and maintenance.
A recurring theme of dislike of the drains was the inconvenience of moving stock and machinery around the drains.
3.6.3 Anything they would do differently An open question was asked about whether they do anything differently if they were putting in the drain all over again. Four landholders mentioned culverts - either putting more in, placing them in different locations, changing their design or the timing of their installation.
Eight landholders said they wouldn’t or couldn’t do anything differently. Other comments include:
o Digging the drain deeper, but are constrained by the end point.
o More planning in the beginning so only one drain had to be dug.
o Only put spoil bank on one side
o Stop digging when we hit the dry bit
3.6.4 Perceptions of effectiveness and value Landholders were asked a fixed choice question on whether they thought their drain has been (a.) effective; (b.) value for money; (c.) effective and value for money; or (d) too early to tell? The most common response was that they thought their drain had been both effective and value for money (Figure 7).
23
DRAINAGE BENCHMARKING IN THE NORTHERN AGRICULTURAL REGION – LANDHOLDER SURVEY
Effectiveness and value of drains
0123456789
Effective Effective andvalue for money
Too early to tell Uncertain
No.
of L
andh
olde
rs
Figure 7: Responses to effectiveness and value of drain
Those saying it was too early to tell had constructed their drains between 2001 and 2007
3.7 Additional questions
3.7.1 Further comments and questions
Landholders were also given the opportunity to ask questions or make extra comments outside of the tailored interview. Some of these include:
o Why is there such a divided view on deep drains when there are examples that obviously work?
o We held a field day on the property the first day of digging. It was organised through the Wisalt newsletter and advertised in the countryman and on ABC radio. Another field day was held the following year and the same people came back, many of them had already converted to drains. I would have liked to have more people turn up, particularly people who were sceptical about this type of drain.
o There needs to be better coordination and communication between CALM, railways and roads so they can all work together and there are fewer delays when drain applications go in.
o It is pointless having a drain without planting trees.
o Because the valley floors went saline slowly there only has to be a slight tip in the balance the other way to gradually recover that land.
o Recharge has to be controlled as well, like putting interceptor banks on the break of slope that directs water into drain.
o The funding needs to continue if landholders are to tackle the salt with drains.
o Deep ripping is an important part of the process to help water and salt leach down.
o There is some resistance to drainage, they should be encouraged more.
o You have to move early on waterlogging problems so they don’t go salty.
o Consult your neighbours, compromise not confrontation.
o Wish the drain had been funded as a regional waterway.
24
DRAINAGE BENCHMARKING IN THE NORTHERN AGRICULTURAL REGION – LANDHOLDER SURVEY
o If it works and doesn’t get filled in by flood water it’ll be good. (a recently constructed drain)
o Sometimes a drain has to be installed before trees can be planted so that they have a chance to get established. They work together; neither will work on their own.
o Drains accelerate the natural drainage process.
o It would have been good to have taken some water samples at the start to see what the changes have been over time.
25
DRAINAGE BENCHMARKING IN THE NORTHERN AGRICULTURAL REGION – LANDHOLDER SURVEY
4. Discussion
4.1 Alternative Treatments and Site condition
The majority of landholders interviewed had tried alternative treatments before deciding to try drains. The dominant treatment attempted was usually trees or perennials such as saltbush. The majority found that this was largely unsatisfactory. Additionally, the long term goal of most landholders was to get the area back into cropping or arable production - trees and perennials were going to be a physical barrier to achieving that.
Over the past two decades, there has been a large shift in thinking regarding the impact of trees on watertables and salinity. Once it was commonplace to suggest that large plantings of trees in a catchment would have a positive impact on reducing the risk of salinity. More recent research, however, has shown that this is not the case, particularly on farms with incomes derived from dryland agriculture. Analysis by Bennett and George (2008) has shown that reductions in recharge are localised to the area beneath the revegetation with little impact on measured groundwater levels or on the extent of saline land. They suggest that the proportion of vegetation required to make any sort of impact on the watertable (>50% of the catchment area) would make it unviable for dryland farming activities to continue.
The comments from the landholders appear to back up these research findings. It seems (and also found by Lloyd 2003, Pannell and Ewing 2006) that tree planting as a satisfactory remedy for salinity has lost appeal, due to the slow or complete lack of any response in combating or stopping salinity.
The other option tried by a few landholders as an alternative method for salinity control was surface water control structures. This option had mixed uptake by the landholders who partook in the survey and they had mixed levels of satisfaction. Several studies recommend that the cheaper option of surface water control structures should be tried before more intensive levels of earthworks are attempted (Hasleby 2007, O’Donnell 2005, Ferdowsian et al. 1997). Most landholders in this survey, however, did not appear to be doing this. Some were actually removing the structures because of perceived improvements in soil condition from no-till farming practices resulting in less surface runoff. This perception may, however, coincide with the drying trend in the climate and altered rainfall patterns experienced in the NAR since 2000.
None of the landholders interviewed mentioned the use of surface water structures as a tool to manage waterlogging despite this being a common problem. This practice may be more widespread in areas south of the region, where it has been found that a majority of landholders in some localities are using surface drainage to manage this problem (URS 2006). As the combined effect of waterlogging with salinity is far worse than either factor alone (Barrett-Lennard 2003), the incorporation of well designed and sited surface water structures in some areas may be a cheaper and effective option which appears to be poorly explored to date.
The condition of the land prior to drainage was variable on each farm ranging from waterlogged pasture to bare scalding. In many cases there was clear impact from watertable rise. In other cases, however, this connection was not so evident, and some of the problems identified included waterlogging derived from poor soil structure. Some misunderstanding of the symptoms observed in the problem diagnosis appears to be occurring. Water pooling on the surface is not necessarily groundwater, yet it is used by some landholders as an indicator. Additionally, slender iceplant is perceived by many as an indicator of salinity.
26
DRAINAGE BENCHMARKING IN THE NORTHERN AGRICULTURAL REGION – LANDHOLDER SURVEY
Recent studies show this is not always the case, as it can also be found on slightly saline and productive land (L. Hunt pers. comm.).
Knowledge of groundwater levels was generally low among the landholders, but this information is critical to have, particularly to establish the location and effective depth to which the drain would need to be constructed. A similar low level of knowledge about groundwater before drainage was found in a survey by URS consultants (2006) who suggest that in the absence of data these judgements [about watertables rising] are open to question. One landholder interviewed found out the expensive way how worthwhile knowledge about the watertable is before digging the drain:
“If there’s no water in the drain the day after digging then it’s a waste of time and money to keep digging”.
Having a clear understanding of the problem, including knowing the depth to the watertable and whether it has a rising or falling trend, or is in equilibrium, is key information to managing salinity. It may instead only be a waterlogging problem, or alternatively the watertable may have previously been high and has a falling trend. To emphasise this point, several landholders interviewed mentioned 1999 as an event that encouraged them to install their drain. This very wet year in the NAR may have resulted in acceleration of the watertable rise, but it may have since fallen and the soil remains salty due to lack of flushing rains in the dry seasons since 2000. There are in fact, numerous examples from DAFWA’s bore monitoring network which shows that 1999 is the peak in watertable levels and they have since declined (Speed and Kendle 2008).
4.2 Decision making and planning process
As mentioned previously, the very wet year in 1999 was a catalyst for many. All the landholders wanted to fix the problem in order to get their degraded land back into production and to prevent the problem from worsening.
To help them with their decision, most landholders sought advice from a range of sources. Most prominently, however, the advice was from drainage contractors and neighbours. The common use of neighbours and drainage contractors as a source of advice about drains was also found in two other surveys done in the Central Agricultural Region (Chandler and Coles, 2002, Kingwell and Cook, 2007). Kingwell and Cook’s study found the cause for this was due to landholders feeling there was an absence of widely available, trustworthy and independent information. While there is a large amount of technical information about drains available to landholders through DAFWA and other government agencies, landholders do not appear to be accessing this. Lloyd (2003) undertook a study on uptake of extension material for salinity treatments, and found several reasons for this. He found that landholders prefer to get their information face-to-face. Lloyd stated that landholders see written information as too broad and consequently, not applicable to individual farms - not relevant to their situation and not providing clear guidance they could take action on. This has also been emphasised by NACC (2005) who identify that there has been clear market failure in providing this “on farm” advice for salinity. Understandably, therefore, in these situations landholders will turn to the sources they perceive as reliable and knowledgeable – other landholders with drains and drainage contractors.
Kingwell and Cook (2007) recognised problems with these information sources however. They suggested that there is risk in relying on neighbours’ experiences. They may be optimistic about their experiences with drainage, but their outcome may not translate to other properties due largely to spatial variability (and consequently variability in drain impacts) from farm to farm. Kingwell and Cook also state that information sources with vested interests,
27
DRAINAGE BENCHMARKING IN THE NORTHERN AGRICULTURAL REGION – LANDHOLDER SURVEY
such as drainage contractors, cannot be relied upon to give unbiased opinions on likely outcomes. This issue was exhibited clearly by one landholder who commented that:
“…[the contractor] was confident before digging, not so confident several days into digging through rock and almost stopped. We were coming off two successful drains with that contractor and so were feeling positive about them. Since then [the contractor] has dug some drains that have not worked and thinks that is due to lack of depth.”
The reliance on these combined sources of information, therefore, may fuel the adoption of drainage, which may lead to some uneconomic investments.
The other main finding in the decision-making process is the lack of good site investigation undertaken by many of the landholders prior to digging their drains (also illustrated by the previous quote). Numerous reports highlight this issue as a consistent flaw in drain establishment. Yandle (2004) discussed this point clearly in his study of drains in the Narembeen area. He found that drains were not designed according to diagnosed site-specific problems, mainly because diagnosis was inadequate. Cox et al. (2004) summarises the importance of site assessment, detailing the information required to base the decision of digging a drain:
“For a drain to be effective it must be planned and designed to address the conditions in the landscape that are causing the problem. Site assessment is the most important part in planning and designing a deep drain. This may account for 20% of the total budget. Thorough assessment including ground and surface hydrology, topography, estimates of run-off velocities and volumes, estimate of depth to watertable, soil type, variations in soil stability and permeability, location and height of outlet should be done.” (p6)
Undertaking a detailed site investigation will allow the landholder to gain a better understanding of the cause of the degradation. Nulsen (1982) supports this by stating that the appropriate drainage system for each area will depend on whether that site is debilitated primarily because of waterlogging or salinity or a combination – it is essential, therefore, that the problem be correctly identified before digging. This may add more to the overall cost of the drain, but it is better to do the job properly by creating a more targeted solution to the problem and as stated by Yandle (2004), it will save on expensive maintenance in the future
4.3 Technicalities of the drain and installation
Among the landholders interviewed, it appeared that interest in drains as a solution to salinity escalated in the late nineties and was fairly widespread up until the time of our interviews. This interest was well founded, based on data which suggests that the rates of ground water rise in the Northern Agricultural Region at this time was an overall average of 10 cm per year (Speed and Kendle 2008). This rate of rise was exacerbated by episodic recharge in 1999 with an intense rainfall season (R. Speed pers. comm.). It appears, however, that interest in drains (using NOID submissions as an indicator) has fallen in the past few years (B. Wheaton pers. comm.). This may be due to the very dry 2006 and 2007 seasons which have impacted severely on many landholders’ cash flows. This also coincides with a watertable trend which is now falling. Since 2000 there has been a run of very dry years in the region (2005 was an exception with just below average rainfall), and Speed and Kendle have found that watertables are now falling by an average of 10 cm per year.
Investment in digging drains is obviously significant and is variable from drain to drain depending on the constraints of the site, the design of the drain, ongoing costs such as pumping or maintenance, whether culverts are needed and if a contractor has been engaged
28
DRAINAGE BENCHMARKING IN THE NORTHERN AGRICULTURAL REGION – LANDHOLDER SURVEY
to dig it. The dominant costs for the landholders interviewed ranged from $2000/km - $8000/km, with the cost of culverts generally being up to $3000 each (with one being as high as $34,000). This was a similar cost range for installation found by Chandler and Coles (2003) and URS (2006), but they stated that some drain costs were as high as $12,000/km. The lengths of drains installed by the landholders interviewed ranged from 700m to 27km, with the average being approximately 7 km long.
The drain design utilised by landholders was fairly standard and largely to the recommended criteria, with double leveed drains being the most widespread choice. A variety of reasons was given for the placement of the drain – each landholder had a different target for treatment, emphasising how individual and site specific the problems with salinity and waterlogging are on each property.
One of the biggest challenges of drain installation is when they involve a road crossing due to detailed technical design requirements and the need to negotiate with the Shire. Clearly in many cases a great deal of negotiation was done and a variety of arrangements were made with different Shires. There was even a variety of arrangements within single Shires, suggesting clear local government policy for drainage had not been established in some areas when the drains were being installed. This resulted in some inequity between landholders in some Shires. Policy development in some Shires is believed to have improved. As previously mentioned, culverts also add greatly to the cost of the drain (where landholders and not Shires were paying), and maintenance of these areas will be an ongoing cost in the future (for both landholders and Shires). In addition to negotiation with Shires, drainage networks clearly require a great deal of consultation between neighbours and catchment groups to make them function successfully – over half of the landholders interviewed had their drain linked with other farms.
The majority of landholders did not receive any financial assistance with their drains, although most indicated that they would have liked to. It appears that the funding does have some influence on landholders’ decision to drain. Two (of the four landholders who had received funding) said they would not have put one in if they had not received funding. The other two said they would likely have still put the drain in but at a different time. Receiving funding as part of a group may also remove some of the landholders’ autonomy in decision-making regarding the drain on their property. One landholder indicated that he would have done the drain differently if he had done it himself.
4.4 Observed Changes in the Site
The theory of drainage suggests that the watertable will be lowered to some degree which will allow cropping to continue in areas that are threatened by rising watertables and salinity, or to reclaim land that is waterlogged and/or salt effected (Cox et al. 2004). Most of the impacts from drainage that landholders in this study have observed are positive and appear to bear this theory out. They report seeing a reduction in salt scalds, trees rejuvenating and land drying out. They have found that the soil is more workable and it drains better. Many have seen improved productivity in the area since the drain was installed, in some cases cropping to the edge of the drain (although reportedly patchy in most areas). This is also similar to findings in Coles et al. (1999) and Chandler and Coles (2004). Some landholders do suggest, however, that the soil drying out may be related to the low rainfall experienced since 2000:
“… may be giving the drain more credit than is due given the recent dry seasons”.
This issue may be important to the perception of the success of drains on some farms. There is anecdotal evidence in some areas of the region that there are similar changes happening on landholder’s properties where deep drainage has not been used. One
29
DRAINAGE BENCHMARKING IN THE NORTHERN AGRICULTURAL REGION – LANDHOLDER SURVEY
landholder recently successfully planted a cereal crop into what was previously a waterlogged and samphire-bluebush dominated site (M. Clarke pers. comm.). The previously discussed decline in the watertable observed in many areas may also be closely associated with this.
Three landholders interviewed reported no impact from their drain whatsoever. A few others reported only mixed success. These drains have been in place for up to six years. They are still experiencing salt scalds, dying vegetation and waterlogging around the area where the drain was installed. Given the expense associated with installing drains, this point illustrates the importance of a good, technical and independent site assessment before the drain is dug.
Many landholders have changed the management of their land since the drain was installed. The main treatment has been to apply gypsum and deep rip the land around the drain. This practice is recommended with the goal of improving soil structure and consequently increasing the potential to leach the salt from the profile (Bell and Mann 2004). It was found during field examinations of the soil in the vicinity of the drains, particularly on alluvial and flood plain positions, that they were mainly found to be still moderately to extremely saline (Stuart-Street et al. in prep). While the levels of salt in the profile pre-drainage are unknown in most cases, it suggests that there has been either inadequate rainfall to flush the salt from the soil since the drain was installed, or the desalination process takes a very long time. Stuart-Street et al. (in prep) details more fully the results of field examinations.
The long term hopes for the future of the land around the drain was dominated by their wishes that the land would get back to full production and the spread of salinity would be halted. Others had a view that it would be more realistic to expect that some areas will be back into production and other areas will need to have other uses, such as saltbush pastures, and revegetation.
In the meantime, drain maintenance is recommended approximately every 5-7 years (depending on soil type) to ensure its performance remains optimal (Chandler and Coles 2003). This activity, however, has been variable with the landholders interviewed since they installed their drains. This ranges from none at all to sporadic - mainly concentrating on culvert areas - to regular clean outs of the surface water structures near the drain.
4.5 Impacts on the day-to-day operations of the farm
The interviews revealed that many of the landholders felt that the drains adversely impacted on the day-to-day running of the farm, particularly for access to paddocks for vehicles and stock. This is the dominant issue that the farmers would manage differently if able to do their drains again. Dividing paddocks was also an issue for the landholders, although some felt it was a good thing. Many also felt that they had inadequate numbers of crossings which they were gradually changing over time. This outcome is similar to the findings of Chandler and Coles (2003) who found that reduced access to paddocks was the most significant negative impact. Other dislikes that they encountered from landholders were the cost of construction, the maintenance requirements, downstream impacts and loss of livestock in drains.
4.6 Landholder Satisfaction
Most landholders interviewed were satisfied with their drains because they felt that it was achieving much of what they had hoped for – reducing waterlogging, improving productivity and “saving the land”. The improvements that they are seeing in productivity are likely linked to a reduction in waterlogging (McFarlane et al. 1993, Tille et al. 2001). Whether this outcome is from the drain or from reduced rainfall and falling watertable levels, it is difficult to conclude. If the problem was in fact waterlogging to begin with, perhaps the cheaper option
30
DRAINAGE BENCHMARKING IN THE NORTHERN AGRICULTURAL REGION – LANDHOLDER SURVEY
of correctly placed surface water structures, siphons or pumps may have been as effective at solving this issue in some situations. In many cases, however, the drains do not appear to be solving the salt problem as field surveys show that the soil around many drains still displays high to extreme levels of salinity (Stuart-Street et al. in prep).
Other surveys of landholders about their drains found similar results. URS consultants (2006) who surveyed landholders in Dumbleyung found that the majority think their drain has been effective at lowering groundwater levels. Chandler and Coles (2003) found that the majority of landholders they surveyed said that deep drains were beneficial in some if not all situations and led to improvements to land. Coles et al. (1999) had the same response of the general landholder view that drains work.
There was a minority of landholders surveyed who were not satisfied with their drains. They mainly felt that the drains had either just a limited impact or none at all. They also felt that they would not get the return on investment and that included the ongoing maintenance costs. Both URS (2006) and Chandler and Coles (2003) also encountered a minority who were not convinced their drains were effective. Additionally, Lloyd (2003) also found that landholders experience with drains was mixed with a handful reporting the expense being difficult to justify.
When the landholders were asked whether they thought their drains were value for money, the majority thought they were. Again, this is confirmed in other research, including Kingwell and Cook (2007) who found that the majority of landholders with drains believed drainage to have been a profitable investment. Chandler and Coles (2003) also found the majority felt their deep drain had been economically viable. A study by Abrahams et al. (2004) was undertaken in the Northern Agricultural Region using an economic decision tool to assess the financial impact of installing a drain. They found that over a 20 year scenario and with a range of drainage impacts, excavating drains to maintain crop production was unlikely to be economically viable. Despite the finding from this modelling and other studies like it, Kingwell and Cook conclude their work by suggesting that:
“The few science-based economic appraisals of DODs [Deep Open Drains] suggest they often are uneconomical investments. However, because landholders with DODs are the principal sources of information for other landholders considering an investment in DODs, it is likely that additional investment in DODs will occur, whether truly economic or not”. (p 178).
It does appear, however, that landholders are often driven by more than economics when it involves drainage. Many are motivated by the degradation caused by the salinity affecting their farm and their desire to repair it and get the land, or at least part of it, back into production. Pannell and Ewing (2006) underline this by stating that many farmers would like to repair salinised land and continue with traditional agriculture, if that is possible. Lloyd (2003) found that landholders are keen to try anything that may slow, halt or reverse the effects of salinity and many felt drains represent their only ‘useful’ option. One landholder summarised this well by reflecting that:
“… would be better if there was no need for the drain, but it was either putting the drain in or sitting on your hands.”
31
DRAINAGE BENCHMARKING IN THE NORTHERN AGRICULTURAL REGION – LANDHOLDER SURVEY
5. Conclusions
Investing time and money on a detailed site assessment needs to be done to define soil and land suitability and watertable levels and trends prior to installing a drain. If the watertables in the Northern Agricultural Region are currently falling by an average of 10 cm/year, this suggests that the urgency for drainage may be reduced in some areas. Anecdotal evidence appears to bear this out in some locations.
Landholders want face-to-face information about their own particular situation. Market failure has occurred in this because written information - currently the main tool of salinity extension - is considered too broad by the landholders (problems are specific to each farm, as should be solutions). As a consequence, the reliance on neighbours and contractors as primary information sources may actually perpetuate the use of drains as a salinity tool.
Most landholders interviewed feel that their drains had been worthwhile although a few felt their drains had not worked at all. It has been difficult during this project to separate any perceived drain impacts from the impacts of the dry seasons experienced in the region since 2000.
Although most landholders interviewed as part of this project felt that their drains were worthwhile economically, analysis does not back this up. It appears, therefore, that this is not their only driver for drainage.
Research shows that drain performance is specifically relevant to the land on each individual farm, therefore no clear statement about likely success can confidently be made until site assessment is done and the problem has been clearly diagnosed. Drain performance is not universal and they do not work in every situation – it is just one of the tools available to tackle the symptoms. Doing nothing about the problem is one option. When the choice is to do something about managing salinity and waterlogging, other tools such as surface water control structures, siphons or pumps appear to be both poorly understood and under-utilized by landholders.
32
DRAINAGE BENCHMARKING IN THE NORTHERN AGRICULTURAL REGION – LANDHOLDER SURVEY
6. Recommendations
• Encourage landholders to do on-ground assessment of salinity problems and implement appropriate treatments, based on an understanding of the actual problem on site to tailor specific solutions.
• Other tools for managing salinity and waterlogging such as surface water control structures, siphons or pumps need to be better extended to landholders as alternate solutions in appropriate areas.
• Site assessment needs to be done by an independent organization or body using experienced staff, to avoid conflicts on assessment from bias or vested interests.
• Information on watertable levels and trends needs to be incorporated into site assessments. Test pits along the length of the proposed drain route need to be done as a standard.
• Analysis of financial costs and benefits from investing in the drain should be done, bearing in mind that landholders may be draining for reasons other than financial.
• Shires should be encouraged to standardise policy in drainage and culverts on public roads to ensure landholder equity.
33
DRAINAGE BENCHMARKING IN THE NORTHERN AGRICULTURAL REGION – LANDHOLDER SURVEY
7. Appendix 1
Drainage Benchmarking
Questions for Landholder Interviews
Please note: Throughout the questions in this survey, the term drain is defined as a structure for intercepting groundwater.
1. Before you installed the drain, what did the area look like? Do you have any photos of the area before the drain was installed?
2. From the options below can you select which one best describes what the area looked like before the drain was installed?
• Patchy crop or pasture • Barley grass in crop or pasture • Patchy barley grass • Patchy barley grass or iceplant with salt tolerant shrubs and some bare
patches • Salt tolerant shrubs and bare patches • Mainly bare patches • Salt affected remnant vegetation
3. Before the drain was installed how productive (crop/pasture) was the site? How productive was it before salinity/waterlogging was evident, and after?
4. Have you experienced water logging or salinity on other areas of your farm previously? If so, can you please outline what the problem was and how did you treat it?
5a. Did you use any other management options for the area where the drain was installed? (please circle)
Earthworks Trees Perennials
Other (please state)
5b. If you did try other options, did you observe any changes?
6. Do you know what the groundwater table depth was before the drain was installed? If so, how was it measured?
7. Was there some sort of event that encouraged you to install the drain? (please circle)
Climatic event Field day Neighbour was putting in a drain Other (please state)
8a. What made you decide to install the drain? What did you hope to achieve by installing it?
34
DRAINAGE BENCHMARKING IN THE NORTHERN AGRICULTURAL REGION – LANDHOLDER SURVEY
8b. How long did you believe it would take till the drain had the impact you were hoping for?
9. How long did you think about installing a drain before the contractor started digging? (please circle)
6 months 1-2yrs 3-5yrs Other (please state):
10. Was there a delay in installing the drain after you decided to go ahead with it, and if so, can you explain the reasons for the delay?
11. Where did you first go to get assistance and/or advice regarding installing a deep drain? (please circle)
Internet Neighbour Landcare Group Government Contractor Other (please state):
12. Before seeking advice about installing your drain what did you already know about deep drains in terms of there performance? What type of questions did you ask and what did you find out?
13. Apart from completing a notice of intent to drain form (assessment form) what other assessment of the site (if any) did you do before the drain was installed (including financial, agronomic and/or environmental assessments)?
14a. Is this deep drain a part of a larger catchment plan for the control of rising groundwater and salinity? (please circle) Yes/No
14b. If yes, what is the name of the catchment or group?
15a. Were you offered any financial assistance to install the drain? (please circle) Yes/No. If so, where did the assistance come from:
NACC NLP NAP Neighbours Shire Other (please state):
15b. Did financial assistance influence your decision to install the drain? (please circle) Yes/No.
16. Does the drain cross any roads? (please circle) Yes/No. If so, how were they dealt with in the planning stage before the drain was installed (eg did the Shire comment on the plan)?
17. What year did you install the drain?
18. What type of drain did you install and why did you choose that design?
19. Why did you choose the particular alignment where the drain lies?
20a. How long is the drain?
20b. How much did the drain cost per kilometre?
35
DRAINAGE BENCHMARKING IN THE NORTHERN AGRICULTURAL REGION – LANDHOLDER SURVEY
21. What is the name of the contractor that you used to install the drain?
22. Can you describe how the land around the drain looks now that it has been installed?
23. Since installation, have you made any agronomic changes to the paddock(s) where the drain lies?
Fertilizer Herbicide Cropping Rotation Deep Ripping Liming Gypsum Mounding Other (please state)
24. Does this differ from your management of the land prior to the drain’s installation? Please explain.
25. Since the drain has been installed have you noticed a change in the productivity of the land around the drain, and if so, can you describe the changes.
26. If applicable, can you describe how many feet or meters from the drain you are now cropping?
27. Have you noticed any changes in the soil in the affected area since the drain was installed? (e.g. Is it easier or harder to work, wetter or drier etc?)
28a. Do you have a long-term management plan for this site? Do you hope to recover the land and bring it back into production; contain the current extent of salt affected land; or adapt to having salt affected land by altering management techniques, e.g. planting salt tolerant pastures?
28b. What do you think the area around the drain will look like in the future?
29. Have you observed any changes to the outlet area where the drain discharges, or the land surrounding it, since the drain was installed and if so, what are they?
30. Do you know what depth the watertable is at the moment?
31. Have you noticed any changes in vegetation cover? If so, how far away from the drain do you think you have seen a change?
32. Is water flowing in the drain at the moment?
33. Can you describe any changes to the flow rate that you have observed since the drain was installed?
34. How do you maintain the drain? How often?
35. What is the cost of the maintenance per kilometre?
36
DRAINAGE BENCHMARKING IN THE NORTHERN AGRICULTURAL REGION – LANDHOLDER SURVEY
36a. Following drain construction, its appearance can change as some degree of erosion or slumping may occur. What changes in the appearance of your drain have you noticed since it was installed?
36b. Why do you think these changes have occurred (e.g. stock, rainfall, design, soil type etc)?
37a. Have you experienced problems with stock getting into the drain?
37b. Is the drain fenced? If not are you planning on fencing it?
38. Does the location of the drain affect the operation of the farm? (please circle) Yes or No. If yes, how have you over come this?
39. What impact do you think the drain will continue to have in the future?
40. Do you keep rainfall records for your farm? How long have you been keeping them?
41. In your opinion, do you think that the drain has been (a.) effective; (b.) value for money; (c.) effective and value for money; or (d) too early to tell?
42. What do you like most about the drain?
43. What do you like least about the drain?
44. If you were putting this drain in all over again, would you do anything differently?
45. Do you have any questions, or any additional comments that you would like to make?
That brings us to the end of the survey – Thankyou for your time and your contributions
37
DRAINAGE BENCHMARKING IN THE NORTHERN AGRICULTURAL REGION – LANDHOLDER SURVEY
8. References Abrahams, M.J., Speed, R.J. and Peek, C.S. (2004). Profitability of drains to reclaim saline
land is driven by wheat production, 1st National Salinity Engineering Conference, Perth, Western Australia.
Barrett-Lennard, E.G. (2003). The interaction between salinity and waterlogging in higher plants: causes, consequences and implications. Plant soil 253, pp35-54.
Bell, R.W. and Mann, S. (2004). Amelioration of salt and waterlogging-affected soils: implications for deep drainage. 1st National Salinity Engineering Conference. Perth, Western Australia
Bennett, D. and George, R. (2008). Integrated farm forestry systems have little impact on salinity – Results of long term monitoring of groundwater levels at 15 sites in SW WA. Proceedings of the 2nd West Australian Natural Resource Management Conference, Bridgetown.
Chandler, K.L. and Coles, N.A. (2003). Review of Deep drains to manage salinity in Western Australia. Department of Agriculture and Food WA miscellaneous publication 2/2004
Coles, N.A., George, R.J., and Bathgate, A.D. (1999). An assessment of the efficacy of deep drains constructed in the wheatbelt of Western Australia. Bulletin 4391, Agriculture WA, Perth
Cox, N., Tetlow, S. and Coles, N. (2005). Deep drains to manage groundwater. Bulletin 4617, Department of Agriculture, Perth.
Ferdowsian R, Ryder A, Kelly J, (1997). Evaluation of deep, open drains in the North Stirling area. Resource Management Technical Report 161. Agriculture WA, Perth.
Hasleby, J. (2007). Is deep drainage a suitable salinity management option on my farm? Farmnote no. 283. Department of Agriculture and Food, Perth.
Hunt. L. and Patterson, G. (2004). Technical Assessment of Natural Resource Management Threats and Options in the Northern Agricultural Region of Western Australia, Resource Management Technical Report 289, Department of Agriculture, Perth.
Kingwell, R. and Cook, S. (2007). Landholder’s attitudes and investment intentions regarding land drainage in a salinising Australian landscape. The International Journal of Interdisciplinary Social Sciences 2 (1) 169-185
Lloyd, S. (2003). Published salinity information and WA landholders and investigation into the effectiveness of current published salinity information. Miscellaneous Publication 6/2003. Department of Agriculture, Perth
McFarlane, D.J., George, R.J. and Farrington, P. (1993). Changes in the Hydrologic Cycle. In: Hobbs, R.J. and Saunders, D.A. (eds), Reintegrating Fragmented Landscapes. CSIRO, Springer-Verlag, New York.
Nulsen, R.A. (1982). Review of current drainage investigations in Western Australia. Resource Management Technical Report 8, Department of Agriculture, Perth.
O’Donnell, R. (2005). Deep Drainage – Is it for me? Workshop Manual for Participants. Miscellaneous Publication 23/2005. Department of Agriculture, Perth.
Pannell, D.J. and Ewing, M.A. (2006). Managing secondary dryland salinity: Options and challenges. Agricultural Water Management 80 (2006) 41-56, Elsevier.
38
DRAINAGE BENCHMARKING IN THE NORTHERN AGRICULTURAL REGION – LANDHOLDER SURVEY
39
Speed, R. and Kendle, A. (2008). Groundwater declines in response to a drier climate in the Northern Agricultural Region of Western Australia. Conference proceedings for 2nd International Salinity Forum, Adelaide.
Stuart-Street, A., Beattie, A., Whale, P. and Speed, R. (in prep). Drainage Benchmarking in the Northern Agricultural Region – Field Survey Results. Resource Management Technical Report, Department of Agriculture and Food, Perth.
Tille, P.J., Mathwin, T.W. and George, R.J. (2001). The South-West Hydrological Information Package. Bulletin No. 4488. Department of Agriculture, Perth.
URS Sustainable Development, ( 2006). Community views about salinity management for the Dumbleyung Zone. URS Australia Pty Ltd. East Perth
Wadsworth, Y. (1997). Do it Yourself Social Research. Second Edition. Allen & Unwin, Sydney.
Yandle, G.F. (2004). Evaluation and design of deep open dryland drainage in the Western Australian wheatbelt. Proceedings of the 1st National Salinity Engineering Conference, Perth WA