Drastic variation in the surface boundary layer parameters over Cochin during the annular solar eclipse: Analysis using sonic anemometer data P.R. Jayakrishnan n , C.A. Babu, P. Sivaprasad Department of Atmospheric Sciences, Cochin University of Science and Technology, Cochin682 016, India article info Article history: Received 13 May 2012 Received in revised form 11 December 2012 Accepted 23 December 2012 Available online 14 January 2013 Keywords: Annular solar eclipse Surface boundary layer Sonic anemometer abstract Atmospheric surface boundary layer parameters vary anomalously in response to the occurrence of annular solar eclipse on 15th January 2010 over Cochin. It was the longest annular solar eclipse occurred over South India with high intensity. As it occurred during the noon hours, it is considered to be much more significant because of its effects in all the regions of atmosphere including ionosphere. Since the insolation is the main driving factor responsible for the anomalous changes occurred in the surface layer due to annular solar eclipse, occurred on 15th January 2010, that played very important role in understanding dynamics of the atmosphere during the eclipse period because of its coincidence with the noon time. The Sonic anemometer is able to give data of zonal, meridional and vertical wind as well as the air temperature at a temporal resolution of 1 s. Different surface boundary layer parameters and turbulent fluxes were computed by the application of eddy correlation technique using the high resolution station data. The surface boundary layer parameters that are computed using the sonic anemometer data during the period are momentum flux, sensible heat flux, turbulent kinetic energy, frictional velocity (u * ), variance of temperature, variances of u, v and w wind. In order to compare the results, a control run has been done using the data of previous day as well as next day. It is noted that over the specified time period of annular solar eclipse, all the above stated surface boundary layer parameters vary anomalously when compared with the control run. From the observations we could note that momentum flux was 0.1 Nm 2 instead of the mean value 0.2 Nm -2 when there was eclipse. Sensible heat flux anomalously decreases to 50 Nm 2 instead of the mean value 200 Nm 2 at the time of solar eclipse. The turbulent kinetic energy decreases to 0.2 m 2 s 2 from the mean value 1 m 2 s 2 . The frictional velocity value decreases to 0.05 ms 1 instead of the mean value 0.2 ms 1 . The present study aimed at understanding the dynamics of surface layer in response to the annular solar eclipse over a tropical coastal station, occurred during the noon hours. Key words: annular solar eclipse, surface boundary layer, sonic anemometer & 2013 Elsevier Ltd. All rights reserved. 1. Introduction Solar eclipse is a celestial phenomenon in which the moon passes between the Sun and Earth, and then it makes a shadow on the Earth, which can be viewed as a blocking of sunlight partially or fully. When the Sun is fully covered by the Moon it is known as total solar eclipse and when it is partially covered it is known as partial solar eclipse. It could occur at any time of the day. During the day time, due to the solar heating the Earth’s surface gets heated up and thermals begin to rise. There is a regular diurnal variation for every surface atmospheric boundary layer (ABL) parameters. The maximum air temperature is noted at a time of about 14.00 IST over the tropical stations. Corresponding to this maximum in temperature most of the surface ABL parameters are found to be maximum during the time. The total solar eclipse is a situation in which there is a blocking of solar radiation for a small interval of time. So the changes that occur for surface ABL is purely a micro meteorological phenomenon since the process has the time scale of the order of a few hours (Stull ,1988). It is very interesting to note how these surface boundary layer parameters vary in response to the celestial phenomenon such as solar eclipse. Several studies were carried out over different parts of India to quantify the changes in the surface atmospheric boundary layer in response to the total annular solar eclipse of 15th January 2010. Venkat Ratnam et al. (2010) analyzed the changes in lower atmospheric boundary layer over the site Gadanki using a set of Contents lists available at SciVerse ScienceDirect journal homepage: www.elsevier.com/locate/jastp Journal of Atmospheric and Solar-Terrestrial Physics 1364-6826/$ - see front matter & 2013 Elsevier Ltd. All rights reserved. http://dx.doi.org/10.1016/j.jastp.2012.12.019 n Corresponding author. Tel.: þ91 9496026547; fax: þ91 484 2353662. E-mail addresses: [email protected], [email protected](P.R. Jayakrishnan). Journal of Atmospheric and Solar-Terrestrial Physics 94 (2013) 49–53
Transcript
Journal of Atmospheric and Solar-Terrestrial Physics 94 (2013) 49–53
Contents lists available at SciVerse ScienceDirect
Journal of Atmospheric and Solar-Terrestrial Physics
1364-68
http://d
n Corr
E-m
(P.R. Ja
journal homepage: www.elsevier.com/locate/jastp
Drastic variation in the surface boundary layer parameters overCochin during the annular solar eclipse: Analysis using sonicanemometer data
P.R. Jayakrishnan n, C.A. Babu, P. Sivaprasad
Department of Atmospheric Sciences, Cochin University of Science and Technology, Cochin682 016, India
a r t i c l e i n f o
Article history:
Received 13 May 2012
Received in revised form
11 December 2012
Accepted 23 December 2012Available online 14 January 2013
Atmospheric surface boundary layer parameters vary anomalously in response to the occurrence of
annular solar eclipse on 15th January 2010 over Cochin. It was the longest annular solar eclipse
occurred over South India with high intensity. As it occurred during the noon hours, it is considered to
be much more significant because of its effects in all the regions of atmosphere including ionosphere.
Since the insolation is the main driving factor responsible for the anomalous changes occurred in the
surface layer due to annular solar eclipse, occurred on 15th January 2010, that played very important
role in understanding dynamics of the atmosphere during the eclipse period because of its coincidence
with the noon time. The Sonic anemometer is able to give data of zonal, meridional and vertical wind as
well as the air temperature at a temporal resolution of 1 s. Different surface boundary layer parameters
and turbulent fluxes were computed by the application of eddy correlation technique using the high
resolution station data. The surface boundary layer parameters that are computed using the sonic
anemometer data during the period are momentum flux, sensible heat flux, turbulent kinetic energy,
frictional velocity (u*), variance of temperature, variances of u, v and w wind. In order to compare the
results, a control run has been done using the data of previous day as well as next day. It is noted that
over the specified time period of annular solar eclipse, all the above stated surface boundary layer
parameters vary anomalously when compared with the control run. From the observations we could
note that momentum flux was 0.1 Nm�2 instead of the mean value 0.2 Nm-2 when there was eclipse.
Sensible heat flux anomalously decreases to 50 Nm�2 instead of the mean value 200 Nm�2 at the time
of solar eclipse. The turbulent kinetic energy decreases to 0.2 m2s�2 from the mean value 1 m2s�2. The
frictional velocity value decreases to 0.05 ms�1 instead of the mean value 0.2 ms�1. The present study
aimed at understanding the dynamics of surface layer in response to the annular solar eclipse over a
tropical coastal station, occurred during the noon hours. Key words: annular solar eclipse, surface
boundary layer, sonic anemometer
& 2013 Elsevier Ltd. All rights reserved.
1. Introduction
Solar eclipse is a celestial phenomenon in which the moonpasses between the Sun and Earth, and then it makes a shadow onthe Earth, which can be viewed as a blocking of sunlight partiallyor fully. When the Sun is fully covered by the Moon it is known astotal solar eclipse and when it is partially covered it is known aspartial solar eclipse. It could occur at any time of the day. Duringthe day time, due to the solar heating the Earth’s surface getsheated up and thermals begin to rise. There is a regular diurnalvariation for every surface atmospheric boundary layer (ABL)
parameters. The maximum air temperature is noted at a time ofabout 14.00 IST over the tropical stations. Corresponding to thismaximum in temperature most of the surface ABL parameters arefound to be maximum during the time. The total solar eclipse is asituation in which there is a blocking of solar radiation for a smallinterval of time. So the changes that occur for surface ABL ispurely a micro meteorological phenomenon since the process hasthe time scale of the order of a few hours (Stull ,1988). It is veryinteresting to note how these surface boundary layer parametersvary in response to the celestial phenomenon such as solareclipse.
Several studies were carried out over different parts of India toquantify the changes in the surface atmospheric boundary layerin response to the total annular solar eclipse of 15th January 2010.Venkat Ratnam et al. (2010) analyzed the changes in loweratmospheric boundary layer over the site Gadanki using a set of
P.R. Jayakrishnan et al. / Journal of Atmospheric and Solar-Terrestrial Physics 94 (2013) 49–5350
instruments including automatic weather station, Doppler SODARand GPS sonde. They found that the effect of soil temperature isseen clearly up to 20 cm depth and at all the levels up to 15 m.They could obtain strong eclipse induced variations in meteor-ological parameters of the surface layer over Gadanki.Subrahamanyam et al. (2010) studied the impact of 15th January2010 solar eclipse over Thumba, a south Indian coastal station.They investigated the variations in surface ABL using AWS, sonicanemometer and GPS radiosonde. Associated with the decrease inradiation intensity, they could obtain significant changes inboundary layer parameters as well as thermodynamic para-meters. Bala Subrahamanyam and Anurose (2011) analyzed theimpacts on sea/land breeze circulation characteristics overThumba in response to the annular eclipse of January 15, 2010.They observed that the vertical thickness of the sea breeze cellwas confined to 300 m on the eclipse day whereas it wasextending to about 610 m on the control run day.Muraleedharan et al. (2011) also studied the impact of annularsolar eclipse on the meteorological parameters over Goa. Theyobserved a strong inversion at 13 km and an abnormal warmingin the upper troposphere noticed on the eclipse day.
The Space physics Laboratory (SPL), Thiruvananthapuramcarried out extensive and collocated experiments over differentregions of the atmosphere in the field experiment named ‘Surya-grahan-2010’, which was organized by Vikram Sarabhai SpaceCentre (VSSC). The outcome of the field campaign has beenpublished as proceedings of the National Workshop: Results onSolar Eclipse (NaWRoSE, 2011). It discusses the effects of annularsolar eclipse over different regions of the atmosphere such asboundary layer, troposphere, stratosphere and ionosphere.
The solar eclipse induced variations have been extensivelyanalyzed over different parts of the globe by several researchers(Sethu Raman, 1982; Aplin and Harrison, 2003; Foken et al., 2001;Sethu raman et al., 1990; Altadilla et al., 2001; Afraimovich et al.,2002; Founda et al., 2007; Stoev et al., 2008). They reported thatthe boundary layer responded to the eclipse induced changes insurface layer rapidly. The variations are found to be in associationwith the sharp drop in the direct solar radiation. In this study weinvestigate the micro meteorological variations of surface layerparameters during the occurrence of the annular solar eclipse of15th January 2010, over the coastal station Cochin (10102’41’’ N,76119’34’’ E, 38 m ASL).
2. Data and methodology
The sonic anemometer USA-1 (make: METEK, GmbH,Germany) was installed at Kalamassery (1010204100 N, 7611903400
E, 38 m ASL) in Cochin University campus in January, 2008.It provides zonal, meridional and vertical components of windas well as air temperature at a temporal resolution of one second.With the availability of this fast response instrument installed at aheight of 7 m above ground level we are able to get continuousobservation of wind and temperature at the station. The raw datasets were archived after quality check. The different statisticalparameters and surface boundary layer parameters as well assurface fluxes were computed using the eddy correlation methodas described in Arya (2001). The parameters investigated in thisstudy are momentum flux, sensible heat flux, turbulent kineticenergy, frictional velocity, and variance of u, v, w, t.
Using the Eddy correlation method different parameters arecomputed using the following formulae:
MomentumFlux¼ run2 ðN m�2Þ ð1Þ
SensibleHeatFlux¼�rCpunyn ðW m�2Þ ð2Þ
where frictional velocity un ¼ ðu0w02þv0w02Þ1=4
ð3Þ
yn ¼�w0y0=un ð4Þ
Turbulent kinetic energy ðTKEÞ ¼ 1=2ðu02þv02þw02Þðm2 s�2Þ ð5Þ
where r is the air density which is taken as 1.2 kg m�3, Cp is thespecific heat capacity of dry air at constant pressure which can betaken as 1004 J K�1 kg�1, u0, v0 and w0 are the fluctuations of windcomponents from the mean, as described in Stull (1988).
The different variances can be computed as
Variance u¼ u2ð6Þ
Variance v¼ v2ð7Þ
Variance w¼w2ð8Þ
Variance t¼ t2
ð9Þ
For the computation of fluxes and statistical parameters theaveraging time taken is 10 min, since it is suitable for the eddycorrelation method (Stull, 1988).
2.1. Details of annular solar eclipse of 15th January 2010
Annular solar eclipse took place over India on 15th January2010. The eclipse had a magnitude of 0.9190 and it was thelongest solar eclipse with a duration of about 11 min and 7.8 s.The other peculiarity of the eclipse is that its peak period was inthe noon hours, when we receive maximum insolation from thesun. The time of the occurrence of the eclipse is from 11.25 AM to15.15 PM IST. This solar eclipse was also visible in Singapore,Dubai, Qatar, Bahrain, Kuwait, Oman, Pakistan, Sri Lanka, Malay-sia, Africa, Europe, and parts of China. In India, the path of eclipsewas through Palk straight among South Kerala, South Tamil Naduand North Sri Lanka.
3. Results and discussions
In this paper we present the anomalous variation of differentsurface boundary layer parameters over the coastal station,Cochin in association with the occurrence of annular solar eclipse.The parameters studied are momentum flux, sensible heat flux,frictional velocity, turbulent kinetic energy and variances of u, v,w, t. For the sake of comparison, a control run was made for all theparameters in the days before and after the solar eclipse day. Thecontrol run days were taken as 14th January 2010, which wasthe day prior to solar eclipse and 16th January 2010, whichwas the day after solar eclipse over Cochin. In the discussionpart, the figure of the control run for 16th January 2010 was takeninto consideration for comparison. The variation of surfaceboundary layer parameters associated with the annular solareclipse is summarized below.
Fig. 1 gives the diurnal variation of momentum flux and sensibleheat flux on the control run day, 16th January 2010 as well as on theannular eclipse day. On the eclipse day ie. on 15th January 2010, themomentum flux shows anomalous decrease in the noon hours. Itdecreases up to 0.01 Nm�2 at the time 14:00 IST (Fig. 1(a)). Thisanomalous decrease is attributed to the occurrence of annular solareclipse. Due to the solar radiation cut off for a short period,boundary layer wind and temperature vary in a micro scale of theorder of a few hours. So this is typically a micro meteorologicalphenomenon. Fig. 1(b) shows the diurnal variation of momentumflux on the control run day, 16th January 2010. In response to theevolution of convective boundary layer, momentum flux also showsa diurnal maximum and minimum. The maximum flux of 0.4 Nm�2
Fig. 1. Diurnal variation of surface boundary layer parameters on the annular
eclipse day as well as on the control run day (a) Momentum Flux on eclipse day
(b) Momentum flux on control run day (c) Sensible heat flux on eclipse day and
(d) Sensible heat flux on control run day. The portions inside the dotted lines
indicate the time period of solar eclipse.
Fig. 2. Diurnal variation of surface ABL parameters on eclipse day as well as the
control run day (a) Turbulent Kinetic Energy on eclipse day (b) Turbulent kinetic
energy on control run day (c) Frictional velocity on eclipse day and (d) Frictional
velocity on control run day. The portions inside the dotted lines indicate the time
period of solar eclipse.
P.R. Jayakrishnan et al. / Journal of Atmospheric and Solar-Terrestrial Physics 94 (2013) 49–53 51
occurred at 16:00 IST. Mitsuta (1958) presented the results of directmeasurements of momentum flux in the surface ABL using sonicanemometer. In his experiment at a height of 2 m level he couldobtain a momentum flux value of 0.53 Nm�2, which agrees with theflux value in our analysis. Chehbouni et al. (2000) obtained amomentum flux value of 0.6 Nm�2 over a grassland patch usingscintillometer based and eddy correlation based experiments thatalso agree with our observations. In the study reported by BalaSubrahamanyam et al. (2011), the impact of annular solar eclipse onthe boundary layer over Thumba is discussed. They could observesignificant reduction in momentum flux from 0.4 Nm�2 on thecontrol run day to 0.05 Nm�2 on the solar eclipse day. This agreeswith our observations.
Fig. 1(d) gives the diurnal variation of sensible heat flux on thecontrol run day 16th January 2010. The sensible heat flux has amaximum value of 300 Wm2 during the noon hours at the time15:00 IST. On the solar eclipse day from Fig. 1(c), the sensible heatflux decreases anomalously in the noon hours with minimumvalue of �10 Wm�2 at the time 14:00 IST. This anomalousdecrease is attributed to the annular solar eclipse occurred inthe noon hours. In the next control run day i.e 16th January(figure not attached), we could observe normal sensible heat fluxvalues in the noon hours with value 400 Wm�2. Chehbouni et al.(2000) got a sensible heat flux value of 300 Wm�2 based on theeddy correlation method which agrees with the observations wegot on the control run day. Bala Subrahamanyam et al. (2011)observed a reduction of sensible heat from 300 Wm�2 to 20Wm�2 during the annular solar eclipse period. This also agreeswell with our observations. Krishnan et al. (2004) obtained thevalue of sensible heat flux as �10 Wm�2 during the occurrenceof solar eclipse of 11th August 1999 over a semi arid regionAhammadabad.
Diurnal variation of turbulent kinetic energy on the control runday 16th January is shown in Fig. 2(b). Associated with theconvective boundary layer growth, T.K.E also increases andbecomes a maximum in the noon hours. The maximum value is1 m2s�2 at about 15:00 IST. On the day of solar eclipse, betweentime 11:30 to 15:00 IST the T.K.E sharply decreases to very lowvalue of about 0.1 m2s�2 and approaches zero (Fig. 2(a)). Thissharp decrease is due to the suppression of turbulence due to thecut off radiation in the noon hours and this is in response to the
annular solar eclipse. In the analysis by Krishnan et al. (2004) theobtained T.K.E during solar eclipse was 0.2 m2s�2 and this agreeswell with our results. Rajeev et al. (2011) estimated the reductionin T.K.E during the eclipse period as 0.025 m2s�2, while frictionalvelocity decreased to as low as 0.05 ms�1, which are attributed tothe decrease in turbulence fluctuations of wind componentsduring solar eclipse.
The diurnal variation of frictional velocity on the control runday (16th January 2010) is given in Fig. 2(d). As evidenced fromthe figure, during the noon hours maximum variation for un takesplace and it has a maximum value of 0.5 ms�1 at the time 15:00IST in response to the convection. But on the solar eclipse day, un
decreases and reaches a minimum of 0.1 ms�1 at the time 13:00IST, due to the influence of annular solar eclipse (Fig. 2 (c)). Afterthe solar eclipse it recovers to normal values. On the control runday 14th January 2010, un again shows normal diurnal behaviorwith maximum value 0.5 ms�1 (figure not attached). In the workby Krishnan et al. (2004), they got a frictional velocity of 0.3 ms�1
and it is found to decrease to 0.05 ms�1 during the eclipse period.Namboodiri et al. (2011) observed a reduction of frictionalvelocity value from 0.3 ms�1 to 0.1 ms�1 which agrees with ourobservation. Also Rajeev et al. (2011) estimated the frictionalvelocity using sonic anemometer during annular solar eclipsefound to be 0.05 ms�1 from 0.3 ms�1. These previous studieswere compared with our results and obtained good matching ofthe observations.
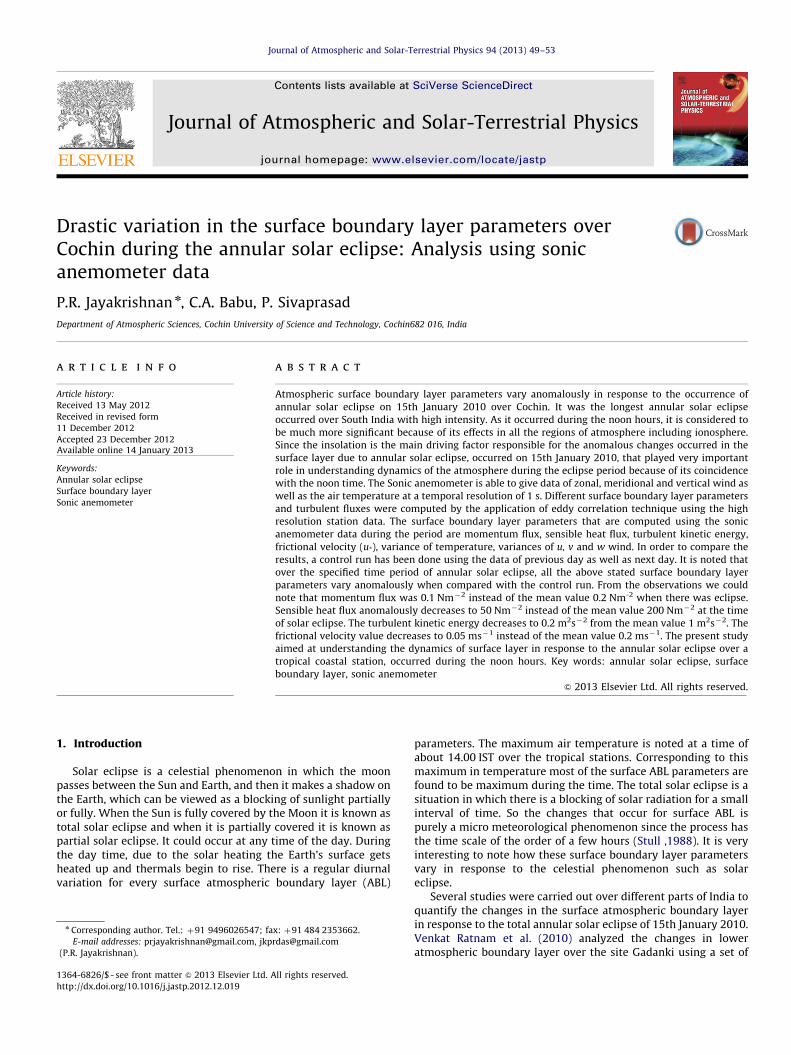
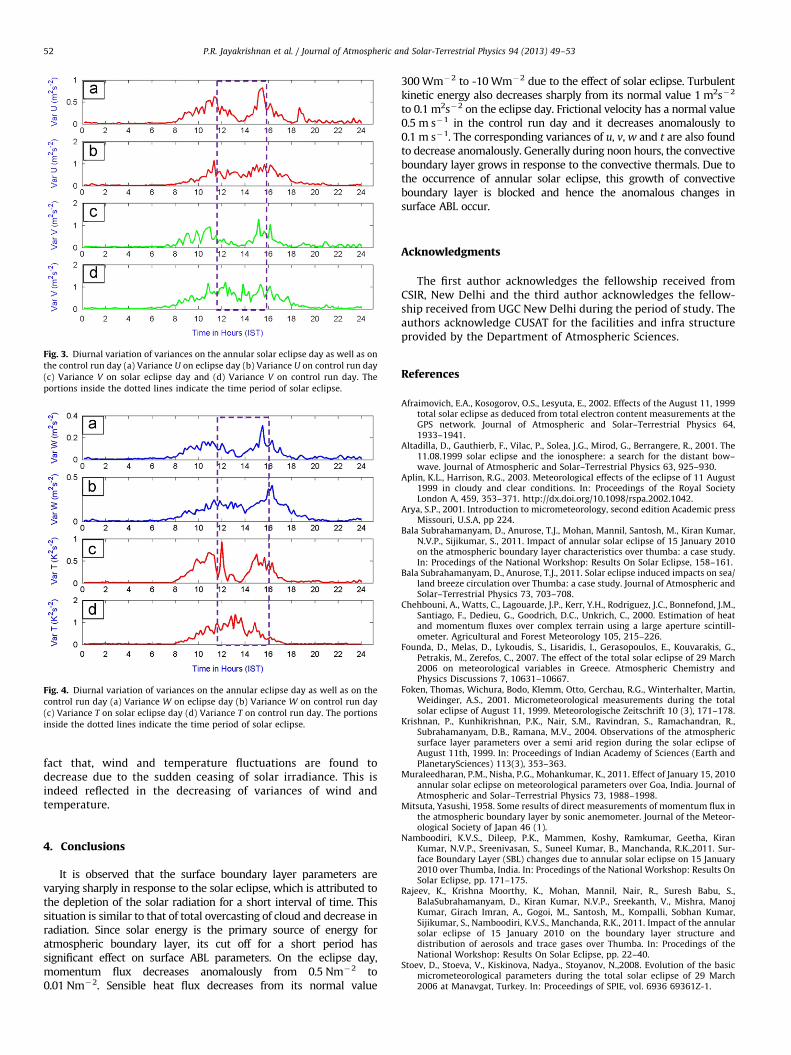
The variances u, v, w and t are shown in the Figs. 3 and 4 on thecontrol run day 16th January 2010 as well as on the annular solareclipse day. As evident from the figure, maximum value for all thevariances occur in the noon hours corresponding to time 17: 00IST. The variances in u and v have maximum value 1 m2 s�2 at thetime 17:00 IST, variance w has maximum value of 0.5 m2s�2 atthe time 15:00 IST and variance t shows maximum value of0.8 m2s�2 at the time 15:00 IST on the control run day 16thJanuary. Corresponding to the annular solar eclipse, there is sharpdecrease of variances as evidenced by the figure. Variances u andv show minimum value of about 0.1 m2s�2 at the time 14:00 ISTdue to the solar eclipse. Variance w has minimum value of0.1 m2s�2 at the time 14:00 IST and variance t decreases to value0.1 K2 s�2 at the time 14:00 IST in response to the solar eclipse.The statistical parameters such as variances decrease due to the
Fig. 3. Diurnal variation of variances on the annular solar eclipse day as well as on
the control run day (a) Variance U on eclipse day (b) Variance U on control run day
(c) Variance V on solar eclipse day and (d) Variance V on control run day. The
portions inside the dotted lines indicate the time period of solar eclipse.
Fig. 4. Diurnal variation of variances on the annular eclipse day as well as on the
control run day (a) Variance W on eclipse day (b) Variance W on control run day
(c) Variance T on solar eclipse day (d) Variance T on control run day. The portions
inside the dotted lines indicate the time period of solar eclipse.
P.R. Jayakrishnan et al. / Journal of Atmospheric and Solar-Terrestrial Physics 94 (2013) 49–5352
fact that, wind and temperature fluctuations are found todecrease due to the sudden ceasing of solar irradiance. This isindeed reflected in the decreasing of variances of wind andtemperature.
4. Conclusions
It is observed that the surface boundary layer parameters arevarying sharply in response to the solar eclipse, which is attributed tothe depletion of the solar radiation for a short interval of time. Thissituation is similar to that of total overcasting of cloud and decrease inradiation. Since solar energy is the primary source of energy foratmospheric boundary layer, its cut off for a short period hassignificant effect on surface ABL parameters. On the eclipse day,momentum flux decreases anomalously from 0.5 Nm�2 to0.01 Nm�2. Sensible heat flux decreases from its normal value
300 Wm�2 to -10 Wm�2 due to the effect of solar eclipse. Turbulentkinetic energy also decreases sharply from its normal value 1 m2s�2
to 0.1 m2s�2 on the eclipse day. Frictional velocity has a normal value0.5 m s�1 in the control run day and it decreases anomalously to0.1 m s�1. The corresponding variances of u, v, w and t are also foundto decrease anomalously. Generally during noon hours, the convectiveboundary layer grows in response to the convective thermals. Due tothe occurrence of annular solar eclipse, this growth of convectiveboundary layer is blocked and hence the anomalous changes insurface ABL occur.
Acknowledgments
The first author acknowledges the fellowship received fromCSIR, New Delhi and the third author acknowledges the fellow-ship received from UGC New Delhi during the period of study. Theauthors acknowledge CUSAT for the facilities and infra structureprovided by the Department of Atmospheric Sciences.
References
Afraimovich, E.A., Kosogorov, O.S., Lesyuta, E., 2002. Effects of the August 11, 1999total solar eclipse as deduced from total electron content measurements at theGPS network. Journal of Atmospheric and Solar–Terrestrial Physics 64,1933–1941.
Altadilla, D., Gauthierb, F., Vilac, P., Solea, J.G., Mirod, G., Berrangere, R., 2001. The11.08.1999 solar eclipse and the ionosphere: a search for the distant bow–wave. Journal of Atmospheric and Solar–Terrestrial Physics 63, 925–930.
Aplin, K.L., Harrison, R.G., 2003. Meteorological effects of the eclipse of 11 August1999 in cloudy and clear conditions. In: Proceedings of the Royal SocietyLondon A, 459, 353–371. http://dx.doi.org/10.1098/rspa.2002.1042.
Arya, S.P., 2001. Introduction to micrometeorology, second edition Academic pressMissouri, U.S.A, pp 224.
Bala Subrahamanyam, D., Anurose, T.J., Mohan, Mannil, Santosh, M., Kiran Kumar,N.V.P., Sijikumar, S., 2011. Impact of annular solar eclipse of 15 January 2010on the atmospheric boundary layer characteristics over thumba: a case study.In: Procedings of the National Workshop: Results On Solar Eclipse, 158–161.
Bala Subrahamanyam, D., Anurose, T.J., 2011. Solar eclipse induced impacts on sea/land breeze circulation over Thumba: a case study. Journal of Atmospheric andSolar–Terrestrial Physics 73, 703–708.
Chehbouni, A., Watts, C., Lagouarde, J.P., Kerr, Y.H., Rodriguez, J.C., Bonnefond, J.M.,Santiago, F., Dedieu, G., Goodrich, D.C., Unkrich, C., 2000. Estimation of heatand momentum fluxes over complex terrain using a large aperture scintill-ometer. Agricultural and Forest Meteorology 105, 215–226.
Founda, D., Melas, D., Lykoudis, S., Lisaridis, I., Gerasopoulos, E., Kouvarakis, G.,Petrakis, M., Zerefos, C., 2007. The effect of the total solar eclipse of 29 March2006 on meteorological variables in Greece. Atmospheric Chemistry andPhysics Discussions 7, 10631–10667.
Foken, Thomas, Wichura, Bodo, Klemm, Otto, Gerchau, R.G., Winterhalter, Martin,Weidinger, A.S., 2001. Micrometeorological measurements during the totalsolar eclipse of August 11, 1999. Meteorologische Zeitschrift 10 (3), 171–178.
Krishnan, P., Kunhikrishnan, P.K., Nair, S.M., Ravindran, S., Ramachandran, R.,Subrahamanyam, D.B., Ramana, M.V., 2004. Observations of the atmosphericsurface layer parameters over a semi arid region during the solar eclipse ofAugust 11th, 1999. In: Proceedings of Indian Academy of Sciences (Earth andPlanetarySciences) 113(3), 353–363.
Muraleedharan, P.M., Nisha, P.G., Mohankumar, K., 2011. Effect of January 15, 2010annular solar eclipse on meteorological parameters over Goa, India. Journal ofAtmospheric and Solar–Terrestrial Physics 73, 1988–1998.
Mitsuta, Yasushi, 1958. Some results of direct measurements of momentum flux inthe atmospheric boundary layer by sonic anemometer. Journal of the Meteor-ological Society of Japan 46 (1).
Namboodiri, K.V.S., Dileep, P.K., Mammen, Koshy, Ramkumar, Geetha, KiranKumar, N.V.P., Sreenivasan, S., Suneel Kumar, B., Manchanda, R.K.,2011. Sur-face Boundary Layer (SBL) changes due to annular solar eclipse on 15 January2010 over Thumba, India. In: Procedings of the National Workshop: Results OnSolar Eclipse, pp. 171–175.
Rajeev, K., Krishna Moorthy, K., Mohan, Mannil, Nair, R., Suresh Babu, S.,BalaSubrahamanyam, D., Kiran Kumar, N.V.P., Sreekanth, V., Mishra, ManojKumar, Girach Imran, A., Gogoi, M., Santosh, M., Kompalli, Sobhan Kumar,Sijikumar, S., Namboodiri, K.V.S., Manchanda, R.K., 2011. Impact of the annularsolar eclipse of 15 January 2010 on the boundary layer structure anddistribution of aerosols and trace gases over Thumba. In: Procedings of theNational Workshop: Results On Solar Eclipse, pp. 22–40.
Stoev, D., Stoeva, V., Kiskinova, Nadya., Stoyanov, N.,2008. Evolution of the basicmicrometeorological parameters during the total solar eclipse of 29 March2006 at Manavgat, Turkey. In: Proceedings of SPIE, vol. 6936 69361Z-1.
P.R. Jayakrishnan et al. / Journal of Atmospheric and Solar-Terrestrial Physics 94 (2013) 49–53 53
Sethu Raman, S., 1982. Dynamics of the atmospheric boundary layer during the1980 total solar eclipse.In: Proceedings of Indian National Science Academy,48, A, Supplement No.3, pp. 187–195.
Sethu raman, S., Boone, Philip, Shankar Rao, K., 1990. Observations and numericalsimulation of the evolution of the tropical planetary boundary layer during
total solar eclipses. Atmospheric Environment 24A (4), 789–799.Stull, R.B., 1988. An Introduction to Boundary Layer Meteorology, 17. Kluwer
Academic Publishers, Netherlands 666 pp.
Subrahamanyam, D.B., Anurose, T.J., Mohan, M., Santosh, M., Kumar, N.V.P.K.,Sijikumar, S., (2010) Impact of Annular Solar Eclipse of 15 January 2010 on theAtmospheric Boundary Layer Characteristics over Thumba: A Case Study.Boundary Layer Meteorology, Communicated.
Venkat Ratnam, M., ShravanKumar, M., Basha, G., Anandan, V.K., Jayaraman, A.,2010. Efect of the annular solar eclipse of 15 January 2010 on the loweratmospheric boundary layer over a tropical rural station. Journal of Atmo-spheric and Solar–Terrestrial Physics, 271–278, http://dx.doi.org/10.1016/j.jastp.2010.10.009.