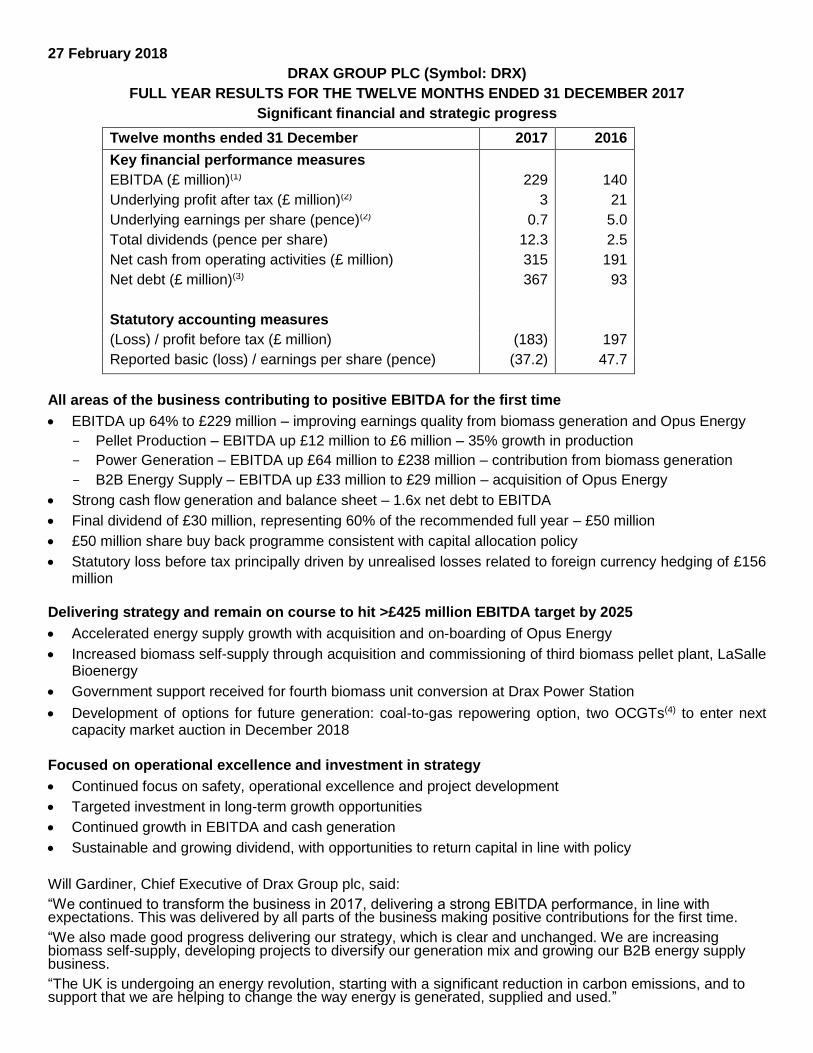
27 February 2018 DRAX GROUP PLC (Symbol: DRX) FULL YEAR RESULTS FOR THE TWELVE MONTHS ENDED 31 DECEMBER 2017 Significant financial and strategic progress Twelve months ended 31 December 2017 2016 Key financial performance measures EBITDA (£ million) (1) 229 140 Underlying profit after tax (£ million) (2) 3 21 Underlying earnings per share (pence) (2) 0.7 5.0 Total dividends (pence per share) 12.3 2.5 Net cash from operating activities (£ million) 315 191 Net debt (£ million) (3) 367 93 Statutory accounting measures (Loss) / profit before tax (£ million) (183) 197 Reported basic (loss) / earnings per share (pence) (37.2) 47.7 All areas of the business contributing to positive EBITDA for the first time • EBITDA up 64% to £229 million – improving earnings quality from biomass generation and Opus Energy - Pellet Production – EBITDA up £12 million to £6 million – 35% growth in production - Power Generation – EBITDA up £64 million to £238 million – contribution from biomass generation - B2B Energy Supply – EBITDA up £33 million to £29 million – acquisition of Opus Energy • Strong cash flow generation and balance sheet – 1.6x net debt to EBITDA • Final dividend of £30 million, representing 60% of the recommended full year – £50 million • £50 million share buy back programme consistent with capital allocation policy • Statutory loss before tax principally driven by unrealised losses related to foreign currency hedging of £156 million Delivering strategy and remain on course to hit >£425 million EBITDA target by 2025 • Accelerated energy supply growth with acquisition and on-boarding of Opus Energy • Increased biomass self-supply through acquisition and commissioning of third biomass pellet plant, LaSalle Bioenergy • Government support received for fourth biomass unit conversion at Drax Power Station • Development of options for future generation: coal-to-gas repowering option, two OCGTs (4) to enter next capacity market auction in December 2018 Focused on operational excellence and investment in strategy • Continued focus on safety, operational excellence and project development • Targeted investment in long-term growth opportunities • Continued growth in EBITDA and cash generation • Sustainable and growing dividend, with opportunities to return capital in line with policy Will Gardiner, Chief Executive of Drax Group plc, said: “We continued to transform the business in 2017, delivering a strong EBITDA performance, in line with expectations. This was delivered by all parts of the business making positive contributions for the first time. “We also made good progress delivering our strategy, which is clear and unchanged. We are increasing biomass self-supply, developing projects to diversify our generation mix and growing our B2B energy supply business. “The UK is undergoing an energy revolution, starting with a significant reduction in carbon emissions, and to support that we are helping to change the way energy is generated, supplied and used. ”
Transcript
27 February 2018
DRAX GROUP PLC (Symbol: DRX)
FULL YEAR RESULTS FOR THE TWELVE MONTHS ENDED 31 DECEMBER 2017
Significant financial and strategic progress
Twelve months ended 31 December 2017 2016
Key financial performance measures
EBITDA (£ million)(1) 229 140
Underlying profit after tax (£ million)(2) 3 21
Underlying earnings per share (pence)(2) 0.7 5.0
Total dividends (pence per share) 12.3 2.5
Net cash from operating activities (£ million) 315 191
Net debt (£ million)(3) 367 93
Statutory accounting measures
(Loss) / profit before tax (£ million) (183) 197
Reported basic (loss) / earnings per share (pence) (37.2) 47.7
All areas of the business contributing to positive EBITDA for the first time
• EBITDA up 64% to £229 million – improving earnings quality from biomass generation and Opus Energy
Pellet Production – EBITDA up £12 million to £6 million – 35% growth in production
Power Generation – EBITDA up £64 million to £238 million – contribution from biomass generation
B2B Energy Supply – EBITDA up £33 million to £29 million – acquisition of Opus Energy
• Strong cash flow generation and balance sheet – 1.6x net debt to EBITDA
• Final dividend of £30 million, representing 60% of the recommended full year – £50 million
• £50 million share buy back programme consistent with capital allocation policy
• Statutory loss before tax principally driven by unrealised losses related to foreign currency hedging of £156 million
Delivering strategy and remain on course to hit >£425 million EBITDA target by 2025
• Accelerated energy supply growth with acquisition and on-boarding of Opus Energy
• Increased biomass self-supply through acquisition and commissioning of third biomass pellet plant, LaSalle Bioenergy
• Government support received for fourth biomass unit conversion at Drax Power Station
• Development of options for future generation: coal-to-gas repowering option, two OCGTs(4) to enter next capacity market auction in December 2018
Focused on operational excellence and investment in strategy
• Continued focus on safety, operational excellence and project development
• Targeted investment in long-term growth opportunities
• Continued growth in EBITDA and cash generation
• Sustainable and growing dividend, with opportunities to return capital in line with policy
Will Gardiner, Chief Executive of Drax Group plc, said:
“We continued to transform the business in 2017, delivering a strong EBITDA performance, in line with expectations. This was delivered by all parts of the business making positive contributions for the first time.
“We also made good progress delivering our strategy, which is clear and unchanged. We are increasing biomass self-supply, developing projects to diversify our generation mix and growing our B2B energy supply business.
“The UK is undergoing an energy revolution, starting with a significant reduction in carbon emissions, and to support that we are helping to change the way energy is generated, supplied and used.”
NOTES FOR ANALYSTS AND EDITORS
2017 Group Financial Review
• Underlying earnings per share decreased to 0.7 pence
Accelerated depreciation of coal-specific assets, amortisation of intangible assets associated with the acquisition of Opus Energy and an increase in net finance charges.
• Reported basic earnings per share – a loss of 37 pence, which includes unrealised losses on derivative contracts of £156 million (principally related to the foreign currency hedging programme) in addition to one-off items – transaction costs relating to the acquisition of Opus Energy (£8 million) and refinancing (£24 million)
• Tax – one-off non-cash charge of £16 million – a reduction in US federal tax rates from 35% to 21% resulting in a revaluation of deferred tax balances, offset by £13 million cash tax credit from UK Patent Box tax regime, which rewards Drax patented innovation in biomass generation
• Investment in line with guidance
Acquisition of Opus Energy (£367 million)
Acquisition and commissioning of LaSalle Bioenergy (£48 million)
Maintenance and improvement (£133 million) including pellet plant optimisation, strategic spares, Haven Power information systems, research and innovation and Opus Energy office consolidation
Continue to expect ongoing maintenance capital investment of £50-60 million per year
• Net debt of £367 million (31 Dec 2016: £93 million), including cash on hand of £222 million
2017 Operational Review
Pellet Production – Focus on good quality pellets at lowest cost
• 35% increase in pellet production to 0.8M tonnes (2016 0.6M tonnes)
• Low-cost expansion of Amite and Morehouse plants complete
• £90 million capacity market payments secured for 2017-2022
B2B Energy Supply – Profitable business with growth in sales and customer meters
• 12% increase in customer meter points to more than 375,000
• 46% of energy sales from renewables
• Opus Energy EBITDA in line with plan; Haven Power exceeded EBITDA breakeven target
• Continued investment in next generation IT systems
Notes:
(1) EBITDA is defined as earnings before interest, tax, depreciation, amortisation and material one-off items that do not reflect the underlying trading performance of the business.
(2) 2017 underlying earnings exclude unrealised losses on derivative contracts of £156 million and material one-off items that do not reflect the underlying performance of the business (2016: unrealised gains of £177 million).
(3) Borrowings less cash and cash equivalents.
(4) Open Cycle Gas Turbine.
Forward Looking Statements This announcement may contain certain statements, statistics and projections that are or may be forward-looking. The accuracy and completeness of all such statements, including, without limitation, statements regarding the future financial position, strategy, projected costs, plans and objectives for the management of future operations of Drax Group plc (“Drax”) and its subsidiaries (the “Group”) are not warranted or guaranteed. By their nature, forward-looking statements involve risk and uncertainty because they relate to events and depend on circumstances that may occur in the future. Although Drax believes that the expectations reflected in such statements are reasonable, no assurance can be given that such expectations will prove to be correct. There are a number of factors, many of which are beyond the control of the Group, which could cause actual results and developments to differ materially from those expressed or implied by such forward-looking statements. These factors include, but are not limited to, factors such as: future revenues being lower than expected; increasing competitive pressures in the industry; and/or general economic conditions or conditions affecting the relevant industry, both domestically and internationally, being less favourable than expected. We do not intend to publicly update or revise these projections or other forward-looking statements to reflect events or circumstances after the date hereof, and we do not assume any responsibility for doing so.
~~~~~~~~~~~~~~~~~~~~~~~
Results presentation meeting and webcast arrangements
Management will host a presentation for analysts and investors at 9:00am today (UK Time), at The Lincoln
Centre, 18 Lincoln’s Inn Fields, London, WC2A 3ED.
Would anyone wishing to attend please confirm by either e-mailing [email protected] or
calling Francesca Boothby at FTI Consulting on +44 (0) 203 727 1054.
The meeting can also be accessed remotely via a live webcast, as detailed below. After the meeting, the
webcast will be made available and access details of this recording are also set out below.
A copy of the presentation will be made available from 7:00am (UK time) today for download at:
www.drax.com>>investors>>results-reports-agm>>investor-relations-presentations or use the link
In 2017 we made significant progress with the strategy we announced in December 2016.
First, we completed the acquisition of Opus Energy – a leading challenger brand in the UK Small and Medium-sized Enterprise (SME) energy market; second, we acquired a third biomass pellet plant (LaSalle Bioenergy), which significantly increases our pellet production capacity; and third, we continued to develop options for flexible gas generation at four sites around the UK.
We also began developing longer-term options for growth, with the exploration of coal-to-gas repowering at Drax Power Station, as we look to provide new sources of flexible generation backed up by long-term capacity contracts. To support our strategy, we completed a refinancing in May and announced a new dividend policy in June.
At the same time, we have continued to provide a significant amount of the UK’s renewable electricity. With confirmation of Government support for further biomass generation at Drax Power Station we plan to continue our work to develop a low cost solution for a fourth biomass unit conversion, allowing us to provide even more renewable electricity, whilst supporting system stability at minimum cost to the consumer.
Opus Energy performed well, delivering on the plans we set out at the time of acquisition and, in North America, LaSalle Bioenergy is successfully commissioning. This performance alongside safety, sustainability and expertise in our core markets acts as a strong base from which the business can grow and deliver long-term sustainable value.
We have a major role to play in supporting the UK energy system, as it becomes increasingly ambitious in decarbonising the electricity sector and subsequently transport and heating. In doing so, through our flexible, low-carbon and customer-focused approach we aim to deliver higher quality earnings, with a reduction in commodity exposure alongside opportunities for growth.
Our people – employees and contractors – remain a key asset of the business. Their safety remains at the centre of our operational philosophy and we have performed well in this regard, although we continue to work to improve our performance across the Group.
RESULTS AND DIVIDEND
EBITDA in 2017 of £229 million was significantly ahead of 2016 (£140 million). This increase was principally from producing high levels of renewable power from sustainable biomass. We also benefited from our growing B2B Energy Supply and Pellet Production businesses. Through these activities we are improving the visibility of our earnings.
In June we announced a new dividend policy. This policy is to pay a dividend which is sustainable and expected to grow as the implementation of the strategy generates an increasing proportion of stable earnings and cash flows. In determining the rate of growth in dividends the Board will take account of contracted cash flows, the less predictable cash flows from the Group’s commodity based business and future investment opportunities. If there is a build-up of capital the Board will consider the most appropriate mechanism to return this to shareholders.
At the 2017 half year results we confirmed an interim dividend of £20 million (4.9 pence per share) representing 40% of the full year expected dividend of £50 million (12.3 pence per share) (2016: £10 million, 2.5 pence per share). Accordingly, the Board proposes to pay a final dividend in respect of 2017 of £30 million, equivalent to 7.4 pence per share.
In addition, the Board has decided to announce today a £50 million share buy-back programme, which will take place during 2018, which is consistent with our capital allocation policy.
CORPORATE GOVERNANCE
In September, Dorothy Thompson CBE announced her intention to stand down as Group Chief Executive Officer (CEO). I would like to thank Dorothy for her enormous contribution to the Group over the last 13 years. During her tenure Dorothy led the transformation of the business and leaves the Group in a strong position with a clear strategy that lays the foundations for further success in a changing energy sector.
Dorothy is succeeded by Will Gardiner, who was previously Group Chief Financial Officer (CFO) and a key architect of the strategy. His appointment follows a thorough review of internal and external candidates and is a natural progression after two years working alongside Dorothy developing a strategy which I am confident will create significant benefits for all Drax’s stakeholders.
A process to appoint a permanent CFO is underway and Den Jones has been appointed as Interim CFO. Den is highly experienced, having previously served as CFO of both Johnson Matthey and BG Group. Drax remains committed to the highest standards of corporate governance. The Board and its committees play an active role in guiding the Company and leading its strategy. We greatly value the contribution made by our Non-Executive Directors (NEDs) and during a time of transition their role is especially important.
We indicated last year that we were seeking additional NEDs with experience in sustainability and energy supply to complement our already experienced Board. I am therefore delighted to welcome two new NEDs to the Drax Board. Firstly, David Nussbaum, whose in-depth knowledge of sustainability will support our continued focus in this area and secondly, Nicola Hodson; whose experience in technology, business transformation and energy, will provide real value as the Group delivers its strategy.
OUR PEOPLE
As the Group grows I would also like to welcome colleagues from Opus Energy and our other developments. On-boarding is proceeding well and by working together in our common goal to help change the way energy is generated, supplied and used, we are creating real value for all stakeholders.
I must thank all the employees and contractors who have worked so hard to help the Group succeed in the last 12 months. It is through their skill, expertise and hard work that we are able to deliver our strategy for the business.
My sincere thanks to colleagues for their commitment and hard work.
It only remains for me to say that your Board remains totally committed to the complementary aims of delivering sustainable long-term value for the Group, and of helping our country build a low-carbon economy.
PHILIP COX CBE CHAIRMAN
CHIEF EXECUTIVE’S REVIEW
MARKET BACKGROUND
The UK is undergoing an energy revolution – a transition to a low-carbon economy requiring new energy solutions for power generation, heating, transport and the wider economy. Through our flexible, lower carbon electricity proposition and business to business (B2B) energy solutions, the Group is positioning itself for growth in this environment.
OUR STRATEGY
Our purpose is to help change the way energy is generated, supplied and used.
Through addressing UK energy needs, and those of our customers, our strategy is designed to deliver growing earnings and cash flow, alongside significant cash returns for shareholders.
Our ambition is to grow our EBITDA to over £425m by 2025, with over a third of those earnings coming from Pellet Production and B2B Energy Supply to create a broader, more balanced earnings profile. We intend to pay a sustainable and growing dividend to shareholders. Progression towards these targets is underpinned by safety, sustainability, operational excellence and expertise in our markets.
SUMMARY OF 2017
We made significant progress during 2017, but were below our expectations on the challenging scorecard targets we set ourselves in pellet production and biomass availability, the latter reflecting the significant incident we experienced on our biomass rail unloading facilities at the end of 2017, which extended into January 2018. Energy Supply performed well with Opus Energy in line with plan and Haven Power exceeding its targets. Through a combination of this performance and the progress of our strategy we have delivered EBITDA of £229 million, significantly ahead of 2016 (£140 million) and with each of our three businesses contributing positive EBITDA for the first time.
On a statutory basis we recorded a loss after tax of £151 million, which reflects unrealised losses on derivative contracts and the previously announced accelerated depreciation on coal-specific assets as well as amortisation of newly-acquired intangible assets in Opus Energy. We also calculate underlying earnings, a profit after tax of £2.7 million, which excludes the effect of unrealised gains and losses on derivative contracts to assess the performance of the Group without the income statement volatility introduced by non-cash fair value adjustments on our portfolio of forward commodity and currency futures contracts.
During the year we refinanced our existing debt facilities, reducing our debt cost. We also confirmed a new dividend policy which will pay a sustainable and growing dividend (£50 million in respect of 2017), consistent with our commitment to a strong balance sheet and our ambitions for growth. At year end our net debt was £91m below our 2x net debt to EBITDA target, providing additional headroom.
In the US, our Pellet Production operations recorded year-on-year growth in output of 35%, with our first two plants now producing at full capacity. During the second half of 2017 we also completed the installation of additional capacity enabling our Morehouse and Amite facilities to handle a greater amount of residue material, supporting efforts to produce good quality pellets at the lowest cost.
As part of our target to expand our biomass self-supply capability we completed the acquisition of LaSalle Bioenergy (LaSalle) adding pellet production capacity. LaSalle commenced commissioning in November 2017 and due to its close proximity to our existing US facilities, once complete, will provide further opportunities for supply chain optimisation.
As in 2016, we benefited from the flexibility of self-supply. This often overlooked attribute of our supply chain enables us to manage biomass supply across the Power Generation business’ planned outage season and to benefit from attractively priced biomass cargoes in the short-term spot market.
In Power Generation, we experienced a significant incident on our biomass rail unloading facilities, including a small fire on a section of conveyor. We fully investigated the incident and following repairs over the Christmas period have now recommissioned the facility, with enhanced operating procedures. This is a timely reminder of the combustible nature of biomass and the need for strong controls and processes to protect our people and assets.
Our biomass units continued to produce high levels of renewable electricity from sustainable wood pellets for the UK market – Drax produced 15% of the UK’s renewable electricity – enough to power Sheffield, Leeds, Liverpool and Manchester combined. In doing so, we are making a vital contribution to the UK’s ambitious targets for decarbonisation across electricity generation, heating and transport – an 80% reduction by 2050 vs. 1990 levels.
We benefited from the first year of operation of our third biomass unit under the Contract for Difference (CfD) scheme which provides an index-linked price for the power produced until March 2027. The unit underwent a major planned outage between September and November, with a full programme of works successfully completed.
The flexibility, reliability and scale of our renewable generation, alongside an attractive total system cost, means we are strongly placed to play a long-term role in the UK’s energy mix. To that end we continue to see long-term biomass generation as a key enabler, allowing the UK Government to meet its decarbonisation targets and the system operator to manage the grid.
The UK Government recently confirmed support for further biomass generation at Drax Power Station and we now plan to continue our work to develop a low cost solution for a fourth biomass unit, allowing us to provide even more renewable electricity, whilst supporting system stability at minimum cost to the consumer.
Our heritage is coal, but our future is flexible lower-carbon electricity. We are making progress with the development of four new standalone OCGT plants situated in eastern England and Wales and our work to develop options for coal-to-gas repowering with battery technologies. These options would be supported by 15-year capacity market contracts, providing a clear investment signal and extending visibility of contract-based earnings out to the late 2030s.
In B2B Energy Supply, we completed the acquisition of Opus Energy, a supplier of electricity and gas to corporates and small businesses. The transaction completed in February 2017 and the business has continued to operate successfully within the Group, achieving its targets and making an immediate and significant contribution to profitability. Alongside this good performance we have also implemented the operational steps necessary to realise further operational benefits of the acquisition, and we now source all of Opus Energy’s power and gas internally.
Haven Power delivered a strong performance with the sale of large volumes of electricity to industrial customers. Through our customer focus and efficiencies, margins have improved and the business generated a positive EBITDA for the first time.
Together, our B2B Energy Supply business now has over 375,000 customer meters, making it the fifth largest B2B power supplier in the UK. We are delivering innovative low-carbon power solutions, with 46% of our energy sold from renewable sources. As the power system transforms, we will be working closely with our customers to help them adapt to a world of more decentralised and decarbonised power. We see this as a significant opportunity for the Group in the medium to long term.
In October 2017 we completed the sale of Billington Bioenergy (BBE) to Aggregated Micro Power Holdings (AMPH). Consideration for the transaction was £2.3 million, comprised of £1.6 million of shares in AMPH and £0.7 million of cash.
The sale of BBE is aligned with our strategy to focus on B2B energy supply. However, through our shareholding in AMPH, we will retain an interest in the UK heating market, whilst gaining exposure to the development of small-scale distributed energy assets.
POLITICAL, REGULATORY AND ECONOMIC BACKGROUND
We continue to operate in a changing environment. The full impact of the UK’s decision to leave the EU is still unknown.
The immediate impact on the Group was a weakening of sterling and an associated increase in the cost of biomass, which is generally denominated in other currencies. Through our utilisation of medium-term foreign exchange hedges the Group protected the cash impact of this weakness. In 2017, sterling has generally strengthened, and we have been able to extend our hedged position out to 2022 at rates close to those that we saw before Brexit.
In terms of UK energy policy, the Government’s main focus has been on what it sees as unfair treatment of domestic consumers on legacy standard variable tariff (SVT) contracts. SVT’s are not a common feature of the B2B market. At the microbusiness end of this market, which is closer in size to domestic, most of our customers are on fixed price products and are active in renewing contracts.
The UK Government’s response to its consultation on the cessation of coal generation by 2025 has confirmed an end to non-compliant coal generation by October 2025. We believe our assets, projects and ability to support our customers’ electricity management will support the Government’s ambition to maintain reliability when coal generation ceases.
Running a resilient, reliable grid is not simply about meeting the power demand on the system; there are also system support services which are essential to its effective operation. As the grid decentralises and becomes dependent on smaller, distributed generation the number of plants able to provide these services is reducing. Biomass generation, our proposed OCGTs and our repowering project would allow us to meet these needs, but this will not come for free. A reliable, flexible, low carbon energy system will require the right long-term incentives.
In November 2017, the Government confirmed that the UK will maintain a total carbon price (the combined UK Carbon Price Support – CPS – and the European Union Emissions Trading Scheme – EU ETS) at around the current level. CPS has been the single most effective instrument in reducing the level of carbon emissions in generation and we continue to support the pricing of carbon, a view echoed in a report prepared for the UK Government by the leading academic Professor Dieter Helm.
Against this backdrop we continue to make an important contribution to the UK economy. According to a study published by Oxford Economics in 2016 (www.Draximpact.co.uk), Drax’s total economic impact – including our supply chain and the wages our employees and suppliers’ employees spend in the wider consumer-economy was £1.7 billion, supporting 18,500 jobs across the UK.
SAFETY, SUSTAINABILITY AND PEOPLE
The health, safety and wellbeing of our employees and contractors is vital to the Group, with safety at the center of our operational philosophy. We also recognise the growing need to support the wellbeing of our employees and their mental health.
During the year we continued to use Total Recordable Injury Rate (TRIR) as our primary KPI in this area. Performance was positive, at 0.27, but we expect this to improve in the coming year.
The incident at our biomass rail unloading facilities in December did not lead to physical injuries but was nonetheless a significant event and caused disruption into 2018. We consequently launched an incident investigation to ensure our personal and process safety management procedures are robust.
To promote greater awareness around wellbeing we have embedded this in our new people strategy and expect to focus more energy and resources on this important area during 2018.
Strong corporate governance is at the heart of the Group – acting responsibly, doing the right thing and being transparent. As the Group grows the range of sustainability issues we face is widening and recognising the importance of strong corporate governance, we will publish a comprehensive overview of our sustainability progress in 2017 on our website (www.drax.com) when we publish our Annual report and accounts. We have also completed the process which allows us to participate in the UN Global Compact (UNGC) – an international framework which will guide our approach in the areas of human rights, labour, environment and anti-corruption.
During 2017 we published our first statement on the prevention of slavery and human trafficking in compliance with the UK Modern Slavery Act. We have added modern slavery awareness to our programme of regular training for contract managers and reviewed our counterparty due diligence processes.
We have continued to maintain our rigorous and robust approach to biomass sustainability, ensuring the wood pellets we use are sustainable, low-carbon and fully compliant with the UK’s mandatory sustainability standards for biomass. The biomass we use to generate electricity provides a 64% carbon emissions saving against gas,
inclusive of supply chain emissions. Our biomass lifecycle carbon emissions are 36g CO2/ MJ, less than half the UK Government’s 79g CO2/ MJ limit.
Our people are a key asset of the business. Through 2017 we developed a new people strategy. The strategy focuses on driving performance and developing talent to deliver the Group’s objectives. We have established Group-wide practices, including a career development and behaviour framework focused on performance and personal development.
RESEARCH AND INNOVATION
A key part of our strategy is to identify opportunities to improve existing operations and create options for long-term growth. To that end we have established a dedicated Research and Innovation (R&I) team led by the Drax engineers who delivered our world-first biomass generation and supply chain solution.
We are actively looking at ways to improve the efficiency of our operations, notably in our biomass supply chain. Biomass is our largest single cost and as such we are focused on greater supply chain efficiency and the extraction of value from a wide range of low value residue materials.
In B2B Energy Supply we are using our engineering expertise to help offer our customers value-adding services and products which will improve efficiency and allow them to optimise their energy consumption.
2018 PRIORITIES
Pellet Production – Commissioning of LaSalle Bioenergy – Development of options for optimisation and efficiencies – Consistent production and quality of pellets – Continued cost reduction and improvement in EBITDA
Power Generation – Reliable biomass generation – Development of fourth biomass unit – System support services – Development of OCGT options – Development of coal-to-gas repowering option – Continued cost reduction and growth in EBITDA
B2B Energy Supply – Development of value added services – Continued cost reduction and growth in EBITDA – Investment in systems to support growth and Smart meter compliance
OUTLOOK
Our focus in 2018 remains on the delivery of our strategy and long-term ambitions for earnings growth, underpinned by safety, sustainability, operational excellence and expertise in our markets. We also recognise that being the most efficient operator in each of our markets is a key factor in our success.
Our objective in Pellet Production remains the commissioning of LaSalle, the production of good quality pellets at the lowest cost, cross-supply chain optimisation and identifying attractive options to increase self-supply.
Our biomass proposition is strong – reliable, flexible, low-carbon renewable electricity and system support which, combined with an effective fuel hedging strategy, will provide long-term earnings visibility. We remain focused on ways to increase supply chain efficiency and make biomass competitive beyond 2027. As part of this we remain focused on the optimisation of our assets in the US Gulf and reduction in pellet cost. To support this focus we are moving our US headquarters from Atlanta to Monroe Louisiana, which benefits from a much closer proximity to these assets.
In Power Generation, we continue to explore ways to optimise our existing operations, whilst meeting the needs of the changing UK electricity system.
We remain supportive of the UK Government’s decarbonisation targets and will continue our work to deliver four OCGTs and a low cost biomass unit conversion utilising existing infrastructure at Drax Power Station, alongside developing the option to repowering the remaining coal units to gas.
In B2B Energy Supply, we will continue to grow our B2B offering, with significant opportunities to grow market share. At the same time, we will invest in supporting infrastructure to ensure we can continue to grow, offer market leading digital propositions and smart metering services.
We have made good progress on the delivery of our strategy and will continue to build on this as we progress our targets for 2025, whilst playing an important role in our markets and helping to change the way energy is generated, supplied and used.
WILL GARDINER CHIEF EXECUTIVE, DRAX GROUP
GROUP FINANCIAL REVIEW
INTRODUCTION
The Group’s performance for 2017 was significantly improved from 2016, with EBITDA of £229 million (2016: £140 million). This principally reflects contributions from recently acquired Opus Energy and the operation of a biomass unit in Power Generation under a CfD. This was delivered alongside a well-supported refinancing, a positive result for the Pellet Production business and good operational performance.
Profit before tax was adversely impacted by higher depreciation (£13 million), which included the previously announced accelerated depreciation of coal-specific assets, one off costs associated with the Opus Energy acquisition (£8 million) and the refinancing (£24 million), as well as amortisation of newly acquired intangible assets in Opus Energy (£37 million). Non-cash unrealised losses on derivative contracts in the period of £156 million (2016: profit £197 million), principally a result of foreign exchange rate movements, materially affected the result and led to a loss before tax of £183 million for the period.
The underlying profit performance, which excludes the volatility of open derivative contract valuations and associated tax charges and one off transaction costs, resulted in underlying earnings of £2.7 million, as shown in note 7 to the financial statements.
The financial structure of the business has changed over the year and the Group benefits from increasingly visible and growing earnings from a broader base, with reducing exposure to commodity prices, and strong cash generation potential. We expect the CfD will provide high quality earnings through the life of the contract (to March 2027), supported by growing contributions from expanding Pellet Production operations and B2B Energy Supply.
On 10 February 2017 we completed the acquisition of Opus Energy Group Limited (Opus Energy) or total consideration of £367 million. The acquisition was funded from the Group’s own resources and £200 million from an acquisition facility and resulted in £159 million of goodwill and £224 million of intangible assets (see note 13 to the financial statements).
The Group is supported by a strong balance sheet, strengthened in the period by the refinancing and restructuring of the Group’s debt and a continued focus on working capital and cash optimisation. Net debt was £367 million at 31 December, increased from £93 million in 2016, largely driven by debt funding drawn to finance the acquisition of Opus Energy. However, continued focus on working capital and cash optimisation resulted in net debt at 1.6x EBITDA at the end of the year.
The results for 2017 demonstrate clear progress with the Group’s strategy. Positive contributions were made from across the Group, the balance sheet was restructured and investment targeted in areas with the potential to deliver strong returns. This provides an excellent platform from which to increase shareholder value.
INCOME STATEMENT
REVENUE
Consolidated revenue for 2017 of £3,685 million was £735 million greater than 2016, driven by higher Power Generation sales and the acquisition of Opus Energy.
Electrical output from Power Generation of 20.0TWh was in line with our plan, 65% from biomass units and 35% from coal units. This included the impact of maintenance outages for two biomass units and the impact of low load factors on coal units during the summer. 2017 saw the first year of generation under the CfD, contributing £248 million of revenue.
Revenues from system support services and the business’ ability to respond flexibly to grid demands grew during the year, contributing £88 million (2016: £47 million). The revenues available from flexibility recognises the value of the Drax Power Station plant in an increasingly volatile and intermittent generation market.
Renewable Obligation Certificate (ROC) revenues, recognised when we sell ROCs to third parties, of £368 million were recorded during the year (2016: £362 million).
B2B Energy Supply revenues increased from £1,326 million in 2016 to £1,999 million in 2017. This included contributions from Opus Energy (from 10 February) and included sales of gas, a key contributor to revenues over the winter period.
Revenues of our US-based Pellet Production business continued to rise, as we increased production from 607,000 tonnes in 2016 to 822,000 tonnes in the year. Revenues are based on sales of pellets from the US to our Power Generation business, based on an arms-length contract. Volumes included 18,000 tonnes of commissioning production from our new plant at LaSalle Bioenergy.
GROSS MARGIN
Consolidated gross margin for 2017 of £545 million (2016: £376 million) was primarily derived from our generation and supply activities.
Power Generation delivered £398 million of gross margin from biomass units operating under a CfD and the ROC regime and coal units providing system support. ROCs continue to form a key component of financial performance and the expected benefit of ROCs earned is recognised as a reduction in our biomass fuel costs at the point of generation. Each ROC is subsequently recognised as revenue when that ROC is sold to a third party. We earned ROCs, reducing costs, with a total value of £481 million in 2017 (2016: £536 million) as CfD replaced ROC generation.
B2B Energy Supply gross margin improved from £24 million in 2016 to £117 million in 2017, with positive contributions from Haven Power and Opus Energy. Electricity sales were supplemented, for the first time, with gas sales by Opus Energy.
Pellet Production gross margin relies on pellet sales and close control over production and operating costs. Increasing volumes and stable costs allowed margins to improve to £39 million during the year and deliver a positive EBITDA contribution for the first time.
Further segmental financial performance data is provided in note 2 to the financial statements.
OPERATING COSTS
Operating costs of £316 million increased from the previous year (2016: £236 million). This increase largely reflected the addition of Opus Energy to the Group and the expansion of the Pellet Production business. Operating costs in Power Generation included a major planned outage on one of the biomass units.
Central costs for 2017 were £34 million, compared with £21 million in 2016. The increase reflected investment in strategy, innovation and development activities, the majority of which is not expected to be recurring.
We incurred transaction costs of £8 million during the year (2016: £nil), supporting the delivery of strategic options, including the acquisition of Opus Energy. Transaction costs were also incurred as part of the disposal of Billington Bioenergy to Aggregated Micro Power Holdings plc on 31 October. These costs were all one off in nature, related to asset acquisitions and disposals, and were therefore excluded from EBITDA.
EBITDA
As a result of the financial performance described above, consolidated EBITDA for 2017 was £229 million, compared to £140 million in 2016.
DEPRECIATION AND AMORTISATION
Depreciation of £123 million in the year was £13 million higher than 2016, largely driven by the acceleration of charges following the shortening of useful economic lives for certain coal-specific assets and including write off of obsolete assets. We assume that assets which are only able to support coal-fired generation will not operate beyond 2025, in line with the Government’s declared intention to cease unabated coal generation, resulting in accelerated depreciation charges between 1 January 2017 and 31 December 2025.
Amortisation charges of £44 million included £37.5 million relating to intangible assets arising from the Opus Energy acquisition. These assets totalled £224 million and were comprised of customer contracts, brand value and software, as shown in note 13 to the financial statements. Charges in the year also include the impact of
reclassifying software assets in use across the Group as intangible assets, following investment in new systems capability.
UNREALISED LOSSES ON DERIVATIVE CONTRACTS
A key component of the Group’s risk management strategy is the use of forward contracts to secure and de-risk the future cash flows of the business. Whilst these contracts are all entered into for risk management purposes, a proportion of our portfolio is not designated into a hedge accounting relationship under IFRS. Where this is the case, the unrealised gains and losses arising from the change in fair market value of these contracts is recognised in our income statement.
In 2017, we recognised unrealised losses of £156 million (2016: gain £177 million) within the income statement in respect of outstanding contracts for future delivery. This was recorded below EBITDA and excluded from underlying earnings. In our balance sheet a similar loss of £209 million (2016: gain £330 million) was recognised in the hedge reserve. The losses, which do not impact cash, principally relate to forward foreign currency purchase contracts designed to fix the Sterling cost of future purchases of biomass. The majority of our fuel purchases are denominated in US dollars, with the remainder in Canadian dollars and Euros. The losses reflect the change in value of our hedge as Sterling has strengthened against the US and Canadian dollar during the year. The strengthening in sterling during 2017 partially reversed the significant mark to market gains posted during 2016 as its value fell following the Brexit vote.
In addition to hedging foreign currency commitments we also forward purchase, as required, coal, oil, gas and carbon. An increase to oil prices during 2017 drove an unrealised gain from forward contracts for these commodities, which partially offset the unrealised losses on forward foreign exchange purchases.
Despite the loss in the year the Group continues to benefit from the hedging programme, securing medium-term fuel costs and other liabilities.
The term of our hedges is limited by available credit lines and market liquidity. We have hedges in place to cover anticipated exposures until 2022, beyond which there is a risk that the cost of our fuel purchases will materially increase. We remain very focused on reducing the long- term cost of biomass fuel to preserve gross margins beyond the current currency hedge period.
EBIT
Loss before interest and tax (Operating loss) fell from a profit of £204 million in 2016 to a loss of £117 million in 2017, influenced by the items described above, a loss on disposal of Billington Bioenergy (£4m), but principally reflecting the volatility in the unrealised gains and losses on derivative contracts. The impact of movements on derivative contracts is excluded in the calculation of underlying earnings (see below).
NET INTEREST CHARGES
Net interest charges of £66 million include costs incurred as a result of the Group’s refinancing. This includes acceleration of deferred financing costs and the one-off cost of early repayment charges for loans outstanding at the refinancing date (£24 million), in addition to interest costs driven by a higher quantum of debt than the previous year. A full breakdown of interest payable is shown in note 5 to the financial statements.
PROFIT/LOSS BEFORE AND AFTER TAX
The Group’s loss before tax, calculated in accordance with IFRS, was £183 million for 2017, compared to a profit of £197 million for the previous year. The reduction predominantly reflects improvements to EBITDA, offset by higher depreciation and amortisation and unrealised losses on forward foreign currency purchase contracts.
The net tax credit for 2017 of £32 million compares to £3 million in 2016. It includes two one-off items arising in the year.
Firstly, a tax credit of £13 million arising from a patent relating to biomass was granted to the Group in late 2016. Under the UK Patent Box tax regime, this enables the Group to pay corporate taxes at a lower rate on profits which arise from the use of the innovation. We have agreed the claim with HMRC for prior years 2013 to 2016 (£10 million) and have included our best estimate of the benefit arising under the tax regime for 2017 (£3 million).
However, for accounting purposes our best estimate is made of the benefit arising under the tax regime from 2013 to 2017.
Offsetting this credit is a non-cash deferred tax charge of £16 million arising from the reduction in US Federal tax rates to 21% from 1 January 2018.
Applying the tax credit results in a loss after tax of £151 million (2016: £194 million) and a basic loss per share of (37.2) pence (2016: earnings of 47.7 pence).
UNDERLYING EARNINGS
Underlying profit (also referred to as underlying earnings) is used to assess the performance of the Group without the P&L volatility caused by derivative contracts and any other material, one-off items. The reconciliation of IFRS earnings to underlying earnings is shown in note 7 to the financial statements.
Underlying profit before tax for 2017 of £5 million reduced from £21 million in 2016, reflecting higher EBITDA offset by higher depreciation, amortisation and interest charges.
The underlying tax charge for the year of £2 million (2016: £nil) excludes the tax effect of non-underlying translations.
Underlying profit after tax for the year was £3 million (2016: £21 million), resulting in underlying EPS of 0.7 pence per share (2016: 5.0 pence per share).
FINANCIAL POSITION
CAPITAL EXPENDITURE
The Group has a disciplined approach to capital expenditure, with all projects subject to review by investment committees and large projects requiring Board approval. Investment is prioritised to address safety and regulatory requirements, ensure plant is fully maintained and fit for purpose, and only released to enhancement projects where incremental returns have been identified.
Capital expenditure in the year was £181 million, increased from £97 million during 2016. This included the purchase, at auction, of the pellet-production assets at LaSalle Bioenergy and investment to recommission the plant and achieve throughput of 450k tonnes of wood pellets per annum. In total the LaSalle investment was £48 million. Details are shown in note 2 to the financial statements.
At Drax Power Station investment reflected routine asset replacement and upgrades (£62 million), including the purchase of strategic spares, and payments to secure development options for four OCGT power plants.
In B2B Energy Supply the development of a new information technology platform and preparations for Smart meters adoption added £9 million and an office facility was purchased in Northampton (£17 million), which will be used to consolidate existing Opus Energy operations from four offices into a single facility, enhancing operational effectiveness.
CASH GENERATED FROM OPERATIONS
Cash generated from operations was £315 million in 2017, an increase of £125 million from the previous year. Key drivers were the improvement in EBITDA and cash inflows generated from working capital management.
Working capital management included use of a committed facility to manage receivables in our B2B Energy Supply business, providing cash in advance of normal payment terms.
A cash inflow was also generated from ROC sales. Cash from ROCs is typically realised several months after the ROC is earned however, we have optimised our trading activities to enable us to accelerate the cash flows over a proportion of these assets. This provided a £142 million cash benefit during 2017. In 2016, three uncommitted ROC facilities were used to accelerate ROC receivables, these were unused at 31 December 2017 (2016: £111 million).
The net cash outflow for the year was £6 million (2016: £95 million inflow), after cash payments for capital expenditure of £159 million (2016: £93 million) and dividend payments of £22 million (2016: £11 million). Cash taxes paid during the year were £14 million (2016: £2 million).
NET DEBT AND FUNDING
The cash position of the Group during the year was significantly impacted by a full Group refinancing, which was executed on 5 May 2017. The Group successfully raised £550 million of publicly traded bonds, supported by a revised revolving credit facility and indexed loan notes totalling £350 million. The newly raised funds were used to repay the £200 million Opus Energy acquisition facility. The remaining funds will provide support for the Group’s investment and strategic programmes.
The use of the receivables facility and ROC sales mentioned above accelerated cash flows to a value of £110 million (2016: £74 million) with a corresponding reduction to net debt. We expect to continue to use the receivables facility throughout 2018. In addition we expect to maintain the flexibility to accelerate ROC cash flows through optimising our trading activities or through uncommitted ROC receivable facilities.
The Group also has access to secured trading lines, available with certain counterparties, providing support to the trading programme.
Net debt at 31 December 2017 was £367 million, an increase of £273 million from 31 December 2016 (£94 million).
We remain committed to a strong balance sheet and maintaining an appropriate credit rating. Cash optimisation contributed to achieving a ratio of net debt to EBITDA of 1.6x at 31 December and we remain focused on further reductions, supported by improved cash generation.
Further information on funding arrangements is included in note 11 to the financial statements.
PENSIONS
The Group operates a defined contribution pension scheme in each of its operating companies and, in addition, the Power Generation business operates a defined benefit scheme within the Electricity Supply Pension Scheme framework. The triannual valuation for this scheme (dated 31 March 2016) completed during the year, resulting in an agreement with the Trustees for the Company to make deficit repair contributions, totaling £52 million, from 1 January 2017 to 31 December 2025. The agreement also establishes a legally binding journey plan, involving the deficit contributions, improved investment returns and liability reductions, targeting financial self-sufficiency for the scheme by 2025.
OTHER INFORMATION
ACQUISITION OF OPUS ENERGY GROUP LIMITED
On 6 December 2016 we announced the proposed acquisition of Opus Energy Group Limited (Opus Energy), a well-established and proven B2B energy supply business serving the SME market, for consideration of £340 million cash, plus locked box interest.
The acquisition was partly financed by a short-term debt facility of up to £375 million, of which £200 million was initially drawn down and then repaid during the year.
The proposed acquisition was approved by shareholders at a general meeting on 8 February 2017 and concluded on 10 February 2017, with Drax obtaining control of Opus Energy at that date. Opus is expected to deliver enhanced margins to Drax’s energy supply business and drive our growth in the SME market. The business made a positive contribution to performance during 2017.
Financial information on the assets and liabilities acquired, plus an assessment of the impact of the acquisition on our financial statements, is provided in note 13 to the financial statements.
IMPACT OF BREXIT
We have continued to monitor the progress of the UK’s Brexit negotiations and the potential impact on the Group. Whilst we continue to expect limited impact on our operations, any associated sterling weakness may influence the future cost of fuel used by the Power Generation business. To manage this risk a number of financial instruments, including FX options, were added to the foreign exchange hedging programme during the year, effectively capping future FX liabilities on an additional proportion of the future foreign currency fuel exposures.
DISTRIBUTIONS
On 15 June we announced a new dividend policy, consistent with maintaining the Group’s credit rating and investing in its business. As part of this announcement the Board expected to recommend a dividend of £50 million with regard to the 2017 financial year, with growth expected in future years.
The Board is confident that this level of dividend is sustainable and expects it to grow from this level as the implementation of the strategy generates an increasing proportion of stable earnings and cash flows. In determining the rate of growth in dividends the Board will take account of future investment opportunities and the less predictable cash flows from the Group’s commodity-based businesses. If there is a build-up of capital the Board will consider the most appropriate mechanism to return this to shareholders.
At the Annual General Meeting on 13 April 2017, shareholders approved payment of a final dividend for the year ended 31 December 2016 of 0.4 pence per share (£1.6 million). The final dividend was subsequently paid on 12 May 2017.
On 18 July 2017, the Board resolved to pay an interim dividend for the six months ended 30 June 2017 of 4.9 pence per share (£20 million), representing 40% of the expected full year dividend. The interim dividend was paid on 6 October 2017.
At the forthcoming Annual General Meeting, on 25 April 2018, the Board will recommend to shareholders that a resolution is passed to approve payment of a final dividend for the year ended 31 December 2017 of 7.4 pence per share (£30 million), payable on or before 11 May 2018.
Shares will be marked ex-dividend on 19 April 2018.
In addition, in line with our capital allocation policy, the Board has agreed to undertake a £50m share buy back programme during 2018 to return cash to our shareholders.
VIABILITY STATEMENT
In accordance with the UK Corporate Governance code, the directors have assessed the prospects of the Group over a period significantly longer than the 12 months required by the going concern provision.
The assessment of viability was led by the Group Chief Executive and Interim Chief Financial Officer in conjunction with divisional and functional management teams and presented to the Board. In reviewing this assessment the Board has considered the principal risks faced by the Group, relevant financial forecasts and sensitivities, the availability of adequate funding and the strength of the Group’s control environment.
ASSESSMENT PERIOD
The Board conducted this assessment over a period of three years, which was selected for the following reasons:
– The Group’s Business Plan, which is reviewed and assessed on a quarterly basis and is used for strategic decision making, includes a range of financial forecasts and associated sensitivity analysis. This Plan covers a three-year period in detail.
– Within the three-year period liquid commodity market curves and established contract positions are used in the forecasts. Liquid curves typically cover a one to two-year window and contracts cover periods between one and ten years. In particular, we benefit from the stable and material earnings stream available from the CfD until 2027. Selecting a three-year period balances short-term market liquidity against our longer term contractual positions.
– Within a three-year horizon there is limited certainty around markets and regulatory regimes. However, in selecting this period the Board has assumed no material changes to the Group’s mid-term regulatory environment and associated support regimes.
REVIEW OF PRINCIPAL RISKS
The Group’s principal risks and uncertainties have been considered over the period.
The principal risks with the potential to exert significant influence on viability are: commodity price changes, political and regulatory changes, biomass acceptability changes and plant operating failures. A significant adverse change to the status of each risk has the potential to place material financial stress on the Group.
The risks were evaluated, where possible, to assess the potential impact of each on the viability of the Group, should that risk arise in its unmitigated form. The potential inputs were included, where appropriate, as sensitivities to the Plan and considered by the Board as part of the approval process required before the Plan was adopted by the Group.
In this regard, the Group has a proven track record of adapting to changes to its environment and deploying innovative solutions to protect financial performance. Recent developments suggest that this will continue in the future as the Group invests in new plant, equipment and systems and broadens the business in line with the strategy.
REVIEW OF FINANCIAL FORECASTS
The Plan considers the Group’s financial position, performance, cash flows, covenant compliance and other key financial ratios and was most recently updated to reflect current market and external environment conditions in December 2017. It is built by business and segment, and includes growth assumptions appropriate to the markets each business serves.
The Plan includes certain assumptions, the most material of which relate to commodity market price curves and levels of subsidy support available to the Group through the generation of biomass-fueled renewable power. It is underpinned by the stable revenues available through the generation of CfD-backed electricity and sales to B2B Energy Supply customers.
The Plan is subject to stress testing, which involves the construction of reasonably foreseeable scenarios, including those aligned to the principal risks, which test the robustness of the Plan when key variables are flexed both individually and in unison. Where such a scenario suggests a risk to viability, the availability and quantum of mitigating actions is considered.
The Board considers the most significant of these scenarios in the assessment period to be a significant deterioration of commodity market prices, leading to a fall in the available price for power and thus a fall in the margins available to the Group from power generation and supply activities. This impact would however be partially mitigated through the earnings stability provided by the CfD and a reducing reliance on commodity price-dependent earnings. Based on its review the Board is satisfied that in such a scenario sufficient actions could be taken to preserve the viability of the Group.
AVAILABILITY OF ADEQUATE FUNDING
The sources of funding available to the Group are set out in note 11 to the financial statements. The Board expects these sources, along with cash flows generated by the Group from its normal operations, to provide adequate levels of funding to support the execution of the Group’s Plan.
Refinancing of the Group’s debt facilities during the year, and in particular the placement of a new bond facility, has provided the Group with enhanced facilities and the ability to access debt markets, should that need arise during the viability assessment period.
EXPECTATIONS
The directors have considered all the factors in their assessment of viability over the next three years, including the latest Plan, scenario analysis, levels of funding, control environment and the principal risks and uncertainties facing the Group. The directors have also considered the availability of actions within their control in the event of plausible negative scenarios occurring. They have a reasonable expectation that the Group will be able to continue in operation and meet its liabilities as they fall due over the three-year period of their assessment.
PRINCIPAL RISKS AND UNCERTAINTIES
We manage the commercial and operational risks faced by the Group in accordance with policies approved by the Board. We have reviewed the principal risks and consider they are broadly unchanged from the previous year.
The Board is responsible for defining risk appetite and ensuring the effectiveness of risk management and internal controls across the Group. The Group has a comprehensive system of governance controls to manage key risks.
GROUP APPROACH TO RISK MANAGEMENT
The effective identification and management of risk across the Group is integral to the delivery of our strategy. The Group has a Risk Management Policy, approved by the Board, which defines the Group’s approach to risk management. The key elements of the policy are as follows:
– identify principal risks that threaten the achievement of our strategic objectives then assess their significance to the business;
– put in place appropriate mitigating controls to manage identified risks to an acceptable level;
– escalate and report principal risk and control information to support management decision making;
– assign responsibility and define accountabilities for risk management and put these into practice across the Group;
– continuously monitor the changing risk environment, the Group’s principal risks, the effectiveness of mitigation strategies and the application of the risk framework.
The approach manages rather than eliminates the risk of failure to achieve business objectives, and provides reasonable, not absolute, assurance against material misstatement or loss.
RISK MANAGEMENT COMMITTEES
The risk management governance structure includes seven business risk management committees (RMCs).
Each RMC:
– reports to the executive management of that area, assisting in the management of their risks. In turn, each executive is responsible for their risks to the Group Executive Committee with responsibility for ensuring that all risks associated with their specific area of the business are identified, analysed and managed systematically and appropriately. This includes new and emerging risks and changes to existing risks. New risks are also identified during development of the Business Plan.
– has terms of reference that require local level risk policies and control systems to be approved, implemented and monitored in order to ensure that activities are commensurate with the risk appetite established by the Board, are adequately resourced and comply with applicable legal and regulatory requirements.
The Group Executive Committee and the Board review reporting on risks from each RMC and from Group Risk. In addition, the Audit Committee reviews the suitability and effectiveness of risk management processes and controls on behalf of the Board.
INTERNAL CONTROL
The Group has a comprehensive and well-defined internal control system with clear structures, delegated authority levels and accountability. The Board has adopted a Schedule of Matters which are required to be brought to it for decision. The internal control system is designed to ensure that the directors maintain full and effective control over all significant strategic, financial and organisational issues.
Through the Audit Committee, the Board has implemented a programme of internal audits of different aspects of the Group’s activities. The programme is developed based on an assessment of the key risks of the Group, the existing assurance and controls in place to manage the risks and the core financial control framework.
The results of each internal audit are documented in a report for internal distribution and action. A full copy of the report is distributed to the Group Executive Committee and the Chair of the Audit Committee, with an executive summary going to the other members of the Audit Committee. Each report includes management responses to Internal Audit’s findings and recommendations and an agreement of the actions that management will take to improve the risk management and the internal control framework. In addition to the results of work undertaken by Internal Audit, the Audit Committee also satisfies itself that an action plan is in place and management are addressing issues raised by the external auditor in their yearly management letter.
Based on the reporting from the RMCs and from the Audit Committee in 2017, the Board determined that it was not aware of any significant deficiency or material weakness in the system of internal control.
CHANGE IN RISK PROFILE
Risks are reported to the Board and disclosed in the Annual report and accounts under eight principal risk headings. These are unchanged from 2016. Changes in factors Risk Mitigations Movement impacting risk in 2017
1. Strategic risks
Context
The Group has a strategy designed to strengthen the long-term future of the Group. The strategy includes:
– Higher quality, diversified earnings and management of commodity market exposure by increasing contractual and non-commodity related earnings and;
– Targeted long-term growth opportunities with priority on post 2027 earnings and creating new opportunities in all the markets in which we operate.
Risk and impact
– Development of the four OCGT plants acquired in 2016 and re-powering of coal units to gas with battery storage option is dependent on winning contracts with acceptable returns in capacity market auctions which is uncertain.
– Post 2027 biomass generation dependent upon cost of generation relative to market prices.
– Biomass self-supply requires acquisition and/or expansion in order to achieve the 30% self-supply target. Acquisition opportunities are dependent on willing vendors or distressed plants coming to market.
– The energy markets in which we operate are
– Continue work on reducing projects costs to increase competitiveness in the capacity market auction; a disciplined approach to the auction means such projects will only go forward upon obtaining a 15-year capacity market contract (‘CM’ contract) which meets our hurdle rate.
– Continued work on cost reductions from biomass supply and generation efficiency to support post 2027 operations.
– We continue to actively pursue potential acquisitions of pellet plant facilities and evaluate the case for expansion of existing facilities.
– We continually analyse the changing dynamics of the markets in which we operate. A programme of product incubation to bring new energy services to market and research/development into new technologies is in place.
= – Acquisition of Opus Energy and integration into the Group provides support to diversification of earnings.
– Acquisition and start of commissioning of LaSalle pellet facility supports self-supply target
– Announcement of a cap to standard variable tariffs (SVTs) for residential customers increases regulatory risk to the sector.
– Announcement of a de-rating mechanism for battery storage will result in a fairer competition for CM contracts.
evolving at a rapid pace with new entrants competing with existing players in both Power Generation and B2B Energy Supply.
2. Political and regulatory risks
Context
We remain vulnerable to changes in government policy at UK and EU level. The energy sector is subject to detailed legislation and regulation that is frequently changing as the economy decarbonises and decentralises and is ever more stringent. Regulation and compliance generally applicable to businesses is also increasing with a trend towards transparency and accountability.
Risk and impact
– Changes to UK policy and regulations may reduce our ability to deliver our forecast earnings from our base business and our growth strategy putting pressure on our financial results and cash flows.
– More complex and challenging regulations increase the potential for non-compliant outcomes, regulatory investigation and sanctions.
– Engagement with politicians across the political spectrum and Government officials to influence thinking.
– Communication of our socio-economic value to the UK.
– Working with think tanks and specialist consultants to establish Drax as a thought leader on priority policy and regulatory issues.
– Engagement with regulators to influence strategic direction of, and ensure compliance with, regulatory requirements.
– Working with Energy UK to identify market improvements, enhance competition and develop voluntary codes of practice.
– Regulatory and compliance programmes in place proportionate to the risk of non-compliance. Key programmes include compliance with the Criminal Finances Act 2017 and the General Data Protection Regulation (GDPR) and associated data protection laws.
= – The Government has confirmed the Carbon Price Floor will remain in place and at its current level until the end of coal generation in the power sector (by 2025).
– The Government has unveiled a successor to the Levy Control Framework to monitor the cost of subsidies and confirmed no new funding commitments until 2025.
– Brexit continues to create uncertainty over UK participation in, and influence over, discussions on new EU legislation.
– The Government has published a Bill to introduce a price cap for domestic power retailers; we remain vigilant to the risk this could be extended to some SMEs.
– The smart meter roll out continues and the obligation to install a smart meter for every customer (where reasonable steps have been exhausted) remains.
– Many ancillary services require policy, regulatory and market change to ensure generators are suitably compensated for these services.
– Ofgem is reviewing the way in which network businesses are remunerated, which will
impact network charging and access rights for generators and demand users.
– New Data Protection Bill announced due to Brexit to ensure the UK is regarded as an “approved country” to continue to process EU citizen personal data.
– The introduction of the Markets in Financial Instruments Directive 2 (MiFID2) increases the regulatory requirements placed on businesses participating in non-physical commodity markets.
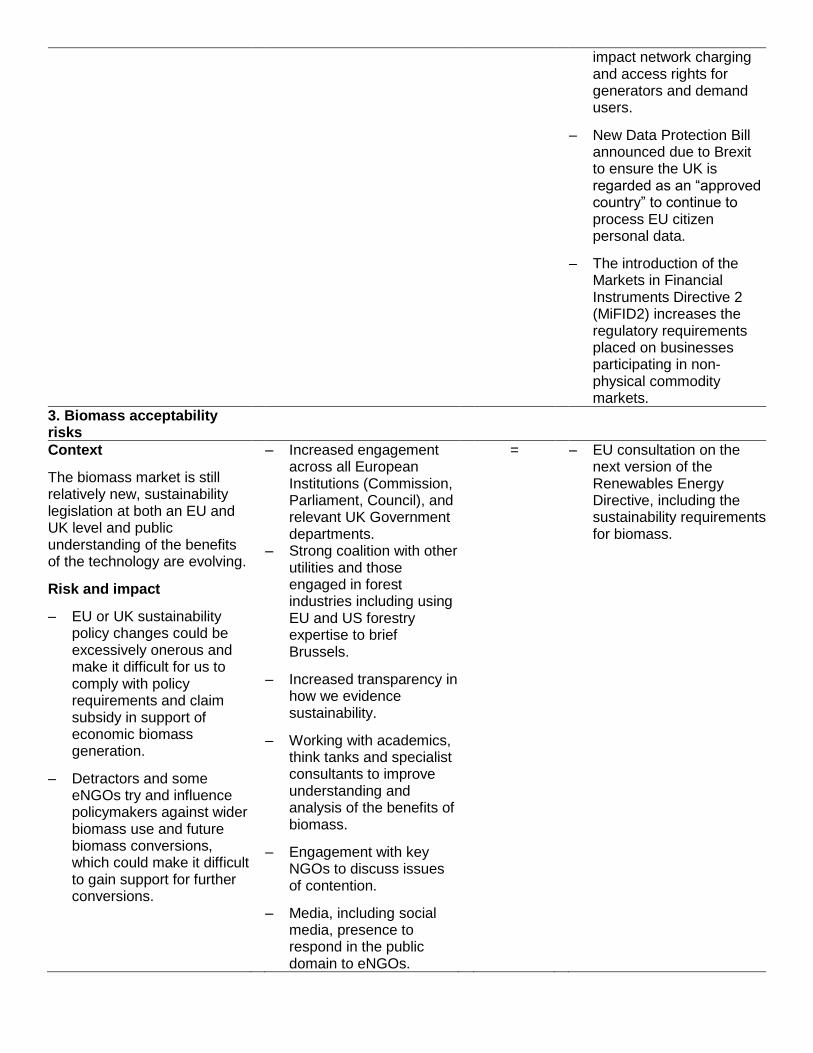
3. Biomass acceptability risks
Context
The biomass market is still relatively new, sustainability legislation at both an EU and UK level and public understanding of the benefits of the technology are evolving.
Risk and impact
– EU or UK sustainability policy changes could be excessively onerous and make it difficult for us to comply with policy requirements and claim subsidy in support of economic biomass generation.
– Detractors and some eNGOs try and influence policymakers against wider biomass use and future biomass conversions, which could make it difficult to gain support for further conversions.
– Increased engagement across all European Institutions (Commission, Parliament, Council), and relevant UK Government departments.
– Strong coalition with other utilities and those engaged in forest industries including using EU and US forestry expertise to brief Brussels.
– Increased transparency in how we evidence sustainability.
– Working with academics, think tanks and specialist consultants to improve understanding and analysis of the benefits of biomass.
– Engagement with key NGOs to discuss issues of contention.
– Media, including social media, presence to respond in the public domain to eNGOs.
= – EU consultation on the next version of the Renewables Energy Directive, including the sustainability requirements for biomass.
– Forging closer relationships with suppliers on sustainability through the supplier relationship programme.
– Strong processes to ensure compliance with regulation.
4. Plant operating risks
Context The reliability of our operating plant is central to our ability to create value for the Group. Risk and impact – Single point failures of
plant and incidents arising from the handling and combustion of biomass could result in forced outages in our generation or pellet production plants.
– Successful generation
using biomass requires stringent quality throughout the supply chain, which continues to evolve and mature. Poor quality could result in unplanned loss of generation.
– Robust management systems designed to mitigate risk.
– Comprehensive risk-
based plant investment and maintenance programme.
– Stringent safety
procedures in place for handling biomass and dust management.
– Plant designed to prevent
and control major hazards.
– Significant research and
development on the production of wood pellets as well as the handling and burning of biomass.
– Adequate insurance in
place to cover losses from plant failure where possible.
– Full testing of all biomass
supplies prior to acceptance and the use of contractual rights to reject out of specification cargoes.
– Sampling and analysis
through the supply chain to increase understanding of causes of fuel quality issues.
= – Acquisition and start of commissioning of LaSalle Bioenergy plant.
5. Trading and commodity risks
Context
The margins of our Power Generation and B2B Energy Supply businesses are influenced by commodity market movements, which are inherently volatile.
Risk and impact
– Fluctuations in commodity prices, particularly gas and power, could result in lower margins and a reduction in cash flow in our generation business.
– Drax Power may fail to secure future grid system services contracts which are a source of revenue diversity for the Group.
– The value of ROCs generated may be lower than forecast if the recycle value outturns below BEIS’ projections due to higher than anticipated renewable generation.
– High levels of forward power sales for 2018 and a CfD for one generation biomass unit.
– Hedging energy supply commodity price exposures when fixed price sales are executed with third parties.
– Wood pellets purchased under long-term contracts with fixed pricing.
– Significant forward foreign exchange hedging in place.
– Hedging fluctuations in ROC generation from wind farms through weather derivatives.
= – Sterling exchange rates against the euro and dollar remain weak.
– Power prices remain low with increased volatility in short-term prices.
– Prices for wood pellets increased as oversupply reduced.
– Opus Energy’s supply to smaller customers, including gas, increases commodity exposure relating to weather impacts on demand patterns.
6. Information systems and security risks
Context
The availability, integrity and security of our IT systems and Company data are essential to support operations of the Group.
Risk and impact
– Non-availability of IT systems, or a breach in their security, could result in the inability to operate systems or our information could be compromised.
– If our IT architecture does not meet the increasingly demanding and complex requirements of the Group, we may not deliver our growth plans effectively.
– Business continuity, disaster recovery and crisis management plans in place across the Group.
– Cyber security measures, including a defence, detect, remedy strategy, in place.
– IT transformation programme in place to deliver upgraded architecture.
< – Significant investment in our critical IT systems has improved the general resilience of the core systems.
– Implementation of the IT transformation programme.
7. People risks
Context
We need to ensure we have the right people in place with
– Consistent Group wide performance management, potential
> – Development and launch of a new people strategy centred around valuing
the leadership and specialist skills to help the Group to compete, innovate and grow.
Risk and impact
– Our performance and the delivery of our strategy is dependent upon having strong, high-quality leaders and engaged and talented people at all levels of the organisation.
assessment and career development frameworks.
– Regular staff surveys to monitor engagement levels and alignment of people with Group values.
– Investment in leadership development.
– Regular staff communications.
– Reward packages to aid retention.
people, driving business performance and focusing on talent. This is placing greater onus on performance, learning, equitable treatment and consistency in approach across the Drax Group.
8. Environment, health and safety risks
Context The health and safety of all our employees, contractors and visitors is of paramount importance to us. We believe that a safe, compliant and sustainable business model is critical to the delivery of our strategy and crucial for sustained long-term performance. Safety is at the heart of our operational philosophy and we continue to work across the Group to maintain high standards and a culture of safe working. Compliance with environmental legislation and our environmental permits and consents is essential to ensure the long-term future of the business. Risk and impact – Our operations involve
managing a range of hazards to personnel and the environment that arise from the processes we operate.
– Training staff to a high level of competence to appreciate and manage risk.
– Robust management systems designed to mitigate risk.
– Continuous reporting of events and prompt implementation of corrective actions.
– Continuous monitoring of processes to identify trends in performance.
– Rigorous auditing of compliance against standards, policy and procedures.
– Engagement with Regulators and stakeholders to identify improvements to our systems and operations.
– Investigating underlying reasons for events and implementing any necessary changes in the management system and culture.
– Timely identification of future legislation and appropriate investment in order to optimize performance into the future.
= – World-class personal safety performance for the year with improved TRIR continuing well above the industry benchmark.
– Changes under the Industrial Emissions Directive set demanding emissions limits that come fully into force in the next four years.
Key > Up/increasing < Down/reducing = No change
DIRECTORS’ RESPONSIBILITIES STATEMENT
The directors are responsible for preparing the Annual report and the financial statements in accordance with applicable law and regulations.
Company law requires the directors to prepare financial statements for each financial year. Under that law the directors are required to prepare the Group financial statements in accordance with International Financial Reporting Standards (IFRSs) as adopted by the European Union and Article 4 of the IAS Regulation and have elected to prepare the Parent Company financial statements in accordance with United Kingdom Generally Accepted Accounting Practice (United Kingdom Accounting Standards and applicable law), set out in FRS 101 “Reduced Disclosure Framework”. Under company law the directors must not approve the accounts unless they are satisfied that they give a true and fair view of the state of affairs of the Company and of the profit or loss of the Company for that period.
In preparing the Parent Company financial statements, the directors are required to:
– select suitable accounting policies and then apply them consistently;
– make judgements and accounting estimates that are reasonable and prudent;
– state whether applicable UK Accounting Standards have been followed, subject to any material departures disclosed and explained in the financial statements; and
– prepare the financial statements on the going concern basis unless it is inappropriate to presume that the Company will continue in business.
In preparing the Group financial statements, International Accounting Standard 1 requires that directors:
– properly select and apply accounting policies;
– present information, including accounting policies, in a manner that provides relevant, reliable, comparable and understandable information;
– provide additional disclosures when compliance with the specific requirements in IFRSs are insufficient to enable users to understand the impact of particular transactions, other events and conditions on the entity’s financial position and financial performance; and
– make an assessment of the Company’s ability to continue as a going concern.
The directors are responsible for keeping adequate accounting records that are sufficient to show and explain the Company’s transactions and disclose with reasonable accuracy at any time the financial position of the Company and enable them to ensure that the financial statements comply with the Companies Act 2006. They are also responsible for safeguarding the assets of the Company and hence for taking reasonable steps for the prevention and detection of fraud and other irregularities.
The directors are responsible for the maintenance and integrity of the corporate and financial information included on the Company’s website. Legislation in the United Kingdom governing the preparation and dissemination of financial statements may differ from legislation in other jurisdictions.
Responsibility statement
We confirm that to the best of our knowledge:
– the financial statements, prepared in accordance with the relevant financial reporting framework, give a true and fair view of the assets, liabilities, financial position and profit or loss of the Company and the undertakings included in the consolidation taken as a whole;
– the Strategic report includes a fair review of the development and performance of the business and the position of the Company and the undertakings included in the consolidation taken as a whole, together with a description of the principal risks and uncertainties that they face; and
– the annual report and financial statements, taken as a whole, are fair, balanced and understandable and provide the information necessary for shareholders to assess the Company’s performance, business model and strategy.
This responsibility statement was approved by the Board of directors on 26 February 2018 and is signed on its behalf by:
WILL GARDINER CHIEF EXECUTIVE, DRAX GROUP
CONSOLIDATED FINANCIAL STATEMENTS
CONSOLIDATED INCOME STATEMENT
Year ended 31 December 2017
2017 2016 Notes £m £m
Revenue 3 3,685.2 2,949.8 Fuel costs in respect of power generation (1,356.8) (1,154.2) Cost of energy purchases (974.6) (907.8) Grid charges (498.7) (379.7) Other energy supply costs (310.1) (131.8)
Total cost of sales (3,140.2) (2,573.5)
Gross profit 545.0 376.3 Operating and administrative expenses (316.1) (236.3)
EBITDA(1) 228.9 140.0 Depreciation (122.7) (109.5) Amortisation 15 (43.6) – Loss on disposal (2) (15.4) (3.8) Unrealised (losses)/gains on derivative contracts (156.1) 176.8 Other losses (0.4) – Acquisition-related costs(3) 13 (7.8) –
Operating (loss)/profit (117.1) 203.5 Foreign exchange gains and losses 5 (10.6) 22.0 Cost of debt restructure(4) 5 (24.2) – Interest payable and similar charges 5 (31.5) (29.0) Interest receivable 5 0.2 0.6
(Loss)/profit before tax (183.2) 197.1
Tax: – Before effect of changes in rate of tax 6 47.8 (13.0) – Effect of changes in rate of tax 6 (15.7) 9.8 Total tax credit/(charge) 32.1 (3.2)
(Loss)/profit for the year attributable to equity holders (151.1) 193.9
Underlying profit after tax(5) 7 2.7 20.5
(Loss)/earnings per share pence pence
– Basic 8 (37.2) 47.7
– Diluted (36.8) 47.4
All results relate to continuing operations.
Notes: (1) EBITDA is defined as: Earnings before interest, tax, depreciation, amortisation and material one-off items
that do not reflect the underlying trading performance of the business. (2) Loss on disposal includes a £3.6m loss on disposal of Billington Bioenergy and losses on disposal of assets
in the ordinary course of business of £11.8m. (3) Acquisition-related costs reflect costs associated with the acquisition and on-boarding of Opus Energy
Group Limited into the Group. (4) Cost of debt restructure are one-off costs associated with the refinancing of the Group’s debt. (5) Underlying earnings is defined as: Profit after tax, as calculated in accordance with IFRS, adjusted to
exclude unrealised gains and losses on derivative contracts and material one-off items that do not reflect the underlying performance of the business.
CONSOLIDATED STATEMENT OF COMPREHENSIVE INCOME
Years ended 31
December
2017 2016
Notes £m £m
(Loss)/profit for the year (151.1) 193.9
Items that will not be subsequently reclassified to profit or loss:
Actuarial gains/(losses) on defined benefit pension scheme 21.4 (8.4)
Deferred tax on actuarial gains/(losses) on defined benefit pension scheme 6 (4.1) 1.6
Items that may be subsequently reclassified to profit or loss:
Exchange differences on translation of foreign operations 3.4 (9.1)
Fair value (losses)/gains on cash flow hedges (219.2) 330.1
Deferred tax on cash flow hedges before tax rate changes 6 39.9 (62.6)
Impact of tax rate changes on deferred tax on cash flow hedges 6 – 3.0
Other comprehensive (expense)/income (158.6) 254.6
Total comprehensive (expense)/income for the year attributable to
The consolidated financial statements of Drax Group plc, registered number 5562053, were approved and authorised for issue by the Board of directors on 26 February 2018.
At 1 January 2016 46.9 1.5 424.2 710.8 34.9 (1.1) 385.2 1,602.4 Profit for the year – – – – – – 193.9 193.9 Other comprehensive income/(expense)
– – – – 270.5 (9.1) (6.8) 254.6
Total comprehensive income for the year – – – – 270.5 (9.1) 187.1 448.5
Equity dividends paid – – – – – – (11.0) (11.0) Issue of share capital 0.1 – – – – – – 0.1 Movement in equity associated
with share-based payments – – – – – – 5.2 5.2
At 31 December 2016 47.0 1.5 424.2 710.8 305.4 (10.2) 566.5 2,045.2
Loss for the year – – – – – – (151.1) (151.1) Other comprehensive income/(expense)
– – – – (179.3) 3.4 17.3 (158.6)
Total comprehensive income/(expense) for the year – – – – (179.3) 3.4 (133.8) (309.7)
Equity dividends paid – – – – – – (21.6) (21.6) Issue of share capital – – 0.1 – – – – 0.1 Movement in equity associated
with share-based payments – – – – – – 6.1 6.1
At 31 December 2017 47.0 1.5 424.3 710.8 126.1 (6.8) 417.2 1,720.1
CONSOLIDATED CASH FLOW STATEMENT
Year ended 31 December 2017
2017 2016 Notes £m £m
Cash generated from operations 12 375.7 213.1 Income taxes paid (14.0) (1.7) Other (losses)/gains (0.1) 0.7 Interest paid (46.6) (21.7) Interest received 0.2 0.4
Net cash from operating activities 315.2 190.8
Cash flows from investing activities Purchases of property, plant and equipment (159.0) (93.2) Purchases of software assets (15.7) – Acquisition of subsidiaries (379.8) –
Net cash used in investing activities (554.5) (93.2)
Cash flows from financing activities Equity dividends paid (21.6) (11.0) Proceeds from issue of share capital 0.1 0.1 Repayment of borrowings (493.8) – New borrowings drawn down 768.5 – Other financing costs paid (17.9) –
Net cash generated from/(absorbed by) financing activities
235.3 (10.9)
Net increase/(decrease) in cash and cash equivalents (4.0) 86.7 Cash and cash equivalents at 1 January 228.4 133.8 Effect of changes in foreign exchange rates (2.1) 7.9
Cash and cash equivalents at 31 December 222.3 228.4
The Group received shares with a value of £1.6 million as part-consideration for the disposal of Billington Bioenergy during 2017. The net cash disposed of in the transaction was negligible. There were no other non-cash transactions in either the current or previous year.
1 GENERAL INFORMATION & BASIS OF PREPARATION
The consolidated financial information for Drax Group plc (the Company) and its subsidiaries (together, the
Group) set out in this preliminary announcement has been derived from the audited consolidated financial
statements of the Group for the year ended 31 December 2017 (the financial statements).
This preliminary announcement does not constitute the full financial statements prepared in accordance with
International Financial Reporting Standards (IFRS). The financial statements were approved by the Board of
directors on 26 February 2018. Statutory accounts for 2016 have been delivered to the Registrar of Companies
and those for 2017 will be delivered in due course.
The report of the auditors on the financial statements was unqualified, did not draw attention to any matters by
way of emphasis without qualifying their report, and did not contain a statement under Section 498 (2) or (3) of
the Companies Act 2006 or equivalent preceding legislation.
The financial statements have been prepared in accordance with IFRS as adopted by the European Union and
therefore the consolidated financial statements comply with Article 4 of the EU IFRS Regulations and the
Companies Act 2006.
The financial statements have been prepared on a going concern basis and on the historical cost basis, except
for certain financial assets and liabilities that have been measured at fair value.
The principal accounting policies adopted in the preparation of the financial statements are set out in the 2017 Annual report and accounts. These policies have been applied consistently to both years presented.
2 SEGMENTAL REPORTING
The Group is organised into three businesses, with a dedicated management team for each and a central corporate office providing certain specialist and shared functions. Our businesses are:
– Power Generation: power generation activities in the UK, including at Drax Power Station and the development of OCGT projects;
– Pellet Production: production of sustainable compressed wood pellets at our processing facilities in the US; and
– B2B Energy Supply: the supply of electricity and gas to business customers in the UK.
The operating segments have been renamed to align more closely with the strategy, but are consistent with the prior year, except for changes due to business combinations as noted below. Each business is an operating segment for the purpose of segmental reporting. Information reported to the Board for the purposes of assessing performance and making investment decisions is based on these three operating segments. The measure of profit or loss for each reportable segment presented to the Board on a regular basis is EBITDA.
Operating costs are allocated to segments to the extent they are directly attributable to the activities of that segment. Corporate office costs are included within central costs.
During the year, the Group acquired 100% of the share capital of Opus Energy Group Limited (see note 13), an energy supply business providing electricity and gas to business customers. Its activities are closely-related to those of the existing B2B Energy Supply business and the B2B Energy Supply management structure has been reorganised to integrate Opus Energy into the existing structure. Financial results are reported to the Board for the larger combined business. Accordingly, this new acquisition forms part of the B2B Energy Supply segment in the year ended 31 December 2017. Note 13 details the additional revenue and profit attributable to the Group from the new acquisition.
The Group sold its interest in Billington Bioenergy in the year. The B2B Energy Supply segment includes £6.3 million of revenue and £0.2 million EBITDA losses in respect of this business for the 10-month period to the date of disposal.
Segment revenues and results
The following is an analysis of the Group’s performance by reporting segment for the year ended 31 December 2017: Year ended 31 December 2017
Power B2B
Energy Pellet Generation Supply Production Adjustments(1) Consolidated £m £m £m £m £m
Total revenue 2,490.9 1,326.4 73.6 (941.1) 2,949.8 Segment gross profit 337.0 23.5 18.1 (2.3) 376.3 Segment EBITDA 173.8 (4.3) (6.3) (2.3) 160.9 Central costs (20.9) Consolidated EBITDA 140.0 Depreciation and amortization (109.5) Losses on disposal (3.8) Unrealised gains on derivative contracts 176.8
Operating profit 203.5 Net finance costs (6.4)
Profit before tax 197.1
Notes:
(1) Adjustments represent the elimination of intra-group transactions.
The accounting policies applied for the purpose of measuring the segments’ profits or losses, assets and liabilities are the same as those used in measuring the corresponding amounts in the Group’s financial statements. The external revenues and results of all the reporting segments are subject to seasonality with higher dispatch and prices in the winter months, compared to summer months.
Capital expenditure by segment
Assets and working capital are monitored on a consolidated basis, however, spend on capital projects is monitored by operating segment.
Capital
additions to
intangible assets
Capital additions
to property, plant and
equipment
Capital additions
to intangible
assets
Capital additions
to property, plant and
equipment 2017 2017 2016 2016 £m £m £m £m
B2B Energy Supply 12.6 17.6 – 4.4 Power Generation 2.4 77.0 0.7 85.7 Pellet Production 0.4 66.2 – 6.7 Corporate unallocated 0.6 3.8 – –
Total 16.0 164.6 0.7 96.8
Total cash outflows in relation to capital expenditure during the year were £175 million (2016: £93 million). The increase in capital expenditure compared to the previous year principally reflects the acquisition of the LaSalle pellet plant and subsequent investment to bring the site into operation in the Pellet Production segment, and investment in office space for Opus Energy in the B2B Energy Supply segment.
Intra-group trading
Intra-group transactions are carried out on arm’s-length, commercial terms that, where possible, equate to market prices at the time of the transaction. During 2017, the Pellet Production segment sold wood pellets with a total value of £135.7 million (2016: £72.9 million) to the Power Generation segment and the Power Generation segment sold electricity, gas and ROCs with a total value of £1,033.4 million (2016: £868.2 million) to the B2B Energy Supply segment.
The impact of all intra-group transactions, including any unrealised profit arising (£9.8 million at 31 December 2017), is eliminated on consolidation. Following the increase in output from Pellet Production during the year and reduced generation in Power Generation at the end of the year, intra-group stocks were higher at the end of 2017 than previously, resulting in an increase in this provision.
Major customers
Total revenue for the year ended 31 December 2017 does not include any amounts from individual customers (2016: amounts of £541.5 million and £399.3 million derived from two customers) that represent 10% or more of total revenue for the year. The Group’s largest two customers contributed 9% and 8% of total consolidated revenue respectively. These revenues arose in the Power Generation segment.
3 REVENUE
Accounting Policy
Revenue represents amounts receivable for goods or services provided in the normal course of business, net of trade discounts, VAT and other sales-related taxes and excluding transactions between Group companies.
Revenues from the sale of electricity from our Power Generation business are measured based upon metered output delivered at rates specified under contract terms or prevailing market rates as applicable.
Two of our biomass-fuelled generating units earn Renewable Obligation Certificates (ROCs) under the UK Government’s Renewables Obligation (RO) regime. The financial benefit of a ROC is recognised in the income
statement at the point the relevant renewable biomass fuel is burnt and power dispatched as a reduction in the cost of the biomass fuel. A corresponding asset is recognised on the balance sheet. Revenue from sale of ROCs is recognised when the ROC is transferred to a third party.
The Group recognises the income or costs arising from the CfD (see below) in the income statement, as a component of revenue, at the point the flow of economic benefit becomes probable. This is considered to be the point at which the relevant generation is delivered and the payment becomes contractually due.
Revenue from the sale of electricity and gas directly to business customers through our B2B Energy Supply businesses, Haven Power and Opus Energy, is recognised on the supply of electricity or gas when a contract exists, supply has taken place, a quantifiable price has been established or can be determined and the receivables are expected to be recovered at the point of sale. Energy supplied is measured based upon metered consumption and contractual rates; however, where a supply has taken place but is not yet measured or billed, the revenue is estimated based on consumption statistics and selling price estimates and is included as accrued income on the balance sheet.
Other revenues derived from the provision of services (for example, the supply of system support services, such as black start and frequency response) to National Grid are recognised by reference to the stage of completion of the contract. Most such contracts are for the delivery of a service either continually or on an ad-hoc basis over a period of time and thus stage of completion is calculated with reference to the amount of the contract term that has elapsed. Depending on the contract terms this approach may require judgement in estimating probable future outcomes.
Other revenues derived from the sale of goods (for example, by-products from electricity generation such as ash and gypsum) are recognised at the point the risks and rewards of ownership pass to the customer, typically at the point of delivery to the customer’s premises.
CfD payments
The Group is party to a Contract for Difference (CfD) with The Low Carbon Contracts Company (LCCC), a Government-owned entity responsible for delivering elements of the Government’s Electricity Market Reform Programme. Under the contract, the Group makes or receives payments in respect of electricity dispatched from a specific biomass-fueled generating unit. The payment is calculated with reference to a strike price of £100 per MWh. The base year for the strike price was 2012 and it increases each year in line with the UK Consumer Price Index and changes in system balancing costs. The strike price at 31 December 2017 was £106 per MWh.
When market prices at the point of generation are above/below the strike price, the Group makes/receives an additional payment to/from LCCC equivalent to the difference between the market power price at the point of dispatch and the strike price. Such payments are in addition to amounts received from the sale of the power in the wholesale market and either increase or limit the total income from the power dispatched from the relevant generating unit to the strike price in the CfD contract.
The year ended 31 December 2017 is the first full year of generation under the CfD contract, which commenced on 21 December 2016.
ROC sales
The generation and sale of ROCs is a key driver of the Group’s financial performance. The RO scheme started in April 2002 and places an obligation on electricity suppliers to source an increasing proportion of their electricity from renewable sources. Under the RO, ROCs are certificates issued to generators of renewable electricity which are then sold to suppliers to demonstrate that they have fulfilled their obligations under the RO. ROCs are managed in compliance periods (CPs), running from April to March annually, CP1 commenced in April 2002. At 31 December 2017 we are in CP16.
To meet its obligations a supplier can either submit ROCs or pay the “buy-out” price at the end of the CP. The buy-out price was set at £30/ ROC in CP1 and rises with inflation. The buy-out price in CP16 is £45.58/ROC. ROCs are typically procured in arm’s-length transactions with renewable generators at a market price typically slightly lower than the buy-out price for that CP. At the end of the CP, the amounts collected from suppliers paying the buy-out price form the “recycle fund”, which is distributed on a pro-rata basis to ROC generators.
The financial benefit of a ROC recognised in the income statement at the point of generation is thus comprised of two parts: the expected value to be obtained in a sale transaction with a third party supplier and the expected recycle fund benefit to be received at the end of the CP.
Further analysis of our revenue for the year ending 31 December 2017 is provided in the table below: Year ended 31 December 2017
External Intra-group Total £m £m £m
Power Generation Electricity sales 1,030.9 774.5 1,805.4 ROC and LEC sales 367.8 258.9 626.7 CfD income 248.2 – 248.2 Ancillary services 30.7 – 30.7 Other income 8.6 – 8.6
B2B Energy Supply Electricity and gas sales 1,933.9 – 1,933.9 Pellet sales 6.3 – 6.3 Other income 58.8 – 58.8
Pellet Production Pellet sales – 135.7 135.7
Elimination of intra-group sales – (1,169.1) (1,169.1)
Total consolidated revenue 3,685.2 – 3,685.2
The B2B Energy Supply segment includes £6.3 million of revenue representing 10 months of sales of wood pellets into the domestic UK heat market via Billington Bioenergy (2016: £6.7 million). This business was sold on 31 October 2017.
The following is an analysis of the Group’s revenues in the year ended 31 December 2016: Year ended 31 December 2016
External Intra-group Total £m £m £m
Power Generation Electricity sales 1,193.4 686.5 1,879.9 ROC and LEC sales 366.7 181.7 548.4 CfD income 10.3 – 10.3 Ancillary services 47.3 – 47.3 Other income 5.0 – 5.0
B2B Energy Supply Electricity and gas sales 1,319.6 – 1,319.6 Pellet sales 6.7 – 6.7 Other income 0.1 – 0.1
Biomass Supply Pellet sales – 72.9 72.9 Other income 0.7 – 0.7
Elimination of intra-group sales – (941.1) (941.1)
Total consolidated revenue 2,949.8 – 2,949.8
4 REVIEW OF FIXED ASSETS FOR IMPAIRMENT
Accounting policy
The Group reviews its fixed assets (or, where appropriate, groups of assets known as cash-generating units (CGUs)) whenever there is an indication that an impairment loss may have been suffered. The Group assesses the existence of indicators of impairment annually. The Group considers the smallest collections of assets that generate independent cash flows to be its operating entities (Drax Power, Haven Power, Opus Energy and Drax Biomass) and accordingly considers the Group to be comprised of four CGUs.
If an indication of potential impairment exists, the recoverable amount of the asset or CGU in question is assessed with reference to the present value of the future cash flows expected to be derived from the continuing use of the asset or CGU (value in use) or the expected price that would be received to sell the asset to another market participant (fair value less costs to sell). The initial assessment of recoverable amount is normally based on value in use.
Where value in use is calculated, the assessment of future cash flows is based on the most recent approved business plan and includes all of the necessary costs expected to be incurred to generate the cash inflows from the CGU’s assets in their current state and condition, including an allocation of centrally managed costs. Central costs are only allocated where they are necessary for and directly attributable to the CGU’s activities. Future cash flows include, where relevant, contracted cash flows arising from our cash flow hedging activities and as a result the carrying amount of each CGU includes the mark-to-market value of those cash flow hedges.
The additional value that could be obtained from enhancing or converting the Group’s assets is not reflected, nor the potential benefit of any future restructuring or reorganisation. In determining value in use, the estimate of future cash flows is discounted to present value using a pre-tax rate reflecting the specific risks attributable to the CGU in question.
If the recoverable amount is less than the current carrying amount in the financial statements, a provision is made to reduce the carrying amount of the asset or CGU to the estimated recoverable amount. Impairment losses are recognised immediately in the income statement.
Goodwill balances are assessed for impairment annually (see note 14).
Assessment of indicators of impairment
The Group’s market capitalisation has remained below the carrying value of its net assets this year. As part of the most recent annual review, the Group considered this and concluded that a potential indicator of impairment existed in respect of the Drax Power CGU. This assessment was based upon continued weakness in commodity markets, volatility in foreign exchange rates, perceived levels of regulatory uncertainty and the sensitivity of the recoverable amount of Drax Power’s assets to changes in these factors.
Accordingly, an impairment review of the Drax Power CGU was undertaken at the balance sheet date. A review of other CGUs suggested no indicators of impairment.
Significant estimation uncertainty
The assessment of the present value of future cash flows on which such a review is based is dependent upon a number of assumptions. In particular, expected future cash flows are based upon management’s estimates of future prices, output, costs, economic support for renewable energy generation and access to contracts for electricity generation and supply. Where relevant and to the fullest extent possible, the key assumptions are based on observable market information. However, observable market information is only available for a limited proportion of the remaining useful lives of the assets under review.
Impairment review
The carrying amount of the Drax Power CGU at 31 December 2017 was £1,430 million. The value in use of the Drax Power CGU was tested using the Group’s established planning model.
The analysis assumed that Drax Power’s three biomass-fueled generating units will continue in operation until the end of their estimated useful lives, currently considered to be 2039. In line with our assumption that coal-fired generation will cease by 2025, applied in light of the Government’s announced intention to close coal-fired generation following recent consultations, the three remaining coal-fired units were assumed to cease coal-fired generation by this date but will then be available for conversion to alternative fuels. No account has been taken of any cash inflows that could result from such a conversion (which could take place earlier than 2025) in measuring the value in use of the Drax Power CGU. This includes potential cash flows arising from the fourth unit conversion to biomass and possible repowering of the fifth and sixth units to gas.
The analysis depends on a broad range of assumptions, including the expected life of the six power generating units and the regulatory regime under which they might operate. The key assumptions (i.e. those most sensitive to a change, possibly resulting in a different outcome for impairment) are considered to be:
– The expected operating lives of the six generating units, as described above;
– Future commodity prices beyond the horizon of our existing contracted purchase and sale commitments, notably power prices and biomass prices;
– Future foreign exchange rates beyond the horizon of our existing contracted purchase commitments; and
– The continuance of existing biomass support regimes – CfD and RO – until 2027 and the existence of a favourable economic environment for biomass generation thereafter. This includes future Capacity Market and system support revenues.
These assumptions are all dependent on external market movements. The historic volatility in these assumptions is reflected in the financial performance of the Group but past performance is not necessarily a reliable indicator of future values.
Where available, estimates of future prices are based on signed contracts for purchases and sales with third parties. Intra-group purchases of biomass are included at contract prices which are based on our view of future market prices. Transactions beyond contracted positions are valued using market data and forward price curves, based where possible on data points provided by a reputable third party source, independent to the Group. In particular, longer-term power prices are based on assumptions from Aurora Energy Research. The contracted period for biomass purchases is substantially longer, with the longest-dated contracts expiring in 2027. Beyond this point, estimated biomass prices are largely based on our internal models which reflect our assessment of future market prices.
Future foreign exchange rates are based on contracted foreign currency purchases to the extent possible. Beyond our contracted position, exchange rate estimates are based on market forward curves.
Current Government plans for existing renewable support mechanisms, namely the CfD and RO, assume these cease in 2027. The impairment analysis made no assumptions regarding the direct replacement of these support mechanisms beyond this date. The biomass-fueled units that are assumed to continue to generate power do so supported by the prevailing wholesale power price, delivery of ancillary services to the UK grid and an expectation that capacity market revenues will be available to these units. Our power price forecasts reflect increased volatility between peak and baseload prices. Assumed revenues from ancillary services and the capacity market are based on projections derived from current contracts and capacity market outcomes and how we expect the market to evolve. These assumptions reflect our expectation that Drax will be required to provide generation to support intermittent renewable power and be an essential part of the UK’s energy mix throughout the life of the units.
The expected future cash flows were discounted using a pre-tax nominal rate of 7.3%. The discount rate is supported by observable market reports and independent analysis commissioned by, and specific to the circumstances, of the Group and the Power Generation business. This indicated that the recoverable amount of the Drax Power CGU exceeded its carrying value and therefore that no provisions for impairment were required.
Sensitivity analysis indicated that, when compared to our base case assumptions, a reduction of approximately 21% in market power prices, an increase in biomass prices of approximately 31%, or a depreciation of Sterling against the US dollar of approximately 24% throughout the 22-year term of the valuation would result in a recoverable amount for the Drax Power CGU that is lower than its carrying amount. Furthermore, the valuation includes cash flows for the period from 2027-2039 in line with the assumed useful economic lives of the assets. If the value from this period was removed in its entirety, it would not result in an impairment charge. The analysis does not consider the interaction effect of potential changes in several or all of the assumptions simultaneously, and the sensitivities do not take account of any mitigating actions that could be taken should the changes referred to materialise. In addition, in relation to central costs, no reasonable change in the method of allocation would result in an impairment charge.
5 NET FINANCE COSTS
Finance costs reflect expenses incurred in managing our debt structure (such as interest payable on our bonds) as well as foreign exchange gains and losses, the unwinding of discounting on provisions for reinstatement of our sites at the end of their useful lives and net interest charged on the Group’s defined benefit pension scheme obligation. These are offset by interest income that we generate through efficient use of short-term cash surpluses – for example through investment in money market funds.
On 5 May 2017, the Group refinanced its external debt. The resulting cost of £24.2 million (2016: £Nil) reflects the costs incurred to extinguish the existing debt together with the release of the related deferred borrowing costs. As described in note 7, these costs have been excluded from the calculation of underlying earnings. Further information about the new finance structure can be found in note 11. Year ended 31
December
2017 2016 £m £m
Interest payable and similar charges: Interest payable on borrowings (25.6) (19.4) Unwinding of discount on provisions (0.7) (4.5) Amortisation of deferred finance costs (3.5) (2.1) Net finance cost in respect of defined benefit scheme (0.5) (0.9) Other financing charges (1.2) (2.1)
Total interest payable and similar charges (31.5) (29.0) Interest receivable: Interest income on bank deposits 0.2 0.6
Total interest receivable 0.2 0.6
Foreign exchange (losses)/gains (10.6) 22.0
Total recurring net interest charge (41.9) (6.4)
One-off costs of debt restructure: Fees to exit existing facilities (13.8) – Acceleration of deferred costs in relation to previous facilities (10.4) –
Total one-off net interest charge (24.2) –
Total net interest charge (66.1) (6.4)
Foreign exchange gains and losses recognised in interest arise on the retranslation of non-derivative balances and investments denominated in foreign currencies to prevailing rates at the balance sheet date. Sterling strengthened against the US dollar and Euro during 2017, resulting in losses being recognised on assets the Group holds denominated in these currencies.
6 CURRENT AND DEFERRED TAXATION
The tax charge includes both current and deferred tax. Current tax is the estimated amount of tax payable on this year’s taxable profits (which are adjusted for items upon which we are not required to pay tax or, in some cases, for items which are not allowable for tax purposes and therefore on which we are required to pay additional tax) and adjusted for estimates for previous years. Deferred tax is an accounting adjustment which reflects where more or less tax is expected to arise in the future due to differences between the accounting and tax rules (reflected in differences between the carrying amounts of assets and liabilities in the balance sheet and the corresponding tax bases used in the computation of taxable profits). The tax credit reflects the estimated effective tax rate on the loss before tax for the Group for the year ended 31 December 2017 and the movement in the deferred tax balance in the year, so far as it relates to items recognised in the income statement.
Accounting policy
Current tax, including UK corporation tax and foreign tax, is based on the taxable profit or loss for the year in the relevant jurisdiction. Taxable profit or loss differs from profit/loss before tax as reported in the income statement because it excludes items of income or expenditure that are either taxable or deductible in other years or never taxable/deductible. The Group’s liability (or asset) for current tax is provided at amounts expected to be paid (or recovered) using the tax rates and laws that have been enacted or substantively enacted by the balance sheet date.
Deferred tax is the tax expected to be payable or recoverable on differences between the carrying amounts of assets and liabilities in the financial statements and the corresponding tax bases used in the computation of taxable profit. Deferred tax liabilities are generally recognised for all taxable temporary differences and deferred tax assets are recognised to the extent that it is probable that taxable profits will be available against which deductible temporary differences can be utilised.
Current and deferred tax are recognised in profit or loss, except when they relate to items that are recognised in other comprehensive income or directly in equity, in which case, the current and deferred tax are recognised in other comprehensive income or directly in equity respectively.
Significant estimation uncertainty
In accounting for taxation the Group makes assumptions regarding the treatment of items of income and expenditure for tax purposes. The Group believes that these assumptions are reasonable based on prior experience and consultation with advisers. Full provision is made for deferred taxation at the rates of tax prevailing at the period end date unless future rates have been substantively enacted. Deferred tax assets are recognised where it is considered more likely than not that they will be recovered. Where such assets relate to losses incurred by a business unit, particularly one with a history of losses, the Group seeks evidence other than its own internal forecasts to support recognition of the related deferred tax asset. Year ended 31
December
2017 2016 £m £m
Tax (credit)/charge comprises: Current tax – Current year 20.3 14.7 – Adjustments in respect of prior periods (10.6) (6.2) Deferred tax – Before impact of tax rate changes (57.5) 4.5 – Impact of tax rate changes 15.7 (9.8)
Tax (credit)/charge (32.1) 3.2
Year ended 31
December
2017 2016 £m £m
Tax charged/(credited) on items recognised in other comprehensive income: Deferred tax on actuarial gains/(losses) on defined benefit pension scheme 4.1 (1.6) Deferred tax on cash flow hedges (39.9) 59.6
(35.8) 58.0
UK corporation tax is the main rate of tax for the Group and is calculated at 19.25% (2016: 20%) of the assessable profit or loss for the year. Tax for other jurisdictions is calculated at the rates prevailing in the respective jurisdictions.
Deferred tax is calculated at the tax rates that are expected to apply in the period when the liability is settled or the asset is realised based on jurisdictional tax laws and rates that have been enacted or substantively enacted at the balance sheet date. In December 2017, US Tax Reforms were legislated and introduced a package of tax measures, including a reduction in the US federal tax rate from 35% to 21% from January 2018.
This rate reduction has been reflected in the US deferred tax balances at 31 December 2017. We do not anticipate any other impact of the US Tax Reforms on the deferred tax balances.
The tax charge for the year can be reconciled to the loss before tax as follows: Year ended 31
December
2017 2016 £m £m
(Loss)/profit before tax (183.2) 197.1
(Loss)/profit before tax multiplied by the rate of corporation tax in the UK of 19.25% (2016: 20%)
(35.3) 39.4
Effects of: Adjustments in respect of prior periods (11.8) (3.6) Expenses not deductible for tax purposes 1.3 1.7 Impact of change to tax rate 15.7 (9.8) Difference in overseas tax rates (3.0) (4.8) Deferred tax on prior year start up losses and other temporary differences – (21.4) Other 1.0 1.7
Total tax (credit)/charge (32.1) 3.2
The Group’s underlying effective tax rate is sensitive to the mix of operating results between our UK and US businesses and the tax rates which apply in those jurisdictions. However, as a result of the reduction in the US federal tax rates from 2018 to 21%, and tax relief now arising to the group from the UK Patent Box regime (see below). In the medium term we anticipate our group underlying effective tax rate to be marginally lower than the main rate of corporation tax in the UK.
The adjustments in respect of prior periods principally relate to a Patent Box claim. Drax Power was granted a patent to protect certain intellectual property it owns and which attaches to the technology developed to manage the combustion process in generating electricity from biomass. Under UK tax legislation the Company is now entitled to apply a lower rate of tax to some of its profits each year which are derived from utilisation of that technology. The Company has agreed a claim with HMRC for tax relief covering the period from the patent application in 2013 to 2016 amounting to £10.4 million. In line with the policy intentions of IFRIC 23 “Uncertainty over Income Tax Treatments”, the Group has also recognised an estimated benefit from the tax regime for the financial year 2017 of £2.6 million (included in the ‘Other’ line in the table above).
The movements in deferred tax assets and liabilities during each year are shown below.
Deferred tax (liabilities)/assets Accelerated Financial capital Non-trade Intangible Trade Other Other instruments allowances losses assets losses liabilities assets Total £m £m £m £m £m £m £m £m
At 1 January 2016 (7.3) (162.5) 1.5 – – (30.9) 7.3 (191.9)
(Charged)/credited to the income statement
(33.9) (7.1) (1.5) – 35.3 5.3 7.2 5.3
Charged to equity in respect of actuarial gains
– – – – – – 1.6 1.6
Charged to equity in respect of cash flow hedges (59.6) – – – – – – (59.6)
Effect of changes in foreign exchange rates
– (1.3) – – 3.5 – 0.7 2.9
At 1 January 2017 (100.8) (170.9) – – 38.8 (25.6) 16.8 (241.7)
Acquisition of Opus Energy – – – (40.7) – – – (40.7)
(Charged)/credited to the income statement
29.7 8.7 – 7.5 (8.5) 7.1 (2.7) 41.8
Charged to equity in respect of actuarial gains
– – – – – – (4.1) (4.1)
Charged to equity in respect of cash flow hedges 39.9 – – – – – – 39.9
Effect of changes in foreign exchange rates
– 1.2 – – (3.4) – (0.3) (2.5)
At 31 December 2017 (31.2) (161.0) – (33.2) 26.9 (18.5) 9.7 (207.3)
Deferred tax balances (after offset) for financial reporting purposes:
Deferred tax assets and liabilities are offset where the Group has a legally enforceable right to do so, otherwise are shown separately in the balance sheet.
Within the above deferred tax balances is a net deferred tax asset of £22.7 million in relation to start-up losses and other temporary differences in the US-based Pellet Production business. Based on its business plan and reflecting continuing improvement in operational performance, the Group anticipates generating sufficient profits in future periods against which to utilise this asset.
7 UNDERLYING EARNINGS
Following the announcement of the change in the Group’s dividend policy on 15 June 2017, there is no longer a link between underlying earnings and the calculation of distributions. We have continued to present underlying earnings, an alternative performance measure, to provide a consistent, comparable measure of the overall financial performance of the Group year on year.
Underlying earnings is defined as profit after tax, as measured in accordance with IFRS, adjusted to exclude unrealised gains and losses on derivative contracts and material one-off items that do not reflect the underlying performance of the business.
This note analyses the items which are included in our results for the year but are excluded from underlying earnings:
– Unrealised gains and losses on derivative contracts: calculated in accordance with IAS 39 on derivative contracts not designated into hedge relationships for accounting purposes but held for the purposes of de-risking future cash flows, excluded due to their inherent volatility which does not reflect current operational performance
– Acquisition-related costs: material one-off costs associated with the acquisition and on-boarding of Opus Energy during 2017
– Cost of debt restructure: material one-off costs incurred as part of the restructuring of the Group’s debt in May 2017
– In 2016, deferred tax on start-up losses and other temporary differences: a material one-off credit arising from the recognition of a deferred tax asset relating to the Pellet Production business.
Year ended 31 December
2017 2016 £m £m
Earnings: Earnings attributable to equity holders of the Company for the purposes of basic
and diluted earnings (151.1) 193.9
Adjusted for: Unrealised losses/(gains) on derivative contracts 156.1 (176.8) Acquisition-related costs 7.8 – Cost of debt restructure 24.2 – Tax impact of the above items (34.3) 33.9
Deferred tax on start-up losses and other temporary differences – (30.5)
Underlying profit after tax attributable to equity holders of the Company 2.7 20.5
8 EARNINGS PER SHARE AND UNDERLYING EARNINGS PER SHARE
Earnings per share (EPS) represents the amount of our earnings (post-tax profits) that is attributable to each ordinary share we have in issue. Basic EPS is calculated by dividing our earnings (profit after tax calculated in accordance with IFRS) by the weighted average number of ordinary shares that were in issue during the year. Diluted EPS demonstrates the impact if all outstanding share options (such as those to be issued under our employee share schemes), that are expected to vest on their future maturity dates, were exercised and treated as ordinary shares as at the balance sheet date.
In addition to EPS, we calculate underlying EPS. Underlying EPS is based upon underlying earnings as defined in note 7.
The effect of potentially dilutive options on the weighted average number of shares in issue at the balance sheet date is shown below: Year ended 31
December
2017 2016
Number of shares: Weighted average number of ordinary shares for the purposes of basic earnings per share (millions)
406.8 406.6
Effect of dilutive potential ordinary shares under share plans 3.5 2.7
Weighted average number of ordinary shares for the purposes of diluted earnings per share (millions)
410.3 409.3
Earnings per share – basic (pence) (37.2) 47.7
Earnings per share – diluted (pence) (36.8) 47.4
Underlying earnings per share – basic (pence) 0.7 5.0
Underlying earnings per share – diluted (pence) 0.7 5.0
9 RETAINED PROFITS
Retained profits are a component of our equity reserves. The overall balance reflects the total profits we have generated over our lifetime, reduced by the amount of that profit we have distributed to our shareholders. The table below sets out the movements in our retained profits during the year.
Year ended 31 December
2017 2016 £m £m
At 1 January 566.5 385.2 (Loss)/profit for the year (151.1) 193.9 Actuarial gains/(losses) on defined benefit pension scheme 21.4 (8.4) Deferred tax on actuarial gains/(losses) on defined benefit pension scheme (4.1) 1.6 Equity dividends paid (21.6) (11.0) Net movements in equity associated with share-based payments 6.1 5.2
At 31 December 417.2 566.5
Distributable profits
The capacity of the Group to make dividend payments is primarily determined by the availability of retained distributable profits and cash resources.
The immediate cash resources of the Group of £222 million and the recent history of cash generation are shown in note 12. The majority of these cash resources are held centrally within the Group by Drax Corporate Limited.
The Parent Company financial statements disclose the Parent Company’s distributable reserves of £230 million. Sufficient reserves are available across the Group as a whole to make future distributions in accordance with the Group’s updated dividend policy for the foreseeable future.
The majority of the Group’s distributable reserves are held in holding and operating subsidiaries. Management actively monitors the level of distributable reserves in each company in the Group, ensuring adequate reserves are available for upcoming dividend payments and that the parent company has access to these reserves.
The Group’s new financing facilities (see note 11) place certain conditions on the value of dividend payments to be made in any given year. We expect to be able to make dividend payments, in line with our new policy, within these conditions for the foreseeable future.
10 RECONCILIATION OF NET DEBT
Net debt is calculated by taking our borrowings and subtracting cash and cash equivalents. The table below reconciles net debt in terms of changes in these balances across the year.
Years ended 31 December
2017 2016 £m £m
Net debt at 1 January (93.5) (186.6) (Decrease)/increase in cash and cash equivalents (4.0) 86.7 Increase in borrowings (267.8) (1.5) Effect of changes in foreign exchange rates (2.1) 7.9
Net debt at 31 December (367.4) (93.5)
A reconciliation of the increase in borrowings during the year is set out in the table below.
11 BORROWINGS
On 10 February 2017 the Group entered into a £375 million acquisition finance facility, of which £200 million was drawn and utilised in the purchase of Opus Energy (see note 13). This facility, along with the existing term loans at 1 January 2017, was repaid in full on 5 May 2017, when the Group undertook a refinancing exercise.
The new financing structure consists of £550 million of high-yield publicly-traded bonds listed on the Luxembourg exchange. This includes £350 million 4.25% fixed rate notes and £200 million floating rate notes of 4.00% above LIBOR, which all mature in April 2022.
On the same day the Group entered into a £350 million Facility comprised of a revolving credit facility (RCF) with a value of £315 million (2016: £400 million) and an index-linked term loan of £35 million.
The RCF matures in April 2021, with an option to extend by one year, and has a margin of 150 basis points over LIBOR. At 31 December 2017, the RCF had been utilised to draw down letters of credit with a total value of £35.7 million (2016: 57.9 million).
The Group also has access to a $25 million revolving 30 day facility in the US business. This facility was fully drawn down at 31 December 2017 and had a sterling equivalent value of £18.5 million at that date.
The term loan was fully drawn at inception and remains fully drawn at 31 December 2017 (2016: term loans of £325 million fully drawn).
The Group has no other undrawn debt facilities, although it does have access to certain non-recourse trade receivable finance facilities as described on note 12 which are utilised to accelerate working capital cash flows.
Accounting policy
The Group measures all debt instruments (whether financial assets or financial liabilities) initially at fair value, which equates to the principal value of the consideration paid or received. Subsequent to initial measurement, debt instruments are measured at amortised cost using the effective interest method. Transaction costs (any such costs incremental and directly attributable to the issue of the financial instrument) are included in the calculation of the effective interest rate and are amortised through the income statement over the life of the instrument.
Fees paid on the establishment of loan facilities are recognised as transaction costs of the loan to the extent that it is probable that some or all of the facility will be drawn down. Where this is the case, the fee is deferred until the draw-down occurs.
Analysis of borrowings
An analysis of the changes in borrowings during the year is shown in the table below:
As at 31 December 2017
Borrowings before deferred Deferred Net finance costs finance costs borrowings £m £m £m
Borrowings at 1 January 329.0 (7.1) 321.9 Draw down of Opus Energy Acquisition Facility 200.0 (3.8) 196.2 Draw down of US Facility 18.5 – 18.5 Borrowings repaid on 5 May 2017 (493.8) 10.9 (482.9) Fixed rate loan notes drawn down 350.0 (11.4) 338.6 Floating rate loan notes drawn down 200.0 (6.5) 193.5 Indexation of linked loan 1.8 – 1.8 Amortisation of deferred finance costs (note 5) – 2.4 2.4 Changes in finance lease liabilities (0.3) – (0.3)
Borrowings at 31 December 605.2 (15.5) 589.7
The tables below summarise the Group’s borrowings at the year end: As at 31 December 2017
Borrowings Net before deferred Deferred finance costs finance costs borrowings £m £m £m
Loan notes 550.0 (15.5) 534.5 Term loans 35.9 – 35.9 US revolving facility 18.5 – 18.5 Finance lease liabilities 0.8 – 0.8 Total borrowings 605.2 (15.5) 589.7 Less current portion (18.6) – (18.6) Non-current borrowings 586.6 (15.5) 571.1
As at 31 December 2016
Borrowings before deferred Deferred Net finance costs finance costs borrowings £m £m £m
Term loans 327.9 (7.1) 320.8 Finance lease liabilities 1.1 – 1.1 Total borrowings 329.0 (7.1) 321.9 Less current portion (37.9) 2.0 (35.9)
Non-current borrowings 291.1 (5.1) 286.0
The borrowings from the refinance exercise in May, including the term loan, the loan notes and the RCF are secured against the assets of a number of the Group’s subsidiaries, with the exception of the US subsidiary’s land and buildings.
In addition, the Group has a secured commodity trading line, which allows us to transact prescribed volumes of commodity trades without the requirement to post collateral and FX trading lines with certain banks. Counterparties to these arrangements are entitled to share in the security as described above. At 31 December 2017, the value of security provided under these arrangements was £3.6 million (2016: £0.9 million).
The US revolving facility is unsecured.
12 CASH GENERATED FROM OPERATIONS
Cash generated from operations is the starting point of our cash flow statement. The table below makes adjustments for any non-cash accounting items to reconcile our net profit for the year to the amount of cash we have generated from our operations.
Years ended 31 December
2017 2016 £m £m
(Loss)/profit for the year (151.1) 193.9 Adjustments for: Interest payable and similar charges 66.3 7.0 Interest receivable (0.2) (0.6) Tax (credit)/charge (32.1) 3.2 Depreciation & amortisation 167.2 109.5 Losses on disposal 14.5 3.8 Unrealised losses/(gains) on derivative contracts 156.1 (176.8) Other losses 0.4 – Defined benefit pension scheme current service cost 7.3 6.0 Non-cash charge for share-based payments 6.1 5.2 Close out of currency contracts(1) (9.8) 14.0
Operating cash flows before movement in working capital 224.7 165.2
Changes in working capital: Decrease/(increase) in inventories 15.4 (63.5) Decrease in receivables 60.6 28.6 (Decrease)/increase in payables (22.4) 73.7
Decrease in carbon assets 0.6 11.1 Decrease in ROC assets 112.1 12.5
Total cash released from working capital 166.3 62.4
Defined benefit pension scheme contributions (15.3) (14.5)
Cash generated from operations 375.7 213.1
Note:
(1) During 2016 we closed out a number of in-the-money forward foreign currency purchase contracts with a total value of £14 million. As these contracts were designated into hedge accounting relationships under IAS 39, the benefit is being recognised in the income statement in the period the hedged transaction occurs. The net loss for 2017 includes £10 million of income in relation to the unwinding of this position, for which the cash was received in 2016.
The Group has access to a facility that enables it to accelerate the cash flows associated with trade receivables arising from B2B Energy Supply sales on a non-recourse basis. The net cash benefit derived from this facility during 2017 was £110 million (2016: £74 million) and is recognised as a reduction in receivables in the table above. We estimate that approximately 30% of this cash would have been received in the ordinary course of business by 31 December 2017 had the facility not been in place.
The Group also has access to similar non-recourse facilities to accelerate cash flows on ROC receivables. No ROC receivables have been sold through these facilities in 2017 (2016: net cash benefit of £111 million). The reduction in ROCs in the table above reflects reduction in the number of generation units that give rise to ROCs following the approval of the CfD contract for one of our biomass-fuelled units in December 2016, and the increase in ROCs sold during the year.
13 ACQUISITIONS
Accounting policy
Acquisitions of businesses are recognised at the point the Group obtains control of the target (the acquisition date). The consideration transferred and the assets and liabilities acquired are measured at their fair value on the acquisition date. The assets and liabilities acquired are recognised in the Consolidated balance sheet and the profits of the acquired business are recognised in the Consolidated income statement from the acquisition date. Acquisition-related costs are recognised in the income statement in the period the acquisition occurs in the transaction costs line. Goodwill is measured as the excess of the fair value of the consideration transferred over the fair value of the identifiable net assets acquired.
Acquisition of Opus Energy Group Limited (Opus Energy)
The acquisition of Opus Energy was approved by shareholders on 8 February 2017 and subsequently completed on 10 February 2017, the Group acquired 100% of the issued share capital on this date.
Opus Energy is a well-established B2B energy supply business serving business customers principally in the SME market providing diversification of our Retail offering and a robust platform for growth in line with our strategy. Opus Energy has contributed positively to earnings and cash flow immediately following the acquisition.
The purchase consideration was £340 million plus interest calculated on the amount of Opus Energy’s net assets from 31 March 2016 to the acquisition date. The total consideration of £367 million was funded by a combination of existing cash reserves (£167 million) and partial drawing of a £375 million acquisition facility (£200 million). This facility was repaid as part of the refinancing.
Acquisition-related costs amounted to £7.8 million.
Following a detailed exercise to review the assets and liabilities, including intangible assets, the fair values acquired were as follows: Opus
Total identifiable intangible assets 224.2 Deferred tax liability (40.7) Total identifiable net assets 208.1
Goodwill 159.2
Fair value of consideration payable 367.3
The revenue and results of Opus Energy from the date of acquisition to the year end were as follows: Income statement items for the period from 10 February to 31 December 2017
Revenue 610.7 EBITDA 28.9 Profit 22.5
The figures above have changed from those disclosed in the Interim Financial statements published on 19 July 2017. The Group has continued to review and align estimates for the B2B Energy Supply business. This process resulted in a number of remeasurements reducing the fair value of the net assets acquired by £4.4 million, with a corresponding increase in goodwill. The values shown above are now final.
Following the acquisition, the Group has been able to identify and measure the fair value of existing customer contracts, the Opus Energy brand and software. The assets will be amortised over their useful economic lives as follows:
– Existing customer contracts 11 years (reducing balance)
– Brand 10 years (straight line)
– Software 3 years (straight line)
The fair value measurement of the existing customer contracts requires assumptions to be made, in particular regarding margins on current customer contracts, future contract renewal rates and future margins on renewed contracts. The goodwill of £159 million recognised on acquisition is largely reflective of potential customer contracts and growth opportunities together with the assembled workforce. None of the goodwill is deductible for tax purposes.
The financial assets acquired include £130 million of receivables, the majority of which reflect trade receivables for energy supplied to customers. By virtue of their short tenor, the fair value of these receivables is considered to be the contractual amounts receivable less any provision for doubtful debts. The provision for doubtful debts as at the acquisition date was £20 million.
Additional financial information
The consolidated results of the Group, assuming Opus Energy had been acquired at the beginning of the year, would show revenue of £3,775.7 million (compared to reported revenue of £3,685.2 million), EBITDA of £231.6 million (compared to the reported EBITDA of £228.9 million) and a loss after taxation of £149.0 million (compared to reported loss after taxation of £151.1 million). This information includes the revenue and profits made by Opus Energy between 1 January 2017 and 10 February 2017, without accounting policy alignments and/or the impact of fair value uplifts resulting from acquisition accounting adjustments. This information is not necessarily indicative of the results of the combined Group that would have occurred had the acquisition actually been made at the beginning of the year, or indicative of the future results of the combined Group.
14 GOODWILL
Goodwill arises on the acquisition of a business when the consideration paid exceeds the fair value of the assets acquired. During 2017, we recognised additional goodwill on the purchase of Opus Energy (see note 13), and wrote off goodwill of £3.8 million in respect of Billington Bioenergy following the sale of the business.
Accounting policy
Goodwill is initially recognised and measured at the acquisition date. Goodwill is not amortised but reviewed for impairment at least annually. For the purpose of impairment testing, goodwill is allocated to the CGU to which it relates and the recoverable amount for that CGU assessed. The table below shows movements and balances: Goodwill £m
Cost and carrying amount: At 1 January 2016, 31 December 2016 and 1 January 2017 14.5 Acquisition of Opus Energy 159.2 Disposal of Billington Bioenergy (3.8)
At 31 December 2017 169.9
Goodwill
Total goodwill in the Consolidated balance sheet at 31 December 2017 was £170 million, with £11 million arising on the acquisition of Haven Power in 2009 attributed to the Haven Power CGU and £159 million arising on the acquisition of Opus Energy in the year attributed to the Opus Energy CGU.
The recoverable amount of the Haven Power and Opus Energy CGUs is measured annually, based on a value in use calculation using the Group’s established planning model. The elements reflected in this calculation are the same as those used for the wider asset impairment review conducted by the Group as at 31 December 2017 and are disclosed in note 4. Cash flows beyond the business plan period are inflated into perpetuity using a growth rate of 1%.
The carrying amount of the Haven Power CGU at 31 December 2017 was £23 million. The expected future cash flows of the CGU were discounted using a pre-tax discount rate of 8.1% (calculated based on independent analysis commissioned by the Group, adjusted to the specific circumstances and risk factors affecting the Group’s B2B Energy Supply business). We believe that this rate reflects the prospects for a well-established B2B Energy Supply business. The value in use of the Haven Power CGU, including the goodwill, was significantly in excess of its carrying amount.
The carrying amount of the Opus Energy CGU at 31 December 2017 was £366 million, including intangible assets with a net book value of £186 million as described in note 15. Following the acquisition in 2017, the appropriate discount rate was assessed as being higher for Opus Energy than for Haven Power. The expected future cash flows were discounted using a range of discount rates from the Group’s central B2B Energy Supply assumption (8.1%) to the rate used in the valuation of Opus Energy at the acquisition date (10.7% - see note 13). The application of discount rates across this range does not result in a recoverable amount for Opus Energy below its carrying amount.
The Group has conducted a sensitivity analysis of the estimates of future cash flows of each CGU. This analysis indicates that any reasonably possible change in the key assumptions, which are customer margins and supply volumes, would not cause an impairment loss in respect of goodwill.
15 INTANGIBLE ASSETS
Intangible assets are not physical in nature but are identifiable and separable from other assets. Intangible assets can be acquired in business combinations (such as the acquisition of Opus Energy during 2017) or purchased separately. The Group routinely purchases computer software and carbon emissions allowances, which are considered intangible assets.
Accounting policy
Intangibles acquired in business combinations are measured at fair value on the acquisition date. Other intangible assets are measured at cost. Cost comprises the purchase price (net of any discount or rebate) and any directly attributable costs to bring the asset into the condition and location required for use as intended by management.
Intangible assets are amortised over their anticipated useful lives. Useful lives are reviewed at each balance sheet date. No changes to useful lives were made as at 31 December 2017. Amortisation calculations are specific to each category of assets and are explained in further detail below.
Carrying amounts are assessed for indicators of impairment at each balance sheet date. The customer-related assets and brand are attributed to the Opus Energy CGU and details of the impairment test relating to this CGU are included in note 14.
Significant estimation uncertainty
The valuation of the intangible assets recognised on the acquisition of Opus Energy is dependent upon a number of assumptions. The most significant of these assumptions are explained under each of the asset headings below.
Customer related assets
Brand Computer software
Development assets
Carbon Total
£m £m £m £m £m £m
Cost and carrying amount: At 1 January 2016 – – – – 11.8 11.8 Utilised in period – – – – (11.8) (11.8) Additions at cost – – – – 0.7 0.7 Acquisition of OCGT projects – – – 21.0 – 21.0
At 1 January 2017 – – – 21.0 0.7 21.7
Transferred from PPE – – 39.4 – – 39.4 Utilised in period – – – – (0.7) (0.7) Additions at cost – – 16.0 – – 16.0 Acquisition of Opus Energy (note 13) 211.0 11.3 2.6 – – 224.9
At 31 December 2017 211.0 11.3 58.0 21.0 – 301.3
Accumulated amortization
At 1 January 2016 – – – – – –
Charge for period – – – – – –
At 1 January 2017 – – – – – –
Transferred from PPE – – 25.0 – – 25.0
Acquisition of Opus Energy – – 0.7 – – 0.7
Charge for period 35.6 1.1 6.9 – – 43.6
At 31 December 2017 35.6 1.1 32.6 – – 69.3
Net Book Value
At 31 December 2016 – – – 21.0 0.7 21.7
At 31 December 2017 175.4 10.2 25.4 21.0 – 232.0
Customer related assets
Customer-related assets reflect the value of customer contracts acquired on the acquisition of Opus Energy in February 2017, which provided the Group with access to a broad customer base with contracted cash flows. The asset valuation of £211 million reflects the estimated acquisition-date value of the future cash flows associated with this customer base and is dependent upon estimates of both current and expected future contract margins and assumed customer retention rates. The cash flows have been discounted using a pre-tax discount rate of 10.7%. The asset has a useful life of 11 years, calculated based on customer churn-rate analysis, and is being amortised on a reducing balance basis to reflect the diminishing rate of contract renewals over time.
Opus Brand
The Opus brand was acquired as part of the acquisition in February 2017, and valued at £11 million on a relief-from-royalty method. The brand is being amortised on a straight-line basis over its assumed ten-year useful life.
Computer software
In light of continued investment and the increased significance of the carrying amount, the Group’s software assets are presented separately within intangible assets (2016: included within tangible fixed assets). Additions in the period include assets acquired in the Opus Energy acquisition in addition to those in the ordinary course of business, which principally reflect ongoing investment in business systems to support the B2B Energy Supply segment. Software assets are amortised on a straight-line basis over estimated useful lives ranging between three and five years.
Computer software assets in the course of construction of £11.1 million at 31 December 2017 (2016: £nil million) were capitalised in the year.
Development assets
The development assets arose on the acquisition of four Open Cycle Gas Turbine projects in December 2016 and reflect the value of planning and consents acquired as part of that transaction. Until operations commence, the assets are considered to have an indefinite life and thus are not amortised and will be subject to impairment testing at each balance sheet date.
At 31 December 2017 the recoverable amount of the development assets was established using a value in use calculation derived from the Group’s established planning model, consistent with the approach described in note 4. The assessment incorporated assumptions related to likely capacity market clearing prices, construction costs, the ongoing revenues to be derived from the projects once constructed and the direct costs of generating those revenues. The analysis indicated a recoverable amount for the development assets in excess of their carrying amount.
Carbon assets
Carbon assets arise on the purchase of CO2 emissions allowances in excess of the amount allocated under the Emissions Trading Scheme and required for the current financial year, and are measured at cost, net of any impairment. Given their short tenor, carbon assets are not amortised.
The charge to the income statement, within fuel costs, reflects the cost of emissions allowances required to satisfy the obligation for the current year and takes into account generation and market purchases allocated to the current financial year, and to the extent further purchases are required, the market price at the balance sheet date.
Post balance sheet events
The 2021 T-4 capacity market auction closed in February 2018 at a clearing price of £8.40/kW. The Group secured agreements to provide a total of 1,217MW of capacity from two existing coal units, worth a total of £10 million for the period October 2021 to September 2022.
Two of the Group’s Open Cycle Gas Turbine (OCGT) projects also participated in the auction but exited above the clearing price. The Group will continue to develop these options with an expectation that they will go on to participate in the next T-4 auction. This outcome does not change the Group’s view of the recoverable amount of the existing investments in the OCGT projects or the fair value of the contingent consideration that may become payable following future capacity market outcomes.
GLOSSARY
ADVANTAGED FUELS
Fuel that gives a price advantage against standard bituminous coals. Such fuels include pond fines, off-specification coal and petcoke.
ANCILLARY SERVICES
Services provided to national grid used for balancing supply and demand or maintaining secure electricity supplies within acceptable limits, for example Black Start contracts. They are described in Connection Condition 8 of the Grid Code.
AVAILABILITY
Average percentage of time the units were available for generation.
AVERAGE ACHIEVED PRICE
Power revenues divided by volume of net sales (includes imbalance charges).
BALANCING MECHANISM
The sub-set of the market through which the system operator can call upon additional generation/consumption or reduce generation/ consumption through market participants’ bids and offers, in order to balance the system minute-by-minute.
BARK SPREAD
The difference between the power price and the cost of biomass, net of renewable support.
CARBON PRICE SUPPORT MECHANISM (OR CARBON PRICE FLOOR OR CARBON TAX)
A tax upon fossil fuels (including coal) used to generate electricity. It is charged as a levy on coal delivered to the power station.
CONTRACTS FOR DIFFERENCE (CFD)
A mechanism to support investment in low-carbon electricity generation. The CfD works by stabilising revenues for generators at a fixed price level known as the “strike price”. Generators will receive revenue from selling their electricity into the market as usual. However, when the market reference price is below the strike price they will also receive a top-up payment from suppliers for the additional amount. Conversely if the reference price is above the strike price, the generator must pay back the difference.
DARK GREEN SPREAD
The difference between the power price and the cost of coal and carbon, including CO2 allowances under the EU Emissions Trading Scheme and the UK Carbon Price Support (CPS) Mechanism.
DEPARTMENT FOR BUSINESS, ENERGY AND INDUSTRIAL STRATEGY (BEIS)
The Government department bringing together the responsibilities for business, industrial strategy, science, innovation, energy and climate change (formerly DECC).
EBITDA
Profit before interest, tax, depreciation, amortisation and material one-off items that do not reflect the underlying trading performance of the business.
EU ETS
The EU Emissions Trading System is a mechanism introduced across the EU to reduce emissions of CO2; the scheme is capable of being extended to cover all greenhouse gas emissions.
FEED-IN TARIFF
A long-term contract set at a fixed level where variable payments are made to ensure the generator receives an agreed tariff. The feed-in tariff payment would be made in addition to the generator’s revenues from selling in the market.
FORCED OUTAGE
Any reduction in plant availability, excluding planned outages.
FORCED OUTAGE RATE
The capacity which is not available due to forced outages or restrictions expressed as a percentage of the maximum theoretical capacity, less planned outage capacity.
GRID CHARGES
Includes transmission network use of system charges (TNUoS), balancing services use of system charges (BSUoS) and distribution use of system charges (DUoS).
IFRSS
International Financial Reporting Standards.
LECS
Levy Exemption Certificates. Evidence of CCL exempt electricity supplies generated from qualifying renewable sources.
LEVY CONTROL FRAMEWORK
A control framework for BEIS (formerly DECC) levy-funded spending intended to make sure that BEIS achieves its fuel poverty, energy and climate change goals in a way that is consistent with economic recovery and minimising the impact on consumer bills.
LOAD FACTOR
Net sent out generation as a percentage of maximum sales.
LOST TIME INJURY RATE (LTIR)
The frequency rate is calculated on the following basis: lost time injuries/hours worked x 100,000. Lost time injuries are defined as occurrences where the injured party is absent from work for more than 24 hours.
NET BALANCING MECHANISM
Net volumes attributable to accepted bids and offers in the balancing mechanism.
NET CASH/(DEBT)
Comprises cash and cash equivalents, short-term investments less overdrafts and borrowings net of deferred finance costs.
NET SALES
The aggregate of net volumes attributable to bilateral contracts, power exchange trades and net balancing mechanism.
NET SALES AT NOTIONAL BALANCING POINT (NBP)
Net sales at NBP is the volume of power sold to customers by our Retail business expressed at the NBP. The NBP reflects the volume of power sold before deduction of transmission and distribution losses incurred in transporting this power from the grid to the customer meter.
PLANNED OUTAGE
A period during which scheduled maintenance is executed according to the plan set at the outset of the year.
PLANNED OUTAGE RATE
The capacity not available due to planned outages expressed as a percentage of the maximum theoretical capacity.
POWER EXCHANGE TRADES
Power sales or purchases transacted on the APX UK power trading platform.
ROCS
A Renewable Obligation Certificate (“ROC”) is a certificate issued to an accredited generator for electricity generated from eligible renewable sources. The Renewable Obligation (RO) is currently the main support scheme for renewable electricity projects in the UK.
SUMMER
The calendar months April to September.
SYSTEM OPERATOR
National Grid Electricity Transmission. Responsible for the coordination of electricity flows onto and over the transmission system, balancing generation supply and user demand.
TOTAL RECORDABLE INJURY RATE (TRIR)
The frequency rate is calculated on the following basis: (lost time injuries + worse than first aid injuries)/hours worked x 100,000.
UK NAP
UK National Allocation Plan.
UNDERLYING FINANCIAL MEASURES
We report financial measures described as “underlying” such as profit after tax and earnings per share. Underlying measures are adjusted to exclude unrealised gains and losses on derivative contracts and material one-off items that do not reflect the underlying performance of the business.