73
DRE Agenda • Student Learning Growth – Teacher VAM – School Growth • PYG • Area Scorecards. PYG, and other Performance Indicators
| Date post: | 13-Dec-2015 |
| Category: |
Documents |
| Upload: | gertrude-holmes |
| View: | 217 times |
| Download: | 2 times |

DRE
Agenda
• Student Learning Growth– Teacher VAM– School Growth
• PYG• Area Scorecards. PYG, and other
Performance Indicators

DRE
Florida Department of Education’s Florida Department of Education’s “Value-Added Model (VAM)” “Value-Added Model (VAM)”
Marc Baron, Chief, Performance Accountability
Mark Howard, Director, Research, Evaluation, and Assessment

DRE
FLDOE Value-Added ModelEstablished by Student Success Act (SB 736)
• Evaluation Criteria for All Instructional Personnel and School Administrators– Professional Practice– Student Learning Growth
• FCAT Classroom Teachers: 40%-50%• Non FCAT Classroom Teachers: 30%-40%• Non Classroom Teachers: 20%-30%• Principals: 50%
• JTEC & Principal Evaluation Committee

SDPBC Must Classify Instructional Personnel and School Administrators
into these Four Categories
–Highly Effective–Effective–Needs Improvement–Unsatisfactory

DRE
VAM & Student Learning Growth
• Contribution to a change in a student’s achievement
• Calculated from a measure of student learning growth

DRE
The difference between Current test score and Predicted test score
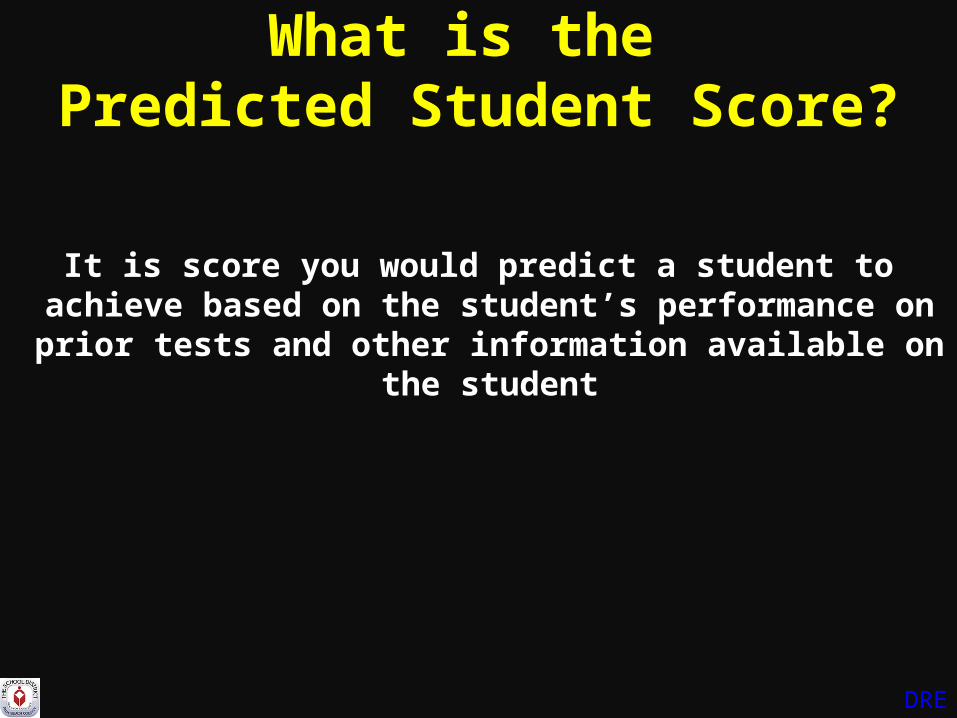
What is the Predicted Student Score?
What is the Student Learning Growth Score?
DRE
It is score you would predict a student to achieve based on the student’s performance on prior tests
and other information available on the student
What is the Predicted Student Score?

DRE
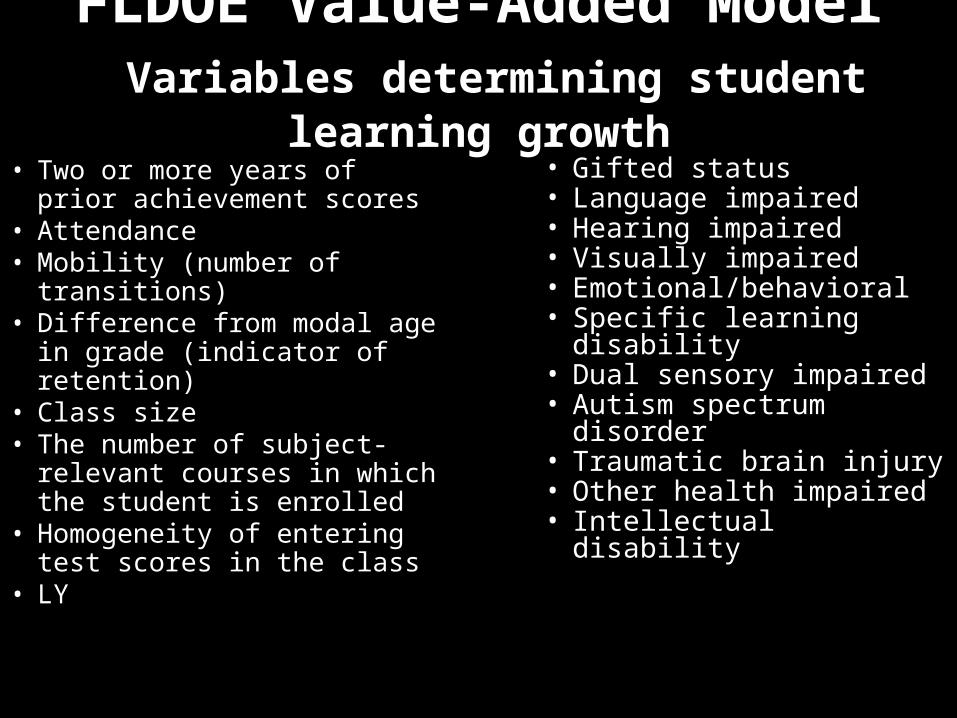
FLDOE Value-Added Model Variables determining student learning growth
• Two or more years of prior achievement scores • Gifted status • Student Attendance (Days)• Mobility (number of transitions) • Difference from modal age in grade (indicator of retention) • Class size • The number of subject-relevant courses in which
the student is enrolled• Homogeneity of entering test scores in the class

DRE
FLDOE Value-Added Model Variables determining student learning growth
• Students with Disabilities (SWD) status – Language impaired– Hearing impaired– Visually impaired– Emotional/behavioral– Specific learning disability– Dual sensory impaired– Autism spectrum disorder– Traumatic brain injury– Other health impaired– Intellectual disability
• English Language Learner (ELL) status – LY
DRE
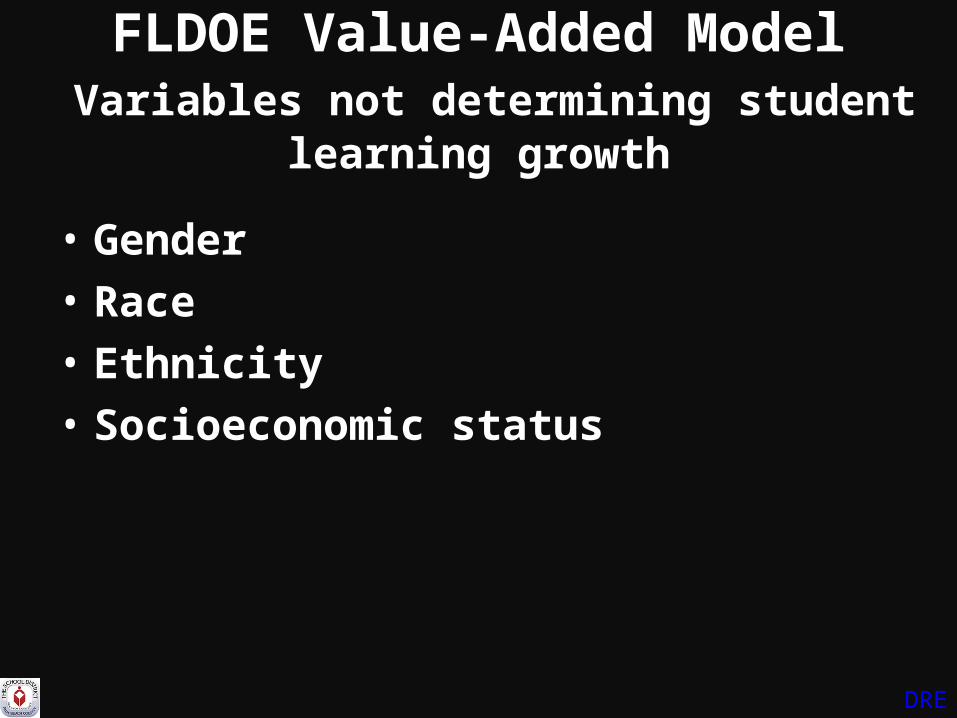
FLDOE Value-Added Model Variables not determining student learning growth
• Gender
• Race
• Ethnicity
• Socioeconomic status
DRE
FLDOE Value-Added Model
Variables determining student learning growth
TERMSDistrict Data Base of All Student Records

DRE
What is the Predicted Student Score?
PRIOR TEST
…100 200 300 400 500 600 700 800 900 1000…
(FY10 FCAT)
(FY
11 F
CA
T)
DRE
What is the Predicted Student Score?
PRIOR TEST
900
800
700
(FY10 FCAT)
(FY
11 F
CA
T)
…100 200 300 400 500 600 700 800 900 1000…

DRE
What is the Predicted Student Score?
PRIOR TEST
900
800
700
600
500
400
300
(FY10 FCAT)
W(F
Y11
FC
AT
)
…100 200 300 400 500 600 700 800 900 1000…

DRE
What is the Predicted Student Score?
PRIOR TEST
900
800
700
600
500
400
300
PREDICTED SCORE600
Answer:Average of
current scores of similar students
(FY10 FCAT)
(FY
11 F
CA
T)
…100 200 300 400 500 600 700 800 900 1000…

DRE
Student Learning Growth is the Amount Above or Below Predicted Score
PRIOR TEST
900
800
700
600
500
400
300
PREDICTED SCORE600
Above Predicted Score
Below Predicted Score
ACTUAL SCORE
ACTUAL SCORE
(FY10 FCAT)
(FY
11 F
CA
T)
…100 200 300 400 500 600 700 800 900 1000…

PRIOR TEST PRIOR TEST 10 20 30 40 50 60 70 80 90 100…
Based on Prior Achievement Only Based on Prior Achievement & ELL
What is the Predicted Student Score? Based on Prior Achievement
40050
600
800
70
90Each prior year test score has a
Predicted current year test score.
(FY10 FCAT)
(FY
11 F
CA
T)
…100 200 300 400 500 600 700 800 900 1000…
FLDOE Value-Added Model Variables determining student learning growth
• Two or more years of prior achievement scores
• Attendance • Mobility (number of transitions) • Difference from modal age in
grade (indicator of retention) • Class size • The number of subject-relevant
courses in which the student is enrolled
• Homogeneity of entering test scores in the class
• LY
• Gifted status • Language impaired• Hearing impaired• Visually impaired• Emotional/behavioral• Specific learning disability• Dual sensory impaired• Autism spectrum disorder• Traumatic brain injury• Other health impaired• Intellectual disability

Reading Grade 7Indicators Ranked By Statistical Significance
Indicator T-StatisticAchievement: Prior Year 75.667Achievement: Two Prior Years 38.167Enrolled in 2 or more courses 18.354Difference from Modal Age 15.977Attendance 13.571Number of students in Class 1 8.439Homogeneity of Class 2 Prior Year Test Scores 7.182Language Impaired 5.362Specific Learning Disability 5.013Homogeneity of Class 1 Prior Year Test Scores 4.750ELL Indicator 4.673Homogeneity of Class 3 Prior Year Test Scores 3.188Number of students in Class 5 2.385Enrolled in 2 or more class periods 2.289Mobility: Number of School Transfers 2.271Intellectual Disability 2.141

Illustrative Growth Points All other variables being equal
Variables Growth Points*Typical 100ELL 100 moreLow Attendance 100 points less
*adapted from AIR materials presented at August 2, 2011,meetingThese are illustrative values, not actual values

PRIOR TEST PRIOR TEST 10 20 30 40 50 60 70 80 90 100…
Based on Prior Achievement Only Based on Prior Achievement & ELL
What is the Predicted Student Score?
40050
600
800
70
90
(FY10 FCAT)
(FY
11 F
CA
T)
…100 200 300 400 500 600 700 800 900 1000…

PRIOR TEST PRIOR TEST
Based on Prior Achievement Only Based on Prior Achievement & ELL
What is the Predicted Student Score?
400500
600
800
700
900
(FY10 FCAT)
(FY
11 F
CA
T)
(FY10 FCAT)
(FY
11 F
CA
T)
…100 200 300 400 500 600 700 800 900 1000… …100 200 300 400 500 600 700 800 900 1000…

PRIOR TEST PRIOR TEST
Based on Prior Achievement Only Based on Prior Achievement& Low Attendance
What is the Predicted Student Score?
400
300
600
800
500
700
(FY10 FCAT)
(FY
11 F
CA
T)
(FY10 FCAT)
(FY
11 F
CA
T)
…100 200 300 400 500 600 700 800 900 1000… …100 200 300 400 500 600 700 800 900 1000…

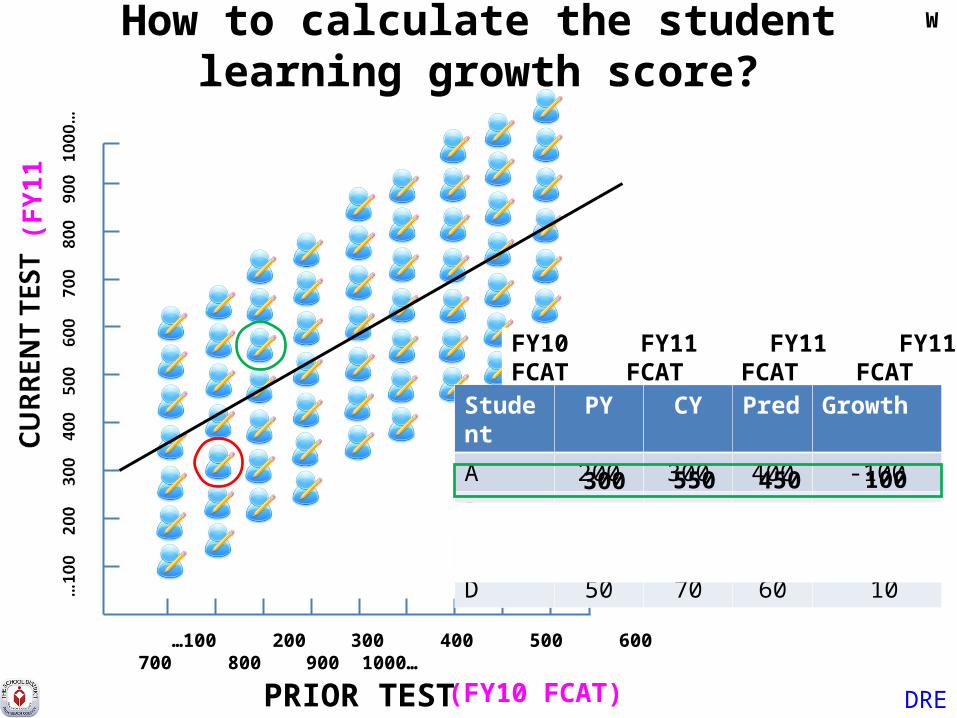
How to calculate the student learning growth score?
PRIOR TEST DRE
The diagonal line is the predicted growth
observed among similar students.
(FY10 FCAT)
(FY
11 F
CA
T)
…100 200 300 400 500 600 700 800 900 1000…

How to calculate the student learning growth score?
PRIOR TEST
Student PY CY Pred Growth
A 200 300 400 -100
B 30 55 45 10
C 40 40 50 -10
D 50 70 60 10
DRE(FY10 FCAT)
(FY
11 F
CA
T)
FY10 FY11 FY11 FY11FCAT FCAT FCAT FCAT
…100 200 300 400 500 600 700 800 900 1000…
How to calculate the student learning growth score?
PRIOR TEST
Student PY CY Pred Growth
A 200 300 400 -100
B
C 40 40 50 -10
D 50 70 60 10
DRE(FY10 FCAT)
(FY
11 F
CA
T)
FY10 FY11 FY11 FY11FCAT FCAT FCAT FCAT
300 550 450 100
W
…100 200 300 400 500 600 700 800 900 1000…

How to calculate the student learning growth score?
PRIOR TEST
Student PY CY Pred Growth
A 200 300 400 -100
B 300 550 450 100
C 400 400 500 -100
D 50 70 60 10
DRE(FY10 FCAT)
(FY
11 F
CA
T)
FY10 FY11 FY11 FY11FCAT FCAT FCAT FCAT
? ? ? ?
Y
…100 200 300 400 500 600 700 800 900 1000…

How to calculate the student learning growth score?
PRIOR TEST
Student PY CY Pred Growth
A 200 300 400 -100
B 300 550 450 100
C 400 400 500 -100
D 500 700 600 100
DRE(FY10 FCAT)
(FY
11 F
CA
T)
FY10 FY11 FY11 FY11FCAT FCAT FCAT FCAT
…100 200 300 400 500 600 700 800 900 1000…

DRE
How do you calculate the teacher growth score?
1. Identify the students assigned to the teacher
2. Determine the learning growth of each of the assigned students
3. Calculate the average learning growth of the students
TERMS

PRIOR TEST DRE
Student PY CY Pred Growth
A 200 300 400 -100
B 300 550 450 100
C 400 400 500 -100
D 500 700 600 100
Average 0
Typical
Teacher Growth Score
(FY10 FCAT)
(FY
11 F
CA
T)
FY10 FY11 FY11 FY11FCAT FCAT FCAT FCAT
…100 200 300 400 500 600 700 800 900 1000…
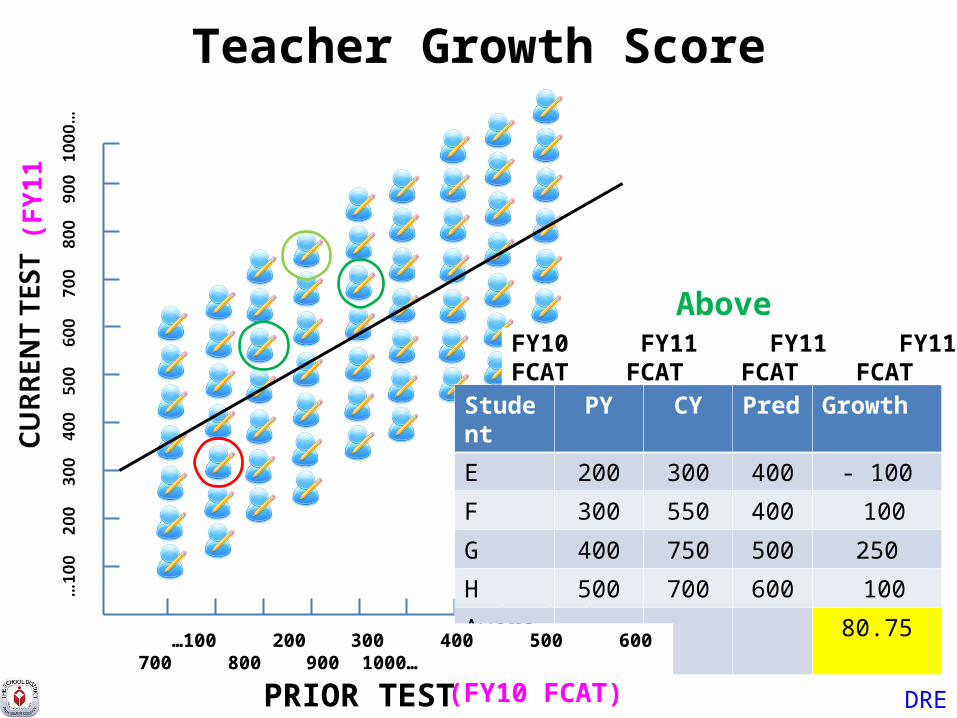
Teacher Growth Score
PRIOR TEST
Above
DRE
Student PY CY Pred Growth
E 200 300 400 - 100
F 300 550 400 100
G 400 750 500 250
H 500 700 600 100
Average 80.75
(FY10 FCAT)
(FY
11 F
CA
T)
FY10 FY11 FY11 FY11FCAT FCAT FCAT FCAT
…100 200 300 400 500 600 700 800 900 1000…

PRIOR TEST DRE
Student PY CY Pred Growth
I 200 300 400 -100
J 300 250 450 - 200
K 400 400 500 -100
L 500 700 600 100
Average - 70.5
Below
Teacher Growth Score
(FY10 FCAT)
(FY
11 F
CA
T)
FY10 FY11 FY11 FY11FCAT FCAT FCAT FCAT
…100 200 300 400 500 600 700 800 900 1000…

DRE
Teacher Growth
Teacher Growth
School Growth
Avg Growth = (A+B+C+D)/4

DRE
Teacher Effect
Teacher Effect
School Growth

Calculating Teacher Value-Added ScorePart 1
=
DRE
School GrowthScore
Teacher GrowthScore
-( )Teacher Effect
DRE
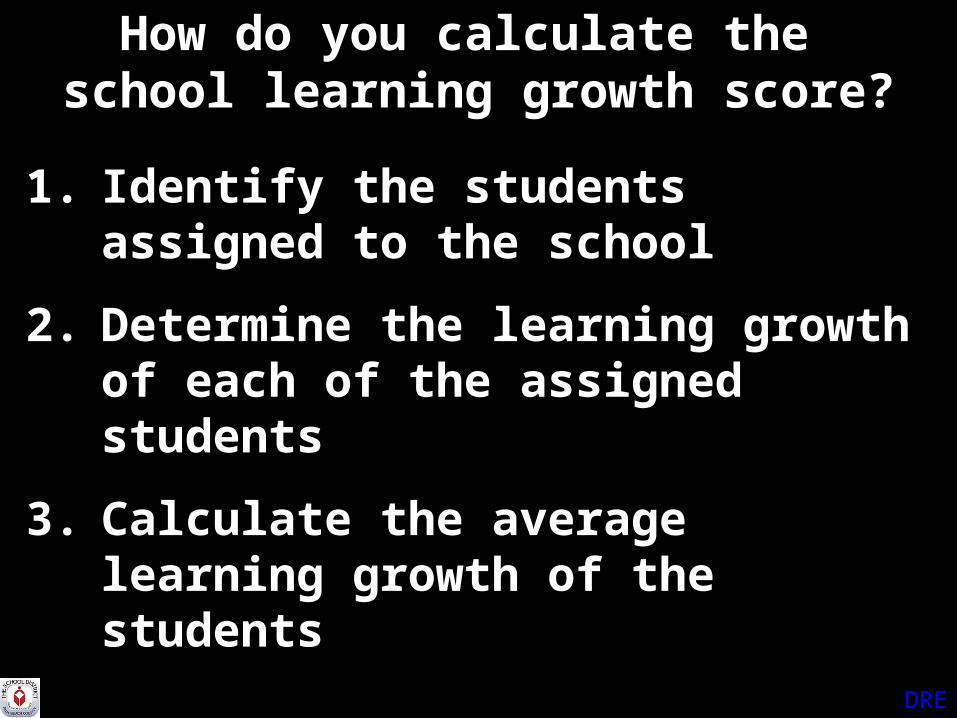
How do you calculate the school learning growth score?
1. Identify the students assigned to the school
2. Determine the learning growth of each of the assigned students
3. Calculate the average learning growth of the students

School Growth Score
PRIOR TEST DRE
Stdt PY CY Pred Growth
A 200 300 400 -100
B 300 550 450 100
C 400 400 500 -100
D 500 700 600 100
E 200 300 400 - 100
F 300 550 450 100
G 400 750 500 250
H 500 700 600 100
I 200 300 400 -100
J 300 250 450 - 200
K 400 400 500 -100
L 500 700 600 100
Avg 4.1
(FY10 FCAT)
(FY
11 F
CA
T)
FY10 FY11 FY11 FY11FCAT FCAT FCAT FCAT
…100 200 300 400 500 600 700 800 900 1000…

Calculating Teacher Value-Added ScorePart 1: AKA Teacher Effect
Typical Above BelowTeacher Growth Score 0 80.75 -70.5
School Growth Score 4.1 4.1 4.1
Teacher Effect (Tchgrowth score – Schgrowth score) -4.1 76.65 -74.6
DRE
Tcheffect = (Tchgrowth score – Schgrowth score )

What is a Teacher Value-Added Score?
and
How is it calculated?
DRE

FLDOE Teacher Value-Added Score Conceptual
.5 + ( XSchool GrowthScore
)=
DRE
School GrowthScore
Teacher GrowthScore
-( )Teacher Effect
Tchvas = (Tchgrowth score – Schgrowth score ) + ( .5 x Schgrowth score)

Teacher Value-Added Score
Typical Above BelowTeacher Growth Score 0 80.75 -70.5
School Growth Score 4.1 4.1 4.1
Teacher Effect Tchgrowth score – Schgrowth score -4.1 76.65 -74.6.5 x Schgrowth score 2.05 2.05 2.05Tchvas -2.05 78.7 -72.55
DRE
Tchvas = (Tchgrowth score – Schgrowth score ) + ( .5 x Schgrowth score)

State Average Student Learning Growth
-20 -15 -10 -5 0 5 10 15 20
VAS = 15
VAS = 20
VAS = 25
Teacher Growth = 20
The greater a teacher’s growth score is from the
state’s average and the school’s growth score, the higher a
teacher’s VAS
Tchvas = (Tchgrowth - Schgrowth ) + ( .5 x Schgrowth)

DRE
State Average Student Learning Growth
-20 -15 -10 -5 0 5 10 15 20
VAS = 0
VAS = -20
VAS = 20
School Growth = 0
Tchvas = (Tchgrowth - Schgrowth ) + ( .5 x Schgrowth)
At a school with a growth score of 0, the teacher’s VAS
equals the teacher’s growth

DRE
State Average Student Learning Growth
-20 -15 -10 -5 0 5 10 15 20
VAS = 15
School Growth = 10
Tchvas = (Tchgrowth - Schgrowth ) + ( .5 x Schgrowth)
VAS = 5
VAS = 0
VAS = -10
VAS = -5
At a high VAS school, a
teacher’s growth must exceed half
the school’s growth to have a
positive VAS
What is the significance of the green
line?

DRE
State Average Student Learning Growth
-20 -15 -10 -5 0 5 10 15 20
VAS = -15
School Growth = -10
Tchvas = (Tchgrowth - Schgrowth ) + ( .5 x Schgrowth)
VAS = -5
VAS =0
VAS = 10
VAS = 5
At a low VAS school, a teacher’s growth
must exceed half the school’s growth to
have a positive VAS

DRE
A Real Picture is Worth a Thousand Words

DRE
Teacher VAM

DRE
SDPBC Teacher VAM (Grade 5 Subject: Reading)
Mean = 3.3N = 561Class >= 10

DRE
State Teacher VAM (Grade 5 Subject: Reading)
Mean = 0.1N = 12182
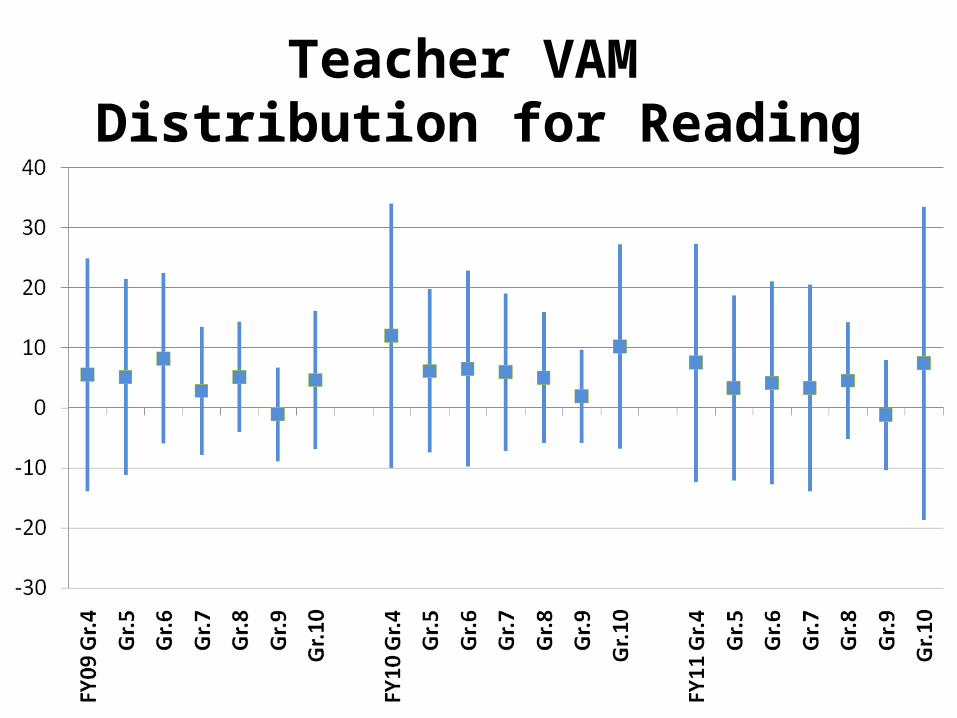
Teacher VAM Distribution for Reading

DRE
School Growth

DRE
SDPBC School GrowthGrade 5 Subject: Reading
Mean = 4.0N = 120

DRE
State School GrowthGrade 5 Subject: Reading
Mean = 0.02N = 2082

School ComponentDistribution for Reading
DRE
How precise are VAM measures?
DRE
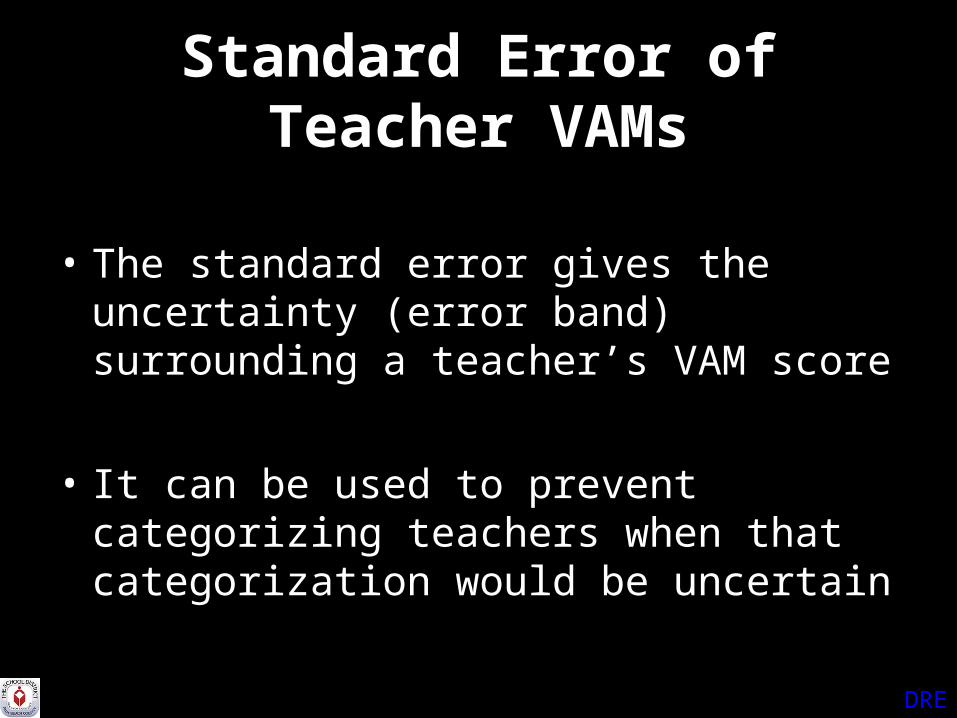
Standard Error of Teacher VAMs
• The standard error gives the uncertainty (error band) surrounding a teacher’s VAM score
• It can be used to prevent categorizing teachers when that categorization would be uncertain
DRE
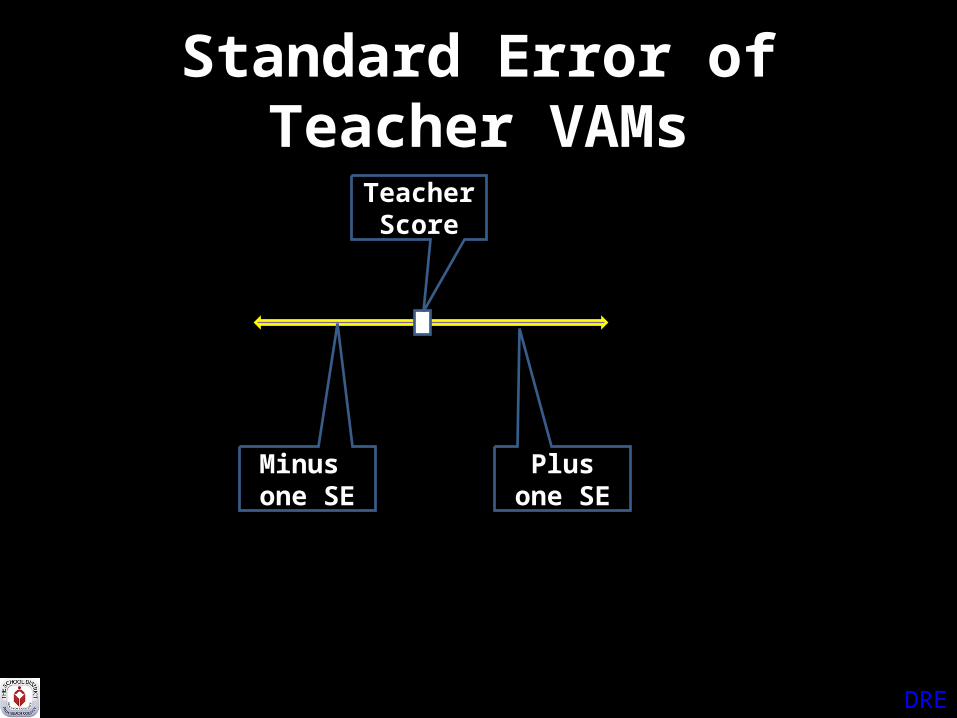
Standard Error of Teacher VAMs
Teacher Score
Plusone SE
Minus one SE

DRE
Using SE to Categorize Teachers
Teacher 2
Teacher 1
Teacher 3
Teacher 4
State Average Score
DRE
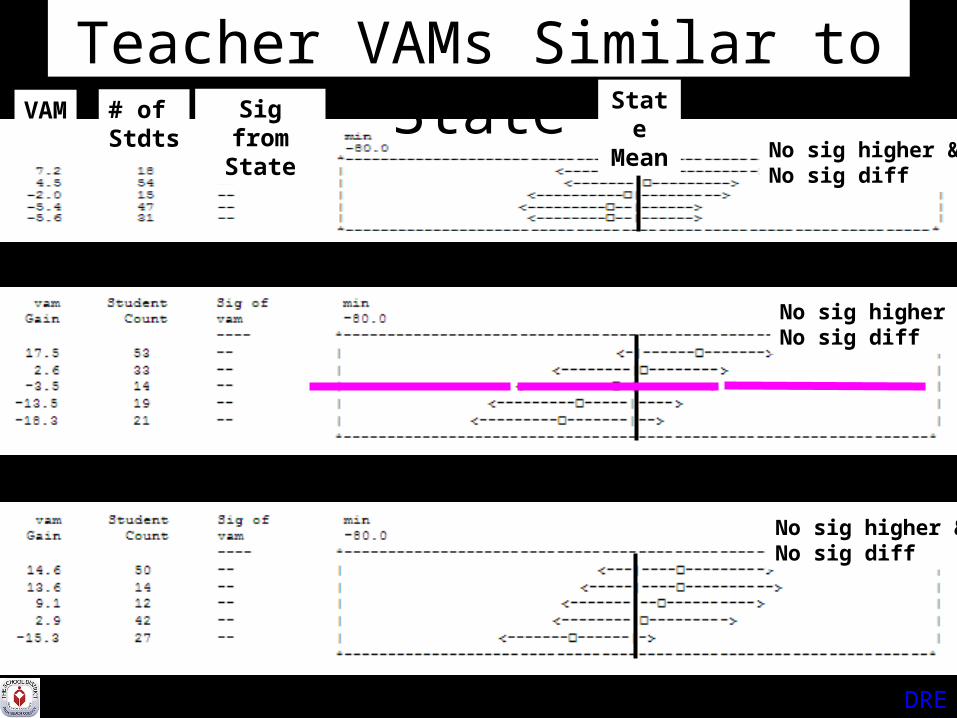
Teacher VAMs Similar to StateVAM # of
StdtsSig from
State
StateMean
No sig higher &No sig diff
No sig higher &No sig diff
No sig higher &No sig diff

DRE
Some teacher VAMs Higher than StateVAM # of
StdtsSig from
StateStateMean
1 sig higher &No sig diff
2 sig higher &No sig diff
4 sig higher &sig differences

DRE
Some teacher VAMs Lower than StateVAM # of
StdtsSig from
StateStateMean
1 sig lower No sig diff
2 sig lower &sig differences
3 sig lower &No sig diff
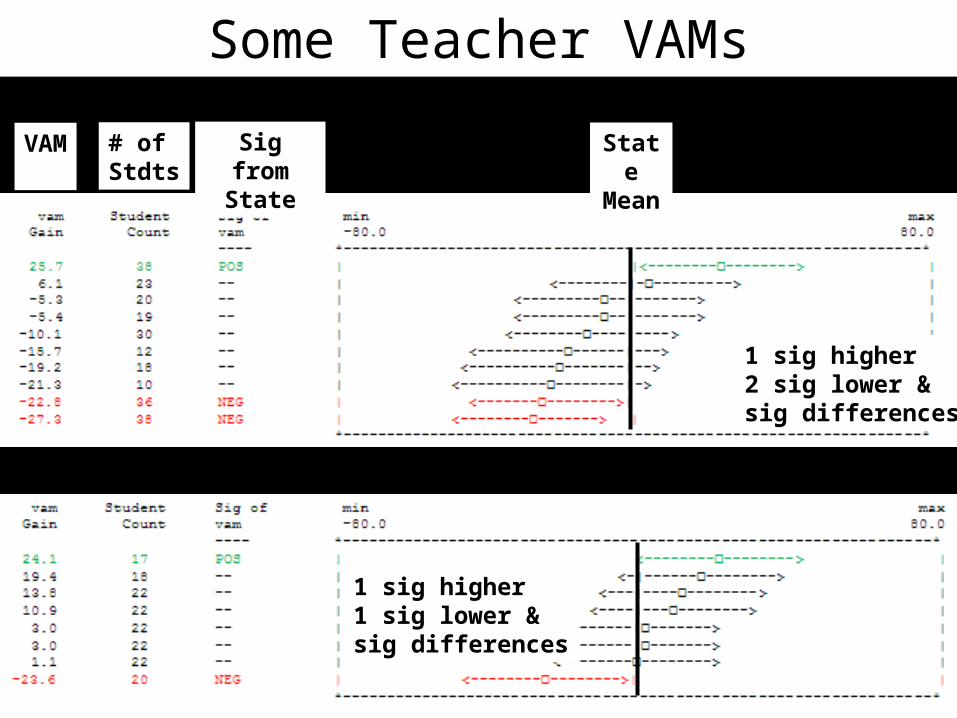
DRE
Some Teacher VAMs Lower/Higher than State
VAM # of Stdts
Sig from State
StateMean
1 sig higher2 sig lower &sig differences
1 sig higher 1 sig lower &sig differences
DRE
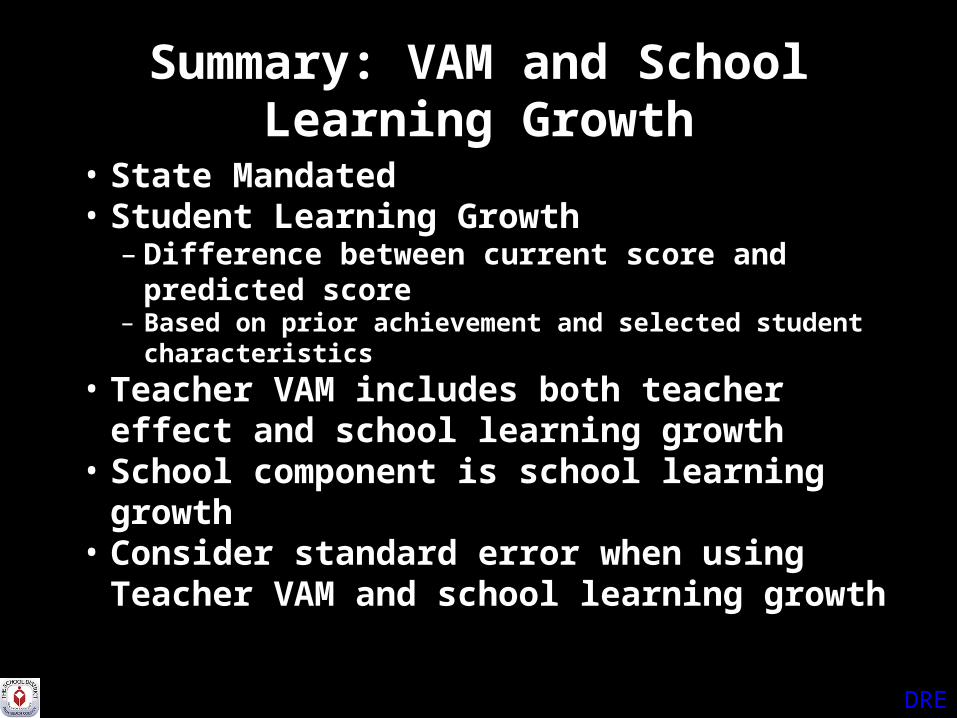
Summary: VAM and School Learning Growth
• State Mandated• Student Learning Growth
– Difference between current score and predicted score– Based on prior achievement and selected student
characteristics
• Teacher VAM includes both teacher effect and school learning growth
• School component is school learning growth• Consider standard error when using Teacher
VAM and school learning growth

SDPBC Must Classify Instructional Personnel/School Administrators
into these Four Categories
–Highly Effective–Effective–Needs Improvement–Unsatisfactory

DRE
Proportion of a Year’s Growth& School Growth Score

PRIOR TEST DRE(FY10 FCAT)
(FY
11 F
CA
T)
…100 200 300 400 500 600 700 800 900 1000…
FY10 FY11 FY11FCAT FCAT -FY10
LESS
MORE
One Year’s Worth of Growth
Std PY CY CY-PY
Year's Worth
of Growth
PYG
A 200 300 100 150 0.67E 200 300 100 150 0.67I 200 300 100 150 0.67B 300 550 250 125 2.00F 300 550 250 125 2.00J 300 250 -50 125 -0.40C 400 400 0 100 0.00G 400 750 350 100 3.50K 400 400 0 100 0.00D 500 700 200 80 2.50H 500 700 200 80 2.50L 500 700 200 80 2.50Avg 1.38
PYG
150125 100
80

DRE
A Real Picture is Worth a Thousand Words

SDPBCMean
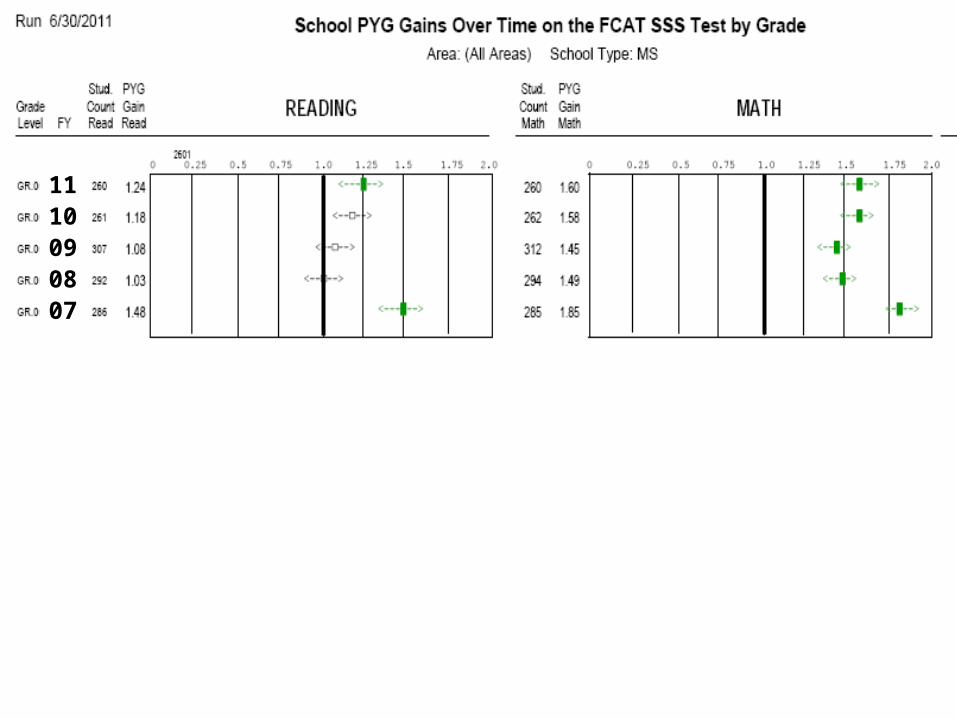
1110090807


DRE
Area Scorecard and PYG
To review area and school scorecards, go to the EDW.

DRE
Summary: PYG and Scorecard
• PYG–Difference between current score
and predicted score–Highly correlated with school
learning growth–Use PYG reports and scorecard to
see how you would have done?


