Australian Earthquake Engineering Society 2013 Conference, Nov 14-17, Tasmania ABSTRACT: The effect of the long-range great Sumatera fault and subduction zone still in debating among several researchers in Malaysia. The design practice of bridges in Malaysia previously using British Standard and now moving to Eurocodes and Eurocode 8 part 2 explains how to make bridges resistant to earthquakes. As Malaysia is one of the world's largest producer of natural rubber and with the active participation in the development of rubber bearing for bridges, many researchers in Malaysia interested in researching the effectiveness of this particular use of bridge rubber bearing especially the effect from the earthquakes. The objectives of the paper is investigating the lateral load drift behaviour of Malaysian bridge pier with current designed rubber bearing. The comparison is made between bridge without any bearing consideration in analysis and bridge with normal design rubber bearing. Transverse displacement is taken as the indicator to discussed and the behaviour are examined on the serviceability parameters may then be superimposed onto the nonlinear Force Displacement (F-D) relationship to provide insight into structural performance. Keywords: Drift capacity, bridge pier, rubber bearing, load-displacement curve, Eurocode 8 1.0 INTRODUCTION The great Sumatera fault is just 350km away from the nearest point of the Peninsular Malaysia. At this region it is consist of several big cities such as Georgetown, Kuala Lumpur, Putrajaya and Johor Bahru. The developments of mega structure and infrastructures in new Malaysian era still categorise new and it is around 40 to 50 years. With the rapid development in this area the consideration from the Sumatera rapture need to take into account with the cycle of the big event of seismic on this rapture still in questioning. In Malaysia, the consideration on seismic effect to structures is still new. Penang Bridge is the first structure in Malaysia were considered the effect of seismic (Chin Fung Kee ,1988). The application and consideration of seismic is now actively developed and it is parallel with the codes applied such as Eurocodes. The application of seismic rubber bearing to new 2nd Penang Bridge (Kamarudin Ab-Malek, 2013) shows the good commitment among Malaysian researcher and designer to critically thinking about seismic. The objectives of the paper is study the performance of one of the proposed bridge planned to construct by Malaysian Public Work Department (PWD) with current designed rubber bearing under long-range great Sumatera fault and subduction zone. The results are compared with bridge without any bearing consideration or pinned joint connection consider in the analysis. 1 Post Graduate Student, Faculty of Civil Engineering, Universiti Teknologi Malaysia, Johor. Malaysia 2 Professor, Faculty of Civil Engineering, Universiti Teknologi Malaysia, Johor, Malaysia email: [email protected]Drift Performance of Bridge Pier with Various Bearing Analysis M. Z. Ramli 1 , A. Adnan 2
Transcript
Australian Earthquake Engineering Society 2013 Conference, Nov 14-17, Tasmania
ABSTRACT:
The effect of the long-range great Sumatera fault and subduction zone still in debating among several
researchers in Malaysia. The design practice of bridges in Malaysia previously using British
Standard and now moving to Eurocodes and Eurocode 8 part 2 explains how to make bridges
resistant to earthquakes. As Malaysia is one of the world's largest producer of natural rubber and
with the active participation in the development of rubber bearing for bridges, many researchers in
Malaysia interested in researching the effectiveness of this particular use of bridge rubber bearing
especially the effect from the earthquakes. The objectives of the paper is investigating the lateral
load drift behaviour of Malaysian bridge pier with current designed rubber bearing. The comparison
is made between bridge without any bearing consideration in analysis and bridge with normal design
rubber bearing. Transverse displacement is taken as the indicator to discussed and the behaviour are
examined on the serviceability parameters may then be superimposed onto the nonlinear Force
Displacement (F-D) relationship to provide insight into structural performance.
1.0 INTRODUCTION The great Sumatera fault is just 350km away from the nearest point of the Peninsular Malaysia. At this region it is consist of several big cities such as Georgetown, Kuala Lumpur, Putrajaya and Johor Bahru. The developments of mega structure and infrastructures in new Malaysian era still categorise new and it is around 40 to 50 years. With the rapid development in this area the consideration from the Sumatera rapture need to take into account with the cycle of the big event of seismic on this rapture still in questioning. In Malaysia, the consideration on seismic effect to structures is still new. Penang Bridge is the first structure in Malaysia were considered the effect of seismic (Chin Fung Kee ,1988). The application and consideration of seismic is now actively developed and it is parallel with the codes applied such as Eurocodes. The application of seismic rubber bearing to new 2nd Penang Bridge (Kamarudin Ab-Malek, 2013) shows the good commitment among Malaysian researcher and designer to critically thinking about seismic. The objectives of the paper is study the performance of one of the proposed bridge planned to construct by Malaysian Public Work Department (PWD) with current designed rubber bearing under long-range great Sumatera fault and subduction zone. The results are compared with bridge without any bearing consideration or pinned joint connection consider in the analysis.
1 Post Graduate Student, Faculty of Civil Engineering, Universiti Teknologi Malaysia, Johor. Malaysia
2 Professor, Faculty of Civil Engineering, Universiti Teknologi Malaysia, Johor, Malaysia
2.0 BRIDGE CONFIGURATION The total bridge has 24span and the intermediate main-span is taken into this study. The main span of this proposed bridge consists of seven (7) spans Spine Variable Depth Segmental Box girders are shown in fig. 1. The length for five (5) middle spans are 100 meter each and the both edge span are 70 meter each. The middle span of the bridge need to have total high not less than 33 meter as a requirement by Marine Department. In the analysis, it is assume to have single pier construction with 4 meter width and 2 meter depth. The variable depth box girder illustrates in fig. 2.
Fig. 1: The configuration of the bridge
(a) Section at bridge Pier (b) Section at intermediate span Fig. 2: The layout of cross section of spine variable depth box girder
2.1 STIFFNESS OF ELEMENTS i) Piers The value of piers effective stiffness for seismic analysis is estimated initially and is checked after the selection of the required reinforcement for the piers. For both piers the stiffness is assumed to be 40% of the uncracked stiffness. ii) Deck The uncracked bending stiffness of the prestressed concrete deck is considered. The torsional stiffness considered is the 50% of the uncracked stiffness. 2.2 PERMANENT LOAD FOR THE DESIGN SEISMIC SITUATION The loads applied in the bridge deck for the seismic situation (WE) are the sum of self weight (G) and additional dead (G2) and the effective seismic live load. The sum of self weight (G) and additional dead (G2) are computed ∑qG = 36,737 kN. The effective seismic live load (qLE) is 20% of the uniformly distributed traffic load (qL = 8,286 kN) are 0.20qL = 1,657 kN. And the final total load applied in the bridge deck for the seismic situation (WE) are 38,394 kN.
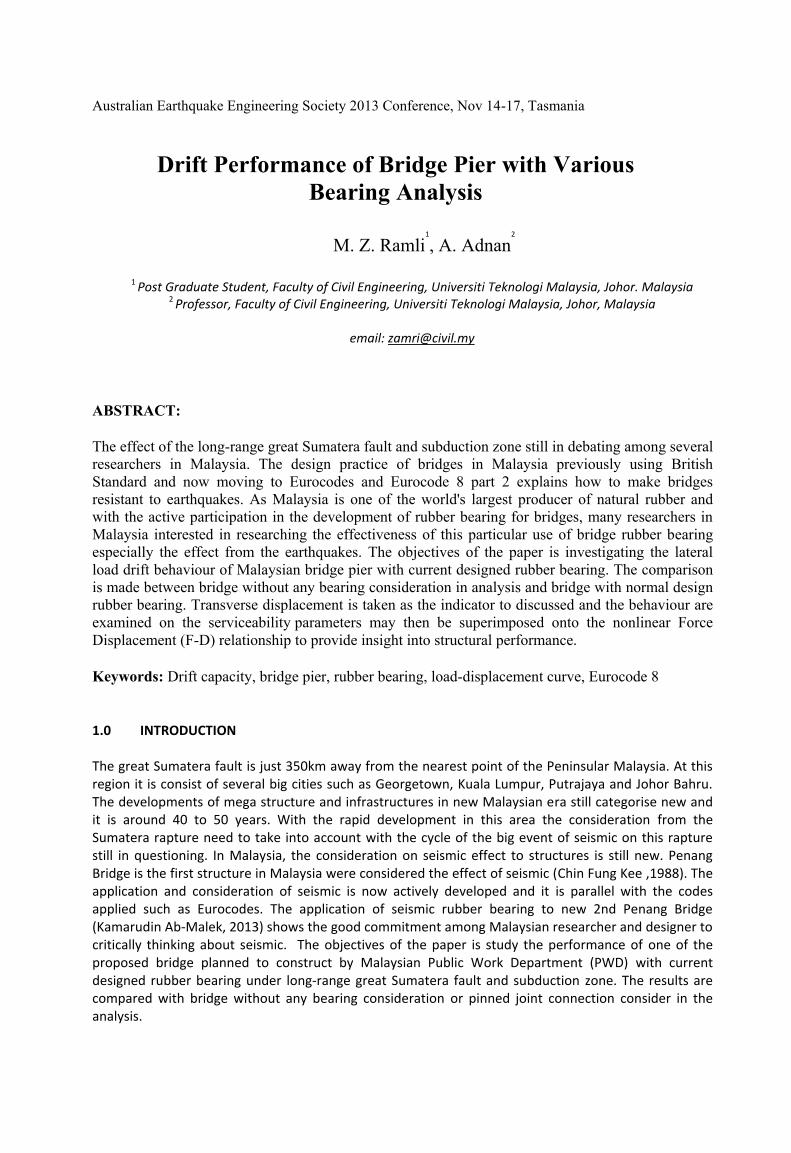
2.3 FUNDAMENTAL MODE ANALYSIS IN THE LONGITUDINAL DIRECTION The fundamental mode period is estimated based on a simplified SDOF cantilever model of the bridge. The mode corresponds to the oscillation of the bridge along its longitudinal axis, assuming both ends of the piers fixed. For rectangular column dimension of 2mx 4m the uncracked moment of inertia, Jun = 5.33m4. The assuming made for effective moment of inertia of piers is Jeff/Jun = 0.40, and both ends of the piers fixed and for concrete grade C40 (fcm = 48) with Ecm = 22 [fcm /10]0.3 GPa. The the calculate Ecm is 31.68GPa and the horizontal stiffness of each pier in longitudinal direction, Kpier are 12EJeff/H3 = 12 x 31,680MPa x (0.40 x 5.33.0m4) / (29m) 3 = 33.23 MNm (per pier). From this calculation, the total horizontal stiffness, ∑Kpier are 33.23 x 6 Bent = 199.4 MNm with the total seismic weight , WE is 38,394kN, than the fundamental period T is 2π(m/K)0.5 are 0.888 sec. 3.0 ANALYTICAL MODEL The time history non-linear finite element approached are adopted in this study. The analysis used synthetic bedrock time history for Penang, Malaysia due to Sumatera earthquake and return period (TR) is 475 years (Azlan, 2005). Because of the lack of data such as soil profile, direct scaling of the amplitude is done and the pattern of the earthquake is assume similar for the surface time histories. The amplification at ground surface increases with increasing water table in horizontal component of time histories (Q.S. Chen, 2011). The amplification factor for this bridge are assume 2.5 times at the surface due to the location of the pier under water table level. The time history is assume to multiply another 2 times under maximum credible earthquake of 2500 years return period (TR2500) earthquake to get the result is no collapse and this return period is also used for analysis the 2nd Penang Bridge by Kamarudin Ab-Malek, 2013. At the total it assume that, the actual TR475 time history is multiply by 5 to get the surface time history and also TR2500 for non collapse analysis (Fig.3).
(a) (b)
Fig. 3: The Time History (TH) of Penang due to Sumatera Earthquake (a) actual TH at bedrock for TR475, (b) predicted TH at surface for TR2500
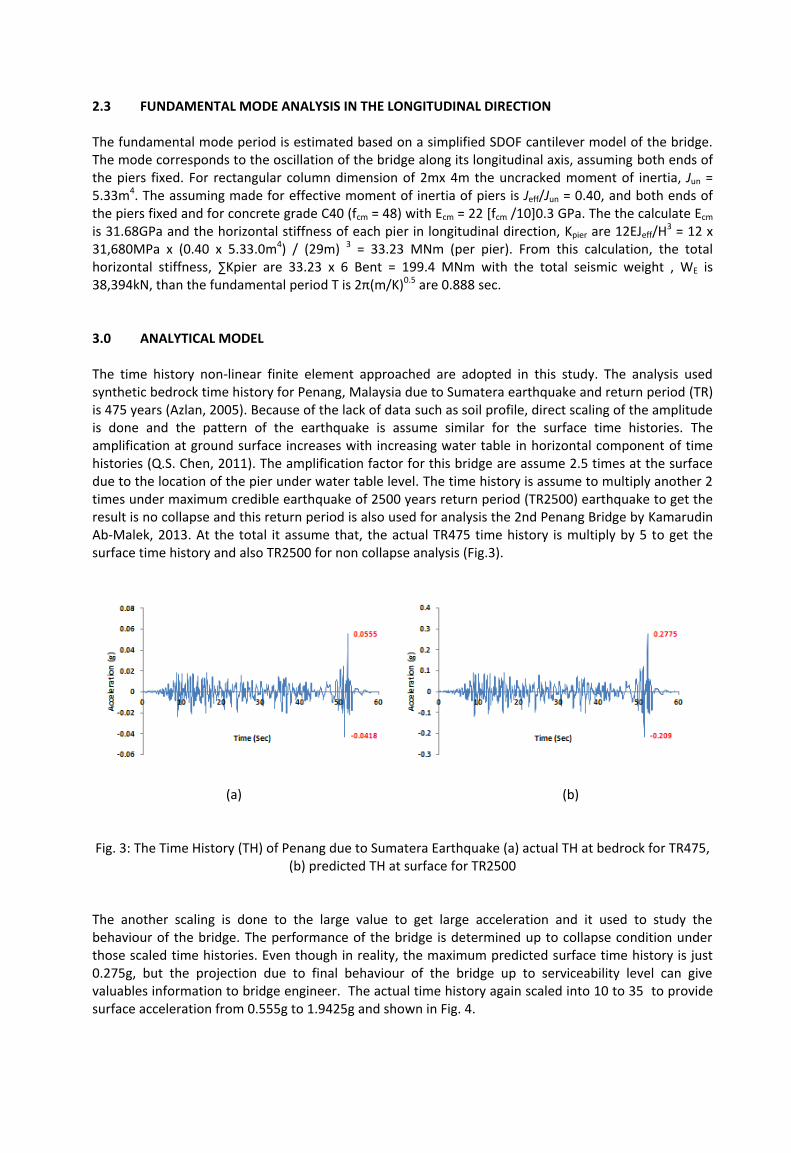
The another scaling is done to the large value to get large acceleration and it used to study the behaviour of the bridge. The performance of the bridge is determined up to collapse condition under those scaled time histories. Even though in reality, the maximum predicted surface time history is just 0.275g, but the projection due to final behaviour of the bridge up to serviceability level can give valuables information to bridge engineer. The actual time history again scaled into 10 to 35 to provide surface acceleration from 0.555g to 1.9425g and shown in Fig. 4.
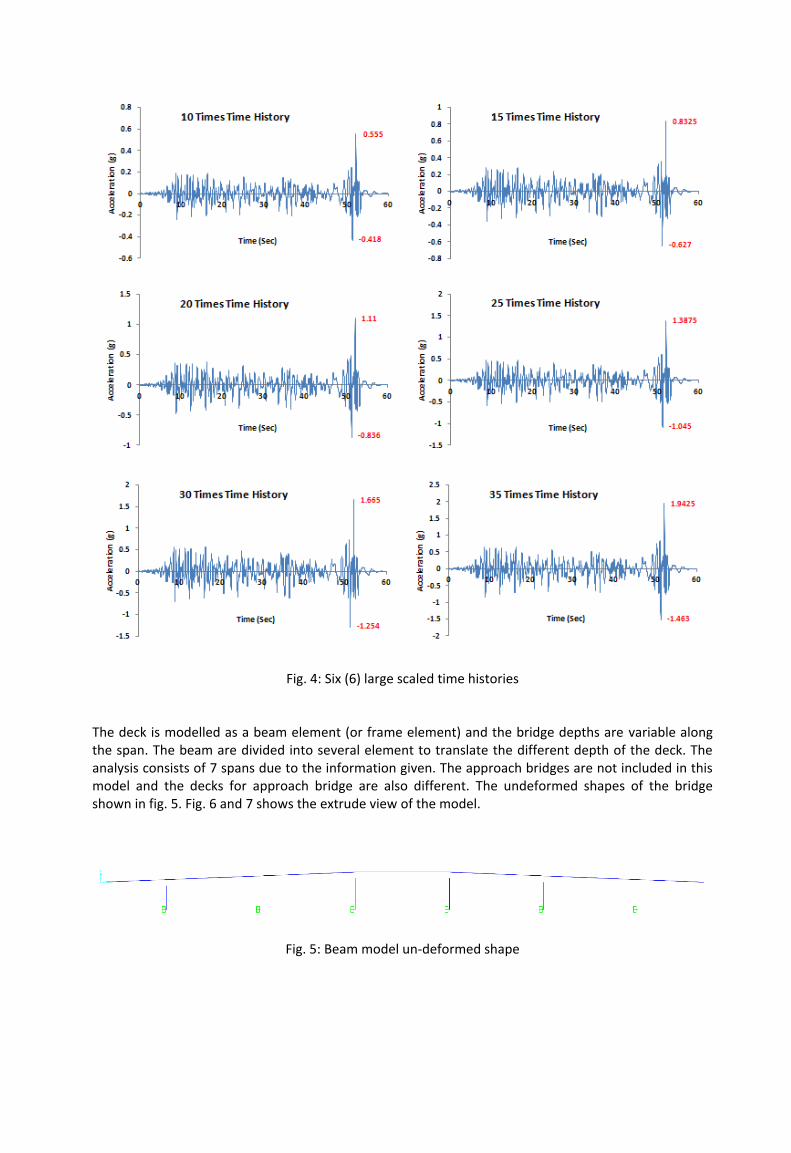
Fig. 4: Six (6) large scaled time histories The deck is modelled as a beam element (or frame element) and the bridge depths are variable along the span. The beam are divided into several element to translate the different depth of the deck. The analysis consists of 7 spans due to the information given. The approach bridges are not included in this model and the decks for approach bridge are also different. The undeformed shapes of the bridge shown in fig. 5. Fig. 6 and 7 shows the extrude view of the model.
Fig. 5: Beam model un-deformed shape
Fig. 6: The extrude view of the beam model
Fig. 7: The extrude view of the beam model
Fig. 8 shows the material nonlinearity properties used in this analysis. Fig. 8 (a) shown the material nonlinearity properties for steel reinforcement and Fig. 8 (b) for the material nonlinearity properties for concrete.
(a) (b)
Fig. 8: Material nonlinearity properties for (a) steel reinforcement, and (b) concrete
For the bridge with rubber bearing, the bearing is design based on British Standard, BS EN 1337-3:2005. Due to the large loading of the deck, the ideal shape factor of the bearing are 21.88 and it is shows that the ratio between the effective loaded area and the force free area. The shape factor is the means of taking account of the shape of the elastomeric in strength and deflection calculation. The properties of the bearing provided in Tab. 1.
Tab. 1: Rubber bearing Properties
Dimensions L= 1050mm B= 1050mm
Number Thickness
Rubber Layer 10 12mm
Steel Plate 11 3mm
Shear Compression
Stiffness 7.52kN/mm 8327kN/mm
Shape Factor (S) 21.88
The hinge section is allocated into several location of the column section to study the nonlinearity behaviour. If the failure occur for this bridge, it is expected develop from lower level or upper level of the column .The behaviour are examined on the serviceability parameters may then be superimposed onto the nonlinear Force Displacement (F-D) relationship to provide insight into structural performance. Property owners and the general public are very much interested in performance measures which relate to daily use. Therefore it may be useful to introduce such limit states as immediate-occupancy (IO), life-safety (LS), and collapse-prevention (CP), which indicate the correlation between material nonlinearity and deterministic projections for structural damage sustained (FEMA356, 2005). The static-pushover analysis is a nonlinear method which generates a idealised monotonic response curve shows in Fig. 9.
O operational, IO immediate occupancy, LS life safety, CP collapse prevention (FEMA 356)
Fig. 9: Conceptual plastic hinge states.
To make the analysis easier to understand, the result of displacement due to transverse direction are concentrate into just one point of interest and Fig. 10 shows the location of the focus point in the analysis. The result for column shear forces also investigate from the same column.
Fig. 10: Bridge model with location of focus point for result observation
4.0 THE RESULT 4.1 MODAL ANALYSIS The modal mass participation depends on the number of degrees of freedom. The more degrees of freedom, the more frequencies, and likely the more modes are required to get the percentage of mass participation needed. This analysis are use 34 modes for the modal analysis and targeted to have more
than 85% for dynamic analysis modal load participation ratio for the both horizontal direction. Tab. 2 shown the modal load participation ratios for both bridge type.
Tab. 2: Modal Load Participation Ratios
Bridge Type Item Static (%) Dynamic (%)
Bridge with pinned bearing
UX 99.9119 90.202
UY 99.9917 89.0733
UZ 97.1697 59.9242
Bridge with Rubber Bearing
UX 99.995 92.8725
UY 99.9984 92.9078
UZ 96.9992 61.6647
Tab. 3 shows the modal participating mass ratios for both type of bridge. The result for Bridge with pinned bearing shows the longitudinal direction (UX) is dominant in mode 8 with the period is 0.844756sec and it is 95.5% similar than the computation made before (0.888sec). The bridge with rubber bearing also have larger period compare that the bridge with pinned bearing. The overall system of the bridge become more flexible with consider the rubber bearing in the analysis.
Tab. 3: Modal Participating Mass Ratios
Item Type Mode Period (T) Sec UX UY UZ
Bridge with pinned bearing
1 2.947157 0 0.64 0
8 0.844756 0.66 1.019E-16 0.01567
13 0.498764 0.0001685 3.21E-16 0.19
Bridge with Rubber Bearing
1 4.203069 4.452E-20 0.7 4.093E-19
2 3.956173 0.9 6.738E-19 3.02E-08
20 0.504009 0.00007651 1.26E-17 0.2
4.2 TIME HISTORY ANALYSIS The analysis is done for both bridge with different bearing condition mentioned before. The actual time history at bedrock with 475TR with peak ground acceleration (PGA) 0.055g give no effect to the bridge and both bridge look very stable with no displacement at the top of bridge column. Figs. 11 present the hysteretic responses of bridge pier with pinned bearing, and bridge pier with rubber bearing, respectively, for predicted ground accelerations at surface with maximum peak surface acceleration 0.275g. The both hysteretic behaviour show big notable differences. The different hysteretic behaviour of the both analysis are attributed due to having different assignment of the bearing parameters used in the analysis, i.e. the constrain condition for the pinned and the stiffness parameter for the rubber bearing and shown the elasticity behaviour on the graph. The larger drift of the column occur for bridge with pinned bearing compare to the column with rubber bearing, even though at the beginning of the shaking the bridge with pinned bearing look more stiff with no deflection.
Fig. 11: Shear force–displacement responses of the bridge pier analysis with predicted surface accelerations of 0.275g for (a) Fix-based bearing or Pinned support, and (b) rubber bearing.
For bridge with pinned bearing, the level of serviceability of this bridge is changing based on the level of deformation of the bridge and shows in fig. 12. Even though the deformation is not developed due to the actual Sumatera Time history (PGA 0.055g), but the deformation developed sudden and reached 147.60 mm under time history with PGA 0.275 or five times larger than the actual time history. The bridge performed under immediate occupancy (IO) level at 21.24sec and 13.08 sec under time histories with PGA 0.385g (seven times larger) and PGA 0.55g (ten times larger) than the actual time history respectively.
Fig. 12: The performance of bridge with fix-based bearing analysis
Fig. 13 shows the plastic zone developed under time history with PGA 0.55g and the failure point are developed from the lower level of column and it is already expected before.
Fig. 13: The bridge serviceability performance after 10 times of Sumatera time history
For bridge with rubber bearing, the level of serviceability of this bridge is changing based on the level of deformation of the bridge with bearing is shows in fig. 14. The bridge performed under immediate occupancy (IO) level under time histories with PGA 1.1g or 20 times larger than the actual time history and the bridge already reaches IO level at time history with PGA 1.925g or 35 times larger than the actual time history.
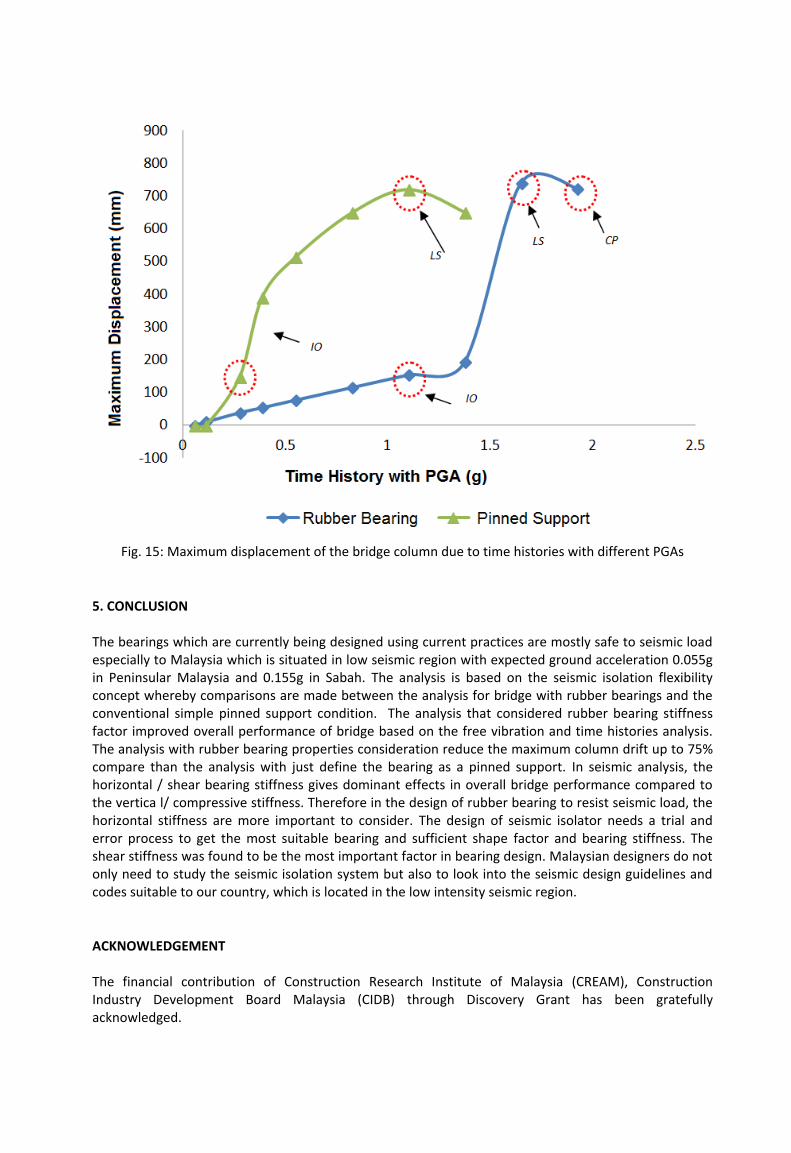
Fig. 14: The performance of bridge with rubber bearing analysis 4.3 SUMMARY The performance of bridge with rubber bearing has an efficient result compare than the bridge with pinned bearing. Fig. 15 shows the overall maximum displacement performance for both type of bearing consider in this study due to time histories with different PGAs. The bridge with rubber bearing reached IO level at time history with PGA more than 1g compare than bridge with pinned the time history with PGA not more than 0.4g. The maximum displacement of bridge pier also larger with analysis without rubber bearing consideration or pinned support.
Fig. 15: Maximum displacement of the bridge column due to time histories with different PGAs
5. CONCLUSION The bearings which are currently being designed using current practices are mostly safe to seismic load especially to Malaysia which is situated in low seismic region with expected ground acceleration 0.055g in Peninsular Malaysia and 0.155g in Sabah. The analysis is based on the seismic isolation flexibility concept whereby comparisons are made between the analysis for bridge with rubber bearings and the conventional simple pinned support condition. The analysis that considered rubber bearing stiffness factor improved overall performance of bridge based on the free vibration and time histories analysis. The analysis with rubber bearing properties consideration reduce the maximum column drift up to 75% compare than the analysis with just define the bearing as a pinned support. In seismic analysis, the horizontal / shear bearing stiffness gives dominant effects in overall bridge performance compared to the vertica l/ compressive stiffness. Therefore in the design of rubber bearing to resist seismic load, the horizontal stiffness are more important to consider. The design of seismic isolator needs a trial and error process to get the most suitable bearing and sufficient shape factor and bearing stiffness. The shear stiffness was found to be the most important factor in bearing design. Malaysian designers do not only need to study the seismic isolation system but also to look into the seismic design guidelines and codes suitable to our country, which is located in the low intensity seismic region.
ACKNOWLEDGEMENT The financial contribution of Construction Research Institute of Malaysia (CREAM), Construction Industry Development Board Malaysia (CIDB) through Discovery Grant has been gratefully acknowledged.
REFFERENCE A. Rahman Bhuiyan, M. Shahria Alam (2013). "Seismic performance assessment of highway bridges equipped with superelastic shape memory alloy-based laminated rubber isolation bearing." Engineering Structures 49, 396–407 AASHTO, 2002. Standard Specifications for Highway Bridges, Seventeenth Edition, American Association of State Highway and Transportation Officials. Adnan, A., Hendriyawan, Marto, A., and Irsyam, M. (2005). Seismic hazard assessment for Peninsular Malaysia using Gumbel distribution method. Jurnal Teknologi 42:57-73.
Can Akogul and Oguz C. Celik (2008) "Effect of elastomeric bearing modeling parameters on the seismis design of RC highway bridges with precast concrete girders", The 14th World Conference on Earthquake Engineering October 12-17, 2008, Beijing, China. Jati Sunaryati, Azlan Adnan , Mohd Zamri Ramli (2008), “Evaluation of laminated hollow circular elastomeric rubber bearing”, The 14th World Conference on Earthquake Engineering, October 12-17, 2008, Beijing, China. Kamaruddin. A. Malek, et all (2012). "Seismic Protection Of 2nd Penang Crossing Using High Damping Natural Rubber Isolators" The 15th World Conference on Earthquake Engineering October, 2012, Lisbon, Spain. Mohd Zamri Ramli (2006) “Response Of Existing Rubber Bearing And Designed Base Isolator For Malaysian Highway Bridges.” 6th Asia Pacific Structural Engineering and Construction Conference (APSEC 2006), Kuala Lumpur, 5th and 6th September 2006 Q.S. Chen, G.Y. Gao , J. Yang (2011). "Dynamic response of deep soft soil deposits under multidirectional