24
Drinking water 2016 Summary of the Chief Inspector’s report for drinking water in England July 2017 A report by the Chief Inspector of Drinking Water
Drinking water2016Summary of the Chief Inspector’s report for drinking water in EnglandJuly 2017A report by the Chief Inspector of Drinking Water

Summary o f the Ch ie f Inspec to r ’s repor t f o r d r i nk ing wa te r i n Eng land
Drinking water 2016
Summary of the Chief Inspector’s report for drinking water in England
1
Dr ink ing wa te r 2016
Publ ished by Dr ink ing Water Inspectorate Area 7e 9 Mil lbank c/o Nobel House 17 Smith Square London SW1P 3JR
Tel: 0300 068 6400
Websi te: http: / /www.dwi.gov.uk
© Crown Copyr ight 2017
ISBN: 978-1-911087-16-8
Copyr ight in the typographical arrangement and design rests wi th the Crown.
This publ icat ion (excluding the logo) may be reproduced free of charge in any format or medium provided that i t is reproduced accurately and not used in a mis leading context. The mater ia l must be acknowledged as Crown copyr ight wi th the t i t le and source of the publ icat ion specif ied.
2
Summary o f the Ch ie f Inspec to r ’s repor t f o r d r i nk ing wa te r i n Eng land
Drinking water 2016 Summary of the Chief Inspector’s report for drinking water in England
Drinking water 2016 is the annual publicat ion of the Chief Inspector of Drinking Water for England and Wales. I t is the 27t h report of the work of the Inspectorate and presents the summary information about drinking water quali ty for the calendar year of 2016. I t is published as a series of four quarter ly reports which cover public water supplies and one report which covers private water supplies. This report is a summary of public water supplies for England.
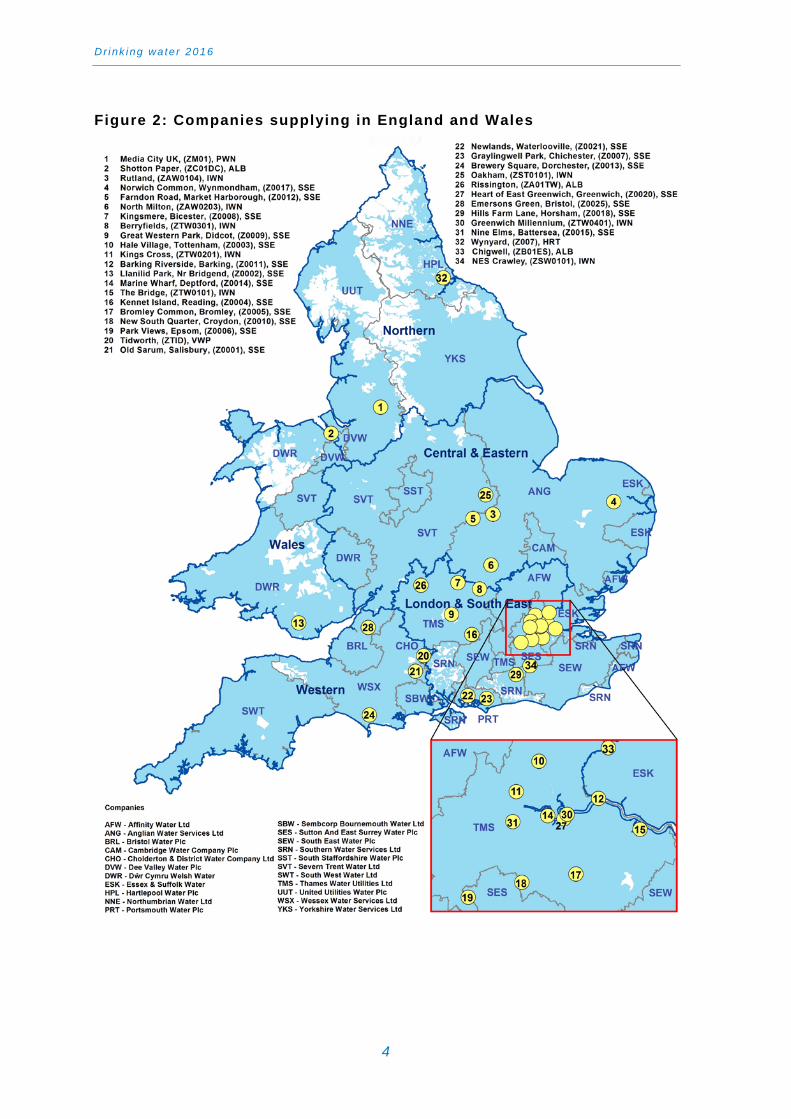
Set out in this report are the key facts about the quali ty of the publ ic water supplies in England, which is served by 27 water companies del ivering supplies to 54,614,767 consumers. The area served by each water company is shown in Figure 2.
There were no changes in the water supply arrangements in the region in 2016 compared to 2015.
Table 1: Key facts about public and private water supply arrangements in England
Public supplies Private supplies Population supplied Water supplied (l/day) Abstraction points Treatment works Service reservoirs Water supply zones Length of mains pipe (km)
54,614,767 13,850million 2,164 1,111 3,767 1,505 313,321
Population supplied Water supplied (l/day) Approximate number of private water supplies* Total number of local authorities Number of local authorities with private supplies
766,000 382 million
39,565
353
256
Water composition Surface sources Groundwater sources Mixed sources
64.5% 30% 5.5%
Water composition Surface influenced supplies Groundwater sources Mains water Unknown
21% 60% 15%
4%
3
Dr ink ing wa te r 2016
Figure 2: Companies supplying in England and Wales
4
Summary o f the Ch ie f Inspec to r ’s repor t f o r d r i nk ing wa te r i n Eng land
Drinking water quality testing
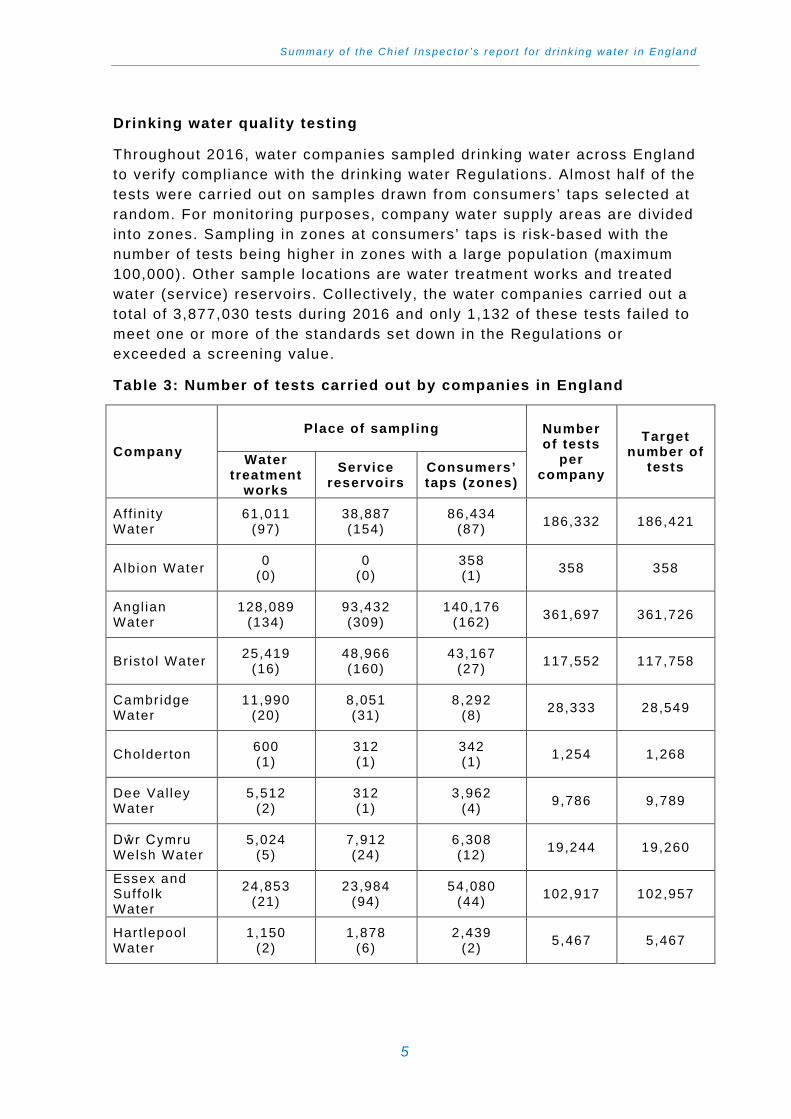
Throughout 2016, water companies sampled drinking water across England to veri fy compliance with the drinking water Regulat ions. Almost half of the tests were carried out on samples drawn from consumers’ taps selected at random. For monitoring purposes, company water supply areas are divided into zones. Sampling in zones at consumers’ taps is r isk-based with the number of tests being higher in zones with a large population (maximum 100,000). Other sample locations are water treatment works and treated water (service) reservoirs. Collectively, the water companies carr ied out a total of 3,877,030 tests during 2016 and only 1,132 of these tests fai led to meet one or more of the standards set down in the Regulat ions or exceeded a screening value.
Table 3: Number of tests carried out by companies in England
Company
Place of sampling Number of tests
per company
Target number of
tests Water treatment
works
Service reservoirs
Consumers’ taps (zones)
Af f in i ty Water
61,011 (97)
38,887 (154)
86,434 (87) 186,332 186,421
Albion Water 0 (0)
0 (0)
358 (1) 358 358
Angl ian Water
128,089 (134)
93,432 (309)
140,176 (162) 361,697 361,726
Br is to l Water 25,419 (16)
48,966 (160)
43,167 (27) 117,552 117,758
Cambridge Water
11,990 (20)
8,051 (31)
8,292 (8) 28,333 28,549
Cholderton 600 (1)
312 (1)
342 (1) 1,254 1,268
Dee Val ley Water
5,512 (2)
312 (1)
3,962 (4) 9,786 9,789
Dŵr Cymru Welsh Water
5,024 (5)
7,912 (24)
6,308 (12) 19,244 19,260
Essex and Suffo lk Water
24,853 (21)
23,984 (94)
54,080 (44) 102,917 102,957
Hart lepool Water
1,150 (2)
1,878 (6)
2,439 (2) 5,467 5,467
5
Dr ink ing wa te r 2016
Company
Place of sampling Number of tests
per company
Target number of
tests Water treatment
works
Service reservoirs
Consumers’ taps (zones)
Independent Water Networks
0 (0)
0 (0)
1,963 (10) 1,963 1,963
Northumbrian Water
41,954 (34)
63,337 (205)
73,717 (65) 179,008 179,355
Portsmouth Water
10,438 (19)
9,176 (31)
17,562 (13) 37,176 37,335
Peel Water 0 (0)
0 (0)
333 (1) 333 333
Bournemouth Water
14,051 (7)
6,054 (20)
20,218 (10) 40,323 40,548
Sutton and East Surrey Water
13,240 (7)
8,260 (32)
16,617 (20) 38,117 38,117
South East Water
82,066 (88)
70,074 (230)
92,607 (72) 244,747 244,747
Southern Water
73,783 (83)
60,634 (205)
101,235 (74) 235,652 235,829
SSE Water 0 (0)
0 (0)
10,013 (20) 10,013 10,013
South Staf fordshire Water
28,467 (19)
10,464 (35)
36,453 (20) 75,384 75,414
South West Water
51,420 (31)
79,115 (266)
71,659 (32) 202,194 202,312
Severn Trent Water
131,506 (129)
147,765 (473)
225,052 (191) 504,323 504,535
Thames Water
111,745 (97)
95,392 (380)
271,533 (252) 478,670 479,125
Uni ted Ut i l i t ies
108,760 (75)
109,427 (362)
197,500 (226) 415,687 415,955
Veol ia Water Projects
1,263 (2)
1,320 (6)
604 (1) 3,187 3,196
Wessex Water
66,901 (65)
93,310 (311)
59,275 (80) 219,486 219,730
Yorkshire Water
100,957 (57)
104,416 (342)
152,454 (70) 357,827 357,828
Total 1,100,199 (1,011)
1,082,478 (3,678)
1,694,353 (1,505) 3,877,030 3,879,888
Note : Numbers i n b racke ts re f l ec t the number o f works , rese rvo i rs o r zones opera ted by tha t company i n Eng land i n 2016 . Some compan ies a re pe rm i t ted to ca r ry ou t some tes ts on samp les taken f rom supp ly po in ts ra the r than f rom consumers ’ t aps .
6
Summary o f the Ch ie f Inspec to r ’s repor t f o r d r i nk ing wa te r i n Eng land
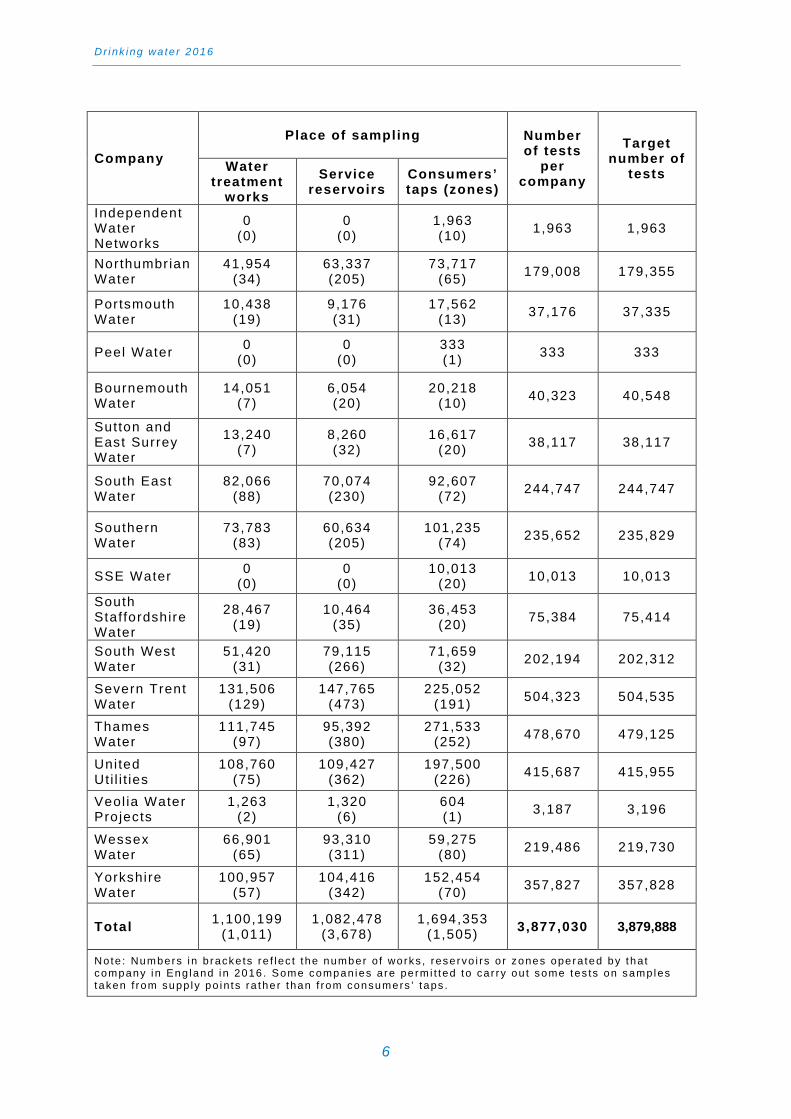
Overal l , in 2016, the f igure for public water supply compliance with the European Union (EU) Drinking Water Directive in England, was 99.96%. The drinking water quali ty compliance f igure is made up of tests for 39 di fferent microbiological and chemical parameters, and for 23 of these parameters the standard for compliance with the Water Supply (Water Quali ty) Regulat ions 2016 was met in relat ion to every test carried out in England. Where there have been fai lures to meet standards, the reasons are i l lustrated in Figure 4.
Figure 4: Number of failures of standards – England 2016
F i g u r es i nc l u de a l l f a i l u r es o f E U a nd na t i on a l s t a nd a rds t a k e n a t t r ea t me n t wo rk s , s e r v i c e r es e r vo i r s an d
t aps . T he c a t eg o r y ‘ o t h e r ’ i nc l u des Be nz o (a ) p y r en e 4 , N i t r i t e 4 , B ro ma t e 1 , F l uo r i d e 1
Compliance is a measure of end point monitoring which provides an easy to understand value for compliance with the Regulat ions and the directive for parametric values. Scheduled for 2017 is the transposit ion of the amendments to the requirements of the drinking water directive which introduces a r isk-based approach to monitoring. Over the next few years as companies use r isk-based monitoring to introduce or remove parameters from their schedule this wi l l add variabi l i ty to the compliance measure making comparison more di ff icul t .
7
Dr ink ing wa te r 2016
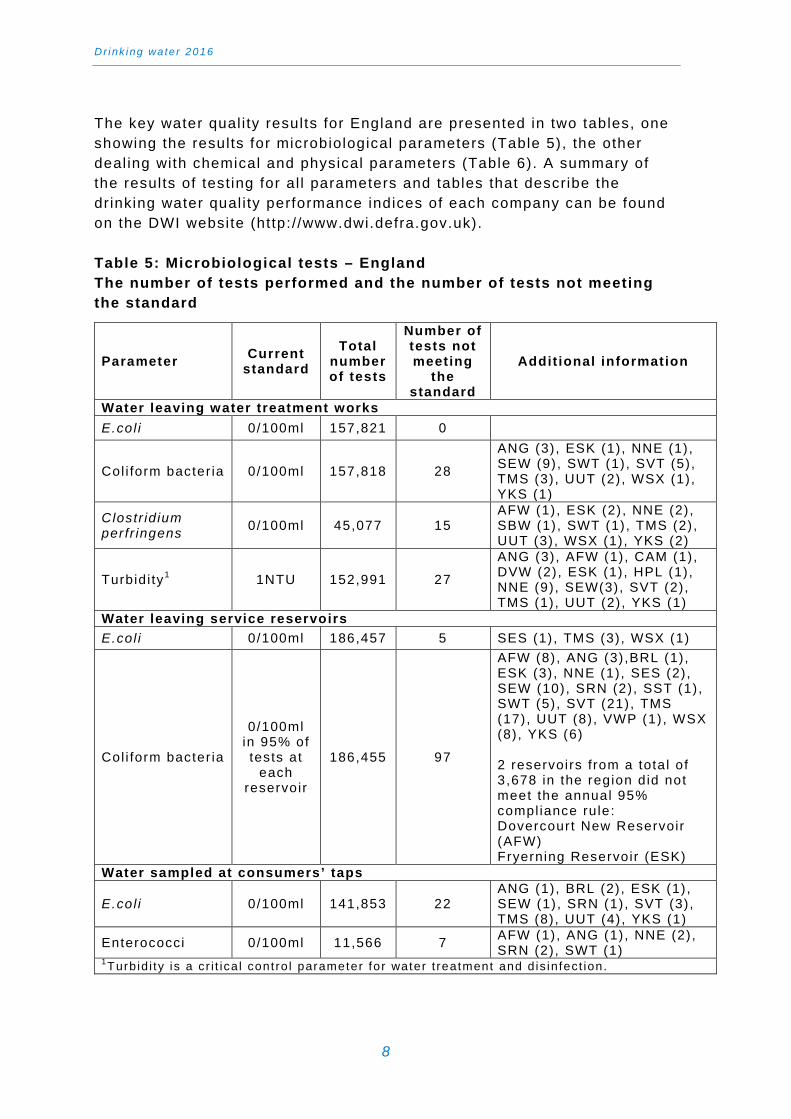
The key water qual i ty results for England are presented in two tables, one showing the results for microbiological parameters (Table 5), the other deal ing with chemical and physical parameters (Table 6). A summary of the results of testing for al l parameters and tables that describe the drinking water qual i ty performance indices of each company can be found on the DWI website (http://www.dwi.defra.gov.uk). Table 5: Microbiological tests – England The number of tests performed and the number of tests not meeting the standard
Parameter Current standard
Total number of tests
Number of tests not meeting
the standard
Addit ional information
Water leaving water treatment works E.col i 0/100ml 157,821 0
Col i form bacter ia 0/100ml 157,818 28
ANG (3) , ESK (1) , NNE (1) , SEW (9) , SWT (1) , SVT (5) , TMS (3) , UUT (2) , WSX (1) , YKS (1)
Clostr id ium perfr ingens 0/100ml 45,077 15
AFW (1) , ESK (2) , NNE (2) , SBW (1) , SWT (1) , TMS (2) , UUT (3) , WSX (1) , YKS (2)
Turbid i ty1 1NTU 152,991 27
ANG (3) , AFW (1) , CAM (1) , DVW (2) , ESK (1) , HPL (1) , NNE (9), SEW(3), SVT (2) , TMS (1) , UUT (2) , YKS (1)
Water leaving service reservoirs E.col i 0/100ml 186,457 5 SES (1) , TMS (3) , WSX (1)
Col i form bacter ia
0/100ml in 95% of tests at
each reservoir
186,455 97
AFW (8) , ANG (3) ,BRL (1) , ESK (3) , NNE (1), SES (2) , SEW (10), SRN (2), SST (1) , SWT (5) , SVT (21), TMS (17), UUT (8), VWP (1) , WSX (8) , YKS (6) 2 reservoirs from a tota l of 3,678 in the region did not meet the annual 95% compl iance ru le: Dovercourt New Reservoir (AFW) Fryerning Reservoir (ESK)
Water sampled at consumers’ taps
E.col i 0/100ml 141,853 22 ANG (1) , BRL (2) , ESK (1) , SEW (1) , SRN (1) , SVT (3) , TMS (8) , UUT (4) , YKS (1)
Enterococci 0/100ml 11,566 7 AFW (1) , ANG (1) , NNE (2) , SRN (2), SWT (1)
1Turb id i ty is a cr i t ica l cont ro l parameter for water t reatment and d is infect ion.
8
Summary o f the Ch ie f Inspec to r ’s repor t f o r d r i nk ing wa te r i n Eng land
In 2016, there were no fai lures of E.col i reported from water treatment works. This has never been achieved before and cont inues to demonstrate the commitment by the water industry to del iver exceptional ly high qual i ty water from water treatment works. The change of ethos to dr ive down r isk reduces compliance fai lures and events.
Moving to water storage; during 2016, there were f ive E.col i fai lures in service reservoirs, al l in England. In comparison with previous years, this is an improvement and continues to demonstrate strategies adopted by companies to assess and prior i t ise storage reservoirs which present the greatest r isk, taking action to inspect and remediate those at greatest r isk f i rst.
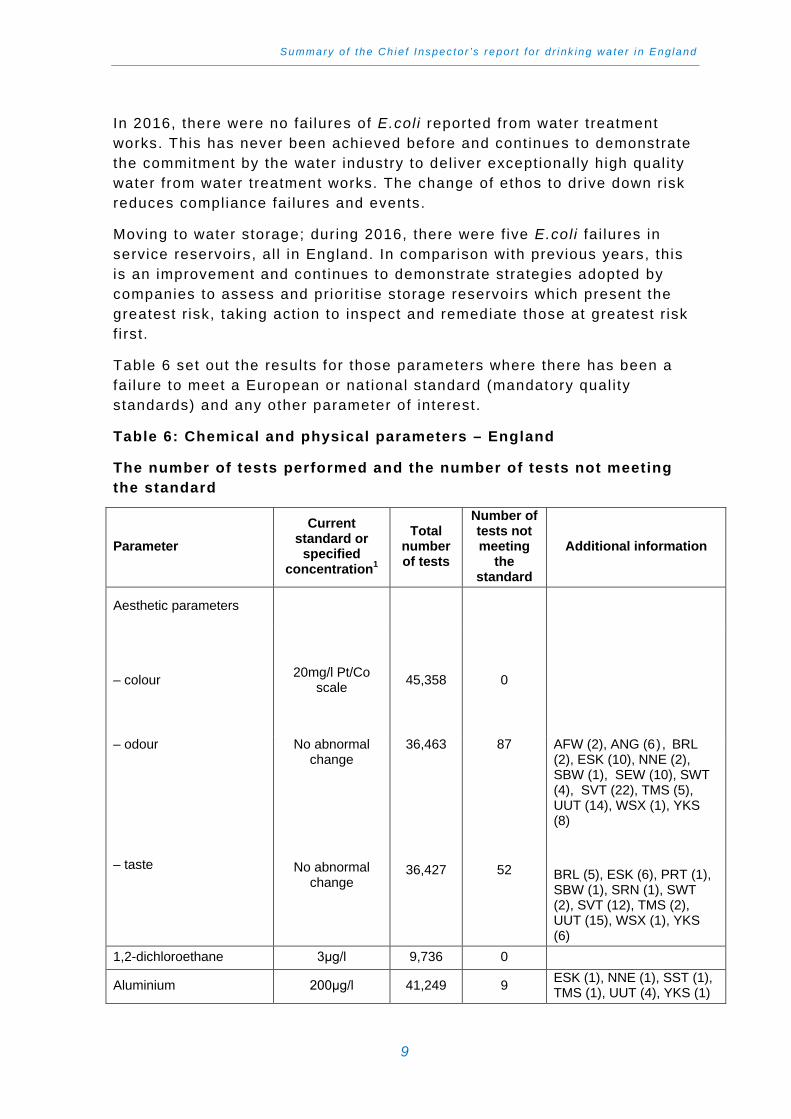
Table 6 set out the results for those parameters where there has been a fai lure to meet a European or national standard (mandatory qual i ty standards) and any other parameter of interest.
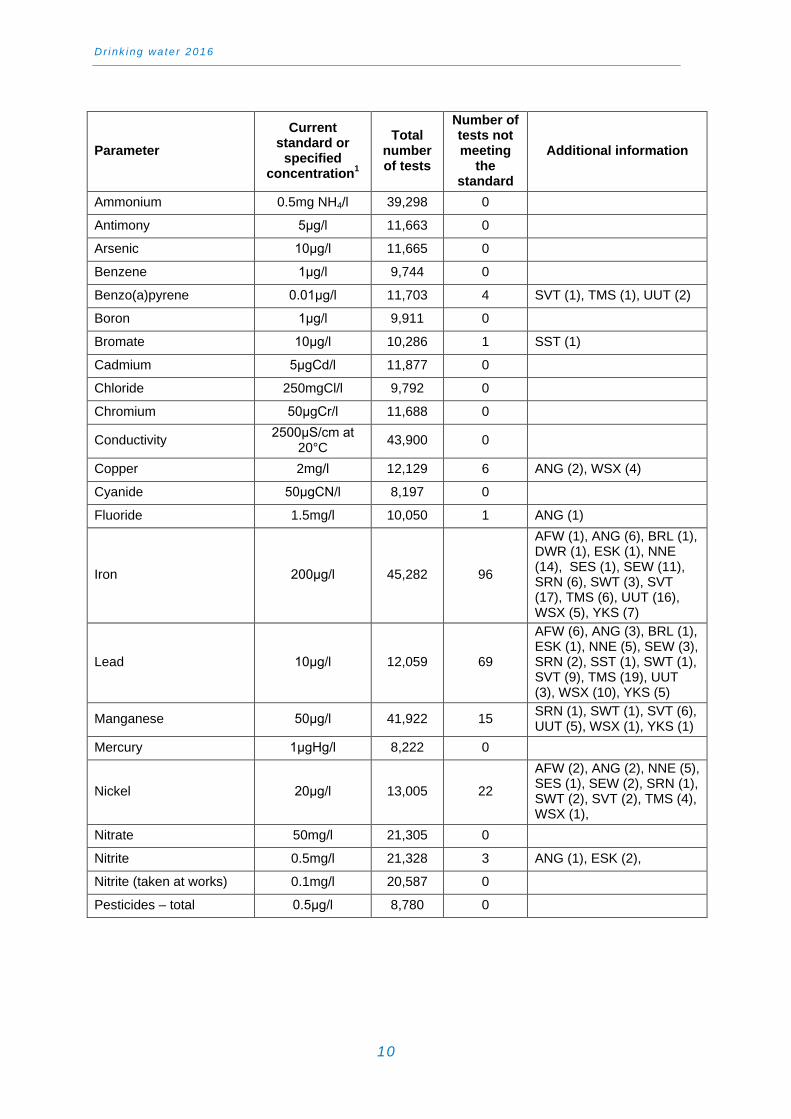
Table 6: Chemical and physical parameters – England
The number of tests performed and the number of tests not meeting the standard
Parameter Current
standard or specified
concentration1
Total number of tests
Number of tests not meeting
the standard
Additional information
Aesthetic parameters
– colour 20mg/l Pt/Co scale 45,358 0
– odour – taste
No abnormal change
No abnormal change
36,463
36,427
87
52
AFW (2), ANG (6) , BRL (2), ESK (10), NNE (2), SBW (1), SEW (10), SWT (4), SVT (22), TMS (5), UUT (14), WSX (1), YKS (8) BRL (5), ESK (6), PRT (1), SBW (1), SRN (1), SWT (2), SVT (12), TMS (2), UUT (15), WSX (1), YKS (6)
1,2-dichloroethane 3μg/l 9,736 0
Aluminium 200μg/l 41,249 9 ESK (1), NNE (1), SST (1), TMS (1), UUT (4), YKS (1)
9
Dr ink ing wa te r 2016
Parameter Current
standard or specified
concentration1
Total number of tests
Number of tests not meeting
the standard
Additional information
Ammonium 0.5mg NH4/l 39,298 0
Antimony 5μg/l 11,663 0
Arsenic 10μg/l 11,665 0
Benzene 1μg/l 9,744 0
Benzo(a)pyrene 0.01μg/l 11,703 4 SVT (1), TMS (1), UUT (2)
Boron 1μg/l 9,911 0
Bromate 10μg/l 10,286 1 SST (1)
Cadmium 5μgCd/l 11,877 0
Chloride 250mgCl/l 9,792 0
Chromium 50μgCr/l 11,688 0
Conductivity 2500μS/cm at 20°C 43,900 0
Copper 2mg/l 12,129 6 ANG (2), WSX (4)
Cyanide 50μgCN/l 8,197 0
Fluoride 1.5mg/l 10,050 1 ANG (1)
Iron 200μg/l 45,282 96
AFW (1), ANG (6), BRL (1), DWR (1), ESK (1), NNE (14), SES (1), SEW (11), SRN (6), SWT (3), SVT (17), TMS (6), UUT (16), WSX (5), YKS (7)
Lead 10μg/l 12,059 69
AFW (6), ANG (3), BRL (1), ESK (1), NNE (5), SEW (3), SRN (2), SST (1), SWT (1), SVT (9), TMS (19), UUT (3), WSX (10), YKS (5)
Manganese 50μg/l 41,922 15 SRN (1), SWT (1), SVT (6), UUT (5), WSX (1), YKS (1)
Mercury 1μgHg/l 8,222 0
Nickel 20μg/l 13,005 22
AFW (2), ANG (2), NNE (5), SES (1), SEW (2), SRN (1), SWT (2), SVT (2), TMS (4), WSX (1),
Nitrate 50mg/l 21,305 0
Nitrite 0.5mg/l 21,328 3 ANG (1), ESK (2),
Nitrite (taken at works) 0.1mg/l 20,587 0
Pesticides – total 0.5μg/l 8,780 0
10
Summary o f the Ch ie f Inspec to r ’s repor t f o r d r i nk ing wa te r i n Eng land
Parameter Current
standard or specified
concentration1
Total number of tests
Number of tests not meeting
the standard
Additional information
Pesticide – individual3 0.1μg/l 216,003 54
2,4-D PRT (1) Bentazone ESK (4) Clopyralid UUT (1) Glyphosate UUT (1) Metaldehyde AFW (9), ANG (18), DWR (1), ESK (2), SEW (2), SRN (2), SVT (3), TMS (2), YKS (8)
pH (Hydrogen ion) 6.5 – 9.5 45,441 2 AFW (1), YKS (1) Polycyclic Aromatic Hydrocarbons (PAH) 0.1μg/l 11,666 0
Radioactivity
Radon 100 Bq/l 1,437 0
Indicative dose 0.1mSv/year 41 0
Tritium 100Bq/l 1,529 0
Selenium 0.1μg/l 11,515 0
Sodium 200mg Na/l 11,800 0
Sulphate 250mg SO4/l 9,717 0 Tetrachloroethene and Trichloroethene 10μg/l 11,272 0 The standard applies to the
sum of the two substances Tetrachloromethane 3μg/l 11,255 0
Trihalomethanes total 100μg/l 11,786 0 Turbidity (at consumers’ taps) 4NTU 47,500 7 ANG (1), ESK (1), SVT (2),
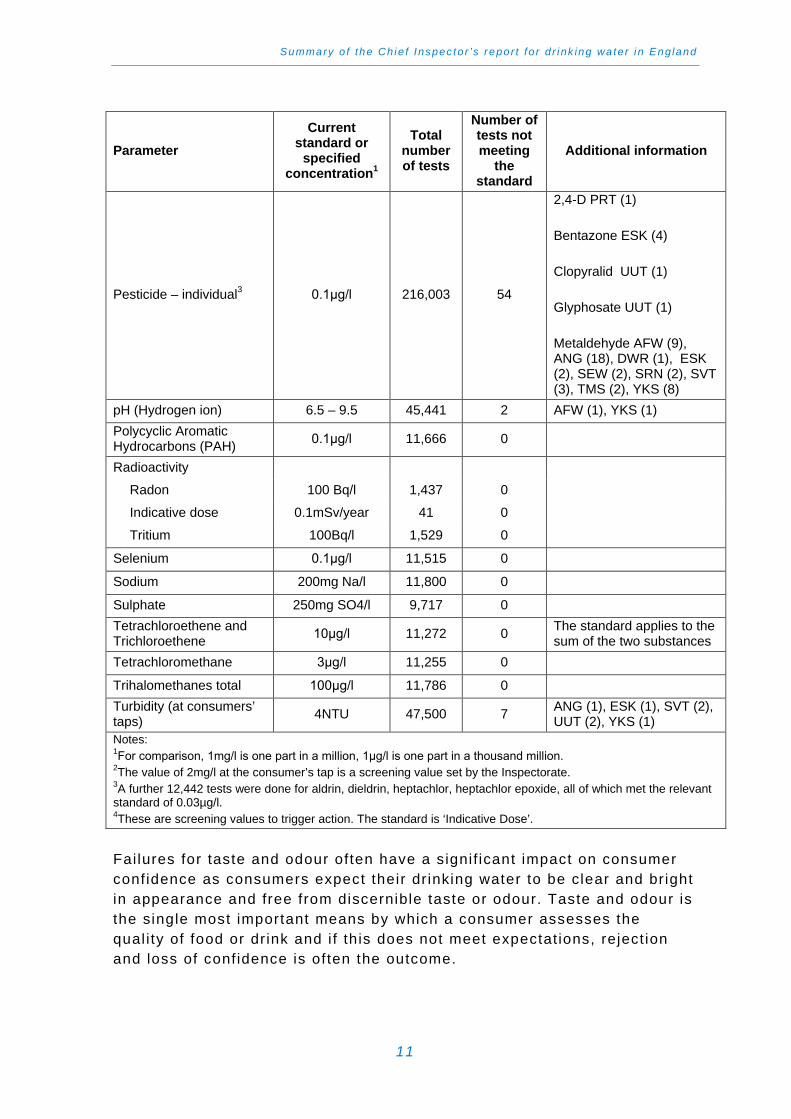
UUT (2), YKS (1) Notes: 1For comparison, 1mg/l is one part in a million, 1μg/l is one part in a thousand million. 2The value of 2mg/l at the consumer’s tap is a screening value set by the Inspectorate. 3A further 12,442 tests were done for aldrin, dieldrin, heptachlor, heptachlor epoxide, all of which met the relevant standard of 0.03µg/l. 4These are screening values to trigger action. The standard is ‘Indicative Dose’. Failures for taste and odour often have a signif icant impact on consumer confidence as consumers expect their dr inking water to be clear and bright in appearance and free from discernible taste or odour. Taste and odour is the single most important means by which a consumer assesses the qual i ty of food or dr ink and i f this does not meet expectat ions, reject ion and loss of conf idence is often the outcome.
11
Dr ink ing wa te r 2016
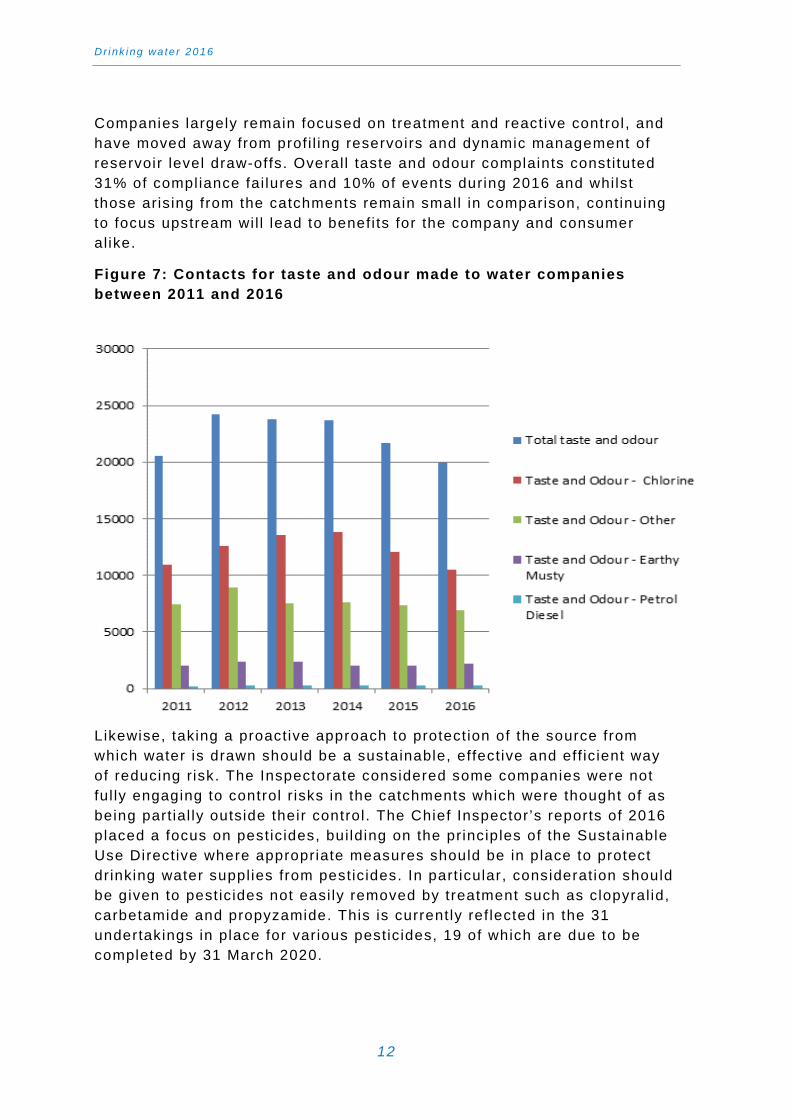
Companies largely remain focused on treatment and reactive control , and have moved away from prof i l ing reservoirs and dynamic management of reservoir level draw-offs. Overal l taste and odour complaints const i tuted 31% of compliance fai lures and 10% of events during 2016 and whilst those aris ing from the catchments remain smal l in comparison, cont inuing to focus upstream wi l l lead to benefi ts for the company and consumer al ike.
Figure 7: Contacts for taste and odour made to water companies between 2011 and 2016
Likewise, taking a proactive approach to protect ion of the source from which water is drawn should be a sustainable, effective and eff ic ient way of reducing risk. The Inspectorate considered some companies were not ful ly engaging to control r isks in the catchments which were thought of as being part ial ly outside their control. The Chief Inspector’s reports of 2016 placed a focus on pestic ides, bui lding on the principles of the Sustainable Use Directive where appropriate measures should be in place to protect dr inking water supplies from pestic ides. In part icular, consideration should be given to pest ic ides not easi ly removed by treatment such as clopyral id, carbetamide and propyzamide. This is current ly ref lected in the 31 undertakings in place for various pestic ides, 19 of which are due to be completed by 31 March 2020.
12
Summary o f the Ch ie f Inspec to r ’s repor t f o r d r i nk ing wa te r i n Eng land
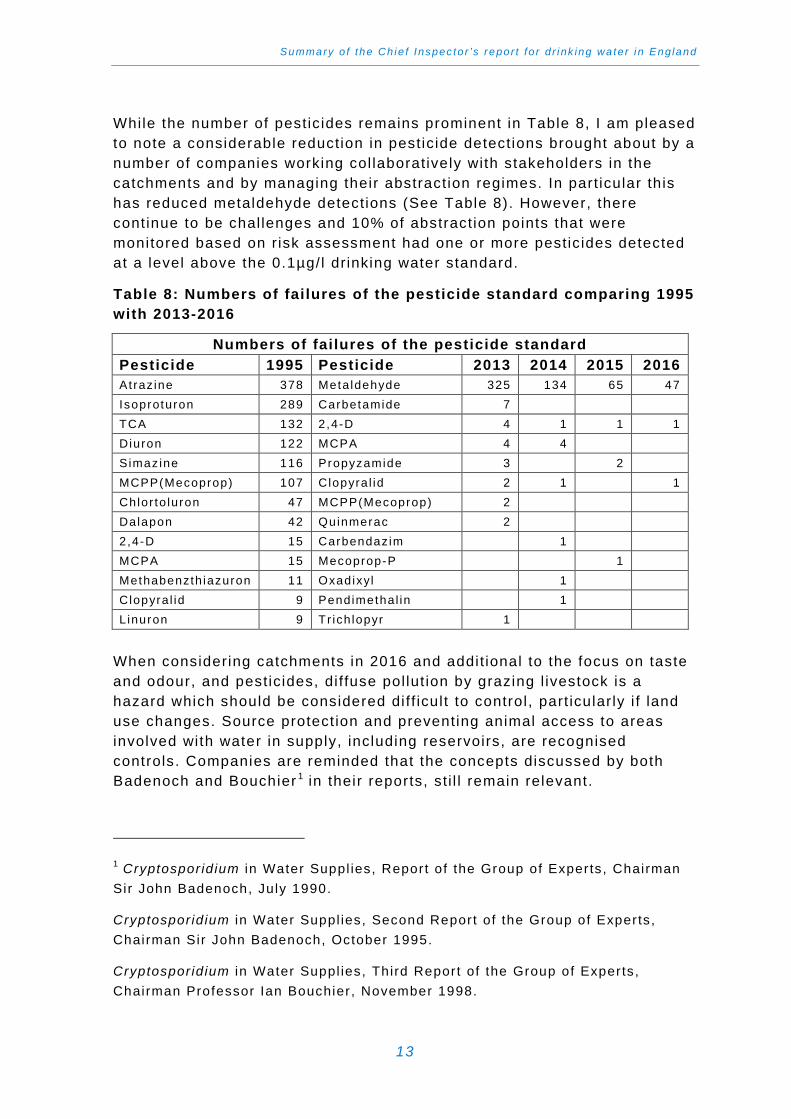
While the number of pestic ides remains prominent in Table 8, I am pleased to note a considerable reduction in pesticide detections brought about by a number of companies working col laboratively with stakeholders in the catchments and by managing their abstraction regimes. In part icular this has reduced metaldehyde detections (See Table 8). However, there cont inue to be challenges and 10% of abstraction points that were monitored based on r isk assessment had one or more pestic ides detected at a level above the 0.1µg/l drinking water standard.
Table 8: Numbers of failures of the pesticide standard comparing 1995 with 2013-2016
Numbers of failures of the pesticide standard Pesticide 1995 Pesticide 2013 2014 2015 2016 Atraz ine 378 Meta ldehyde 325 134 65 47 Isoproturon 289 Carbetamide 7 TCA 132 2,4-D 4 1 1 1 Diuron 122 MCPA 4 4 Simazine 116 Propyzamide 3 2 MCPP(Mecoprop) 107 Clopyra l id 2 1 1 Chlor to luron 47 MCPP(Mecoprop) 2 Dalapon 42 Quinmerac 2 2,4-D 15 Carbendaz im 1 MCPA 15 Mecoprop-P 1 Methabenzth iazuron 11 Oxadixyl 1 Clopyra l id 9 Pendimethal in 1 Linuron 9 Tr ich lopyr 1
When considering catchments in 2016 and addit ional to the focus on taste and odour, and pesticides, di f fuse pol lut ion by grazing l ivestock is a hazard which should be considered di ff icul t to control, part icular ly i f land use changes. Source protect ion and preventing animal access to areas involved with water in supply, including reservoirs, are recognised controls. Companies are reminded that the concepts discussed by both Badenoch and Bouchier 1 in their reports, st i l l remain relevant.
1 Cryptospor id ium in Water Suppl ies, Report of the Group of Experts, Chairman Sir John Badenoch, July 1990.
Cryptosporid ium in Water Suppl ies, Second Report of the Group of Experts, Chairman Sir John Badenoch, October 1995.
Cryptosporid ium in Water Suppl ies, Third Report of the Group of Experts, Chairman Professor Ian Bouchier , November 1998.
13
Dr ink ing wa te r 2016
Management of catchments used for drinking water is crucial to reducing the need to remove pol lutants and prevent them from entering supply. However, water treatment works must be capable of treating the qual i ty of raw water that they receive and where raw water qual i ty can change due to events in the catchment, preventat ive action may well be appropriate, part icularly for chal lenges arising from Cryptosporidium. In Q1 of the Chief Inspector’s Report 2016, I was pleased to report the actions taken by Dŵr Cymru Welsh Water in response to a raw water qual i ty deterioration event affect ing Cwm Dulyn works near Caernarfon, Gwynedd, North Wales which is l ikely to have prevented a signif icant event.
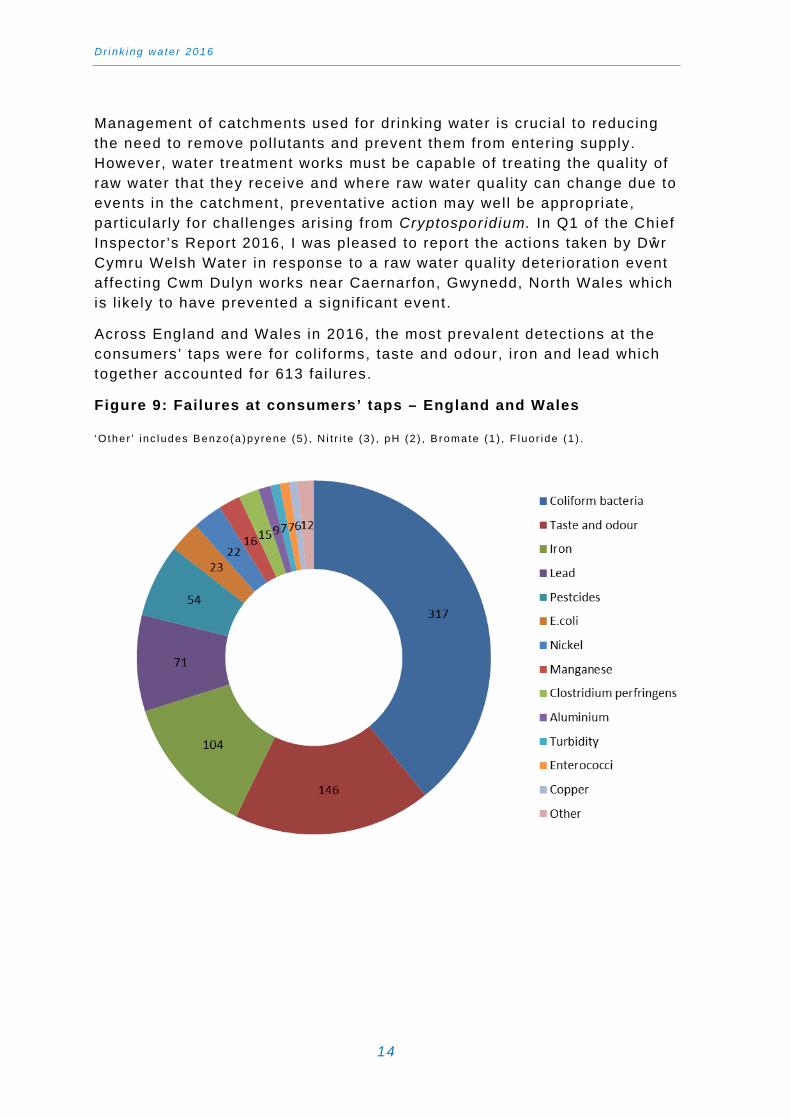
Across England and Wales in 2016, the most prevalent detections at the consumers’ taps were for col i forms, taste and odour, i ron and lead which together accounted for 613 fai lures.
Figure 9: Failures at consumers’ taps – England and Wales
‘O the r ’ i nc ludes Benzo(a )pyrene (5 ) , N i t r i t e (3 ) , pH (2 ) , B romate (1 ) , F luo r ide (1 ) .
14
Summary o f the Ch ie f Inspec to r ’s repor t f o r d r i nk ing wa te r i n Eng land
During the equivalent period, the Inspectorate received 197 not i f icat ions of events affecting single propert ies. There has been a 68% increase between 2012 and 2016 of such events, and of these, 59 required the issuing of warning/advice Notices, such as boi l water or do not dr ink Notices. The reasons for this change are di ff icul t to determine and may reflect better responses by companies to complaints or more effective water f i t t ings inspections. Companies are encouraged to publish their annual water f i t t ings report to make strategic object ives, activi t ies and subsequent outcomes available, as these are areas which cont inue to contribute signif icant ly to compliance fai lures. While not al l fai lures detected in tap samples are due to consumers’ plumbing, just over 24% of fai lures in 2016 were attr ibuted to consumers’ domestic systems.
I am pleased to see the proactive and progressive adoption of a wider lead strategy by some companies who recognise the effect lead has on the health of young people. Lead remains an area of concern and a signif icant contributor to compliance fai lures, with 71 fai lures across England and Wales in 2016. The number of connect ions of lead through household supply pipes remains considerable in older housing stock and represents an ongoing risk. The replacement of lead as a longer term strategy would reduce this r isk and also derive benefi ts for companies where mit igation by phosphate dosing has become long term with the inherent ongoing costs associated with purchase and removal from waste. These strategies may take the form of pipe replacement or a re-l ining strategy where lead pipe remediation can be targeted in numbers result ing in eff iciencies and longer term savings. A number of companies are also developing a mult i -objective pol icy of education, awareness, f i t t ings inspections, working with local authori t ies and educational establ ishments as well as profi l ing phosphate dosing based upon r isk to bring benefi ts to consumers in the shorter-term.
Final ly, in considerat ion of fai lures at taps, nickel remains prominent with 22 fai lures in 2016. Nickel may be present in coatings on modern tap f i t t ings which are widely avai lable, approved and are often the cause of fai lures in this area. Advice should be offered by companies to consumers where these fai lures occur.
15
Dr ink ing wa te r 2016
Events
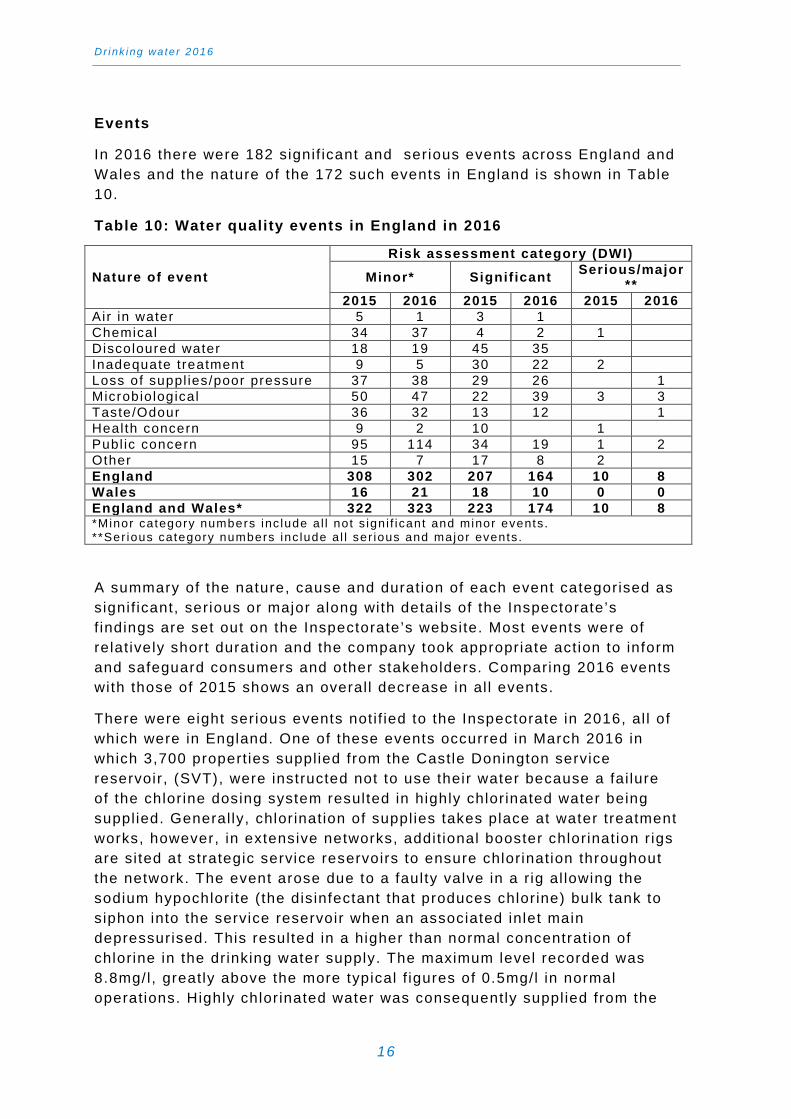
In 2016 there were 182 signif icant and serious events across England and Wales and the nature of the 172 such events in England is shown in Table 10.
Table 10: Water quality events in England in 2016
Nature of event
Risk assessment category (DWI)
Minor* Signif icant Serious/major**
2015 2016 2015 2016 2015 2016 Air in water 5 1 3 1 Chemical 34 37 4 2 1 Discoloured water 18 19 45 35 Inadequate treatment 9 5 30 22 2 Loss of suppl ies/poor pressure 37 38 29 26 1 Microbiological 50 47 22 39 3 3 Taste/Odour 36 32 13 12 1 Heal th concern 9 2 10 1 Publ ic concern 95 114 34 19 1 2 Other 15 7 17 8 2 England 308 302 207 164 10 8 Wales 16 21 18 10 0 0 England and Wales* 322 323 223 174 10 8 *Minor category numbers inc lude a l l not s ign i f icant and minor events. **Ser ious category numbers inc lude a l l ser ious and major events.
A summary of the nature, cause and duration of each event categorised as signif icant, serious or major along with detai ls of the Inspectorate’s f indings are set out on the Inspectorate’s website. Most events were of relat ively short durat ion and the company took appropriate action to inform and safeguard consumers and other stakeholders. Comparing 2016 events with those of 2015 shows an overal l decrease in al l events.
There were eight serious events not i f ied to the Inspectorate in 2016, al l of which were in England. One of these events occurred in March 2016 in which 3,700 propert ies supplied from the Castle Donington service reservoir, (SVT), were instructed not to use their water because a fai lure of the chlor ine dosing system resulted in highly chlor inated water being supplied. General ly, chlor ination of suppl ies takes place at water treatment works, however, in extensive networks, addit ional booster chlorination r igs are si ted at strategic service reservoirs to ensure chlorination throughout the network. The event arose due to a faulty valve in a r ig al lowing the sodium hypochlori te ( the disinfectant that produces chlor ine) bulk tank to siphon into the service reservoir when an associated inlet main depressurised. This resulted in a higher than normal concentrat ion of chlorine in the drinking water supply. The maximum level recorded was 8.8mg/l, greatly above the more typical f igures of 0.5mg/l in normal operations. Highly chlor inated water was consequently suppl ied from the
16
Summary o f the Ch ie f Inspec to r ’s repor t f o r d r i nk ing wa te r i n Eng land
site into supply result ing in the company issuing a ‘Do Not Use’ (DNU) notice to approximately 3,700 propert ies for a period of 26 hours. The company isolated the chlorine dosing equipment at the service reservoir, and f lushed the supply network to remove the highly chlorinated water. However, the event resulted in the supply of unwholesome water to some consumers, and caused some consumers to reject the water suppl ied to them. The Inspectorate’s investigat ion has concluded that this serious event was avoidable and that there were a number of missed opportunit ies to identi fy and rect i fy the problem before the event and to mit igate i ts impact. The company was caut ioned for the offence of supplying water unfi t for human consumption under Sect ion 70 of the Water Industry Act (1991).
A second event of signif icant learning occurred in July 2016 where the company investigated reports of discolouration and an abnormal odour from a single business property (a food manufacturer) on an industrial estate in Thorne, near Doncaster, (YKS). Results of samples taken as part of the f lushing programme in response to wider discolouration in the local area, ident i f ied bacteria of faecal or igin. Consumers and commercial premises (3,648 propert ies) in Thorne and Moorends were advised not to dr ink their tap water. The company carr ied out plumbing and f i t t ings inspections on al l propert ies within the industrial estate. A poultry processing factory was ident i f ied with a recently instal led mains-fed hot water system, which had been instal led without not i f ication to Yorkshire Water, as required by the Water Supply (Water Fitt ings) Regulat ions 1999. This hot water instal lat ion was a sealed system, and the company’s water regulat ions inspector was unable to conf irm that the mains supply into the premises was protected from backflow from the system by an appropriate air-gap or other backf low protection arrangement. The factory was disconnected from the publ ic supply network and the company exercised i ts duties under Sect ion 75 of the Water Industry Act 1991, serving a Notice on the premises requir ing the instal lat ion of a check valve to the hot water system and a double check valve on the incoming main. There were also other infr ingements including four cross connections. In March 2017, the poultry company were charged with 37 offences under the f i t t ings regulations and the tr ial is scheduled for September 2017. The company have shared the detai ls of the sealed water system for the wider learning of the industry to prevent a recurrence. Equal ly, the application of the f i t t ings regulat ions emphasises the role water companies have to protect the wider supply.
17
Dr ink ing wa te r 2016
Audits
In 2016, the procurement, del ivery and use of treatment chemicals became the focus of a series of audits, the outcome of these audits was shared in Quarter 4. However, there were both good and bad examples of procurement, pre-del ivery checks, use of key control , locks, signage, procedures and supervision. Nearly 30 years on from one of the most signif icant incidents in the water industry, which involved the accidental contaminat ion of the drinking water supply to the town of Camelford, Cornwall , in July 1988 where 20 tonnes of aluminium sulphate was inadvertent ly added to the water supply, there st i l l remain clear shortfal ls in the control of del ivery and use of chemicals. Although the fol lowing event was not in 2016, this event emphasises the circumstances that can and did happen after these audits took place. In February 2017, ferr ic sulphate arr ived on site at Elmer Works, (SES), with a pre-arranged del ivery of 2,000 l i tres (contained in two bulk containers each holding 1,000 l i t res). These were to be transferred into the ferr ic sulphate storage tank on si te. The del ivery vehicle was a curtain-sided lorry carrying mult iple containers of dif ferent treatment chemicals, including two bulk containers of ferr ic sulphate and one bulk container of sodium hypochlori te solution. The driver incorrectly discharged sodium hypochlori te along with one container of ferr ic sulphate instead of the two containers of ferr ic sulphate into the receiving ferr ic sulphate storage tank. As a result of sodium hypochlori te mixing with ferr ic sulphate in the storage tank, chlorine gas was released and the works was evacuated. Whi lst the del ivery procedure was inadequate and the event was avoidable, the company took immediate action: to shut down Elmer water treatment works and water qual i ty was therefore not affected; to evacuate the si te; to assess with the emergency authori t ies r isks to local residents; and to rezone i ts distr ibution system to maintain suppl ies of water to consumers. This is, however, a near repeat of an event in 2007 at Bovey Cross works, (SWW) and water companies must consider any del ivery as a high r isk area and have ful ly r isk assessed this area with robust mit igations in place.
Regulatory strategies
This report presents the f i rst outputs of regulatory strategies after nearly two years of development and seeks to develop further r isk-based analysis of company performance. This bui lds upon the principles of better regulat ion by analysing information in a proport ionate, consistent, equitable and transparent way. The Inspectorate has consulted and worked with the Water Industry to seek a methodology which recognises and encourages best practice in the industry whilst el ic i t ing the best outcome
18
Summary o f the Ch ie f Inspec to r ’s repor t f o r d r i nk ing wa te r i n Eng land
for consumers. This strategy is part of a longer term development to analyse key areas of industry practice relevant to water qual i ty rather than focusing on simple parameter fai lures.
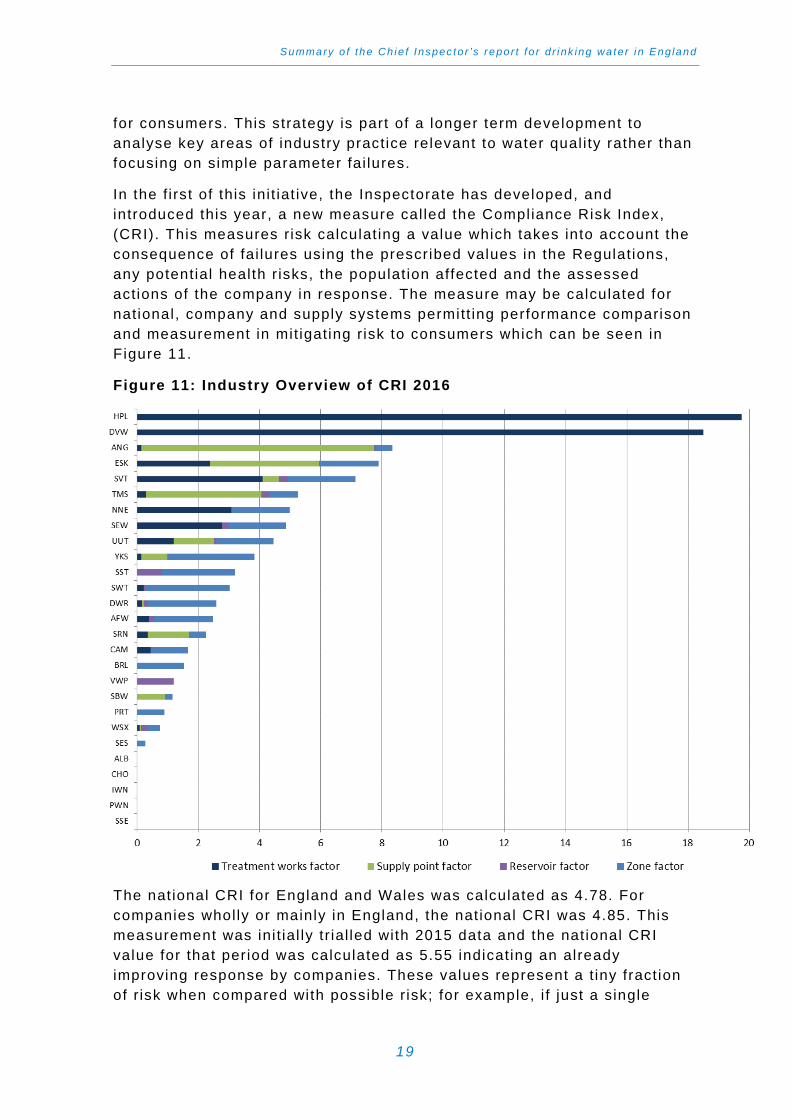
In the f i rst of this init iat ive, the Inspectorate has developed, and introduced this year, a new measure cal led the Compliance Risk Index, (CRI). This measures r isk calculat ing a value which takes into account the consequence of fai lures using the prescribed values in the Regulations, any potential health r isks, the populat ion affected and the assessed actions of the company in response. The measure may be calculated for national, company and supply systems permitt ing performance comparison and measurement in mit igating r isk to consumers which can be seen in Figure 11.
Figure 11: Industry Overview of CRI 2016
The nat ional CRI for England and Wales was calculated as 4.78. For companies wholly or mainly in England, the nat ional CRI was 4.85. This measurement was ini t ial ly tr ial led with 2015 data and the nat ional CRI value for that period was calculated as 5.55 indicating an already improving response by companies. These values represent a t iny fract ion of r isk when compared with possible r isk; for example, i f just a single
19
Dr ink ing wa te r 2016
fai lure in a year of every parameter to every consumer where the company took no act ion was taken, this would calculate as 1,940. In 2015, the company with the highest r isk registered a value of 19.96 but had responded to drive their r isk down to 8.34 in 2016. This was by col laborative working in their catchments to reduce risks from pest icides, an example of r isk reduction in pract ice.
A few companies in 2015 and 2016 wil l have become aware of the Inspectorate’s strategy to determine the l ikel ihood of regulatory fai lure. This strategy seeks to understand which companies are most l ikely to breach Regulations through fai lure to respond to previous occurrences and apply learning. Ident i f ication of those companies is derived from responses to recommendations, a topic developed in CIR 2016 Q4. This establ ished that the majori ty of recommendations were in the area of management and, within this, that the greatest number of recommendations related to deficiencies in r isk assessment. This f inding was of concern as these areas form the cornerstones of company control and effective mit igation. As a regulator, recommendations form the f i rst level of intervention from assessments and there is a duty to fol low these up to determine appl icat ion by companies. To effect this, a score is assigned to the recommendation and then a second score fol lowing the company response. The compilat ion of these scores ranks the companies into high, medium or low r isk. Those companies which are found to be in the high r isk area result in intervention by the Inspectorate with enforcement action, usually in the form of a transformation programme. In 2015 and 2016 both Severn Trent Water and United Uti l i t ies undertook a transformation programme. I am pleased to say that Severn Trent took decisive action at the most senior level and the outcome is such that they have reduced their r isk within a two-year period. The Inspectorate wil l cont inue to develop this metr ic for the benefi t of consumers.
Going forward, the Inspectorate is developing an Event Risk Index, bui lding upon the principles of the CRI. With in excess of 500 events in 2016, understanding the r isk behaviour of water companies to the mit igation and management of events is a cr i t ical strategic concern of the Inspectorate. The expectat ion of the Inspectorate is for companies to become resi l ient through their people, processes and procedures. Companies should also check their supply arrangements to ensure f irst ly, that incidents are reduced or, should there be an incident, that their response is such that there is no discernible effect on consumers. The f irst output for these measure should be available in 2018. After that the Inspectorate wi l l look to develop further key measures.
The Inspectorate’s strategic programme seeks to ensure that companies consider water quali ty r isks and objectives upon which business plans can bui ld for the long term, driving cont inued conf idence in the industry by
20
Summary o f the Ch ie f Inspec to r ’s repor t f o r d r i nk ing wa te r i n Eng land
consumers and al l those who have vested interests. I t is nonsensical to dr ive short- term polar ised measures when the industry is asset heavy and long-term investment in those assets as well as col laboration with stakeholders, such as those associated with catchment and domestic systems, are key to maintaining qual i ty. Focusing on and reducing risk in the facing challenges of resource, pol lut ion, changing demographics and demands over the coming decades requires planning to achieve the far object ives. This report has sought to develop those object ives when discussing lead, pest ic ides and the supply system from source to tap. Part icularly though, those companies where events and incidents have been a direct result of fai lure to address key r isks, part icularly where they are repeating, wi l l be aware of the changed strategic focus.
21

Drinking Water Inspectorate | Nobel House, 17 Smith Square | London | SW1P 3JR | Tel: 0300 068 6400
www.dwi.gov.uk
PB 13948


