Drinking Water and Sanitation Facilities in the Indian Communities Indian Health Service, California Area 2014 Best Practices Conference Tuesday, May 20, 2014 Christopher Brady, Deputy Director Sanitation Facilities Construction Program
Transcript
Drinking Water and Sanitation
Facilities in the Indian
Communities
Indian Health Service, California Area
2014 Best Practices Conference
Tuesday, May 20, 2014
Christopher Brady, Deputy Director
Sanitation Facilities Construction Program
2
Introduction
Topics:
• Introduction and background of the Sanitation Facilities
Construction (SFC) Program
• SFC mission activities
• Overview of SFC services and funding levels
• SFC database – Sanitation Tracking and Reporting
System (STARS)
• 2014 drought and preparedness and response activities
• Questions/answers
SFC Program
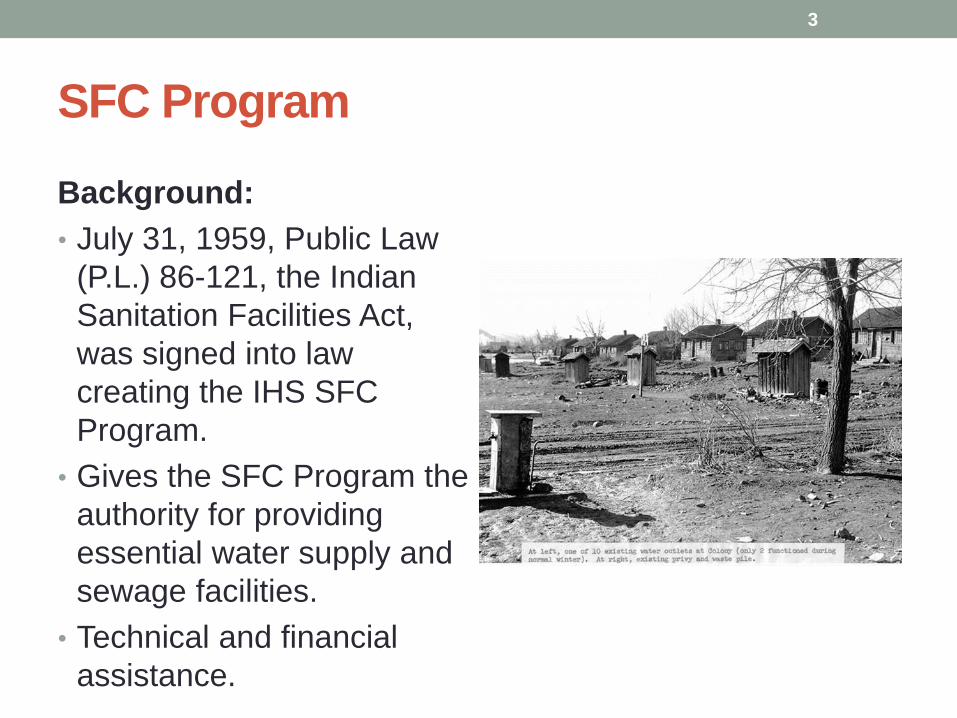
Background:
• July 31, 1959, Public Law
(P.L.) 86-121, the Indian
Sanitation Facilities Act,
was signed into law
creating the IHS SFC
Program.
• Gives the SFC Program the
authority for providing
essential water supply and
sewage facilities.
• Technical and financial
assistance.
3
SFC Program
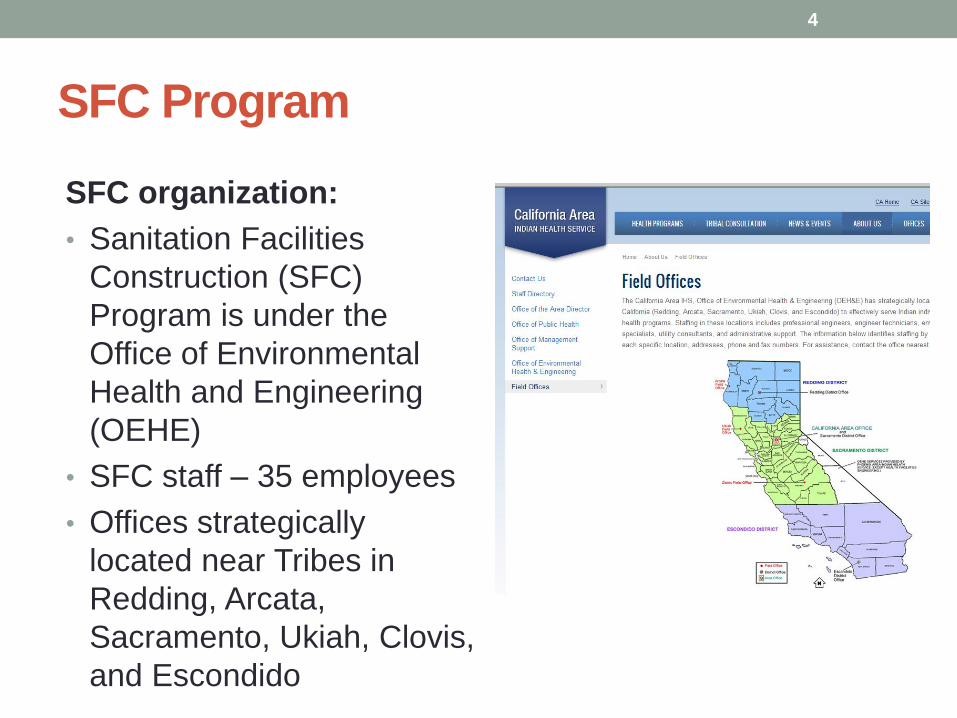
SFC organization:
• Sanitation Facilities
Construction (SFC)
Program is under the
Office of Environmental
Health and Engineering
(OEHE)
• SFC staff – 35 employees
• Offices strategically
located near Tribes in
Redding, Arcata,
Sacramento, Ukiah, Clovis,
and Escondido
4
SFC Program
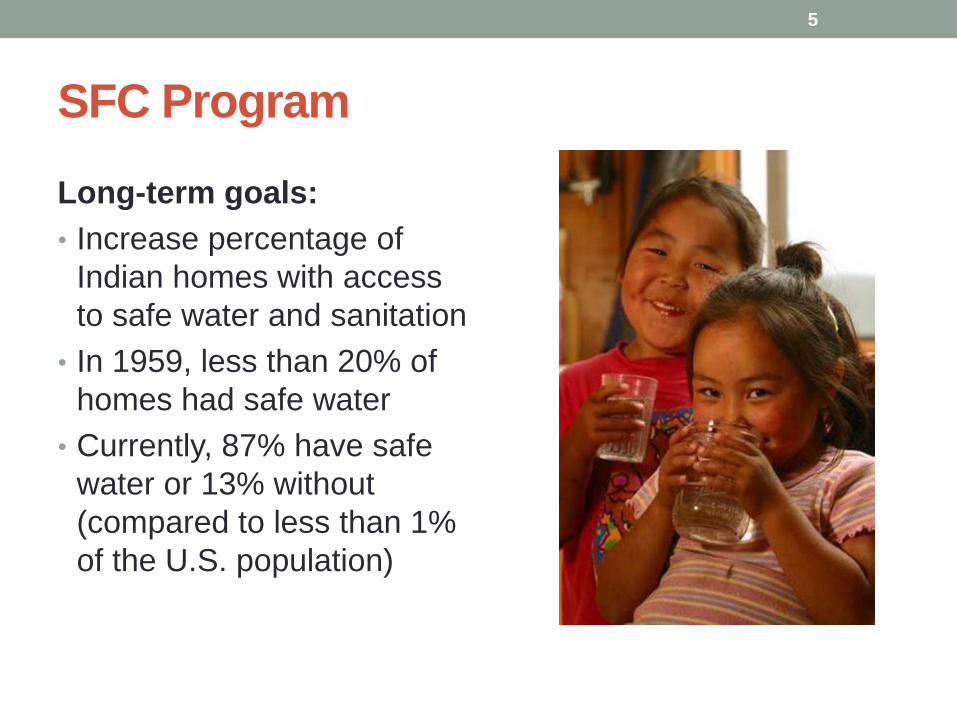
Long-term goals:
• Increase percentage of
Indian homes with access
to safe water and sanitation
• In 1959, less than 20% of
homes had safe water
• Currently, 87% have safe
water or 13% without
(compared to less than 1%
of the U.S. population)
5
SFC Program
Mission activities:
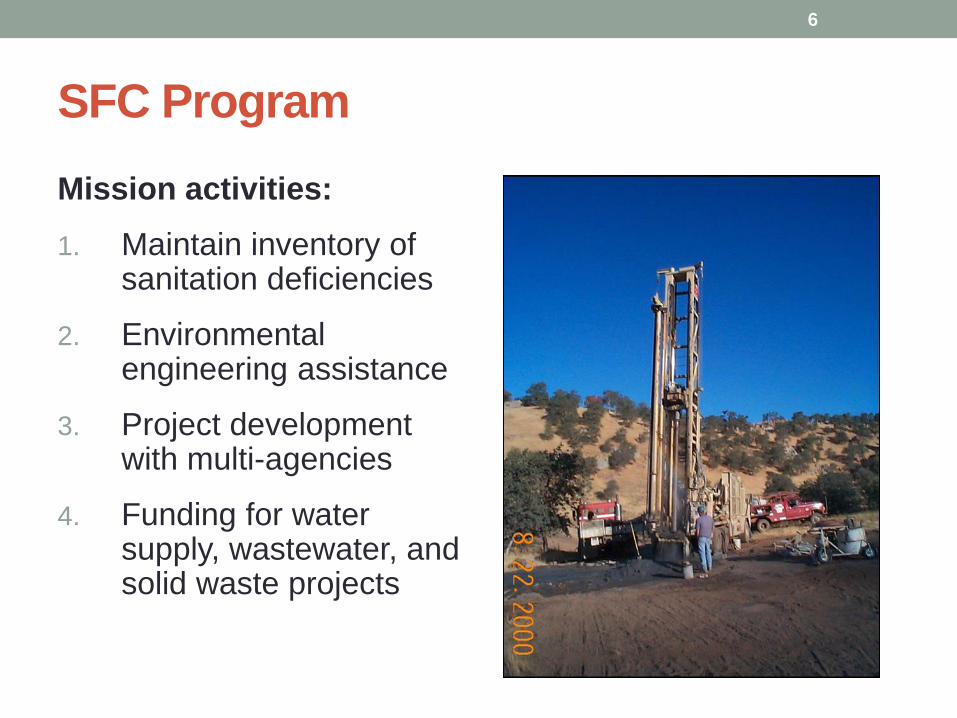
1. Maintain inventory of sanitation deficiencies
2. Environmental engineering assistance
3. Project development with multi-agencies
4. Funding for water supply, wastewater, and solid waste projects
6
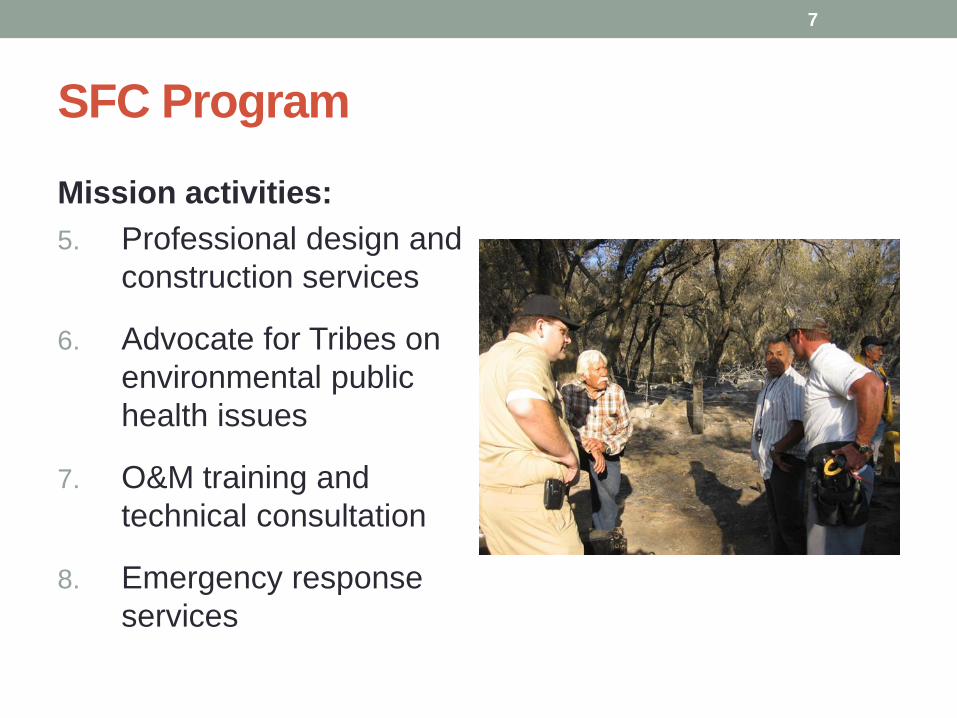
SFC Program
Mission activities:
5. Professional design and
construction services
6. Advocate for Tribes on
environmental public
health issues
7. O&M training and
technical consultation
8. Emergency response
services
7
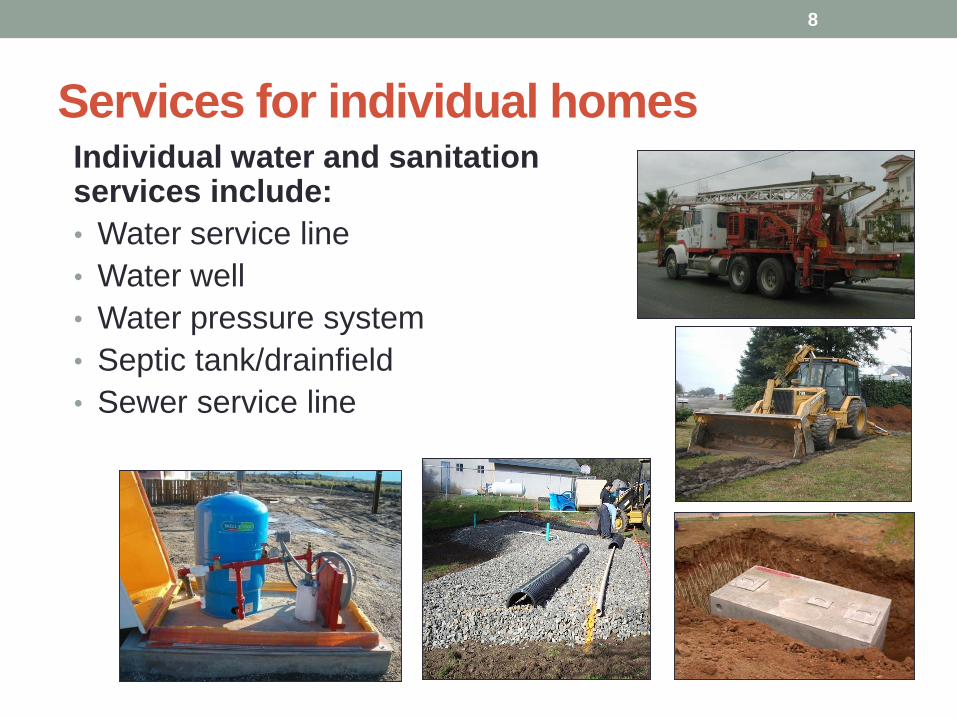
Services for individual homesIndividual water and sanitation services include:
• Water service line
• Water well
• Water pressure system
• Septic tank/drainfield
• Sewer service line
8
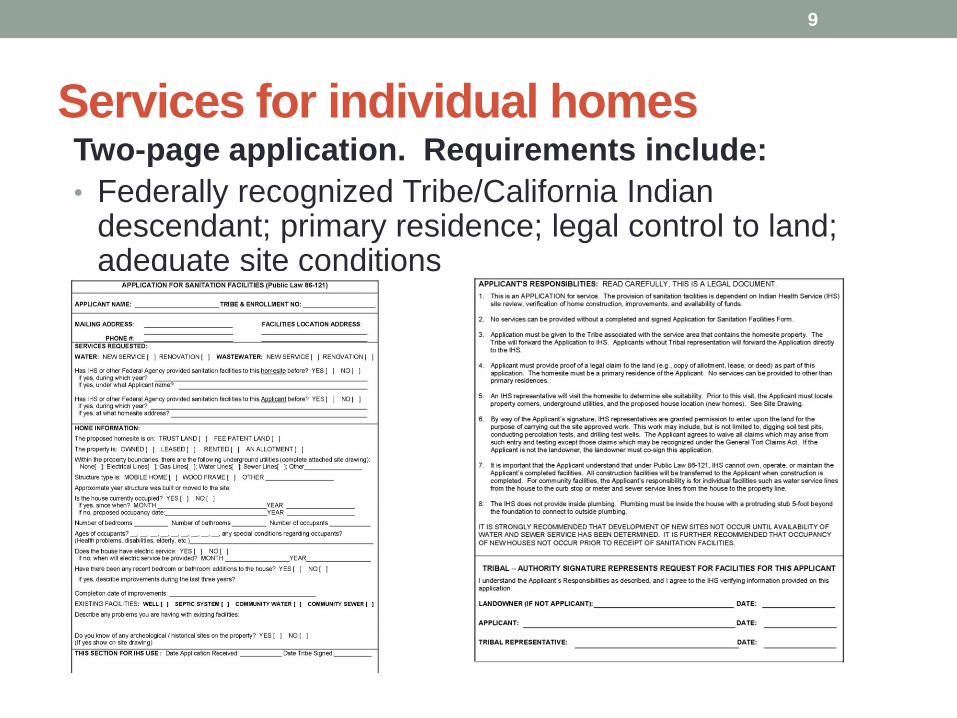
Services for individual homesTwo-page application. Requirements include:
• Federally recognized Tribe/California Indian descendant; primary residence; legal control to land; adequate site conditions
9
Healthy homes public outreach
Posters Booklet
10
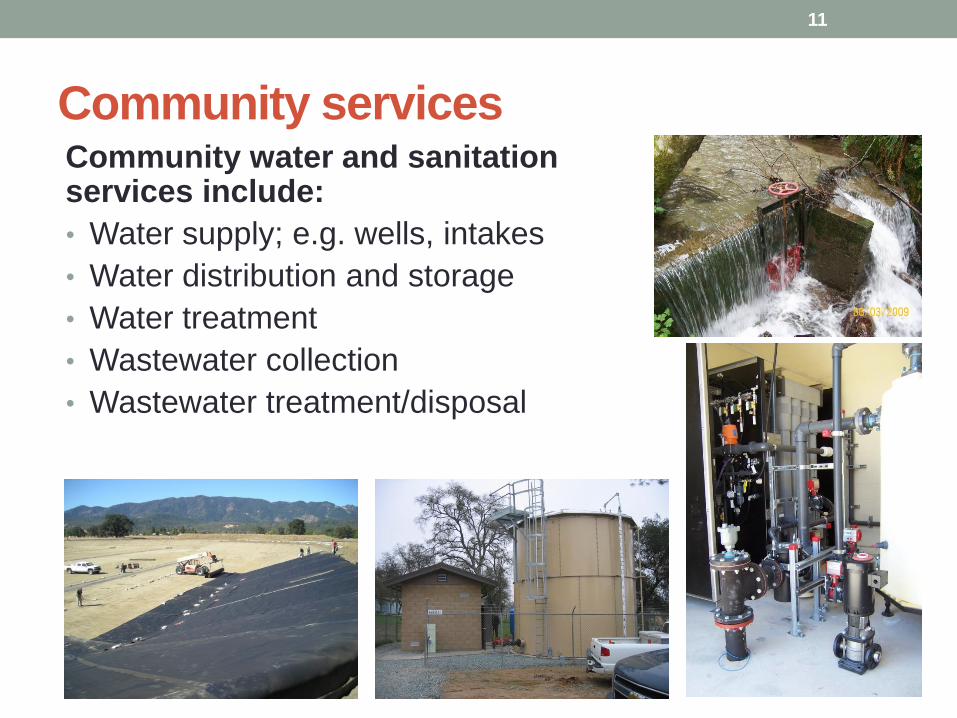
Community services Community water and sanitation services include:
• Water supply; e.g. wells, intakes
• Water distribution and storage
• Water treatment
• Wastewater collection
• Wastewater treatment/disposal
11
SFC Program annual activities
Typical annual portfolio:
• Homes served: 1,000 to
2,000
• Projects: 20 to 30
• Funding:
• Housing: $1.5 to 2.0M (for new
homes)
• Regular: $1.9 to 2.5M (for
existing homes)
• Outside contributions: $3M to
$5M (EPA, USDA/RD)
• Project duration: < 4 years
12
STARS
13
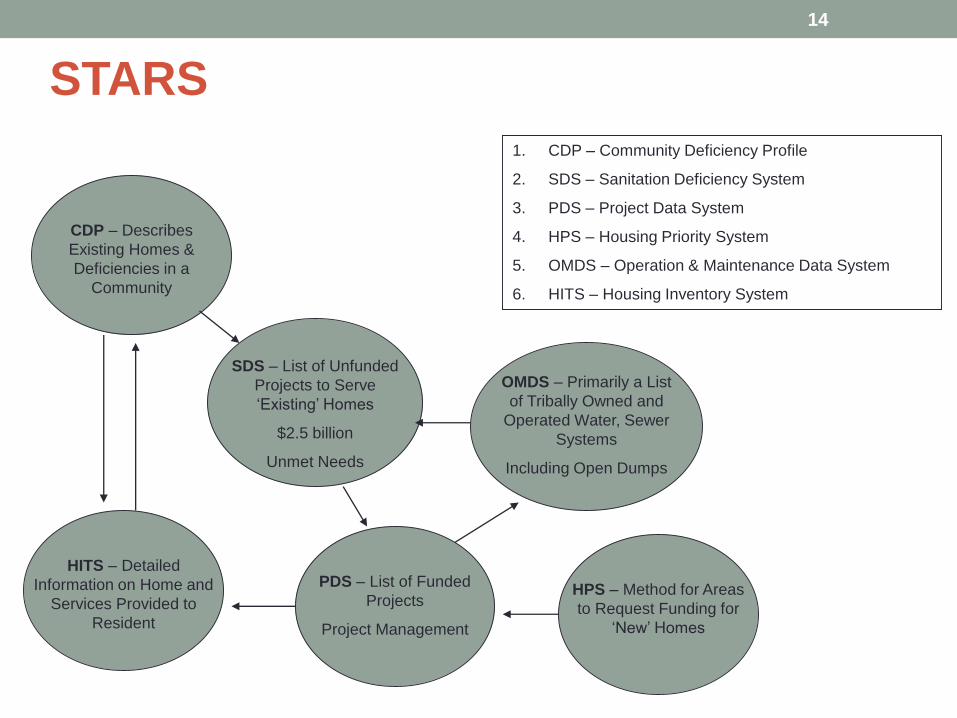
STARS
1. CDP – Community Deficiency Profile
2. SDS – Sanitation Deficiency System
3. PDS – Project Data System
4. HPS – Housing Priority System
5. OMDS – Operation & Maintenance Data System
6. HITS – Housing Inventory System
CDP – Describes
Existing Homes &
Deficiencies in a
Community
SDS – List of Unfunded
Projects to Serve
‘Existing’ Homes
$2.5 billion
Unmet Needs
PDS – List of Funded
Projects
Project Management
HITS – Detailed
Information on Home and
Services Provided to
Resident
14
HPS – Method for Areas
to Request Funding for
‘New’ Homes
OMDS – Primarily a List
of Tribally Owned and
Operated Water, Sewer
Systems
Including Open Dumps
SDS requirements
SDS requirements:
• 1988 Indian Health Care Improvement Act (IHCIA) requires
IHS to:
• Maintain inventories of sanitation deficiencies for new and
existing Indian homes and communities
• Prioritize the correction of deficiencies in the form of
projects
• Annually report deficiencies to Congress
• IHS developed the SDS to fulfill these requirements
15
SDS deficiencies
Current deficiencies:
• Number of projects: 303
• Project costs: $199 million
• Number of homes: 39,985
Factors:
• Age of infrastructure
• Population growth
• New regulations
16
SDS updates
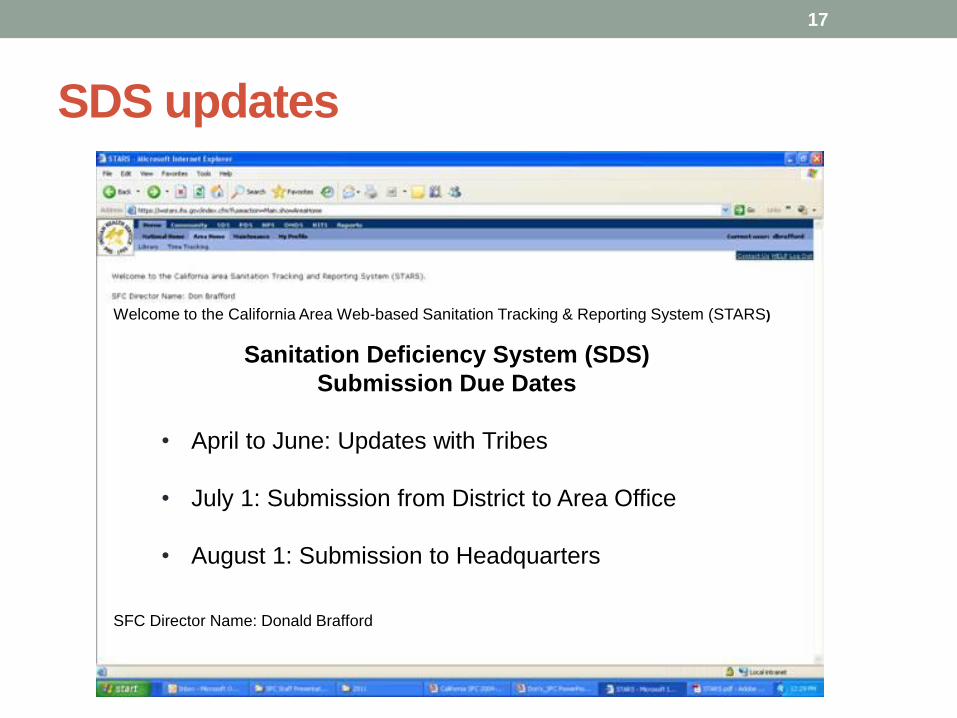
Welcome to the California Area Web-based Sanitation Tracking & Reporting System (STARS)
Sanitation Deficiency System (SDS)
Submission Due Dates
• April to June: Updates with Tribes
• July 1: Submission from District to Area Office
• August 1: Submission to Headquarters
SFC Director Name: Donald Brafford
17
SDS Project narrative and scores
SDS project scores:
• Eight rating factors including
the Health Impact factor:
• Represents the
reporting/documentation of a
disease or other adverse
health effect or health hazard
directly attributable to water,
sewer or solid waste.
• Varying degrees:
Documented, Suspected,
Potential, No Potential.
18
Will the 2014 drought impact Tribal
communities?
19
2014 Drought preparedness and response
Topics:
• Hydrologic drought conditions
• Potential drought-related impacts on public health
• Emergency planning and preparedness - drought
assessment, contingency plans, public health outreach
20
Governor Brown declares drought
emergency
21
Snowpack
22
Precipitation levels
23
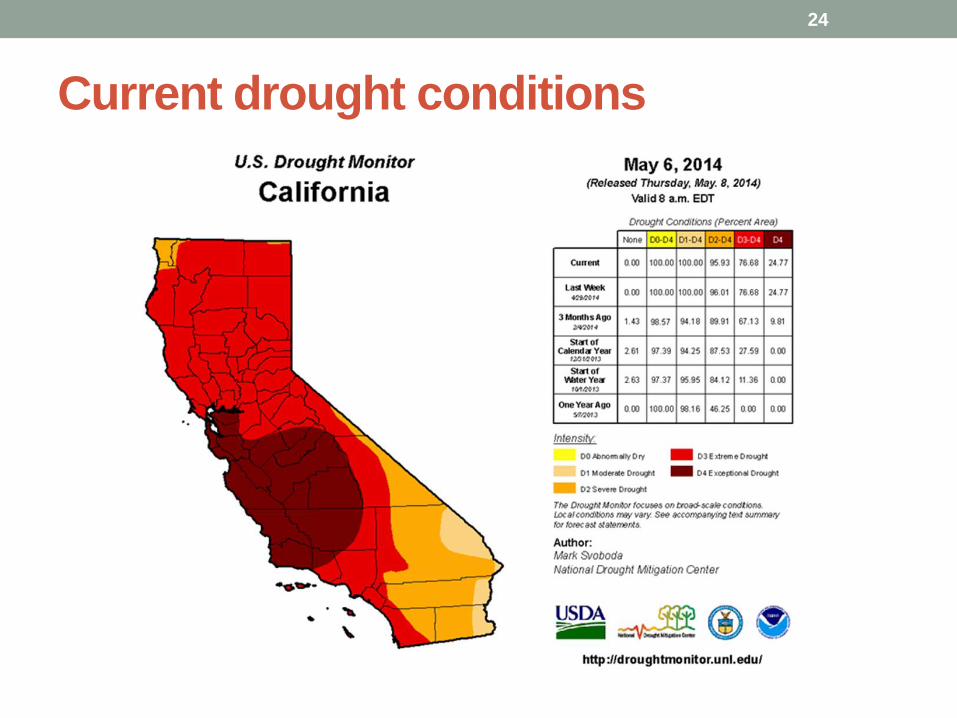
Current drought conditions
24
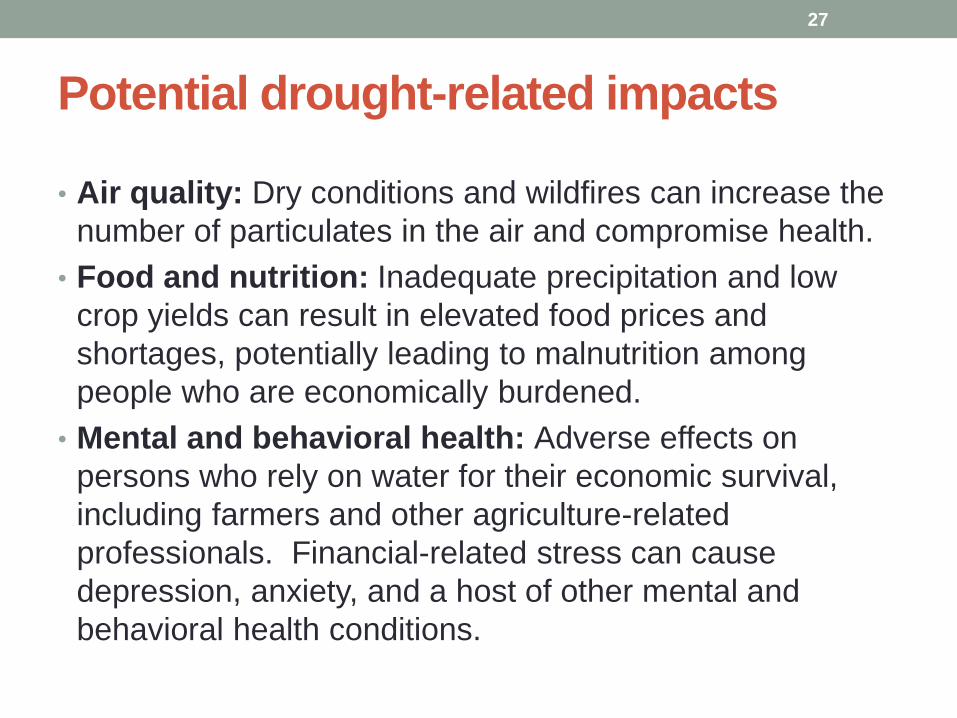
Potential drought-related impacts
According to the CDC, potential
impacts of drought on health include:
• Public water systems
• Energy
• Sanitation and hygiene
• Air quality
• Food and nutrition
• Mental and behavioral health
CDC. When Every Drop Counts: Protecting Public Health
During Drought Conditions—A Guide for Public Health
6 Number of non-residential and non-Indian homes on system
7 Current water demand (gallons per day)
8 Average water demand (gallons per day)
9 Type of water source Ground water
Surface water
Interconnection with other system
10 Observed impacts to water source None
Decreased stream/river levels at intake
Decreased water level in well(s)
11 Does the Tribe have a drought contingency plan? Yes
No
12 Would the Tribe desire assistance to develop a plan? Yes
No
13 Does the Tribe have any drought triggers or criteria? Yes
No
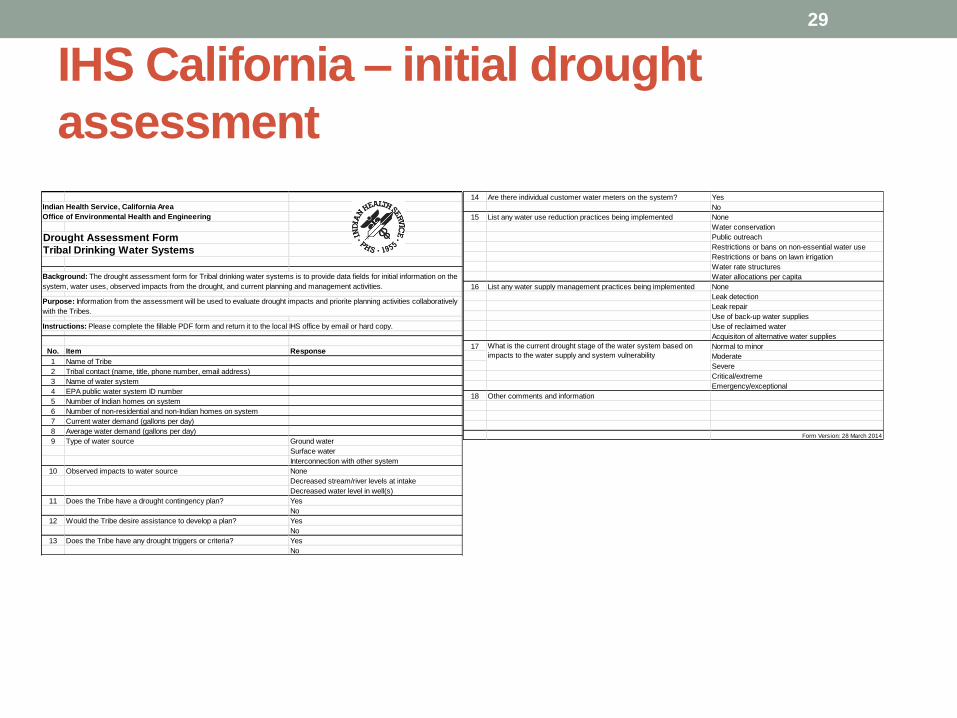
Background: The drought assessment form for Tribal drinking water systems is to provide data fields for initial information on the
system, water uses, observed impacts from the drought, and current planning and management activities.
Purpose: Information from the assessment will be used to evaluate drought impacts and priorite planning activities collaboratively
with the Tribes.
14 Are there individual customer water meters on the system? Yes
No
15 List any water use reduction practices being implemented None
Water conservation
Public outreach
Restrictions or bans on non-essential water use
Restrictions or bans on lawn irrigation
Water rate structures
Water allocations per capita
16 List any water supply management practices being implemented None
Leak detection
Leak repair
Use of back-up water supplies
Use of reclaimed water
Acquisiton of alternative water supplies
17 Normal to minor
Moderate
Severe
Critical/extreme
Emergency/exceptional
18 Other comments and information
Form Version: 28 March 2014
What is the current drought stage of the water system based on
impacts to the water supply and system vulnerability
29
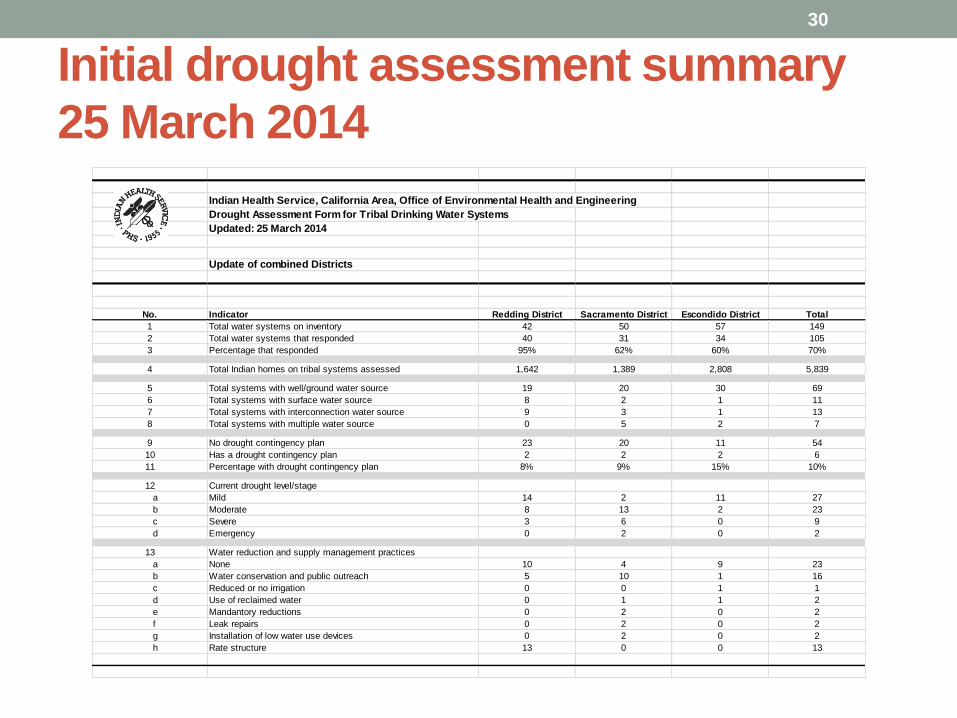
Initial drought assessment summary
25 March 2014
Indian Health Service, California Area, Office of Environmental Health and Engineering
Drought Assessment Form for Tribal Drinking Water Systems
Updated: 25 March 2014
Update of combined Districts
No. Indicator Redding District Sacramento District Escondido District Total
1 Total water systems on inventory 42 50 57 149
2 Total water systems that responded 40 31 34 105
3 Percentage that responded 95% 62% 60% 70%
4 Total Indian homes on tribal systems assessed 1,642 1,389 2,808 5,839
5 Total systems with well/ground water source 19 20 30 69
6 Total systems with surface water source 8 2 1 11
7 Total systems with interconnection water source 9 3 1 13
8 Total systems with multiple water source 0 5 2 7
9 No drought contingency plan 23 20 11 54
10 Has a drought contingency plan 2 2 2 6
11 Percentage with drought contingency plan 8% 9% 15% 10%
12 Current drought level/stage
a Mild 14 2 11 27
b Moderate 8 13 2 23
c Severe 3 6 0 9
d Emergency 0 2 0 2
13 Water reduction and supply management practices
a None 10 4 9 23
b Water conservation and public outreach 5 10 1 16
c Reduced or no irrigation 0 0 1 1
d Use of reclaimed water 0 1 1 2
e Mandantory reductions 0 2 0 2
f Leak repairs 0 2 0 2
g Installation of low water use devices 0 2 0 2
h Rate structure 13 0 0 13
30
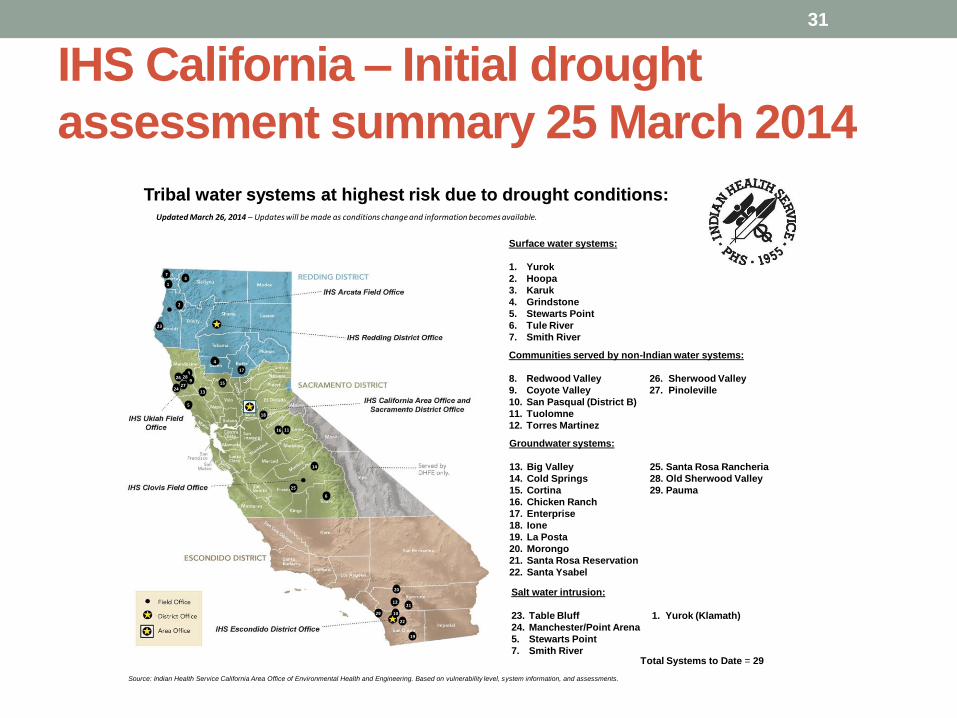
IHS California – Initial drought
assessment summary 25 March 2014
Tribal water systems at highest risk due to drought conditions:Updated March 26, 2014 – Updates will be made as conditions change and information becomes available.
Surface water systems:
1. Yurok
2. Hoopa
3. Karuk
4. Grindstone
5. Stewarts Point
6. Tule River
7. Smith River
Communities served by non-Indian water systems:
8. Redwood Valley 26. Sherwood Valley
9. Coyote Valley 27. Pinoleville
10. San Pasqual (District B)
11. Tuolomne
12. Torres Martinez
Groundwater systems:
13. Big Valley 25. Santa Rosa Rancheria
14. Cold Springs 28. Old Sherwood Valley
15. Cortina 29. Pauma
16. Chicken Ranch
17. Enterprise
18. Ione
19. La Posta
20. Morongo
21. Santa Rosa Reservation
22. Santa Ysabel
Salt water intrusion:
23. Table Bluff 1. Yurok (Klamath)
24. Manchester/Point Arena
5. Stewarts Point
7. Smith River
1
Source: Indian Health Service California Area Office of Environmental Health and Engineering. Based on vulnerability level, system information, and assessments.
73
2
23
24
8
9
4
17
15
13
5
18
16 11
14
6
20
1221
10
22
19
25
26
27
28
29
Total Systems to Date = 29
31
Drought contingency plan template
Drought Contingency Plans:
A framework of forward-leaning
planning for scenarios and objectives,
managerial and technical actions, and
potential response systems in order
to prevent, or better respond to,
drought-related critical situations.
Percentage of Tribes with drought
contingency plans: 10%
32
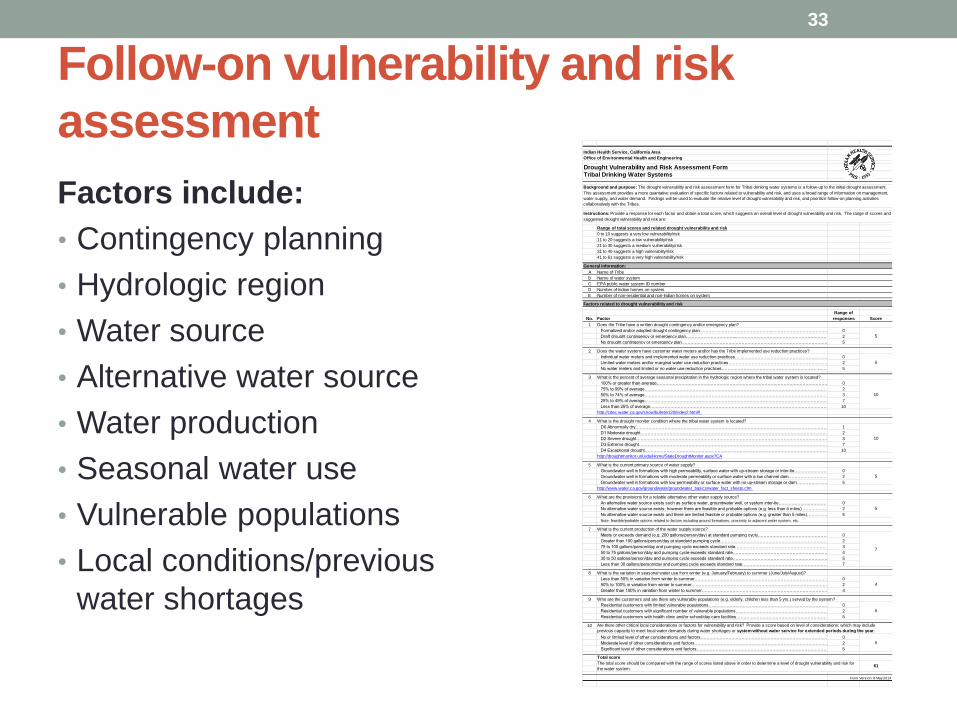
Follow-on vulnerability and risk
assessment
Factors include:
• Contingency planning
• Hydrologic region
• Water source
• Alternative water source
• Water production
• Seasonal water use
• Vulnerable populations
• Local conditions/previous
water shortages
33
Indian Health Service, California Area
Office of Environmental Health and Engineering
Drought Vulnerability and Risk Assessment Form
Tribal Drinking Water Systems
Range of total scores and related drought vulnerability and risk
0 to 10 suggests a very low vulnerability/risk
11 to 20 suggests a low vulnerability/risk
21 to 30 suggests a medium vulnerability/risk
31 to 40 suggests a high vulnerabilty/risk
41 to 61 suggests a very high vulnerability/risk
General information:
A Name of Tribe
B Name of water system
C EPA public water system ID number
D Number of Indian homes on system
E Number of non-residential and non-Indian homes on system
Factors related to drought vulnerabilitiy and risk
Range of
No. Factor responses Score
1 Does the Tribe have a written drought contingency and/or emergency plan?
6 What are the provisions for a reliable alternative other water supply source?
An alternative water source exists such as surface water, groundwater well, or system inter-tie……………………………………………………………………………………….0
No alternative water source exists; however there are feasible and probable options (e.g. less than 5 miles) ……………………………………………………………………………………….2
No alternative water source exists and there are limited feasible or probable options (e.g. greater than 5 miles)……………………………………………………………………………………….5
Note: feasible/probable options related to factors including ground formations, proximity to adjacent water system, etc.
7 What is the current production of the water supply source?
Meets or exceeds demand (e.g. 200 gallons/person/day) at standard pumping cycle…………………………………………………………………………………………….0
Greater than 100 gallons/person/day at standard pumping cycle…………………………………………………………………………………………….2
75 to 100 gallons/person/day and pumping cycle exceeds standard rate…………………………………………………………………………………………………….3
50 to 75 gallons/person/day and pumping cycle exceeds standard rate…………………………………………………………………………………………………….4
30 to 50 gallons/person/day and pumping cycle exceeds standard rate…………………………………………………………………………………………………….5
Less than 30 gallons/person/day and pumping cycle exceeds standard rate…………………………………………………………………………………………………….7
8 What is the variation in seasonal water use from winter (e.g. January/February) to summer (June/July/August)?
Less than 50% in variation from winter to summer………………………………………………………………………………………. 0
50% to 100% in variation from winter to summer………………………………………………………………………………………. 2
Greater than 100% in variation from winter to summer……………………………………………………………………………………….4
9 Who are the customers and are there any vulnerable populations (e.g. elderly, children less than 5 yrs.) served by the system?
Residential customers with limited vulnerable populations…...……………………………………………………………………………………………………………………………………….0
Residential customers with significant number of vulnerable populations…...……………………………………………………………………………………………………………………….2
Residential customers with health clinic and/or school/day-care facilities………………………………………………………………………………………………………………………….5
10
No or limited level of other considerations and factors………………………………………………………………………………………………………..0
Moderate level of other considerations and factors………………………………………………………………………………………………………..2
Significant level of other considerations and factors………………………………………………………………………………………………………..5
Total score
Form Version: 8 May 2014
5
7
61
5
The total score should be compared with the range of scores listed above in order to determine a level of drought vulnerability and risk for
the water system.
5
10
10
5
4
Are there other critical local considerations or factors for vulnerability and risk? Provide a score based on level of considerations; which may include
previous capacity to meet local water demands during water shortages or system without water service for extended periods during the year.
5
5
Background and purpose: The drought vulnerability and risk assessment form for Tribal drinking water systems is a follow-up to the initial drought assessment.
This assessment provides a more quantative evaluation of specific factors related to vulnerability and risk, and uses a broad range of information on management,
water supply, and water demand. Findings will be used to evaluate the relative level of drought vulnerability and risk, and prioritize follow-on planning activities
collaboratively with the Tribes.
Instructions: Provide a response for each factor and obtain a total score, which suggests an overall level of drought vulnerability and risk. The range of scores and
suggested drought vulnerability and risk are:
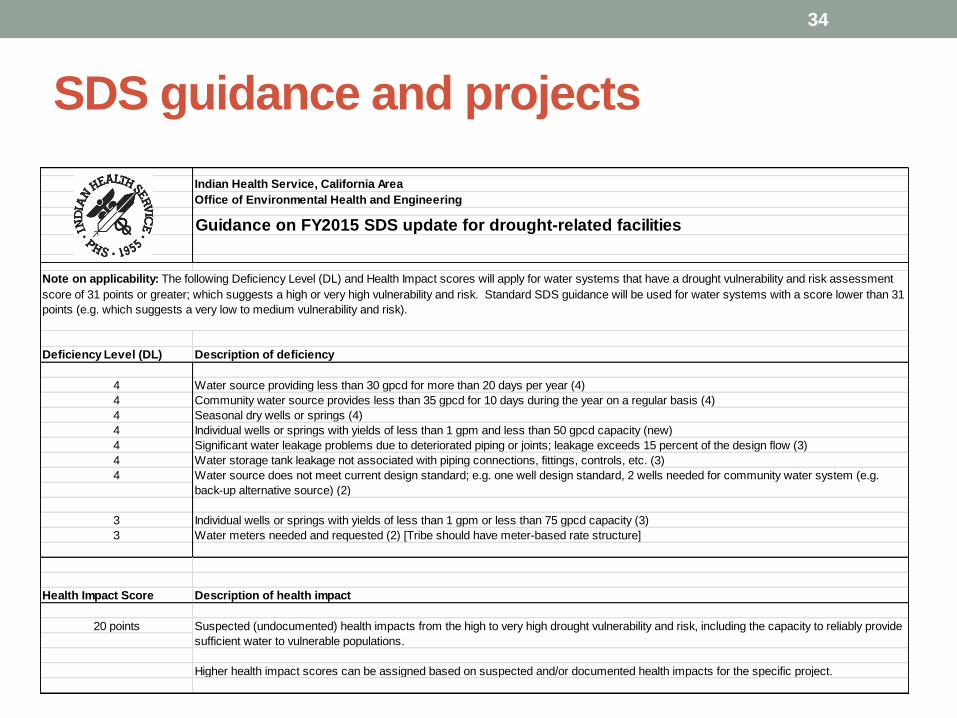
SDS guidance and projects
Indian Health Service, California Area
Office of Environmental Health and Engineering
Guidance on FY2015 SDS update for drought-related facilities
Deficiency Level (DL) Description of deficiency
4 Water source providing less than 30 gpcd for more than 20 days per year (4)
4 Community water source provides less than 35 gpcd for 10 days during the year on a regular basis (4)
4 Seasonal dry wells or springs (4)
4 Individual wells or springs with yields of less than 1 gpm and less than 50 gpcd capacity (new)
4 Significant water leakage problems due to deteriorated piping or joints; leakage exceeds 15 percent of the design flow (3)
4 Water storage tank leakage not associated with piping connections, fittings, controls, etc. (3)
4
3 Individual wells or springs with yields of less than 1 gpm or less than 75 gpcd capacity (3)
3 Water meters needed and requested (2) [Tribe should have meter-based rate structure]
Health Impact Score Description of health impact
20 points
Higher health impact scores can be assigned based on suspected and/or documented health impacts for the specific project.
Note on applicability: The following Deficiency Level (DL) and Health Impact scores will apply for water systems that have a drought vulnerability and risk assessment
score of 31 points or greater; which suggests a high or very high vulnerability and risk. Standard SDS guidance will be used for water systems with a score lower than 31
points (e.g. which suggests a very low to medium vulnerability and risk).
Suspected (undocumented) health impacts from the high to very high drought vulnerability and risk, including the capacity to reliably provide
sufficient water to vulnerable populations.
Water source does not meet current design standard; e.g. one well design standard, 2 wells needed for community water system (e.g.
back-up alternative source) (2)
34
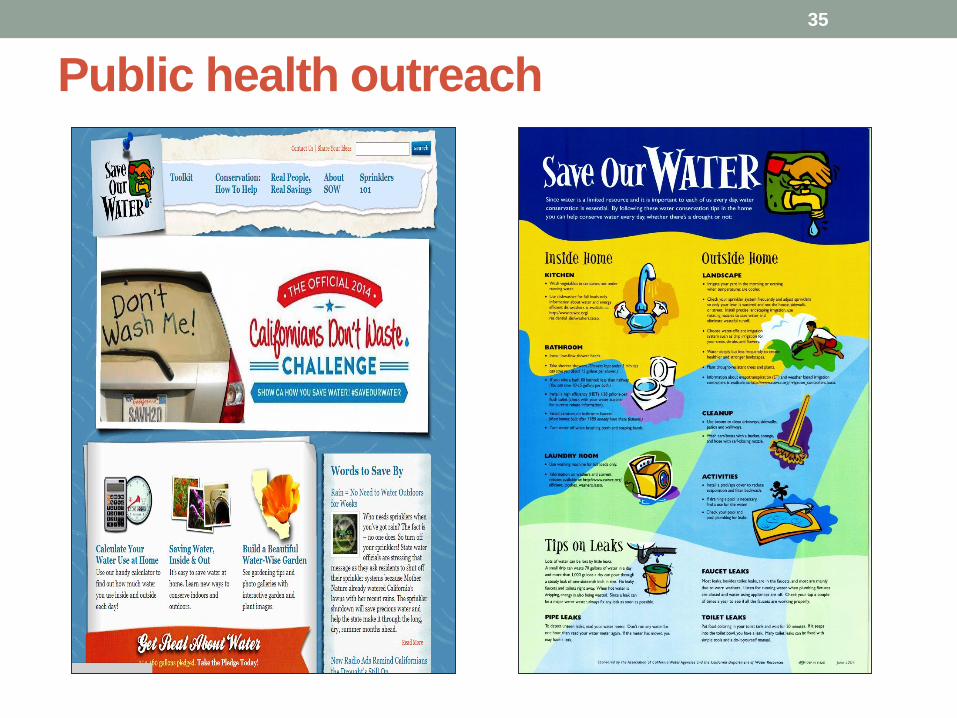
Public health outreach
35
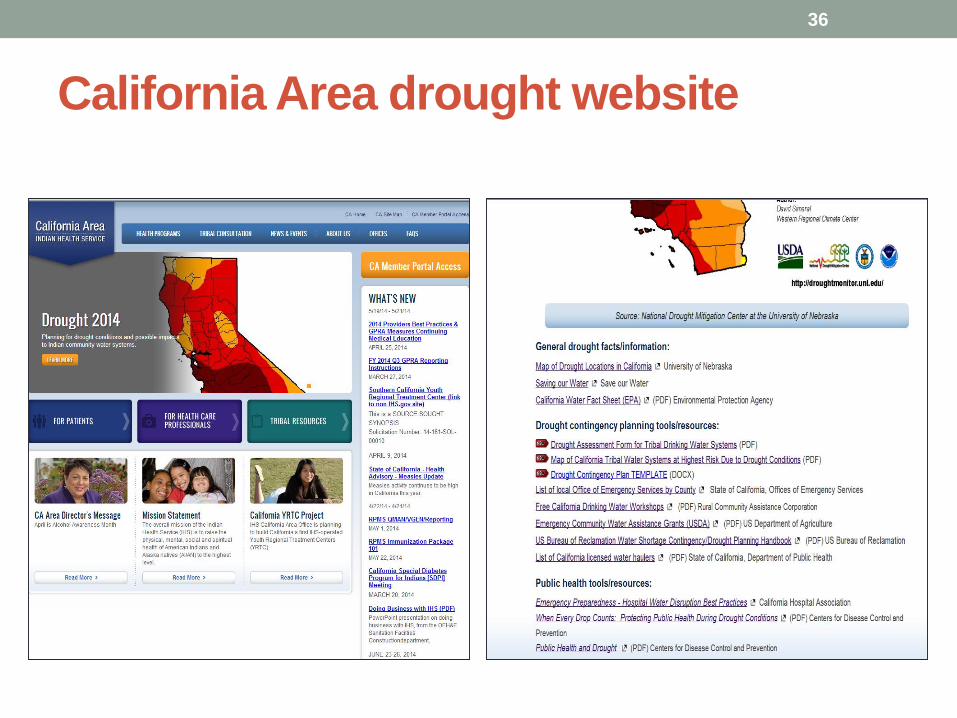
California Area drought website
36
Closing
Water and sanitation services – past, present, and
future:
• Significant achievements and progress in providing water
and sanitation services to Indian communities.
• Significant remaining un-met needs and challenges.
• Drought magnifies these challenges.
• However, creates opportunities to build partnerships and
collaborations (e.g. Tribes, IHS, EPA, RD, State, County,
CalOES) to build more resilient systems and
communities.
37
Drinking Water and Sanitation
in the Community
Questions?Christopher Brady, Deputy Director, SFC Program