Page 1
1
Faculty of Technology
DRINKING WATER QUALITY AND ENVIRONMENTAL
MONITORING IN RURAL AREAS OF DISTRICT MALIR
KARACHI
SURESH KUMAR PANJWANI
Supervisor:
D.Sc. (Tech.) Anna-Kaisa Ronkanen
Co-Supervisor:
M.Sc. (Tech) Uzair Akbar Khan
Prof. Dr. Muhammad Yar Khuhawar
Dr. Ghulam Murtaza Arain
Dr. Indra Devi Sewani
Masters‘ Thesis
MSc (Tech.) Environmental Engineering
March 2018
Page 2
2
ABSTRACT
FOR THESIS University of Oulu Faculty of Technology Degree Programme (Bachelor's Thesis, Master’s Thesis) Major Subject (Licentiate Thesis)
Barents Environmental Engineering
Environmental Engineering
Author Thesis Supervisor
Panjwani, Suresh Kumar D.Sc. (Tech.) Anna-Kaisa Ronkanen, M.Sc
(Tech) Uzair Akbar Khan
Title of Thesis
DRINKING WATER QUALITY AND ENVIRONMENTAL MONITORING IN RURAL AREAS
OF DISTRICT MALIR, KARACHI
Major Subject Type of Thesis Submission Date Number of Pages
Water and Environment Master‘s Thesis March 2018 61
Abstract
Water plays an essential and critical role in human life. Fresh water is one of the most important
resources, crucial for the survival of all the living beings. Human and ecological use of water depends
upon ambient water quality. The Karachi division in the southern Sindh Province of Pakistan includes
a number of industries and is responsible for major contamination of fresh water resources.
Contaminants like microorganisms, chemicals, toxic substances, industrial effluents, fertilizers,
pesticides and municipal wastewater can make water unsafe for drinking and other domestic uses. The
present work is focused on the rural areas of district Malir, Karachi where water supply
schemes/systems are not available and human population use mainly ground water directly without
any treatment. Water pollution is one of the major concerns nowadays. Typically, nullahs (drainage
lines), collect and carry untreated sewage which then flows into streams and rivers, resulting in
widespread bacteriological and other contamination. This leads to damage to the environment and
risks for human health e.g. Chronic health effects, skin lesion, circulatory problems, nervous system
disorders and risk of cancer. Rural areas in Pakistan are based on scattered villages which, more often
than not, lack any organized sewerage system. Therefore, the resulting sewage infiltrates into the soil
and causes ground water pollution. Keeping the focus on above mentioned problems, this masters‘
thesis is designed for water sampling and drinking water quality testing in the rural areas of district
Malir, Karachi(DMK). The sampling was carried out with the field team of Pakistan Council of
Research in Water Resources (PCRWR), Karachi Pakistan. The drinking water samples were
analyzed for different physicochemical and bacteriological parameters including, pH, electrical
conductivity (EC), turbidity, total dissolved solid (TDS), alkalinity, chloride (Cl-), carbonate(CO3) and
bicarbonate(HCO3), total hardness, magnesium (Mg), calcium (Ca), nitrate (NO3), fluoride (F-),
sulfate (SO4), potassium (K), sodium (Na), arsenic (As), iron (Fe), total coliform and E.coli.
Altogether, 35 drinking water samples were collected and analyzed. The results were then compared
with WHO/NEQS limits and guidelines pertaining to quality of water for human consumption. It was
revealed that out of 35 drinking water samples 14% were beyond the safe limits for physical
parameters. The 60% of water samples were observed to be unfit for human consumption due to the
presence of inorganic constituents beyond the safe limits prescribed by WHO/NEQS. Whereas all the
drinking water samples were observed to be unfit due to existence of coliform bacteria. However,
46% of these were fecal contaminated due to presence of E.coli. Overall results indicate a critical
need for better sanitation infrastructure in the area including water and wastewater treatment.
Keywords, Drinking Water Quality, Physicochemical Analysis, Environment, Health Problems, Water pollution, Rural
Pakistan
Additional Information
Page 3
3
TABLE OF CONTENTS
Abstract
Acknowledgements
List of Abbreviations and Symbols
1. Introduction .................................................................................................... 6
2. Basic Water Quality Parameters ..................................................................... 8
2.1 Physical and Aesthetic Parameters ....................................................... 8
2.2 Chemical Parameters .......................................................................... 10
2.3 Trace and Ultra-Trace Elements ......................................................... 18
2.4 Bacteriological Parameters ................................................................. 22
3. Water Supply and Sanitation in Pakistan...................................................... 24
4. Methodology ................................................................................................. 27
4.1 Sample Collection and Preservation ................................................... 32
4.2 Analytical Method .............................................................................. 33
4.3 Analytical Procedures ......................................................................... 35
4.4 Sodium Adsorption Ratio (SAR) ........................................................ 38
4.5 Health Risk Assessment ..................................................................... 39
5. Results and Discussion ................................................................................. 43
6. Summary and Conclusions ........................................................................... 55
7. References .................................................................................................... 56
Page 4
4
ACKNOWLEDGEMENTS
This thesis research work has been carried out as an important phase of studies towards the
completion of Master‘s degree Program in the Environmental Engineering University of Oulu
Finland.
Heartily thankful to Almighty God for His Blessings and Mercy without which this research
work wouldn‘t be possible.
Firstly I would like to dedicate this research work to my whole family who encourages and
support me in every phase of this journey.
Secondly, I‘m very much thankful to my Co-supervisor Prof. Dr. Muhammad Yar
Khuhawar (Emeritus Professor at the Institute of Advanced Research Studies in Chemical
Sciences, University of Sindh, Jamshoro) , Dr. Ghulam Murtaza Arain (Senior Research
Officer, Pakistan Council of Research in Water Resources (PCRWR) Karachi, Pakistan) and
Dr. Indra Devi Sewani who is always there for help, support me in each and every phase of
this research work.
I would like to show my gratitude to D.Sc. (Tech.) Anna-Kaisa Ronkanen and MSc (Tech)
Uzair Akbar Khan who supervised me for this thesis and provided guidance and help in the
completion of this thesis.
Page 5
5
ABBREVIATIONS AND SYMBOLS
AgNO3 Silver Nitrate
As Arsenic
Ca Calcium
CaCO3 Calcium Carbonate
Cl-
Chloride
EBT Eriochrome Black-T
EC Electrical Conductivity
E.coli Escherichia coli
EDTA Ethylene Diamine Tetra Acetic Acid
F-
Fluoride
HCO3 Bicarbonate
HCl Hydrochloric Acid
H2O Water
K Potassium
mg Milligram
Mg Magnesium
Na Sodium
NaOH Sodium Hydroxide
NO3 Nitrate
pH Power of Hydrogen
PSI Pakistan Standard Institute
PSQCA Pakistan Standards and Quality Control Authority
SO4 Sulfate
TC Total coliform
TDS Total Dissolved Solids
μS/cm Micro siemens per centimeter
Page 6
6
1 . INTRODUCTION
Water is the basic need for all life in the world. In addition to this, other human activities
such as power generation, agriculture, industrialization etc., also directly/indirectly rely on
water resources (Memon et al., 2011). Due to increase in the population of Pakistan, the
availability of safe drinking water to everyone has decreased rapidly. Since the independence
of Pakistan in 1947, the amount of safe drinking water has been cut off from about 5,600
cubic meters per person per annum to about 1,038 cubic meters per person per annum (Daud
et al., 2017). The population growth and economic development are also contributing
towards lowering the water quality. An enormous amount of waste such as domestic,
industrial, agricultural, hospital etc., waste is produced by the human activity. Since there is
no safe disposal system of waste water which is mostly discharged in natural water body and
water storages hence polluting the water resources (Mastoi et al., 2008). Contaminants like
microorganisms, chemicals, industrial wastewater (heavy metals), fertilizers, pesticides and
municipal waste water in high concentration make water unsafe for drinking and other
domestic uses. Even ground water can be contaminated by the municipal, agricultural and
industrial wastewater intrusion. Water Pollution has become a serious and major concern and
source of many problems in Pakistan contributing towards damage to the environment and
health-related problems such as chronic health effects (skin damage, nervous system
disorders, increased risk of cancer and circulatory system problems) which are reported
directly or indirectly related to water pollution (Naeem et al., 1997).
World Health Organization reported in 2017 that 80 million people do not have a proper
access to safe drinking water in Pakistan. Furthermore, it has reported that in Pakistan 20 to
40% of the beds in the hospitals are occupied by patients suffering from water-related
diseases such as cholera, typhoid, dysentery and hepatitis B or C. These are responsible for
one-third of all deaths (WHO, 2017).
The study area which is district Malir, Karachi is situated in Sindh Province. The main
sources of drinking water in Sindh province are both surface and ground water. The waste
from different sources including agricultural, industrial, domestic and municipal waste is
dumped into surface water due to unsafe disposal systems which makes surface water highly
polluted (Azizullah et al., 2011). In Sindh Province, mostly ground water occurs in shallow
aquifers which are highly saline due to semi arid climate, sea water intrusion and rapid rate of
evapo-transpiration because of high average annual temperatures (PCRWR, 2007). The
Page 7
7
groundwater quality in the province is also affected by arsenic, fluoride, nitrate, iron, high
content of dissolved solids and microbial contamination. The mobilization of arsenic and
fluoride in groundwater is due to both geological and anthropogenic factors. People in Sindh
province especially rural communities largely depend on groundwater as source of water for
drinking and domestic and irrigation use and are not linked to better water supply
schemes/systems because about 70-80% of water supply schemes in the rural areas are non-
functional (PCRWR, 2007). The worst affected sections are living in small towns and
villages belonging to low income groups.
Karachi is the largest city of Pakistan and capital of Sindh province. Geographically, Karachi
is divided into six major districts, namely Karachi East, Karachi West, Karachi North,
Karachi South, Landhi and Korangi and Malir. District Malir has a long coastline along the
Arabian Sea. There is sufficient amount of withdrawal of groundwater, due to unavailability
of fresh water which results in the intrusion of seawater to fill up the zones of fresh
groundwater (Memon et al., 2011). It is estimated that around 85 million people require safe
drinking water in Pakistan (PCRWR, 2007). Chandio et al. (1998) reported that around
10,000 people, especially in the rural area of Pakistan most of which include children, who
loose their lives every year following consumption of unsafe water for drinking. Moreover
groundwater at some places has been analyzed as saline water and due to the shortage of
potable water, the people in the rural areas use saline water directly as a source of drinking
water (Malick et al., 1998). Therefore Drinking water has become major concern for the
residents of Karachi with a population of about 15 million, which is nearly 10% of the total
population of Pakistan. The people of these areas cannot afford to bear the expenses of
private water supply system, e.g. bottled water (Khan et al., 1997).
This research work incorporates the determination of different physicochemical and
bacteriological parameters (PCB). Consequently, this study raises the research question that
how above mentioned PCB parameters impact on drinking water in the rural areas of district
Malir, Karachi (DMK). The physicochemical parameters include color, pH, turbidity, total
hardness, electrical conductivity, sulfate, alkalinity, total dissolved solids, chloride, sodium,
calcium, iron, fluoride, magnesium, potassium and bicarbonate. The studied bacteriological
parameters include total coliform and E-coli. The present work reports the findings by
analyzing the PCB and its health risk assessment factor from the studied region by collection
of 35 drinking water samples. The inclusion of these parameters in the drinking water may
cause waterborne disease such as skin rashes, eye infections, diarrhea, kidney problems etc.
Page 8
8
2 . BASIC WATER QUALITY PARAMETERS
2.1 Physical and Aesthetic Parameters
2.1.1 PH
PH is measure of acid-base balance accomplished by different disintegrated mixes and in
most normal water is controlled by the CO2 -HCO3-CO3 equilibrium framework. The pH
exists in the range 6.5-8.5 for most raw water sources. Chlorination as disinfection process
brings down the pH, whereas the processes for water softening utilizing the overabundance
sodium carbonate to increase the pH level. pH influences the different procedures for
treatment of water, that include the expulsion of infections, microorganisms and other
destructive living beings, it could be guaranteed that pH indirectly affects well-being
(PCRWR 2012). The guidelines for pH proposed by World Health Organization (1996) falls
in the range between 6.5-8.5, although some problem could arise when pH fall below 7.0
within a distribution system due to contamination of soil particles. The effectiveness of
flocculation and coagulation method is notably reliant on pH. Coagulation and flocculation
are important steps in water treatment and are widely used for removal of suspended solids
and colloidal particles. It is also reported that at low concentration, metal particle stability and
solubility in the water solutions is influenced especially by pH (WHO, 1996).
2.1.2 Color
It is estimated that the drinking water color may possibly be due to the existence of the
colored organic matter, typically humus metals from industrial effluents such as manganese
(WHO, 2003). Organic color and stain mostly take place in the vicinity having poor drainage
when it mix with iron and it is difficult to remove (PEPA, 2004). It is recommended by
United State Environmental Protection Agency (USEPA) and World Health Organization
(WHO) that color limit for drinking water should be within 15 TCU, since values above the
prescribed limit may result in complaints by the consumers for appearance of water (WHO,
2004).
Page 9
9
2.1.3 Electrical Conductivity
Electrical conductivity describes a characteristic of solution to conduct the current. The
capacity relies upon the ions present, their total concentration, versatility, valency and on the
temperature of estimation. Solutions of most inorganic mixes are generally good conductors.
Reversely, the organic compounds cannot be dissociated in water solution. The measurement
of electrical conductivity (EC) gives a fast and advantageous method for evaluating the
grouping of the salts in water. Guidelines by WHO for drinking water (2008), though do not
provide a health based guidelines value set (NGVs), but indeed discuss EC as a parameter
essential for operational monitoring because it is an indicator of TDS and many other
chemical contaminants.
2.1.4 Odor
It is reported that some inorganic and a number of natural substances add to the smell of
water. The non-particular fishy, verdant and smelly scents ordinarily connected with organic
development have a tendency to occur in the water most frequently in warmer months. Scent
in consumable water is perpetually demonstrative of some type of contamination of the water
source or of glitch amid water treatment or dissemination. Drinking water ought to have no
noticeable scent to any buyer NSDWQ (2008).
2.1.5 Turbidity
Turbidity in water may be due to suspended matter, e.g. silt, colloidal natural particles, clay
particles, infinitesimal organisms and plankton. Turbidity is a statement of certain light
dissipating and light retaining properties of H2O. Turbidity is a vital parameter for portraying
the water quality. Turbidity past the 5 NTU limit is by and large frightful to clients (PEPA,
2004). Water with higher turbidity at the consumer‘s end, compared to the turbidity at the
entrance of distribution scheme may show erosion, post-treatment contamination, or other
distribution issues. Thus, extreme turbidity which is greater than 5 NTU can shield
microorganisms from the impacts of purification, stimulate the development of
microorganisms in the water and itself applies a noteworthy chlorine demand; consequently,
Page 10
10
it is fundamentally essential to remove turbidity in producing safe drinking water (PCRWR,
2012).
2.1.6 Taste
Taste apply only to gustatory sensation called unpleasant, sour, sweet and salty that result
from synthetic incitement of tangible nerve endings situated in the papillae of the tongue and
delicate sense of taste (PCRWR, 2012). The taste threshold in the drinking water for the
major cations, i.e. for Ca and Na the limit is 100 mg/l while for K and Mg, it is 300 and 30
mg/l respectively (WHO, 2000). There are four taste sensations i.e., sweet, salty, sour and
unpleasant (PCRWR, 2007).
2.2 Chemical Parameters
2.2.1 Chloride
Chloride in high concentration in the water can take place due to the chloride containing
geological formation, industrial waste, sewage pollution and intrusion of sea water. It is
generally conveyed in nature as sodium chloride, potassium chloride and calcium chloride
salts. In the surface water, Chloride is available at low concentration as compared to
groundwater. Chloride (Cl-) is a plenteous anion in human body and contributes essentially,
alongside its related cations, in keeping up the osmotic movement of additional cell liquids
(88%). Typically a human body with 70 kg weight consists of 81 g of chlorides (WHO,
1996). A guideline value of 1 g NaCl (common table salt) per person per day is
recommended by WHO (1996) for ordinary wellbeing. For youngsters up to 18 years old, a
daily dietary intake of 45 mg chloride for each kg of body weight is adequate (PCRWR,
2004). In the water, presence of chloride ions may results in salty taste. Moreover, salty taste
of water with concentration of sodium more than 250 mg/l may be recognizable.
Furthermore, the distinctive salty taste might not be there even when the water contains 1000
mg/l of chloride when calcium and magnesium particles are prevalent. High chloride content
Page 11
11
deleteriously affects metallic pipes and structures. WHO (2003) had suggested 250 mg/l as
prescribed limit of the chloride.
2.2.2 Bicarbonate
Bicarbonates are the predominant anions in both surface and ground water. Mostly, HCO3
ions are soluble in water and its concentrations in water can be determined through pH.
Generally bicarbonates in ground water lies under 500 mg/l. Additionally they influence
hardness and alkalinity of the water. It is reported that a very little quantity of sodium
bicarbonate is present in good quality canal and tube-well water (PCRWR, 2012).
2.2.3 Carbonate
The developments of sodic lands in Pakistan are mainly due to the influence of sodium
(carbonate and bicarbonate), whereas sodium bicarbonate is present from medium to low
amount in saline-sodic lands. Lands containing sodium carbonate and calcium sulfate are
referred to as salt-affected lands. The presences of sodium carbonate indicate low amounts of
Ca2+
and Mg2+
ions. In Pakistan, saline waterlogged lands generally contain high-levels of
calcium carbonate. Native calcium carbonate could be solubilized and converted to Ca
(HCO3)2 and then to soluble NaHCO3 (PCRWR, 2004).
(a) CaCO3 + CO2 + H2O → Ca(HCO3)2
(b) Clay-2Na + Ca(HCO3)2 → Clay-Ca + NaHCO3
Dolomite and calcite (CaCO3) are known as rock forming minerals and also calcite (CaCO3)
is the most prevalent carbonate minerals (NSDWQ, 2008). In limestone, bulk amount of
CaCO3 is present and in the rock openings small amount of crystal particles are present of the
rocks contains CaCO3 as a vein mineral (PCRWR, 2007).
Page 12
12
2.2.4 Calcium
Calcium is the most common mineral found in a human body. It is a requirement for various
functions in a human body which include the thickening of blood and the transmission of
nerve impulses. The calcium in ground water may be as a result of limestone, gypsiferous,
calcite shale and dolomite present in ground. The solubility of calcium minerals and
compounds in fresh water mainly depends upon the existence of CO2 and wellsprings of
water containing up to 100 mg of calcium per litre are mostly having basic pH over 7.0
(PCRWR, 2007). Pakistan Standard Institute (PSI) prescribed as (75 mg/l) (Mehmood et al.,
2012), while PSQCA suggests (200 mg/l) as permissible level (PSQCA, 2004). World Health
Organization in (1971) recommends the desirable limit for calcium as (75 mg/l) and
permissible limit (200 mg/l).
2.2.5 Magnesium
Mg is a general constituent of fresh water. Mg and Ca both create the property of hardness in
water. It is reported that the synthesis of protein in a human body of 70 kg involves 19 g of
magnesium and also goes about as co-factor in 300 enzymatic responses (PCRWR, 2012).
The magnesium is found in all natural waters. The main source of magnesium in water is
minerals such as dolomite (NSDWQ, 2008).
2.2.6 Hardness
Hardness of water is due to occurrence of iron, magnesium or calcium salts as sulfate,
chloride or bicarbonates. The level of hardness is comparable to concentration of calcium
carbonate and reported as;
Soft: (0-60 mg/l)
medium hard: (60-120 mg/l)
hard: (120-180 mg/l)
Excessive: (>180 mg/l)
Page 13
13
It is reported that occurrence of urolithiasis is because of hard water where the tap water
shows (300-500) mg of calcium per litre (WHO, 1996). It is also reported that there is highly
significant inverse relation between cardiovascular malady and hardness in different region of
the world (WHO, 1996). Hard water in the houses can cause pipe chocking, incrustations on
kitchen utensils and expanding soap utilization. Economic burden in the society can be
caused by the hard water. A level of hardness around 100 mg of calcium carbonate per litre
gives a satisfactory balance between corrosion and the issues of incrustation, in spite of the
fact that; from the view of aesthetic consideration hardness is suggested 500 mg/l as
maximum permissible level (WHO, 2004).
2.2.7 Sodium
Sodium is present in a small quantity in tap water. Seawater contains around 10 g of sodium
per liter (PCRWR, 2012). The sodium salts are very dissolvable in water and discovered
plenteously in mineral deposits. Na is the primary cation which is present in extra-cellular
fluid within the human body. Extra-cellular fluid means the fluid present outside the cells e.g.
blood plasma. Na has a number of physiological purposes including keeping up corrosive
base adjust, creating trans-film inclinations (which enable cells to take up supplements)
support of extracellular fluid volume, in the electro-physiology of nerve , osmotic pressure
and muscle cells. Lack of Na in the body may show up as low blood pressure, weariness,
mental detachment, dehydration, seizures, sadness, and so on though overdose can cause
cerebral pains , edema , nausea, hypertension, stomach issues, stroke and kidney harms
(PCRWR, 2012). WHO (1996) detailed that in many nations, the larger part of water supplies
contain under 20 mg of sodium for every litre except in a few nations Na levels can exceed
250 mg/l. It is reported by World Health Organization that water treatment chemicals, e.g.
sodium hydroxide, sodium silico fluoride, sodium fluoride, sodium carbonate, sodium
bicarbonate and sodium hypochlorite can contribute to huge level of sodium (30 mg/l) in
drinking water (PCRWR, 2007). World Health Organization prescribes as 200 mg/l as
permissible level for Na in drinking water (WHO, 2000).
Page 14
14
2.2.8 Potassium
The potassium substance of drinking water changes extraordinarily relying upon its source. It
has tendency to be higher in sea water and minerals than tap water. Moreover, potassium
intake by grown-ups at average water utilization is less than 0.1%. In the drinking water,
abundance potassium concentration may reach up to 20 mg/l. Potassium is an essential body
mineral for both electrical capacity and cells. In the blood serum aggregate K changes from
4-5 mg/100 ml in the body. It has been suggested that 1600 to 3500 mg of k should be
utilized per day (NEQS, 1996). Lack of K causes unpredictable and quick pulse,
hypertension, muscle shortcoming, bladder shortcoming, kidney diseases and asthma while
overdose may show up as sporadic/fast pulse, cystitis, bladder contamination, ovarian
growths, and debilitated insusceptible framework. An expanded potassium blood level is
known as hyperkalemia which brings about diminished renal capacity, an unusual breakdown
of protein and extreme contamination (WHO, 2003).
2.2.9 Total Dissolved Solids
Total dissolved solids in water are due to both the amount of organic matter and inorganic
salts. The chief ions in the formation of total dissolved solids are bicarbonate, chloride,
magnesium carbonate, sulfate, sodium, potassium, calcium and nitrate. Total dissolve solids
in water may be due to some natural sources, sewage or industrial discharge. Total dissolve
solids is connected to hardness, taste and erosion properties. Though, excessive levels of TDS
(even 1000 mg/l) have not been shown to have any physiological reactions. Total dissolved
solids in drinking water may even have beneficial health effects (PEPA, 2004). The
palatability of drinking water on the basis of TDS level is described as under:
Excellent: < 300 mg/l
Good: 300-600 mg/l
Poor: 900-1200 mg/l
Undesirable: >1200 mg/l
Water with extremely low TDS level may also be unacceptable because of its flat, insipid
taste. World Health Organization prescribes 1000 mg/l as a permissible limit for TDS in
drinking water (WHO, 1996).
Page 15
15
2.2.10 Sulfate
Most of the sulfate particles mixes are dissolvable in water and the dissolved sulfate is
considered to be a permanent solute in the water, in some special cases sulfates of barium,
lead and strontium. However it may be volatilized to the air as H2S, precipitated as an
insoluble salt, reduced to sulfide, or integrated in living beings. Sulfates are used in
assembling of various chemicals, paper, glass, sprays, cleansers, materials, astringents,
beauty care products and fungicides. Sulfate level in Canadian lakes is reported to be with the
range of 3 to 30 mg/l and no insufficiency of sulfate indicated in people (NSDWQ, 2008). It
is reported that the lack of hydration is a typical symptom of the ingestion of a lot of
magnesium or sodium sulfate (Daudpota et al., 2016). WHO in (2003) has prescribed 250
mg/l as permissible limit for sulfate in drinking water. Above the prescribed limit consumer
may feel issue in taste.
2.2.11 Nitrate-Nitrogen
Nitrate occurs under a variety of conditions in the environment, both naturally and
synthetically and it is an inorganic compound. Nitrate is compound of one atom of nitrogen
(N) and three atoms of oxygen (O). The chemical formula for nitrate is NO3 that is the most
commonly available form of nitrogen found in soil. Nitrogen is necessary for most crops,
which require large quantities to produce high yields and it is also essential for life. The
formation of nitrate is one of the main components of the nitrogen cycle (WHO, 2011).
The ammount of fertilizer nitrogen leaching as nitrate which is highly oxidized form of
nitrogen and its presence in water indicates the pollution of nitrate in ground water.
Furthermore, Nitrate results from use of agrochemicals, decaying plants and unsystematic use
of inorganic nitrogenous fertilizers. Moreover the main source of nitrate pollution in ground
water is due to manures or organic residues like decomposed animal and human excreta loss
through drainage, including septic tank is the main source of nitrate pollution in ground
water (Singh & Sekhon, 1979).
Plants absorbs nitrate from the soil to fulfill the requirement of nutrients and may gather
nitrates in their stem and leaves. Nitrate may be added to the ground water due to the seepage
through soil containing minerals rich in nitrate. Nitrate in the human body may occur
naturally, in processed meat, in some medications and is also produced from cigarette smoke.
Page 16
16
Water normally contains under 1 mg/l of nitrate-nitrogen. Ground water generally contains
nitrate-nitrogen in the concentration range from 0.1 to 4 mg/l in number of different countries
(WHO, 2011).
Nitrate contamination of surface water and groundwater can take place from sewage disposal
system and livestock facilities, from treated cropland or from normally occurring wellsprings
of nitrogen. The concentration of nitrate in the well water depends upon the nature of the soil,
bedrocks and depth of the well. It might be present in deep as well as in shallow wells. Since,
it is very soluble and totally portable in dissolved form, it can readily move with water
through the soil. Heavy rainfall or over-irrigation results the nitrate leaching into groundwater
zones that might be utilized as a drinking water source. As a rule nitrate fixations are most
noteworthy in groundwater closest to the land surface where nitrogen sources are available
(APHA, 2003; Tahir & Rasheed, 2008).
Groundwater that occurs in fractured rocks in mountainous area typically flows in stream.
Along these lines, nitrates that at first lost through draining to groundwater can add to the
contamination of surface water, for example, streams, waterways and lakes. Correspondingly,
territories with a shallow water table or sinkholes are more defenceless against nitrate
pollution (WHO, 2011).
Source of Nitrate Exposure
Humans can be exposed to nitrate in a variety of ways; however, primary exposure can take
place through the diet. Nitrate is a natural substance found in both water and plants. Nitrate
from drinking water accounts for 15-75% of person‘s exposure to nitrate from environmental
sources. In the United States, the average dietary intake of nitrate is about 75-100 mg/day.
About 80-90% of this amount comes from vegetables with high nitrate content (beets, celery,
lettuce and spinach). People following a vegetarian diet may have nitrate intake of up to 250
mg/day. However, many fruits and vegetables contain protective factor e.g. vitamin C and E
that inhibit the transformation of nitrate nitrogen to nitrite. Meat products accounts for less
than 10 percent of nitrate in the diet. In overall contribution drinking water is the main
sources of exposure. Guidelines and regulatory limits relating to the amount of nitrate in
drinking water is 10 mg/l as nitrate-nitrogen (NO3–N) (WHO; UNICEF, 2012).
Page 17
17
Health Impacts of Nitrate-Nitrogen
The drinking water with excessive level of nitrate may cause serious health issues and
ultimately death. Children are the most vulnerable population affected by nitrate
contaminated water ingestion due to nitrate metabolizing triglycerides (NEQS, 1996). The
serious illness in infants under six months of age is due to the conversion of nitrate to nitrite
by the body, which can interfere with the oxygen-carrying capacity of the child‘s blood and
may develop a condition called Mathemoglobinemia or ―blue baby‖ syndrome. This is caused
when much of the blood circulating through the body is ―blue‖ (or oxygen–poor) rather than
―red‖ (or oxygen–rich). Symptoms include shortness of breath and appearance of bluish color
around the lips and in extreme cases whole body turns blue. Mathemoglobin levels in the
blood are normally 1-2% of total hemoglobin, detectable symptoms appear at 1% level; death
occurs at level of 50-75% (NEQS, 1996). Some scientific studies suggested that women
drinking nitrate contaminated water during pregnancy are more likely to have babies with
birth defects (Brender et al., 2013). Nitrate ingested by the mother may also interfere with the
oxygen supply to the fetus. People who have heart or lung disease, certain inherited enzyme
defects, or cancer may be more sensitive to the toxic effects of nitrate than others. In addition,
some evidences shows that long term ingestion of water with high nitrate develops
hemorrhage spleen. High content of Nitrate-N in drinking water is also associated with an
increased risk of bladder cancer. The possible carcinogenicity of nitrate depends on the
conversion of nitrate to nitrite and positive correlation between the concentrations of nitrate
in drinking water, the incidence nervous system malformation in newborns. Genotoxic effects
at the chromosomal level, an increased risk of developing insulin dependent diabetes. World
health organization reported in 2003 that the drinking water with high levels of nitrates may
be responsible for persistent or recurrent diarrhea; this may be responsible for causalities like
stomach cancer in young children. The literature reports possible associations between
drinking of nitrate contaminated water and many chronic health problems e.g. hyper
thyroidism (goiter) (Tahir and Rasheed, 2008).
2.2.12 Alkalinity
Anions like hydroxide, bicarbonate and carbonate compounds present in rocks produce
alkalinity. The alkalinity of water might be characterized as its capacity to neutralize the acid.
The extreme concentration of alkalinity which is typically above 500 mg/l is associated with
Page 18
18
high hardness and high pH which may cause scale deposition of pipes of the distribution
system and increased soap consumption. Moreover, the water with low alkalinity with pH
below 6.5 may cause corrosion of pipes (PCRWR, 2012). Alkalinity may be stated as an
aggregate property of water and its interpretation can be done on the basis of chemical
composition of the sample. The most acceptable level of alkalinity is reported as 50 to 500
mg/l as CaCO3 (WHO, 2004).
2.3 . Trace and Ultra-Trace Elements in Drinking Water
A trace element is defined as the chemical element that occur in a very small amount usually
less than 1 to 10 parts per million of a given element. Common examples of trace elements
include copper, iron, cobalt, zinc, arsenic etc. (WHO, 1994).
Ultra-trace element is defined as chemical element that normally comprises less than one
microgram per gram of a given element. Ultra-trace elements in a human body include,
boron, lead, nickel, silicon, lithium (WHO, 1994).
2.3.1 Iron
On the earth crust, Iron is found as an abundant element by weight. It is one of the most
essential nutrition for human. Biologically iron is essential for proteins as hemoglobin. It may
be present as a state of ferrous (divalent) and ferric (trivalent) in water. The iron solubility
relies on the pH and the oxidation-reduction potential in the water. Iron deposit may result in
slimy coating on the piping and also cause staining of laundry. At a level above 1 mg/l in
water, iron can cause a bittersweet astringent taste. The presence of iron may encourage the
growth of ―iron bacteria‖ which originate their energy through the oxidation of ferrous iron to
ferric iron. Iron deficiency may cause fatigue and anemia. The excessive intake of iron
through the mean of food or drinking may cause vomiting, dizziness, shortness of breath,
headache, anorexia, weight loss. WHO has recommended 0.3 mg/l as permissible limit of
iron (WHO, 2003).
Page 19
19
2.3.2 Arsenic
Arsenic is a most common and naturally occurring omnipresent element found in the form of
inorganic arsenic compounds in the earth‘s crust. Smelting of non-ferrous metals and mining
are considered among the sources of arsenic contamination of water, soil, and air. In Pakistan,
arsenic is usually found in the underground water and is considered as one of the major
pollutants (Arain et al., 2007). The arsenic concentration in ground water has been estimated
in the Sindh province, as 1100 ppb as compared to WHO limits 10ppb (Arain et al., 2007).
According to World Health Organization, arsenicosis is defined as increasing of chronic
health issues due to long term (usually six-months) intake of arsenic above the safe limit,
usually noticeable by characteristic skin lesions of both keratosis(Hypo/Hyper) and
melanosis (hyper-pigmentation), with or without the involvement of internal organs (WHO,
2003) . Melanosis (Hyper-pigmentation) typically appears as fine dark spots or raindrop like
spots on the sun un-exposed part of the body especially on upper trunk, back, arm and legs.
Keratosis (Hypo/Hyper) typically appears as thickening of the skin of palms and/or soles or
appears as small, hard, yellowish, bilateral symmetrical corn like nodules on both palms and
soles. Depending on the diameter of nodules, kerotosis can be classified, according to
NDWQS (2008), as;
Mild: (<2 mm).
Moderate: (>2-5 mm).
Severe: (>5 mm).
2.3.3 Fluoride
Fluoride is one of the most electronegative elements and among the lightest member of the
halogen group. It is therefore found in the environment as fluorides about 0.06-0.09% of the
earth‘s crust. Fluorides are found at significant levels in a wide variety of minerals, including
fluorspar, rock phosphate, cryolite, apatite, mica, hornblende and others. It is commonly
related with fumarolic gases, thermal waters and volcanic activity. The fluoride salt cryolite
is used for the production of aluminum as a pesticide (WHO, 2006). Rock phosphates are
converted into phosphate fertilizers by the removal of up to 4.2% fluoride. The removed
fluoride as fluorosilicates is frequently used to fluoridate drinking water. It is commonly
present in bricks, tiles and ceramics. Fluoride compounds in the earth‘s upper crust are
Page 20
20
soluble in water. Fluoride is found in both surface and groundwater. In surface freshwater,
however, fluoride concentrations are usually low i.e 0.01-0.3 mg/l. Typically in the sea water
fluoride is present about 1 mg/l , while lakes, river and groundwater commonly show less
than 0.5 mg/l of fluoride concentration (WHO, 2006). Naturally fluoride concentration in the
ground water depends upon chemical, physical or geological aquifer characteristics like rocks
and acidity of the soil, porosity, action of other chemical elements, depth of the well and the
temperature. High groundwater fluoride concentrations associated with igneous and
metamorphic rocks such as granites and gneisses have been reported from India, West Africa,
Thailand, China, Sri Lanka and Southern Africa (PCRWR, 2012). Fluoride is fairly abundant
in the earth‘s crust and can enter groundwater by natural processes like leaching of bedrock
with high fluoride content (WHO, 2006).
Source of Fluoride Exposure
According to World Health Organization, the fluoride concentration in non-industrial areas,
is low (0.05-1.0 ppb) in the air (WHO, 2006). However, fluoride concentration may increase
in air due to industrial production of phosphate fertilizers, volcanic activity, coal ash and dust
from the burning of coal. It is estimated that more than 10 million people in China suffer
from fluorosis related to the burning of high fluoride coal (Watanabe et al., 2000). It has been
found that the swallowing of toothpaste by children contributes about 0.5-0.75 mg
fluoride/child/day (Bentley et al., 1999). Fruits and vegetables normally have low fluoride
level except rice, which have high levels e.g. about 2 mg/kg (WHO, 2006). Fluoride
concentrations in meat, fish and milk are relatively low as compared to tealeaves. Drinking
water is typically the largest single contributor to the daily fluoride intake (APHA, 1992).
Health Impacts of Fluoride
Fluoride is one of the most essential elements in the human body. It is beneficial to have 1
mg/l as presence of fluoride in drinking water to overcome effects against dental caries.
Studies have shown that children drinking fluoridated water can expect up to 35% less tooth
decay than those drinking non-fluoridated water (WHO, 2006). Dental caries, the most
prevalent chronic disease of human beings, is most widespread in children. Tooth decay
Page 21
21
reaches a peak in adolescence and diminished in adulthood. During the teeth formation stage,
fluoride helps in formation of strong and impervious enamel. However, chronic ingestion of
concentrations greater than 1.5 mg/l (WHO, 2006) guideline value is linked with
development of dental fluorosis (yellowish or brownish striations or mottling of the enamel)
and in extreme cases, creates skeletal fluorosis. Approximately, 75-90% of ingested fluoride
is absorbed (WHO, 2006). In an acidic stomach, fluoride is converted into hydrogen fluoride.
Once absorbed in the blood, fluoride readily distributes throughout the body, tending to
accumulate in calcium rich areas such as bone. Fluoride crosses the placenta and found in
mothers‘ milk in low concentrations than blood (WHO, 2006). The long term exposure of
flouride as 10-20 mg/d can lead to tendinous calcification, extreme boney deformities,
leading to osteosclerosis, crippling skeletal fluorosis and ligamentous (Azizullah et al., 2011).
The long term exposure of fluoride and its health are as:
Dental caries: <0.5 mg/l
Dental health: 0.5-1.5 mg/l
Dental fluorosis: 1.5-4 mg/l
Skeletal fluorosis: >4 mg/l
Crippling fluorosis: >10 mg/l
A large number of epidemiological studies showed that fluoride is carcinogenic, a bone
seeker and is associated with hip fractures and brittle bones. It has also been found that the
crippling malady of fluorosis not only affects the bones and teeth, but every tissue and organ
of the body, leading to death after prolonged illness (WHO, 2006). In addition, fluoride has
an effect on the kidneys, muscular and nervous system, and there are also some reports about
the relationship between erythrocyte abnormalities and serum fluoride leaves where fluoride
intake is high. The fluoride is mainly excreted from the kidneys (PEPA, 2004).
Page 22
22
2.4 Bacteriological Parameters
2.4.1 Coliforms
A particular group of waterborne microbiological contaminants is called total coliforms. TC
and its subgroup i.e. fecal coliforms (Escherichia coli) as the indicator of fecal contamination
of water are most important to evaluate the degree of drinking water pollution. Coliforms are
termed as bacteria‘s which can be found commonly in decaying matter, in soil, on the surface
of leaves and can grow in water distribution systems. These types of Coliforms bacteria are
not fecal contamination related and do not necessarily indicate unsafe water. All surface
waters contain a few microbes while ground waters are for the most part considered free from
microscopic organisms unless under the immediate impact of surface water. Microbial
contamination in both surface and groundwater may occur due to feedlots, septic tank
spillage, pastures, crude sewage, utilization of reused, concentrated discharge water, sewage
overburden and shameful coagulation. Pollution in the distribution system may occur due
cross-connection, broken water lines, or back-siphonage. Impacts of bacterial ingestion
incorporate stomach spasms and the runs. The drinking water guidelines described by WHO
is 0 cfu/100 ml (WHO, 1996).
2.4.2 Escherica coli
Fecal Coliforms are single-celled microorganisms, always associated with fecal
contamination of water. Escherica coli is a thermotolerant coliforms bacteria which possess
the enzymes B-glucuronidase, B-galactosidase and hydrolyzed 4-methyl-umbelliferyl-B-D-
glucuronidase. It is anticipated that Escherica coli is found in up to 95% of the human feces.
Usually, in the natural water environment Escherica coli cannot multiply and hence, used as
indicator for fecal contamination (WHO, 2000). The existence of Escherica coli can cause
nausea, diarrhea, and other problems to the population especially children and infants.
Hemorrhagic Colitis is the acute disease caused by Escherica coli. Hemorrhagic Colitis
disease can cause watery diarrhea, lower intestinal bleedings, fever, vomiting and severe
abdominal cramps, while in some situations renal failure or hemolytic uremic syndrome can
take place. These diseases can be life threatening and fatal for young children but not to
adults. Escherica coli are spread by fecal-oral ingestion through drinking, swimming or
Page 23
23
fishing (PCRWR, 2007). Guidelines for Escherica coli required 0 cfu/100ml of safe drinking
water (WHO, 1996).
Water treatment methods:
The goal of water treatment is to remove unwanted constituents such as dissolved organic and
inorganic material, bacterial and fine solids, to make it fit for drinking purpose. In Pakistan,
there are many methods available for the treatment of water like flocculation and coagulation
methods, three phase filtration system, chlorination tablets, safe storage, solar disinfection,
UV disinfection, bio sand filtration , Reverse Osmosis, ion exchange for water softening,
filtration for water softening. The most widely used water treatment method is flocculation
and coagulation (PCRWR, 2012).
Page 24
24
3. WATER SUPPLY AND SANITATION IN PAKISTAN
Tahir et al., (2010) described that the water for domestic consumption in Sindh Province of
Pakistan is provided through water supply schemes/systems in the urban areas. Whereas, in
rural areas it is based on groundwater pumped directly through hand pumps and motor pumps
installed at households and public sites. The most supply schemes/systems are based on River
Indus or some of its canals. The groundwater in Sindh province is generally saline, but some
packets of water are available where water is potable. These packets are commonly situated
on the banks of River Indus, canals, watercourses and old abundant areas of the River Indus.
The present work is focused on the rural areas of district Malir Karachi where water supply
schemes/systems are not available, and human population is dependent mainly on
groundwater. The rural areas are based on the scattered villages with population ranging from
a few hundreds to a few thousands per village. There is no organized sewerage system
available in the villages. Most of the sewage including human and animal waste infiltrates
into the soil due to poor sanitation process. This also affects the groundwater quality in the
area.
A number of legislations have been made to assure safe drinking water to the citizens.
However, these legislations are mainly implemented in the urban areas where water supply
schemes/systems are operated. Whereas, no such rules are being implemented in the rural
areas (Tahir et al., 2010). The Environmental Protection Agency (EPA) has been established
at federal and provincial levels to enforce better water quality within their respective areas.
However, these are working to enforce only in the urban areas, but these are not operated
within rural areas (PCRWR, 2012).
Memon et al. (2011) reported the drinking water quality of districts Thatta, Badin and Thar
regions by measuring physical, chemical and biological parameters for the samples collected
from dug wells, canals, shallow pump, and water supply schemes/systems. The result
indicated that the Total dissolved solids in all the groundwater samples exceeded the limits
set by WHO (1000 mg/l). Alkalinity, hardness and sodium exceeded by 33%, 59%, and 70 %
respectively. Iron was the major problem in the entire three districts ranging from 50% to 69
% higher than the guideline value. Other parameters such as pH, copper, manganese, zinc and
phosphorus were within the standard limits prescribed by the WHO (2004). Some of the
common diseases found in the study area were gastroenteritis, diarrhea, skin aches and
vomiting.
Page 25
25
Mahmood et al. (2014) reported the drinking water quality of district Thatta lower Sindh by
measuring physical, chemical and microbiological parameters for the different groundwater
samples collected in pre-monsoon and post-monsoon seasons, respectively. It was observed
that concentration of heavy metals were; As (0.0045 to 0.0055 mg/l), Cd (0.15-0.22 mg/L),
Zn (0.040 to 0.046 mg/l), Pb (1.40-1.49 mg/l) and Cu (0.001- 0.87 mg/L ) in both the seasons
and were in order of Pb > Cu > Cd > Zn > As in pre-monsoon and Pb> Cd > Cu > Zn > As in
post- monsoon respectively. Other parameters Electrical conductivity (233-987 μS/cm), pH
(6.9-8.9), TDS (161.1-690.9 ppm), Temperature (24-33 °C), chloride (81.79-131.78 ppm),
total hardness as CaCO3 (124.40-188.81 ppm), nitrate (2.10-5.20 ppm) were within
prescribed standard limits. Some common diseases were found to be nausea, vomiting and
kidney damage.
The study by Shar et al. (2010) about groundwater samples of Rohri city, Sindh province
reported total coliform (TC) and e.coli. The samples were collected before (pre) and after
(post) storage of water in the water tank. The 25% of the pre-storage groundwater samples
were found to have TC and 12.5% had e.coli. All of the post-storage samples had TC while
41.6% of those had e.coli. The post-storage samples contained higher amount of TC and
E.coli as compared to pre-storage samples. In the households, water stored in different
containers was found to exceed the maximum range of microbial contaminants i.e. TC and e.
coli counts per 100 ml as per the guidelines are given by WHO (2003).
To examine the coastal water pollution in Karachi Pakistan, Mashiatullah et al. (2009) carried
out a study on Malir and Lyari rivers that carry domestic waste and industrial effluents.
Different Physiochemical and biological parameters were analyzed. The coliform
contamination were observed to be 156 – 542 per 100 ml in high tide and 132- 974 per 100
ml in low tide. The total coliform bacteria results exceeded the limit of 0 cfu/100 ml given by
WHO (2004).
Aziz et al. (2005) reported a study for drinking water quality in Pakistan including both urban
and rural areas. The drinking water quality was not being well monitored especially in rural
areas. It has been shown after analyzing results from different investigation that total coliform
and faecal coliform were 150–2400/100 ml and 15–460/100 ml respectively. The total
coliform and faecal coliform results exceeded the WHO (1995) guidelines. The investigation
reported the presence of anthropogenic activities which resulted and exceeded limit of the
Page 26
26
total coliform(150–2400/100 ml ) and faecal coliform (15–460/100 ml) which could have
been a major contributor towards expansion of waterborne diseases.
Mahmood et al. (1998) reported results of groundwater samples from hand pumps in Landhi
and Korangi industrial areas. Different physiochemical parameters and major chemical
constituents were observed among the samples collected. The results indicated that EC (4163
μS/cm), TDS (2653 ppm), total hardness as CaCO3 (628 ppm), Na+
(630 mg/l) and Cl- (841
mg/l) were higher than WHO (1984) limits.
Pakistan Council of Research in Water Resources (PCRWR) in 2001 carried out a detailed
study on monitoring of drinking water quality and identified the presence of cyanide, lead
and chromium in the samples taken from ground water in industrial areas of Karachi. Report
published by PCRWR (2007) on monitoring of groundwater quality from the year 2002 to
2006 throughout the Sindh province revealed that 95% of shallow groundwater supplies are
bacteriological contaminated.
Mohsin et al. (2013) reported the drinking water quality of Bahawalpur city. The
groundwater samples were analyzed in the laboratory for different physicochemical and
biological parameters. The results indicated that EC (400 μS/cm), SO4 (310 mg/l) and Ca (84
mg/l) were above the permissible limits of WHO, whereas Cl (16-66 mg/l) and Na (28-33
mg/1) were below the permissible limits of WHO (2004). Due to the poor quality of the
drinking water some common water-borne diseases were reported as diarrhea, cholera,
typhoid etc.
Page 27
27
4. METHODLOGY
Drinking water samples were collected and analyzed for different physicochemical and
bacteriological parameters from rural areas of district Malir, Karachi. Geographical location
of the areas and the sampling points are shown in the Figure 1. A total of thirty-five water
samples were collected from different areas including towns and villages out of which Six
water samples were collected from Memon Village, two water samples from Arab Village,
one water sample from Sumar Ismail Village, one water sample from Sumar Kandani
Village, three water samples from Dhumba Village, five water samples from Konkar Village,
three water samples from Gadap Town, ten water sample from Kathore , two water samples
from Jokhio Village, one water sample from Fakeer Sohrab Goth Jokhio and one water
sample from Yar Muhammad Baloch Goth as shown in the Figures 1 a-c.
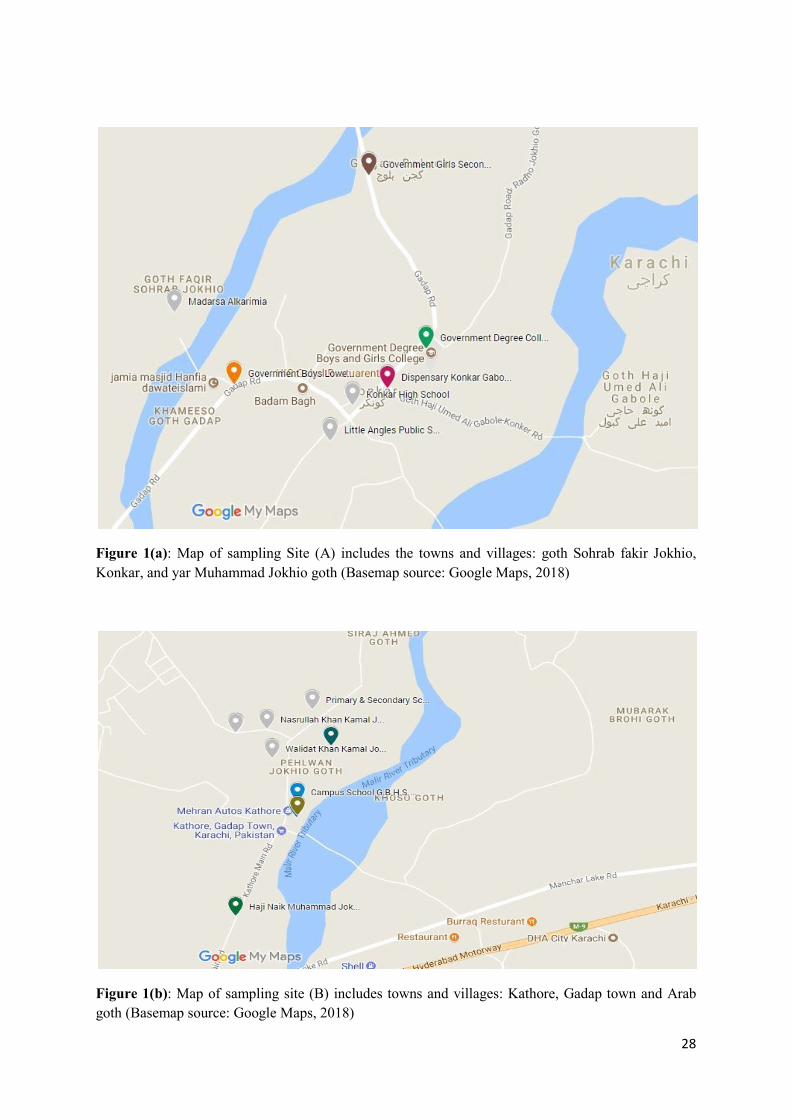
Figure 1: Map of sampling sites of Malir, Karachi. The circle A shows the area in goth Sohrab fakir
Jokhio, Konkar, yar Muhammad Jokhio goth, B in Kathore, Gadap town, Arab goth and C in Memon
goth, Dumba goth, Sumar Ismail village, Sumar Kandani village (Basemap source: Google Maps,
2018)
Page 28
28
Figure 1(a): Map of sampling Site (A) includes the towns and villages: goth Sohrab fakir Jokhio,
Konkar, and yar Muhammad Jokhio goth (Basemap source: Google Maps, 2018)
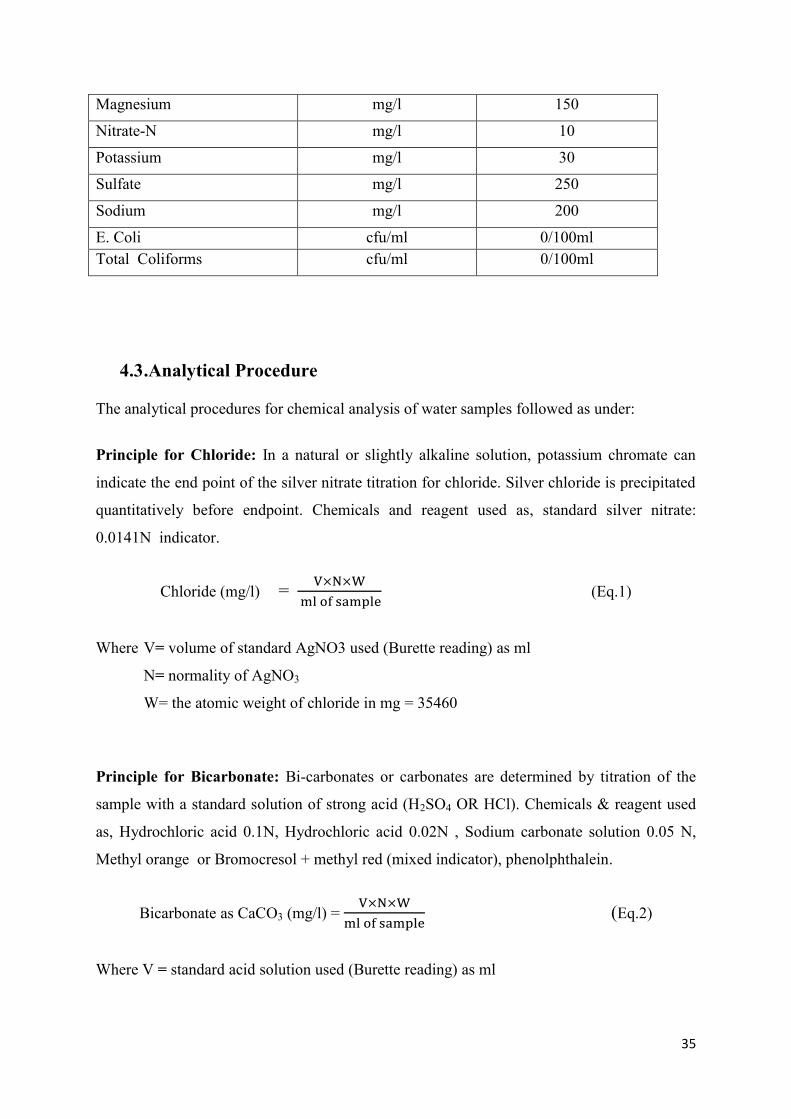
Figure 1(b): Map of sampling site (B) includes towns and villages: Kathore, Gadap town and Arab
goth (Basemap source: Google Maps, 2018)
Page 29
29
Figure 1(c): Map of sampling site (C) includes towns and villages, Memon goth, Dumba goth, Sumar
Ismail village and Sumar Kandani village (Basemap source: Google Maps, 2018)
Out of the thirty- five drinking water samples 26 (74%) water samples were collected from
Hand Pump sources located at houses and public places such as school, colleges, hospitals
and mosques and 09 (26%) samples were collected from Motor Pump installed at houses and
public places such as school, colleges, hospitals and shrines. Water sampling detail including
sampling location, village, source of water pumping, depth (m) and geographical coordinates
are specified in the Figure 2 and Table 1.
Figure 2: Distribution of sources for samples collected and analyzed for water quality.
Total Hand Pump Motor Pump
Coll
ecte
d S
ample
s
(% o
f T
ota
l)
35(100%)
26(74%)
9 (26%)
Page 30
30
Table 1: Detail of drinking water sampling including location, village, water extraction
method, depth and geographical coordinates.
S.
No.
Sample
Code
Village Sampling Location Water
Extraction
Method
Depth
(m)
Geographical
Coordinates
01 SUR-01 Arab Goth House Owner Daud
Khaskheli
Hand Pump 54.8 N:24054.631‘
E 067013.500‘
02 SUR-02 Arab Goth House Owner Subhal Khan
Abbasi
Hand Pump 60.9
N:24054.653‘
E 067013.587‘
03 SUR-03 Sumar
Ismail
Girls Government School Motor Pump 76.2 N:24054.694‘
E 067013.775‘
04 SUR-04 Sumar
Kandani
Village
House Owner Shaheed
Mushtaq Khaskheli
Motor Pump 85.3 N:24054.716‘
E 067014.026‘
05 SUR-05 Memon
Goth
House Owner Haji Asghar
Memon
Hand Pump 45.7 N:24054.825‘
E 067014.768‘
06 SUR-06 Memon
Goth
Uc Nadra Office Hand Pump 57.9 N:24054.987‘
E 067015.048‘
07 SUR-07 Memon
Goth
Zulfiqar Ali Bhutto Law
College
Hand Pump 54.9 N:24055.026‘
E 067015.147‘
08 SUR-08 Memon
Goth
Jamia Masjid Noorani Hand Pump 42.7 N:24055.164‘
E 067015.404‘
09 SUR-09 Memon
Goth
Restaurant Owner Ibrahim
Memon
Hand Pump 61 N:24055.318‘
E 067016.037‘
10 SUR-10 Memon
Goth
Mayi Niyani Dargah
Shareef
Hand Pump 24.4 N:24055.380‘
E 067016.286‘
11 SUR-11 Dhumba
Goth
Madarsa Darbar Habib Motor Pump 91.4 N:24033.502‘
E 068001.646‘
12 SUR-12 Dhumba
Goth
F.W.O School And
Hospital
Motor Pump 79.2 N:24058.564‘
E 067016.242‘
13 SUR-13 Dhumba
Goth
Baba Jilal Shah Bhukhari
Dargah
Motor Pump 106.7 N:24059.037‘
E 067017.558‘
14 SUR-14 Gadap
Town
Government Boys Lower
Secondary School
Motor Pump 109.7 N:25003.860‘
E 067015.707‘
15 SUR-15 Gadap
Town
Government Primary
School
Motor Pump 91.4 N:25015.800‘
E 067018.647‘
Page 31
31
S.
No.
Sample
Code
Village Sampling Location Water
Extraction
Method
Depth
(m)
Geographical
Coordinates
16 SUR-16 Fakeer
Sohrab
Goth
Jokhio
Madarsa Alkarimia Hand Pump 36.6 N:25004.078‘
E 067015.509‘
17 SUR-17 Konkar
Goth
Dispensary Konkar Gabool
Stop
Hand Pump 45.7 N:25003.849‘
E 067016.217‘
18 SUR-18 Konkar
Goth
Government Girls
Secondary School
Hand Pump 36.6 N:2504.490‘
E 067016.154‘
19 SUR-19 Konkar
Goth
Government Degree
College
Hand Pump 48.8 N:25003.967‘
E 067016.346‘
20 SUR-20 Konkar
Goth
Little Angles Public School Hand Pump 33.5 N:25003.690‘
E 067016.025‘
21 SUR-21 Konkar
Goth
Konkar High School Hand Pump 30.4 N:25003.797‘
E 067016.101‘
22 SUR-22 Yar
Muhammad
Baloch
Goth
Syed Usman Shah Bukhari
Dargah
Hand Pump 24.4 N:25002.807‘
E 067014.985‘
23 SUR-23 Gadap
Town
Baqai Medical University
And Hospital
Hand Pump 36.6 N:24059.206‘
E 067012.737‘
24 SUR-24 Kathore H.H .Sh Zayed Bin Sultan
Al-Nahyan Welfare Project
Mosque
Hand Pump 45.7 N:24059.206‘
E 067012.737‘
25 SUR-25 Kamal
Khan
Jokhio
Goth
Kathore
Campus School G.B.H.S.S Hand Pump 48.8 N:25002.057‘
E 067022.553‘
26 SUR-26 -do- Walidat Khan Kamal
Jokhio
Hand Pump 54.9 N:25002.213‘
E 067022.467‘
27 SUR-27 -do- Nasrullah Khan Kamal
Jokhio
Hand Pump 57.9 N:25002.318‘
E 067022.447‘
28 SUR-28 -do- Shabsdin Khan Kamal
Jokhio
Hand Pump 61 N:25002.304‘
E 067022.341‘
29 SUR-29 -do- Nabu Khan Kamal Jokhio Hand Pump 48.8 N:25002.305‘
E 067022.340‘
30 SUR-30 -do- Primary & Secondary
School Kamal Khan Jokhio
Hand Pump 39.6 N:25002.389‘
E 067022.604‘
Page 32
32
S.
No.
Sample
Code
Village Sampling Location Water
Extraction
Method
Depth
(m)
Geographical
Coordinates
31 SUR-31 -do- Jamia Masjid Mukadas
Madarsa Education
Hand Pump 45.7 N:25002.257‘
E 067022.670‘
32 SUR-32 -do- Abdullah Poultry Farm
And Abdullah Town
Hand Pump 48.8 N:25002.352‘
E 067022.707‘
33 SUR-33 Kathore District Council
Dispensary Kathore
Hand Pump 36.6 N:25002.005‘
E 067022.552‘
34 SUR-34 Jokhio
Goth
Haji Naik Muhammad
Jokhio Town
Motor Pump 91.4 N:25002.008‘
E 067022.554‘
35 SUR-35 Jokhio
Goth
Self Assisted School
(Primary School) Malir
Hotel And Water
Distribution Service
Motor Pump (67 N:25001.647‘
E 067022.340‘
4.1 Sample Collection and Preservation
Drinking water samples for chemical analysis were collected in polystyrene bottles of 300 ml,
500 ml and 1000 ml capacities. For bacterial analysis, 100 ml capacity sterilized bottles were
used stored at low temperature using ice boxes and transported to the laboratory within 2
hours recommended by WHO (2004). Boric acid (1 M) was used as preservative in the
sampling bottles for nitrate-nitrogen. All the standard precautionary measures were taken into
account while collecting samples in the field shown in Figure 3.
Drinking water samples were collected for microbiological, nitrate and detailed chemical
drinking water quality parameters. The detail of sample types and preservative used for each
sample are as under:
Type A–All sites, 100-150ml sterilized sampling bottle for microbiological analysis (No
preservative)
Type C–All sites, 300-500ml capacity bottles preserved with 1 M boric acid (1ml/100ml),
for nitrate-nitrogen
Type D–All sites, One liter capacity bottles, other water quality parameters such as F, TDS,
hardness, SO4, Cl, HCO3, Na, K, Ca, Mg etc. (No preservative)
Page 33
33
4.2 Analytical Methods
The drinking water samples were collected and analyzed for detailed physicochemical and
bacteriological parameters using standard methods as described in Table 2. Methods
described by American Public Health Association (APHA) (1992) are predominantly used for
this study, among others. WHO & PSQCA drinking water quality guideline values/ standards
used for comparing the measured values are shown in Table 3.
Table 2: Water Quality Parameters, Methods and Equipments used for Analysis
Parameters Standard Method Used
Equipment Used
Alkalinity 2320, Standard method APHA
(1992)
Arsenic Merck Test Kit 1.17927.0001
Bicarbonate 2320, Standard method APHA
(1992)
Calcium 3500-Ca-D, Standard Method
APHA (1992)
Carbonate 2320, Standard method APHA
(1992)
Chloride Titration (Silver Nitrate), Standard
Method APHA (1992)
Color Sensory Test
Electric
Conductivity
E.C meter, EuTech, CON11,
Singapore
Hardness EDTA Titration, Standard Method
APHA (1992)
Magnesium 2340-C, Standard Method APHA
(1992)
Nitrate
Nitrogen
4500-B using UV
Spectrophotometer APHA
(1992)
Odor Sensory Test
pH pH Meter, Model6230N,
JENCO
Potassium Flame photometer DN7101,
Italy
Page 34
34
Sodium Flame photometer DN7101,
Italy
Sulfate Turbidimetric method, HACH
8051(DR-2800 HACH)
Taste Sensory Test
TDS 2540C, Standard method APHA
(1992)
Turbidity Turbidity Meter, Lamotte,
Model 2008, USA
Fluoride 4500-F-D, SPADNS method
using Colorimeter (DR-2800
HACH), APHA (1992)
Iron Standard method HACH 8008
(DR-2800 HACH), APHA
(1992)
Total
Coliforms
3M™ Petrifilm Official Methods of
Analysis OMA #991.14
E. Coli 3M™ Petrifilm Official Methods of
Analysis OMA #991.14
Table 3: Drinking Water Quality Standards/ Guidelines values
Water Quality Parameter Unit WHO(2004)/
PSQCA(2004)
Guidelines
Alkalinity m.mol/l NGVS
Color TCU/colorless Colorless
Odor - Odorless
Turbidity NTU <5
pH - 6.5-8.5
Conductivity μS/cm NGVS
Total Dissolve Solids mg/l <1000
Arsenic ppb 50
Bicarbonate mg/l NGVS
Chloride mg/l 250
Calcium mg/l 200
Fluoride mg/l 1.5
Hardness mg/l 500
Iron mg/l 0.3
Page 35
35
Magnesium mg/l 150
Nitrate-N mg/l 10
Potassium mg/l 30
Sulfate mg/l 250
Sodium mg/l 200
E. Coli cfu/ml 0/100ml
Total Coliforms cfu/ml 0/100ml
4.3 .Analytical Procedure
The analytical procedures for chemical analysis of water samples followed as under:
Principle for Chloride: In a natural or slightly alkaline solution, potassium chromate can
indicate the end point of the silver nitrate titration for chloride. Silver chloride is precipitated
quantitatively before endpoint. Chemicals and reagent used as, standard silver nitrate:
0.0141N indicator.
Chloride (mg/l) =
(Eq.1)
Where V= volume of standard AgNO3 used (Burette reading) as ml
N= normality of AgNO3
W= the atomic weight of chloride in mg = 35460
Principle for Bicarbonate: Bi-carbonates or carbonates are determined by titration of the
sample with a standard solution of strong acid (H2SO4 OR HCl). Chemicals & reagent used
as, Hydrochloric acid 0.1N, Hydrochloric acid 0.02N , Sodium carbonate solution 0.05 N,
Methyl orange or Bromocresol + methyl red (mixed indicator), phenolphthalein.
Bicarbonate as CaCO3 (mg/l) =
(Eq.2)
Where V = standard acid solution used (Burette reading) as ml
Page 36
36
N = normality of the acid
W= the equivalent weight of CaCO3 in mg= 100000/2=50000
Principle for Hardness: When EDTA is added to water containing both calcium and
magnesium, it combines first with calcium and then magnesium, when pH is made
sufficiently high. If a small amount of EBT indicator is added to an aqueous solution
containing calcium and magnesium ions, solution becomes wine red. Chemical & reagent
used as, EDTA, Buffer Solution, Erichrome black T (EBT), Deionized water.
Total hardness as CaCO3 (mg/l) =
(Eq.3)
Where: V = standard EDTA used (Burette reading) as ml
N = Normality of EDTA
W= the molecular weight of CaCO3 in mg = 100000
Principle for Calcium analysis: When Ethylenediamine-Tetra-Acetic Acid (EDTA) is
added to water containing calcium and magnesium, it combines first with calcium. Calcium
can be determined by directly, with EDTA, when pH is made sufficiently high, that the
magnesium is largely precipitated as the hydroxide and an indicator is used that combines
with calcium only. Chemicals & reagents used as, EDTA, NaOH (1M), Muricoxide indicator,
Deionized water.
Calcium (mg/l) =
(Eq.4)
Where: V = standard EDTA used (Burette reading) as ml
N = Normality of EDTA
W= the atomic weight of calcium in mg = 40000
Page 37
37
Magnesium calculation: (Eq.5)
Principle for Nitrate-Nitrogen analysis: Technique is useful for screening sample that have
low organic content. Measurement of UV absorption at 220 nm enables rapid determination
of nitrate while UV absorption at 275nm give indication of organic interferences by UV
screening technique on spectrophotometer following Beer-Lambert law. Chemicals and
reagent used for this purpose include 1 Normal solution of HCl and distilled water.
Sulfate analysis Procedure: Take 10 ml sample in beaker then add pillow of sulfate reagent,
and then wait for 5 minute for sulfate to form the turbidity in sample, then the measurement
was made on calorimeter.
Fluoride analysis Procedure: Take 10 ml sample in beaker then add 2ml of SPADNS
reagent, after 1 minute reaction time then sample was transferred to cuvettes to record the
reading on the calorimeter.
Iron analysis Procedure: First maintain the pH of the sample in the range of 2.5 – 3.5 by
adding 1 Molar solution of HCl. The calorimeter firstly calibrated with distilled water to
maintain the zero value. Afterwards, take 10 ml sample and add 1 iron pillow (iron reagent)
and then press the reaction time for 3 minutes to dissolve iron reagent and then put that
sample in the calorimeter and note the result.
Principle for Sodium and Potassium analysis: The compounds of sodium and potassium
are thermally dissociated and atoms further excited to high energy level. When these atoms
come back to lower energy level (ground state) they emit radiation which lies in the specific
Page 38
38
visible region of the spectrum. Chemical and reagent used are sodium, potassium stock
solution standards and distilled water.
Procedure for Analysis of Total coliform and E-coli: Pour 1ml sample on 3m Petri Film
for E. coli/Coliform Count. Then place it into the refrigerator at 37 °C for 24 hours after 24
hours count the result.
4.4 . Sodium Adsorption Ratio
Sodium Adsorption Ratio (SAR) is a measure of the suitability of water for use in agriculture
(Irrigation), which is determined by the dissolved solids concentration in the water.
To estimate the risk of dispersion of soil particles, it is recommended to consider the ratio of
sodium to transferable cations on soil colloids. The permeability of the soil is affected by
water with high sodium ions. When sodium ions are present in the soil, it substitutes the
magnesium and calcium adsorbed on the soil and causes dispersion of soil particles. The
main purpose to calculate SAR is water suitability for irrigation (Asadollahfardi et al. 2013).
In this thesis, SAR values and concentration of dissolved solids were calculated on the basis
of laboratory results for the samples collected from the study area as per the following
formula suggested by Asadollahfardi et al. (2013).
(Eq.6)
Where Na+, Ca
2+, and Mg
2+ represent concentrations expressed in milliequivalents per litre
for each constituent.
Page 39
39
4.5 . Health Risk Assessment
Health risk assessment is a scientific activity that allows calculating effects of the pollutant
on human health via drinking water while also allowing adoption of policies for safe drinking
water in a worst-case situation. In Present study, health risk assessment due to elevated
concentration of chemicals in the groundwater was carried out by measuring chronic daily
Intake (CDI) indices to acceptable daily intake (ADI) based on WHO permissible limits for
the minimum concentration to maximum concentration for different chemical parameters.
The chronic daily intake indices (CDI) through water ingestion were calculated using
following formula (Muhammad et al., 2011):
(Eq.7)
Where, C represent observed concentration of a parameter (mg/l), DI represents daily intake
(2 l/day) and BW represent body weight (72 kg).
The risk was calculated using following equation.
(Eq.8)
The above equation expresses the ratio between the CDI and ADI. CDI are the values chronic
daily intake and ADI is acceptable daily intake based on WHO maximum permissible limit.
These numerical values are not strictly speaking a risk and the assessment is merely
qualitative. The ratio lower than 1 means that the population exposed is theoretically out of
danger whereas, a quotient higher than 1 means that the toxic effects can occur without it
being possible to predict its probability (Emmanuel et al., 2009). The levels were considered
in the framework of this assessment to interpret the results.
Page 40
40
R<1 L: Low
R=1 M: Moderate
R>1 H: High
Statistical Calculation
Values for all the parameters were reported as mean using Excel software. Linear regression
analysis between total dissolved solids concentration and depth, between Cl concentration
and total dissolved solids and between Cl concentration and Ca+Mg were performed.
Page 41
41
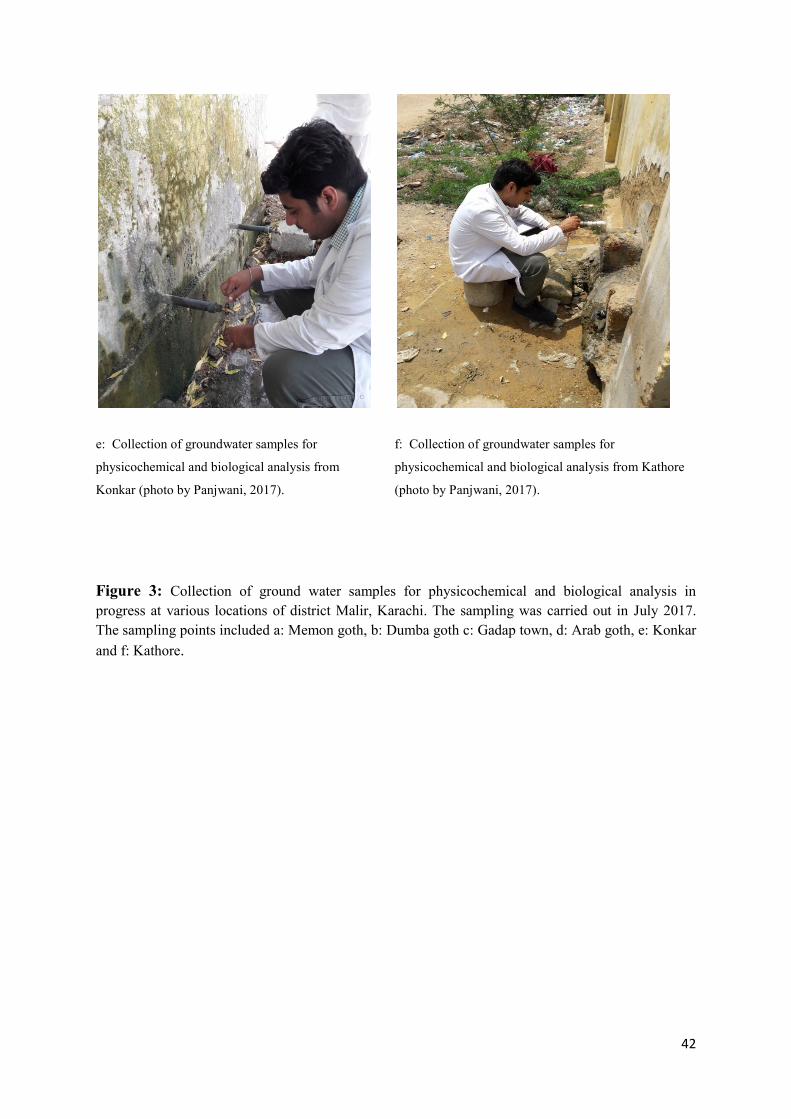
a: Collection of groundwater samples for
physicochemical and biological analysis from
Memon goth (photo by Panjwani, 2017).
b: Collection of groundwater samples for
physicochemical and biological analysis from Dumba
goth (photo by Panjwani, 2017).
c: Collection of groundwater samples for
physicochemical and biological analysis from
Gadap town (photo by Panjwani, 2017).
d: Collection of groundwater samples for
physicochemical and biological analysis from Arab
Goth (photo by Panjwani, 2017).
Page 42
42
Figure 3: Collection of ground water samples for physicochemical and biological analysis in
progress at various locations of district Malir, Karachi. The sampling was carried out in July 2017.
The sampling points included a: Memon goth, b: Dumba goth c: Gadap town, d: Arab goth, e: Konkar
and f: Kathore.
e: Collection of groundwater samples for
physicochemical and biological analysis from
Konkar (photo by Panjwani, 2017).
f: Collection of groundwater samples for
physicochemical and biological analysis from Kathore
(photo by Panjwani, 2017).
Page 43
43
5 RESULTS AND DISCUSSION
Altogether, thirty-five drinking water samples from groundwater in rural areas of district
Malir, Karachi were collected and analyzed for different physicochemical and bacteriological
parameters i.e. color, odor, taste, pH, electric conductivity, total dissolved solids , calcium,
hardness, bicarbonates, fluoride, sulfate, nitrate-nitrogen, iron , arsenic, sodium,
potassium, magnesium, total coliforms and e.coli.
5.1 Physicochemical Characteristics
The analytical data was compared with World Health Organization (WHO) and National
Environmental Quality Standards Pakistan (NEQS) water quality standards and the results
demonstrated that out of collected 35 drinking water samples, 6 (17%) drinking water
samples were found not safe due to presence of turbidity and were beyond the safe limits (5
NTU). The maximum value for turbidity was measured as 13.8 NTU. Five drinking water
samples (14%) were found unsafe for drinking due to presence of color (Table 5). Some of
the hand pumps are installed fairly old and because some of defects in their water filtering
system, turbidity above the standard value was visible.
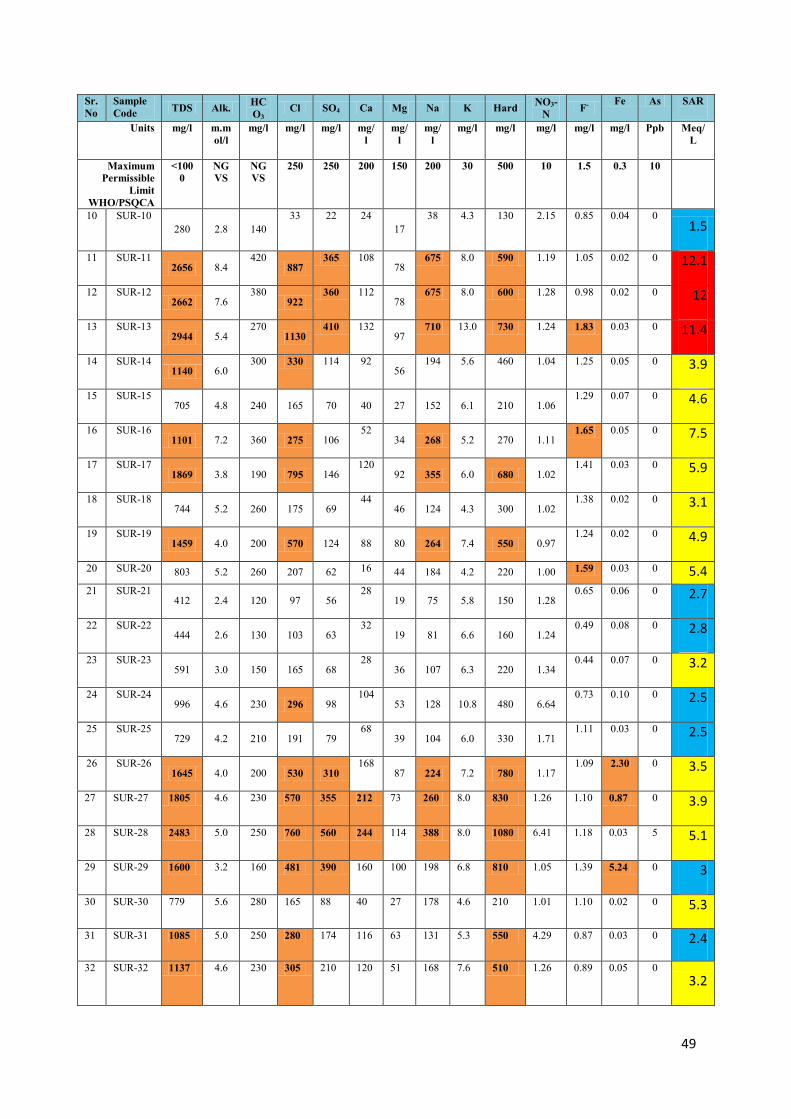
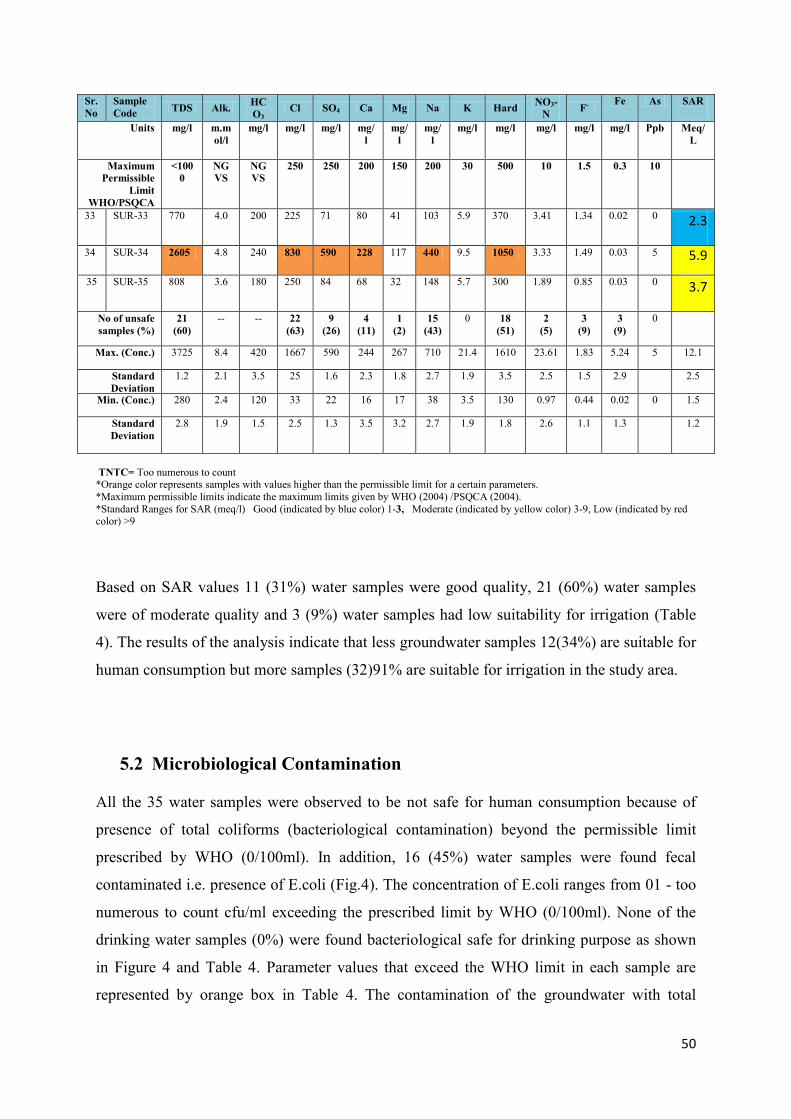
Out of 35 water samples, 21 (60%) were found not safe due to presence of TDS
content beyond the maximum permissible limits (1000 mg/l) recommended for human
consumption. Maximum concentration for TDS was recorded as 3725 mg/l. The Sindh
province particularly Karachi including Malir district have remained under the influence of
seawater. It is therefore, the reason for the high amount of salts (TDS). The attempt was made
to correlate the total dissolved solids with the depth of the hand pumps/motor pumps. A
positive linear regression was observed between TDS (mg/l) and Depth (m) with a low value
of the coefficient of determination, i.e. R2=0.217. The TDS are affected by the percolation of
rainwater and domestic sewage water (Figure 4). High amount of TDS will lead to corrosion
and increase water density which make water unfit for consumption.
Page 44
44
Figure 4: Linear regression between depth (m) and total dissolved solids (mg/l) in
groundwater samples collected from the rural areas of district Malir, Karachi.
Furthermore 22 drinking water samples (63%) were found unfit for human
consumption due to presence of chloride ion concentration beyond the maximum permissible
limits (250 mg/l) recommended by WHO (2004). The highest value for chloride was
measured as 1667 mg/l whereas 33 mg/l was as lowest. The scattered diagram was plotted to
see the linear regression of chloride concentration (mg/l) with TDS (Figure 5(a)) and
combined concentration of calcium and magnesium against chloride concentration (mg/l)
(Figure 5b). The coefficient of determination R2
was 0.951 and 0.737 for the two linear
regressions, respectively. It indicates that there is a good linear regression between the
parameters and they have a similar origin which could possibly be geological and rock
composition.
y = 17.411x + 386.64 R² = 0.2173
0
500
1000
1500
2000
2500
3000
3500
4000
0 20 40 60 80 100 120
To
tal
dis
solv
ed s
oli
ds
(mg
/l)
Depth (m)
Page 45
45
Figure 5(a): Linear regression between total dissolved solids (mg/l) and chloride (mg/l)
concentration in groundwater samples collected from district Malir, Karachi.
Figure 5 (b): Linear regression between chloride (mg/l) concentration and combined
concentration of (calcium and magnesium) mg/l in groundwater samples collected
from district Malir, Karachi.
y = 2.327x + 352.78 R² = 0.9518
0
500
1000
1500
2000
2500
3000
3500
4000
4500
0 200 400 600 800 1000 1200 1400 1600 1800
To
tal
dis
solv
ed s
oli
ds
(mg
/l)
Chloride (mg/l)
y = 3.0206x - 53.473 R² = 0.737
0
200
400
600
800
1000
1200
1400
1600
1800
0 50 100 150 200 250 300 350 400 450 500
Ch
lori
de
(mg
/l)
Calcium +Magnesium (mg/l)
Page 46
46
Furthermore, eighteen water samples (51%) were found unsafe for drinking due to presence
of hardness values beyond WHO permissible limits (500 mg/l). The highest value for
hardness was measured as 1610 mg/l whereas 130 mg/l was the lowest. Since hardness is the
amount of dissolved minerals especially Ca2+
and Mg2+
therefore the source may be traced
back to rock composition and soil erosion. Adverse health effects of hardness include kidney
stones (Jehan et al, 2009).
Fifteen water samples (43%) were found unfit for human consumption due to presence of
sodium content beyond the maximum permissible limits (200 mg/l) recommended by WHO
for human consumption. The highest value for sodium was measured as 710 mg/l and 38 mg/l
as minimum. The high concentration of sodium was present in the groundwater due to sea
water entrapped into the sediments of the sedimentary rock formations in the area (Walton,
1970). Nine water samples (26%) were found unfit for human consumption due to the
presence of sulfate content beyond the safe limits recommended by WHO (250 mg/l). The
highest value for sulfate was measured as 590 mg/l while 22 mg/l was as the lowest.
Four water samples (11%) were found unfit for human consumption due to the presence of
calcium content beyond the safe limits recommended by PSQCA (200 mg/l). The highest
concentration for calcium was measured as 244 mg/l while 16 mg/l was the lowest. High
concentration of calcium may be due to abundance of dolomite and calcite formations in the
area. Calcium is very essential for human bone cells; deficiency of which may lead to bones
fractures, as bones in the human body contains 95% of the calcium.(Khattak and Khattak,
2013).
Page 47
47
Figure 6: Distribution of samples in percentage beyond permissible limits for different
physicochemical parameters
Fluoride content exceeds WHO limits (1.5 mg/l) in three drinking water samples which is
9%. The highest concentration for fluoride was measured as 1.83 mg/l and 0.44 mg/l as
lowest. The exceeded value of fluoride may be due to some factors like geology of the area,
land composition, minerals etc (Mahmood et al., 1998).
Two water samples (5%) were found contaminated with nitrate–nitrogen content beyond the
safe limits (10 mg/l) recommended by WHO for human consumption. The highest
concentration for nitrate nitrogen was recorded 23.61 mg/l whereas 0.97 mg/l measured as
lowest. The higher value of nitrate may be due to improper disposal of municipal and
industrial waste and leaching of nitrate with percolating water into the groundwater zones as
well as unsystematic applications of agrochemicals (Tahir and Rasheed, 2008).
0%
10%
20%
30%
40%
50%
60%
70%
80%
90%
100%
No o
f S
am
ple
s as
% o
f to
tal
Parameters
Page 48
48
Three drinking water samples which is (9%) were found polluted with iron content beyond
the safe limits recommended by WHO (0.3 mg/l). The highest concentration for iron was
measured to be 5.24 mg/l while the minum value was 0.02 mg/l. The increased value of iron
in a groundwater may be result from leaching of industrial and sewage wastewater into the
ground water zones or may be due to dissolution of ferrous borehole and hand pump
components (Mahmood et al., 1998).
An orange colored cell shows the exceeding limits of the drinking water samples
recommended by WHO as shown in Table 4. Majority of the parameters above the
permissible limits of WHO for drinking water in groundwater of rural areas of district Malir
may be due to the geology of the region.
Table 4: Results for chemical analysis of groundwater samples collected from drinking water
wells and SAR values of water suitability for irrigation.
Sr.
No
.
Sample
Code TDS Alk.
HC
O3 Cl SO4 Ca Mg Na K Hard
NO3-
N F-
Fe As SAR
Units mg/l m.m
ol/l
mg/l mg/l mg/l mg/
l
mg/
l
mg/
l
mg/l mg/l mg/l mg/l mg/l Ppb Meq/
L
Maximum
Permissible
Limit
WHO/PSQCA
<100
0
NG
VS
NG
VS
250 250 200 150 200 30 500 10 1.5 0.3 10
1 SUR-01 1453 6.2
310 480
120 72 126
164 4.6 700 5.37 0.71 0.07 0 2.7
2 SUR-02 1971 7.6
380 665
200 92 124
355 11.0 740 3.00 0.60 0.04 0 5.7
3 SUR-03 399 2.8 140
91 36 36 17
66 5.6 160 1.13 0.47 0.10 0 2.3
4 SUR-04 442 2.4 120
120 45 36 22
72 7.4 180 1.21 0.67 0.07 0 2.3
5 SUR-05 1207 6.0
300
330 154 56 80
208 10.4 470 5.09 1.01 0.02 0 4.2
6 SUR-06 1709 7.4 370
516 140 68 117
310 6.5 650 23.61 1.02 0.03 0 5.3
7 SUR-07 1638 6.8 340
455 225 72 104
305 6.1 610 16.60 1.08 0.04 0 5.4
8 SUR-08 1227 7.6 380
270 162 88 70
193 21.4 510 4.91 0.93 0.03 0 3.7
9 SUR-09 3725 2.6 130
1667 390 204 267
535 3.5 1610 2.17 1.02 0.03 5 5.8
Page 49
49
Sr.
No
.
Sample
Code TDS Alk.
HC
O3 Cl SO4 Ca Mg Na K Hard
NO3-
N F-
Fe As SAR
Units mg/l m.m
ol/l
mg/l mg/l mg/l mg/
l
mg/
l
mg/
l
mg/l mg/l mg/l mg/l mg/l Ppb Meq/
L
Maximum
Permissible
Limit
WHO/PSQCA
<100
0
NG
VS NG
VS 250 250 200 150 200 30 500 10 1.5 0.3 10
10 SUR-10
280 2.8 140
33 22 24
17
38 4.3 130 2.15 0.85 0.04 0 1.5
11 SUR-11 2656 8.4
420 887
365 108 78
675 8.0 590 1.19 1.05 0.02 0 12.1
12 SUR-12 2662 7.6
380 922
360 112 78
675 8.0 600 1.28 0.98 0.02 0 12
13 SUR-13 2944 5.4
270 1130
410 132 97
710 13.0 730 1.24 1.83 0.03 0 11.4
14 SUR-14 1140 6.0
300 330 114 92 56
194 5.6 460 1.04 1.25 0.05 0 3.9
15 SUR-15 705 4.8 240 165 70 40 27 152 6.1 210 1.06
1.29 0.07 0 4.6
16 SUR-16 1101 7.2 360 275 106
52 34 268 5.2 270 1.11
1.65 0.05 0 7.5
17 SUR-17 1869 3.8 190 795 146
120 92 355 6.0 680 1.02
1.41 0.03 0 5.9
18 SUR-18 744 5.2 260 175 69
44 46 124 4.3 300 1.02
1.38 0.02 0 3.1
19 SUR-19 1459 4.0 200 570 124 88 80 264 7.4 550 0.97
1.24 0.02 0 4.9
20 SUR-20 803 5.2 260 207 62 16 44 184 4.2 220 1.00 1.59 0.03 0 5.4 21 SUR-21
412 2.4 120 97 56 28
19 75 5.8 150 1.28 0.65 0.06 0 2.7
22 SUR-22 444 2.6 130 103 63
32 19 81 6.6 160 1.24
0.49 0.08 0 2.8
23 SUR-23 591 3.0 150 165 68
28 36 107 6.3 220 1.34
0.44 0.07 0 3.2
24 SUR-24 996 4.6 230 296 98
104 53 128 10.8 480 6.64
0.73 0.10 0 2.5
25 SUR-25 729 4.2 210 191 79
68 39 104 6.0 330 1.71
1.11 0.03 0 2.5
26 SUR-26 1645 4.0 200 530 310
168 87 224 7.2 780 1.17
1.09 2.30 0 3.5
27 SUR-27 1805 4.6 230 570 355 212 73 260 8.0 830 1.26 1.10 0.87 0 3.9
28 SUR-28 2483 5.0 250 760 560 244 114 388 8.0 1080 6.41 1.18 0.03 5 5.1
29 SUR-29 1600 3.2 160 481 390 160 100 198 6.8 810 1.05 1.39 5.24 0 3
30 SUR-30 779 5.6 280 165 88 40 27 178 4.6 210 1.01 1.10 0.02 0 5.3
31 SUR-31 1085 5.0 250 280 174 116 63 131 5.3 550 4.29 0.87 0.03 0 2.4
32 SUR-32 1137 4.6 230 305 210 120 51 168 7.6 510 1.26 0.89 0.05 0
3.2
Page 50
50
Sr.
No
.
Sample
Code TDS Alk.
HC
O3 Cl SO4 Ca Mg Na K Hard
NO3-
N F-
Fe As SAR
Units mg/l m.m
ol/l
mg/l mg/l mg/l mg/
l
mg/
l
mg/
l
mg/l mg/l mg/l mg/l mg/l Ppb Meq/
L
Maximum
Permissible
Limit
WHO/PSQCA
<100
0
NG
VS NG
VS 250 250 200 150 200 30 500 10 1.5 0.3 10
33 SUR-33 770 4.0 200 225 71 80 41 103 5.9 370 3.41 1.34 0.02 0 2.3
34 SUR-34 2605 4.8 240 830 590 228 117 440 9.5 1050 3.33 1.49 0.03 5 5.9
35 SUR-35 808 3.6 180 250 84 68 32 148 5.7 300 1.89 0.85 0.03 0 3.7
No of unsafe
samples (%)
21
(60)
-- -- 22
(63)
9
(26)
4
(11)
1
(2)
15
(43)
0 18
(51)
2
(5)
3
(9)
3
(9)
0
Max. (Conc.) 3725 8.4
420
1667
590
244
267
710
21.4
1610
23.61
1.83
5.24
5
12.1
Standard
Deviation
1.2 2.1 3.5 25 1.6 2.3 1.8 2.7 1.9 3.5 2.5 1.5 2.9 2.5
Min. (Conc.) 280 2.4
120
33
22
16
17
38
3.5
130
0.97
0.44
0.02
0 1.5
Standard
Deviation
2.8 1.9 1.5 2.5 1.3 3.5 3.2 2.7 1.9 1.8 2.6 1.1 1.3 1.2
TNTC= Too numerous to count *Orange color represents samples with values higher than the permissible limit for a certain parameters.
*Maximum permissible limits indicate the maximum limits given by WHO (2004) /PSQCA (2004).
*Standard Ranges for SAR (meq/l) Good (indicated by blue color) 1-3, Moderate (indicated by yellow color) 3-9, Low (indicated by red color) >9
Based on SAR values 11 (31%) water samples were good quality, 21 (60%) water samples
were of moderate quality and 3 (9%) water samples had low suitability for irrigation (Table
4). The results of the analysis indicate that less groundwater samples 12(34%) are suitable for
human consumption but more samples (32)91% are suitable for irrigation in the study area.
5.2 Microbiological Contamination
All the 35 water samples were observed to be not safe for human consumption because of
presence of total coliforms (bacteriological contamination) beyond the permissible limit
prescribed by WHO (0/100ml). In addition, 16 (45%) water samples were found fecal
contaminated i.e. presence of E.coli (Fig.4). The concentration of E.coli ranges from 01 - too
numerous to count cfu/ml exceeding the prescribed limit by WHO (0/100ml). None of the
drinking water samples (0%) were found bacteriological safe for drinking purpose as shown
in Figure 4 and Table 4. Parameter values that exceed the WHO limit in each sample are
represented by orange box in Table 4. The contamination of the groundwater with total
Page 51
51
coliform and E-coli may be due to the mixing of sewage with shallow groundwater within the
area of hand pumps (Ahmed et al., 2013).(Table 1 and 4).
Figure 7: Distribution of samples in percentage exceeding permissible limits for
bacteriological contamination
Overall data shows that all the drinking water samples are found to be unsafe for drinking,
none of the sample found to be fit for human consumption for analyzed parameters under
Maximum Permissible Limits as shown in Table 4. An orange colored cell shows the samples
that exceed limits recommended by WHO as shown in Table-5.
0%
10%
20%
30%
40%
50%
60%
70%
80%
90%
100%
Total T.Coliforms E-coli Safe
No o
f S
am
ple
s in
%
Parameters
Page 52
52
Table 5: Results for physical & microbiological analysis of groundwater samples collected
from drinking water wells.
Sr.
No.
Sample
Code Color E.C. Odor pH Taste Turbidity
Total
Coliforms
E.coli
Units - µS/cm - - - NTU cfu/ml cfu/ml
Maximum Permissible
Limits (WHO/PSQCA) Colorless NGVS U.O 6.5-
8.5 U.O <5 0/100ml 0/100ml
1 SUR-01 Colorless 4150 U.O 7.42 U.O 2.3 TNTC 02
2 SUR-02 Colorless 4160 U.O 7.40 U.O 2.5 TNTC 00
3 SUR-03 Colorless 4600 U.O 8.19 U.O 1.8 54 03
4 SUR-04 Colorless 1781 U.O 8.15 U.O 2.9 05 00
5 SUR-05 Colorless 1101 U.O 7.88 U.O 3.1 16 00
6 SUR-06 Colorless 1721 U.O 7.86 U.O 2.1 44 03
7 SUR-07 Colorless 2920 U.O 7.61 U.O 3.2 02 00
8 SUR-08 Colorless 1163 U.O 7.51 U.O 2.1 15 00
9 SUR-09 Colorless 2280 U.O 8.03 U.O 2.3 24 00
10 SUR-10 Colorless 1254 U.O 7.96 U.O 1.7 60 00
11 SUR-11 Colorless 643 U.O 7.81 U.O 1.8 44 01
12 SUR-12 Colorless 693 U.O 7.74 U.O 1.9 11 00
13 SUR-13 Colorless 924 U.O 8.11 U.O 2.3 64 00
14 SUR-14 Colorless 1556 U.O 8.10 U.O 2.8 TNTC
04
15 SUR-15 Colorless 1139 U.O 8.05 U.O 3.5 TNTC
06
16 SUR-16 Colorless 2570 U.O 8.10 U.O 3.1 TNTC
01
17 SUR-17 Colorless 2820 U.O 7.88 U.O 2.8 05 00
18 SUR-18 Colorless 3880 U.O 7.68 U.O 2.0 TNTC 00
19 SUR-19 Colorless 2500 U.O 7.89 U.O 2.2 26 00
20 SUR-20 Colorless 1217 U.O 8.24 U.O 1.9 67 00
21 SUR-21 Colorless 1695 U.O 8.23 U.O 2.6 TNTC 02
Page 53
53
Sr.
No.
Sample
Code Color E.C. Odor pH Taste Turbidity
Total
Coliforms
E.coli
Units - µS/cm - - - NTU cfu/ml cfu/ml
Maximum Permissible
Limits (WHO/PSQCA) Colorless NGVS U.O 6.5-
8.5 U.O <5 0/100ml 0/100ml
22 SUR-22 Colorless 1776 U.O 8.27 U.O 2.8 18 00
23 SUR-23 Colorless 1203 U.O 8.08 U.O 3.3 39 01
24 SUR-24 Colorless 4070 U.O 7.41 U.O 3.6 66 01
25 SUR-25 Colorless 1263 U.O 7.98 U.O 2.7 TNTC 00
26 SUR-26 Colored 4150 U.O 7.37 U.O 10.8 TNTC 03
27 SUR-27 Colored
4160 U.O 7.11 U.O 11.9 10 00
28 SUR-28 Colored
4600 U.O 7.21 U.O 12.8 16 00
29 SUR-29 Colorless 1781 U.O 7.25 U.O 10.7 TNTC 28
30 SUR-30 Colorless 1101 U.O 8.15 U.O 3.5 52 00
31 SUR-31 Colorless 1721 U.O 8.03 U.O 3.1 46 02
32 SUR-32 Colored 2920 U.O 7.72 U.O 12.4 38 00
33 SUR-33 Colorless 1163 U.O 8.05 U.O 2.1 20 04
34 SUR-34 Colored 2280 U.O 7.97 U.O 10.9 87 03
35 SUR-35 Colorless 1254 U.O 8.20 U.O 1.9 70 05
No of unsafe
Samples (%) 5 (14.3) -- 0 0 0 06(17%) 35 (100%) 16(45%)
Max. (Conc.) -- -- -- 8.24 -- 12.8 TNTC 28
Standard Deviation 1.7 2.5 3.2
Min. (Conc.) -- -- -- 7.11 -- 1.7 02 00
Standard Deviation 2.2 1.3 *TNTC= Too numerous to count
*Orange color represents samples with values higher than the permissible limit for a certain parameter.
*Maximum permissible limits indicate the maximum limits given by WHO (2004) /PSQCA (2004).
Page 54
54
The effect of water quality on the human health was assessed in qualitative terms using risk
assessment factor. The risk assessment factor (R) for different chemicals was in the range of:
TDS (0.28 – 3.72), Cl (0.13 - 6.66), SO4 (0.08 – 2.36), Ca (0.07 – 1.21), Mg (0.11 – 1.78), Na
(0.19 – 3.55), NO3-N (0.096 – 2.36), hardness (0.26 – 3.22), Fe (0.06 – 17.47) and F (0.29 –
1.22) respectively. The drinking water samples with risk assessment factor (R) more than one
are considered to be harmful for humans (Table 6).
Table 6: Chronic daily intake (CDI) indices for chemical parameters in the drinking water.
Sr.No. Parameters CDI(min) CDI(max) ADI Rmin=
CDImin/
Rmax=
CDImax/
ADI ADI
1 TDS 7.77 103.47 27.77 0.28 3.72
2 Cl 0.91 46.30 6.94 0.13 6.66
3 SO4 0.61 16.38 6.94 0.08 2.36
4 Ca 0.44 6.77 5.55 0.07 1.21
5 Mg 0.47 7.41 4.16 0.11 1.78
6 Na 1.05 19.72 5.55 0.19 3.55
7 K 0.097 0.59 0.83 0.11 0.71
8 NO3-N 0.02 0.65 0.27 0.096 2.36
9 Hardness 3.61 44.72 13.88 0.26 3.22
10 Fe 0.0005 0.14 0.0083 0.06 17.47
11 F- 0.012 0.05 0.0416 0.29 1.22
Page 55
55
6 . SUMMARY AND CONCLUSIONS
Groundwater is directly used for human consumption without any treatment method due to
non-availability of safe drinking water in rural areas of district Malir, Karachi in the Sindh
province of Pakistan. The water quality of study area has not been reported earlier. Thirty-
five groundwater samples were collected and analyzed for 22 different parameters including
physicochemical parameters and bacteriological contamination.
The results indicate that based on TDS, 60% groundwater samples are not suitable for human
consumption and 71% water samples may be considered not suitable based on most of the
physicochemical parameters. At the same time, all the samples were contaminated with
microbiological organisms. Depending on the parameter, the cause of contamination may be
geological or anthropogenic. The higher value of nitrate may be due to improper disposal of
municipal and industrial waste and leaching of nitrate with percolating water into the
groundwater zones as well as unsystematic applications of agrochemicals. The present study
also shows that the groundwater contaminated with chemicals may result in numerous health
risks as indicated by calculation of risk assessment factors.
The water samples which are not within the permissible limits may need, depending on the
type of contamination, a combination of one or more of the following treatment methods:
boiling, use of chlorination at household level, some primary treatments like flocculation and
coagulation method, three phase water purification method, safe storage, solar disinfection,
UV disinfection, bio sand filtration, Reverse Osmosis, ion exchange for water softening, and
filtration for water softening. Considering the adverse quality of water experienced in this
study, it is utmost important to encourage inhabitants to participate in the awareness
programs for the provision of safe drinking water. Furthermore it is also important to provide
proper sanitation infrastructure in the area including water and wastewater treatment, safe
disposal of wastewater and drainage lines should be kept away from water supply lines to
avoid infiltration of leaked wastewater into water supply pipes. Contamination from
industrial sources can be controlled by implementing and enforcing the NEQS for industrial
discharge.
Page 56
56
7 . REFERENCES
Ahmed, A., Noonari, T., Magsi, H. and Mahar, A., 2013. Risk assessment of total and faecal
coliform bacteria from drinking water supply of Badin city, Pakistan. Journal of
Environmental Professionals Sri Lanka, 2(1).
APHA, AWWA and WEF, D.E, 1992. Standards Methods for the Examination of Water and
Wastewater. American Public Health Association, American Water Works Association and
Water Environment Federation, 18th Edition, Washington, DC.
APHA, AWWA, WPCF, 2003. Standard Methods for Examination of Water and Wastewater,
20th Edition, American Public Health Association, Washington, DC.
Arain, G.M., Aslam, M., Majidano, S.A. and Khuhawar, M.Y., 2007. A preliminary study on
the arsenic contamination of underground water of Matiari and Khairpur Districts, Sindh,
Pakistan. JOURNAL-CHEMICAL SOCIETY OF PAKISTAN, 29(5), p.463.
Asadollahfardi.G., Hemati.A., Moradinejad.S., Asadollahfardi.R., 2013. Sodium Adsorption
Ratio (SAR) Prediction of the Chalghazi River Using Artificial Neural Network (ANN) Iran,
Current World Environment, 8(2), pp 169-178.
Aziz, J. A. 2005.Management of source and drinking water quality in Pakistan. Eastern
Mediterranean Region Health Journal, 11(5, 6), 1087–1098.
Azizullah, A.,Khattak,M. N. K., Richter, P., Hader, D-P., 2011. Water pollution in Pakistan
and its impact on public health. Environmental International, 37(2), 479-497.
Bentley, E.M., Ellwood, R.P. and Davies, R.M., 1999. Oral hygiene: Fluoride ingestion from
toothpaste by young children. British Dental Journal, 186(9), pp.460-462.
Brender, J.D., Weyer, P.J., Romitti, P.A., Mohanty, B.P., Shinde, M.U., Vuong, A.M.,
Sharkey, J.R., Dwivedi, D., Horel, S.A., Kantamneni, J. and Huber Jr, J.C., 2013. Prenatal
nitrate intake from drinking water and selected birth defects in offspring of participants in the
National Birth Defects Prevention Study. Environmental health perspectives, 121(9), p.1083.
Page 57
57
Chandio, B.A., Abdullah, M. and Tahir, M.A., 1998. Drinking water quality and
standardization in Pakistan. In Proceedings of the national workshop on quality of drinking
water (pp. 14-18).
Daud.M.K, Nafees. M., Ali.S., Rizwan.M., Bajwa.R.A., Shakoor.M.B., Arshad.M.U,
Chatha.S.A.S., Deeba.F., Murad.W., Malook.I., Zhu.S.J., 2017.‗Drinking Water Quality
Status and Contamination in Pakistan‘ Hindawi BioMed Research International, 2017, pp 18.
Daudpota, W.M., Memon, N.U.N. and Miano, T.F., 2016. DETERMINATION OF
GROUND WATER QUALITY FOR AGRICULTURE AND DRINKING PURPOSE IN
SINDH, PAKISTAN (A CASE STUDY). Science International, 28(1), vol. 28, pp. 701–704.
Emmanuel, E., Pierre, M.G. and Perrodin, Y., 2009. Groundwater contamination by
microbiological and chemical substances released from hospital wastewater: Health risk
assessment for drinking water consumers. Environment international, 35(4), pp.718-726.
Jehan, N., Israr, M., Gul, N., Shmas, H., Shafiq-U-Rehman, S. and Khan, S., 2009.
Assessment of physiochemical characteristics of drinking water quality in Kohat
Development Authority, NWFP, Pakistan. Journal of Himalayan Earth Sciences, 42, pp.45-
52.
Khan, M. A., Rahman, A. and Lee, H. K., 1997. Domestic water contamination in rapidly
growing magacities of Asia: Case of Karachi, Pakistan, Environmental Monitoring and
Assessment, 44, 339–360.
Khattak, M.I. and Khattak, M.I., 2013. Ground water analysis of Karachi with reference to
adverse effect on human health and its comparison with other cities of Pakistan. Journal of
Environmental Science and Water Resources, 2(11), pp.410-418.
Mahmood, K., Alamgir, A., Khan, M.A., Shaukat, S.S., Anwar, M. and Sherwani, S.K., 2014.
Seasonal variation in water quality of lower Sindh, Pakistan. FUUAST Journal of
Biology, 4(2), p.147.
Mahmood, S.N., Naeem, S., Siddiqui, I. and Khan, F.A., 1998. Studies on physico-chemical
nature of ground water of Korangi/Landhi (Karachi). Journal of the Chemical Society of
Pakistan, 19, pp.42-48.
Page 58
58
Malick, F. K., Akhtar, W., & Seema, J., 1998. Drinking water quality in the city of Karachi.
In 24th WEDC conference, sanitation and water for all. Islamabad: Pakistan.
Mashiatullah, A., Qureshi, R.M., Ahmad, N., Khalid, F. and Javed, T., 2009. Physico-
chemical and biological water quality of Karachi coastal water. The Nucleus, 46(1-2), pp.53-
59.
Mastoi, G. M., Shah, S. G. S., & Khuhawar, M. Y., 2008. Assessment of water quality of
Manchar Lake in Sindh (Pakistan). Environmental Monitoring and Assessment, 141, 287–
296.
Mehmood, K., Younas, U., Iqbal, S., Shaheen, M.A., Samad, A. and Hassan, S.I., 2012.
Physicochemical Profile of Ground Water in Bahawalpur City, Pakistan: Hazardous
Aspects. Journal of the Chemical Society of Pakistan, 34(5).
Memon, M., Soomro, M.S., Akhtar, M.S. and Memon, K.S., 2011. Drinking water quality
assessment in Southern Sindh (Pakistan). Environmental monitoring and assessment, 177(1),
pp.39-50.
Mohsin.M., Safdar.S., Asghar.F., Jamal. F., 2013. Assessment of Drinking Water Quality and
its Impact on Residents Health in Bahawalpur City, International Journal of Humanities and
Social Science, 3,pp 15.
Muhammad, S., Shah, M.T. and Khan, S., 2011. Health risk assessment of heavy metals and
their source apportionment in drinking water of Kohistan region, northern
Pakistan. Microchemical Journal, 98(2), pp.334-343.
Naeem, M. S., Sitwat, N., Siddiqui, I. and Farooq, A. K., 1997.Studies on physico-chemical
nature of groundwater of Korangi/Landhi (Karachi), Jour. Chem. Soc. Pak. 19, (1) 42–48.
National environmental quality standards, 1996. Islamabad Pakistan Environmental
Protection Agency, Government of Pakistan.
National Standards for Drinking Water Quality (NSDWQ), 2008. Pakistan Environment
Protection Agency, Ministry of Environment, Government of Pakistan.
Page 59
59
Pak-EPA Report 2004. Investigation of contamination of drinking water in Hyderabad City.
Islamabad: Pakistan Environmental Protection Agency. Pak-EPA, Central Laboratory for
Environmental Analysis. Ministry of Environment.
PCRWR, 2004. Water Quality Profile of Pakistan (22 Cities) Report (Phase-III) 2003– 2004,
Pakistan Council for Research in Water Resources, Islamabad. Available from:
http://www.pcrwr.gov.pk/Publications/Water%20Quality%20Reports/National%20Water%2
0Quality%20Monitoring%20Program/water%20quality%20status%20in%20pakistan%20Pha
se-iii%202003-2004.pdf [Accessed 15 October 2017].
PCRWR, 2005. National water quality monitoring programme, Pakistan Council for
Research in Water Resources, Islamabad
PCRWR, 2007. National Water Quality Monitoring Programme Annual Report 2005– 2006,
Pakistan Council for Research in Water Resources, Islamabad. Available from:
http://www.pcrwr.gov.pk/Publications/Water%20Quality%20Reports/Water%20Quality%20
Monitoring%20Report%202005-06.pdf [Accessed 15 October 2017].
PCRWR, 2010. Technical Assessment Survey Report of Water Supply System of Sindh,
Pakistan Council for Research in Water Resources, Islamabad. Available at:
http://www.pcrwr.gov.pk/Publications/Water%20Quality/Water%20Suply%20Schemes%20S
indh.pdf [Accessed 15 November 2017].
PCRWR, 2012. Report on Technical Assessment of Water Supply Schemes, Sindh Province,
Volume I. Publication No 150-2012.
PSQCA, 2004. Drinking water quality guidelines, Pakistan Standards and Quality Control
Authority
Shar, A.H., Kazi, Y.F., Kanhar, N.A., Soomro, I.H., Zia, S.M. and Ghumro, P.B., 2010.
Drinking water quality in Rohri city, Sindh, Pakistan. African Journal of
Biotechnology, 9(42), pp.7102-7107.
Singh, B. and Sekhon, G.S., 1979. Nitrate pollution of groundwater from farm use of nitrogen
fertilizers—A review. Agriculture and Environment, 4(3), pp.207-225.
Page 60
60
Tahir, M.A. and Rasheed, H., 2008. Distribution of nitrate in the water resources of
Pakistan. African Journal of Environmental Science and Technology, 2(11), pp.397-403.
Tahir, M.A., Rasheed, M.H. and Imran, M.S. 2010, WATER QUALITY STATUS WATER
QUALITY STATUS IN RURAL AREAS RURAL AREAS OF PAKISTAN OF PAKISTAN
OF PAKISTAN.
Walton, W.C., 1970. Groundwater Resource Evaluation. McGraw-Hill. New York, p.494.
Watanabe, T., Kondo, T., Asanuma, S., Ando, M., Tamura, K., Sakuragi, S., Rongdi, J. and
Chaoke, L., 2000. Skeletal fluorosis from indoor burning of coal in southwestern
China. Fluoride, 33(3), pp.135-139.
WHO, 1971. International Standards for Drinking Water. 3rd
Edn, World Health
Organization, Geneva.
WHO, 1994. Guidelines for Drinking Water Quality, Vol I Recommendations. WHO,
Geneva.
WHO, 1996. Guidelines for Drinking Water Quality, Recommendations, (Vol. 1) pp. 16-17.
World Health Organization, Geneva.
WHO, 1996. Guidelines for drinking-water quality, Health criteria and other supporting
information (Vol. 2, 2nd
ed.), World Health Organization.
WHO, 2000. The world health report 2000: health systems: improving performance. World
Health Organization.
WHO, 2003. Arsenicosis case-detection, management and surveillance: report of a regional
consultation, New Delhi, India, 5-9 November 2002. In Arsenicosis case-detection,
management and surveillance: report of a regional consultation, New Delhi, India, 5-9
November 2002.
WHO, 2003. Guidelines for drinking water quality (pp. 81–87). Geneva: World Health
Organization.
WHO, 2004. Guidelines for drinking-water quality (Vol. 1). World Health Organization.
Page 61
61
WHO, 2004. Guidelines for drinking-water quality (vol. 1, 3rd ed.) Geneva: World Health
Organisation.
WHO, 2006. Fluoride in drinking-water, World Health Organization Geneva.
WHO, 2008. Guidelines for Drinking-water Quality [electronic resource]: incorporating 1st
and 2nd addenda, Vol. 1, Recommendations.
WHO, 2011. Guideline for drinking water quality, Recommendations. 4th Ed. Geneva, World
Health Organization
WHO, 2011. Guidelines for drinking-water quality (Edition, F), WHO chronicle, 38, pp.104-
8. World Health Organization.
WHO, 2017. Report on Water Resources of Pakistan, World Health Organization.
WHO; UNICEF, 2012. Progress on Sanitation and Drinking Water: Update; World Health
Organization/UNICEF: Geneva, Switzerland