524
G Drinking Sanitatio Sindh Strategic S Final Draft 6.0 dated Government of Sindh g Water, on and Hygi Sector Plan 2016 – 202 d 29 th December 2016 iene 26
Government of Sindh
Drinking Water,Sanitation and HygieneSindh Strategic Sector Plan 2016 – 2026
Final Draft 6.0 dated 29th December 2016
Government of Sindh
Drinking Water,Sanitation and HygieneSindh Strategic Sector Plan 2016 – 2026
Final Draft 6.0 dated 29th December 2016
Government of Sindh
Drinking Water,Sanitation and HygieneSindh Strategic Sector Plan 2016 – 2026
Final Draft 6.0 dated 29th December 2016

2

3
SINDH STRATEGIC SECTOR PLAN 2016 – 2026Drinking Water, Sanitation and Hygiene
Government of Sindh
Local Government and Housing Town Planning DepartmentPlanning and Development DepartmentPublic Health Engineering and Rural Development DepartmentHealth DepartmentSchool Education Department
Final Draft 6.0 – 29th December 2016
4
MESSAGE OF CHIEF MINISTER
The province of Sindh is home to the Indus waterway before it enters the ArabianSea. Despite having a large riverine source of water, the province of Sindh facesmany challenges in provision of potable drinking water owing to the growing urbanpopulation and presence of desert and brackish zones for its rural population. TheGovernment of Sindh is making tireless efforts to ensure there is adequateinfrastructure and capacity for supply of clean drinking water and availability ofadequate sanitation to its population.
The Government of Sindh has initiated a number of projects for water andsanitation and has planned to increase investments in water and sanitation in thefuture.
It is a matter of great satisfaction to learn that many water and sanitation projectsare under way in collaboration with national and international developmentpartners. I assure you that the Government of Sindh shall extend all possibleassistance to further enhance this collaboration so that we can achieve our ultimategoal of water and sanitation for all.
I am pleased to learn that a well-conceived and forward looking sector developmentplan has been formulated that provides a clear and strategic direction for the sector.Provision of clean and safely managed drinking water of acceptable quality andadequate and safely managed sanitation are not only basic necessities of life, theyhave an enormous impact on preventing needless mortality and nutritionaldeficiency because of diarrhoea. Furthermore, they also address manyenvironmental issues.
I look forward to seeing the implementation of this sector development plan infulfilment of the Sustainable Development Goal on water and sanitation, andwelcome national and international partners to join hands with the Government ofSindh in making this a reality.

5
MESSAGE OF CHIEF SECRETARY
Access to safely managed drinking water and sanitation are two of the benchmarksof development in any country. Today, Pakistan in general, and Sindh province inparticular, still faces many challenges of providing access to these basic services toall its citizens. There are many reasons for this, not the least of which are aburgeoning population especially in urban and peri-urban areas, multi-dimensionalpoverty, and low prioritisation of services in rural areas to name a few.
Today, Sindh province is undergoing a massive transition. On one hand, there israpid urbanisation with people flocking to cities and towns, while on the other,municipal services are not able to cope with the demand especially with themushroom growth of new housing schemes, industrial estates and commercialzones. This is further compounded by limited resources and increasing prioritieseach clamouring for more allocations.
Inadequate water and sanitation has adverse impacts on health and nutrition, andSindh province today still has unacceptably high child mortality rates and highnutritional deficiency among its children. This is unacceptable.
Taking these issues into consideration, and recognising the urgency of the problems,the Government of `Sindh has developed its ten-years sector development plan forwater, sanitation and hygiene, which shall usher in a new era of sectoraldevelopment based on sound evidence, clear strategic directions and multi-sectoralengagement to achieve the Sustainable Development Goal on water and sanitation.
I urge the concerned line departments to implement this plan in letter and spirit,and am confident that the new sector development plan will also provide a platformfor enhanced collaboration and cooperation with national and internationaldevelopment partners.

6
ACKNOWLEDGEMENTS
This enormous task of developing a sector development plan for water, sanitation and hygiene inSindh was made possible by the collaborative efforts of Local Government and Housing TownPlanning Department, Public Health Engineering and Rural Development Department, Planningand Development Department, Health Department and Education and Literacy Department.
UNICEF supported the process from inception to completion, while Avicenna Consulting Pvt Ltdwere the consultants for development of the sector plan.
The support and contributions of international, national and provincial sector partners is gratefullyacknowledged.
Individuals that played a significant role in formulation of this sector plan include:
Niaz Ahmed Soomro, Special Secretary Technical LG&HTPD; Farooq Siddiqui, Director PM&ECLG&HTPD; Fahim Junejo, Project Director Saaf Surthro Sindh; Ghulam Mohammad Sheikh,Assistant Chief Pⅅ Abdul Kaleem Sheikh, Assistant Chief Pⅅ Nabesh Akhtar, DeputyDirector, Urban Policy and Strategic Planning; M Akbar Baloch, XEN PHED; Munir Ahmed Sheikh,XEN PHED; Jamil Ahmed, Deputy Director Education; Israr Ahmed, Assistant Director, PD&REducation; Abdul Ahad Pasha, Planning Officer, Pⅅ Mazhar Iqbal, Programme Policy Officer,SUN-Nutrition Section; and Ghulam Mustafa, Senior Research Officer, PCRWR.
Special thanks to Tameez Uddin Khero, Secretary PHE&RDD for his encouragement andcontributions.
Profound gratitude to Irfan Alrai, WASH Specialist UNICEF, and Mubashira Iram, WASH OfficerUNICEF for their continuous support, guidance, contributions and critique throughout the process.
Gratefully acknowledge the contributions and active participation of Aijaz Ali Khan, Plan ProvincialCoordinator during the sector plan development process.
We acknowledge with grateful thanks the technical support by the Avicenna Consulting Pvt Ltdteam, Haroon Awan, Niaz Ullah Khan and Mohammad Bashir Khan in the formulation of the WASHSector Development Plan.
And last, but not least, this task would not have been possible without the timely administrativeassistance and support of M Azeem Chana, AD LG&HTPD and Ased Khan of LG&HTPD.

7
CONTENTS
MESSAGE OF CHIEF MINISTER 4MESSAGE OF CHIEF SECRETARY 5ACKNOWLEDGEMENTS 6LIST OF FIGURES 13LIST OF TABLES 15EXECUTIVE SUMMARY 17PREAMBLE 23
INTRODUCTION 27POPULATION 29HEALTH 29EDUCATION 29POVERTY 30MULTI-DIMENSIONAL POVERTY 30URBANISATION 33POLICY SHIFT FROM MDGS TO SDGS 36
SECTOR OVERVIEW 39
DEMOGRAPHICS 39INSTITUTIONS 39DRINKING WATER 40SANITATION 41
LEGISLATION AND POLICIES 43
PAKISTAN EPA ACT, 1997 43SINDH WATER MANAGEMENT (AMENDMENT) ACT, 2005 45SINDH MUNICIPAL WATER ACT (DRAFT), 2012 46SINDH ENVIRONMENTAL PROTECTION ACT, 2014 48SINDH LOCAL GOVERNMENT ACT, 2014 48SINDH SOLID WASTE MANAGEMENT BOARD ACT, 2014 51KARACHI WATER AND SEWERAGE BOARD ACT, 1996 54PAKISTAN WATER SECTOR STRATEGY, 2002 56NATIONAL DRINKING WATER POLICY, 2009 58NATIONAL SANITATION POLICY, 2006 59NATIONAL CLIMATE CHANGE POLICY, 2012 60HOSPITAL WASTE MANAGEMENT RULES, 2005 60DRAFT SINDH DRINKING WATER POLICY, 2016 61DRAFT SINDH SANITATION POLICY, 2016 63PAKISTAN APPROACHES TO TOTAL SANITATION, 2010 65COMMUNITY LED TOTAL SANITATION 65SCHOOL LED TOTAL SANITATION 66SOLID WASTE MANAGEMENT 66INTER-SECTORAL NUTRITION STRATEGY SINDH 68DRAFT WASH BEHAVIOUR CHANGE AND COMMUNICATION STRATEGY, 2016 70

8
LEGISLATION AND INSTITUTIONAL CHALLENGES 71STRATEGY 73
WATER RESOURCES 75
PAKISTAN’S WATER RESOURCES 75FRESHWATER FOOTPRINTS 77CLIMATE CHANGE 77WATER RESOURCE DEVELOPMENT IN SINDH, 83RAINWATER HARVESTING 85STRATEGY 86
WATER SUPPLY 88
URBAN WATER SUPPLY 88RURAL WATER SUPPLY 92WATER SUPPLY ISSUES 96ISSUES WITH KARACHI WATER SUPPLY 96CURRENT STATUS OF WATER SUPPLY SCHEMES 99REASONS FOR NON FUNCTIONAL (TEMPORARILY CLOSED) WATER SUPPLY SCHEMES 100PERIOD OF CONSTRUCTION OF WATER SUPPLY SCHEMES 100RECENT INITIATIVES FOR WATER SUPPLY BY GOVERNMENT OF SINDH 102SINDH CITIES IMPROVEMENT PROGRAMME 102NORTHERN SINDH URBAN SERVICES CORPORATION 102DESALINATION PLANTS 102K-IV DRINKING WATER PROJECT 103MATCHING GRANTS FROM FEDERAL GOVERNMENT 103SPECIAL INITIATIVES 103THAR COAL 103OTHER INITIATIVES 104STRATEGY 105
WATER QUALITY 108
NATIONAL WATER QUALITY MONITORING PROGRAMME 108TECHNICAL ASSESSMENT OF WATER SUPPLY SCHEMES 109BOTTLED WATER QUALITY 111WATER RESOURCES RESEARCH INSTITUTES AND LABORATORIES 114PAKISTAN COUNCIL OF RESEARCH IN WATER RESOURCES 114PAKISTAN COUNCIL FOR SCIENTIFIC AND INDUSTRIAL RESEARCH 115CLIMATE CHANGE, ALTERNATE ENERGY AND WATER RESOURCES RESEARCH INSTITUTE ISLAMABAD 115DRAINAGE AND RECLAMATION INSTITUTE OF PAKISTAN 116ARID ZONE RESEARCH INSTITUTE 116RECENT INITIATIVES FOR WATER QUALITY IN SINDH 117WATER TESTING LABORATORIES IN DISTRICTS 117SCIENCE AND TECHNOLOGICAL RESEARCH DIVISION 117STRATEGY 118
SANITATION 119
URBAN AND RURAL SANITATION 119SEWERAGE AND DRAINAGE ISSUES 128WASTEWATER 130STORM WATER DRAINAGE 134RECENT INITIATIVES FOR SANITATION IN SINDH 136SINDH CITIES IMPROVEMENT PROJECT 136

9
KARACHI SEWERAGE (S-III) PROJECT 137SAAF SUTHRO SINDH PROGRAMME 138SINDH MUNICIPAL SERVICES DELIVERY PROGRAMME 138MUNICIPAL SERVICES PROGRAMME, JACOBABAD 139OTHER INITIATIVES 139UN MATERNAL AND CHILD STUNTING REDUCTION PROGRAMME 139RURAL SANITATION SCALE-UP STRATEGY 140ORANGI PILOT PROJECT 141STRATEGY 142
SOLID WASTE 146KARACHI CITY SOLID WASTE 147HOSPITAL WASTE 148SLAUGHTER WASTE 150OVERVIEW OF SOLID WASTE MANAGEMENT PRACTICES 152RECENT INITIATIVES FOR SOLID WASTE IN SINDH 153SINDH CITIES IMPROVEMENT PROJECT 153SINDH SOLID WASTE MANAGEMENT 154STRATEGY 156
HEALTH, HYGIENE AND NUTRITION 159
CHILD MORTALITY 159DIARRHOEA 162ECONOMIC IMPACTS OF DIARRHOEA 167HYGIENE 169NUTRITION AND DIARRHOEA 170HEALTH, NUTRITION AND HYGIENE 171RECENT INITIATIVES FOR HEALTH IN SINDH 174DISTRICT HEALTH INFORMATION SYSTEM 174MULTI-SECTOR NUTRITION SUPPORT PROGRAMME 175SINDH ACCELERATED ACTION PLAN FOR REDUCTION OF STUNTING AND MALNUTRITION – SEHATMAND SINDH 176NUTRITION SENSITIVE CONDITIONAL CASH TRANSFERS FOR THE POOR IN SINDH 177SINDH HEALTH SECTOR STRATEGY 2012-2020 177STRATEGY 179
EDUCATION 181
NATIONAL SANITATION POLICY 2006 181SINDH EDUCATION SECTOR PLAN 2014 - 2018 181SINDH TEACHER EDUCATION 183SINDH TEACHER EDUCATION DEVELOPMENT AUTHORITY 183PROVINCIAL INSTITUTE OF TEACHER EDUCATION 183SINDH CURRICULUM IMPLEMENTATION FRAMEWORK 184MISSING FACILITIES 185HEALTH AND HYGIENE EDUCATION 198MENSTRUAL HYGIENE MANAGEMENT 199SINDH WASH IN SCHOOLS (WINS) STRATEGIC PLAN 2017-2022 201STRATEGY 202
SECTOR EFFICIENCY AND CAPACITY 204
SERVICE EFFICIENCY 204SPECIFIC RECOMMENDATIONS OF THE REFORM LED INVESTMENT PLAN OF KW&SB 214SOCIAL AUDIT OF LOCAL GOVERNANCE AND DELIVERY OF PUBLIC SERVICES 215

10
DRINKING WATER SUPPLY 215SEWERAGE AND SANITATION 215GARBAGE DISPOSAL 216PUBLIC OPINION ON QUALITY OF GOVERNANCE IN SINDH 217CITIZEN REPORT CARD 217TUBE WELLS IN SINDH 218SECTOR CAPACITY 219MUNICIPAL TRAINING AND RESEARCH INSTITUTE (MTRI) 219SINDH LOCAL GOVERNMENT AND RURAL DEVELOPMENT ACADEMY 219STAFFING CAPACITY FOR SOLID WASTE MANAGEMENT 221STAFFING CAPACITIES IN LOCAL GOVERNMENT AND PUBLIC HEALTH ENGINEERING 221STRATEGY 223
SECTOR FINANCING 225
SECTORAL EXPENDITURE REVIEW 225SECTORAL DEVELOPMENT EXPENDITURE TRENDS 226SECTORAL DEVELOPMENT ALLOCATION AND EXPENDITURE TRENDS 228ESTIMATING COST FOR SECTORAL INVESTMENT 231MEDIUM TERM BUDGETARY FRAMEWORK 231SUSTAINABLE DEVELOPMENT GOALS 231DEVELOPING A COSTING FRAMEWORK 232RESOURCE MOBILISATION 315OWN SOURCE REVENUE (OSR) 315LOCAL REVENUE GENERATION BY CONSUMER ORGANISATIONS 315INNOVATION 315STRENGTHENING LOCAL GOVERNMENT 315SUB-NATIONAL GOVERNANCE PROGRAMME 316USAID AND NUTRITION SUPPORT INITIATIVE 316WORLD BANK DROUGHT EMERGENCY PROGRAMME 316SMALL DAMS AND WATER RESERVOIRS 316SUSTAINABLE DEVELOPMENT GOAL FOR WATER AND SANITATION 316CLIMATE CHANGE 316ACHIEVING EQUITY AND UNIVERSAL COVERAGE 316SANITATION MARKETING 317STRATEGY 318
SECTOR COORDINATION AND IMPLEMENTATION ARRANGEMENTS 320
COORDINATION 320IMPROVING SECTOR COORDINATION 321IMPLEMENTATION MECHANISM 323IMPLEMENTATION ARRANGEMENTS 323FOUNDATION 323FEATURES OF THE IMPLEMENTATION FRAMEWORK 324INTEGRATION 324INTEGRATING STRUCTURE 324IMPLEMENTATION MATRIX 325HARMONISATION 326ALIGNMENT 326PARTNERSHIP 327NEED IDENTIFICATION AND SCHEME DESIGN 328DESIGN CELL 328MULTI-SECTORAL NUTRITION STEERING COMMITTEE 329DEPARTMENTAL TECHNICAL COMMITTEES 329
11
STRATEGIC WASH TECHNICAL WORKING GROUP 329SECTOR COORDINATION AND MONITORING UNIT (SCMU) 329DISTRICT WASH COMMITTEES 330DISTRICT COORDINATION AND MONITORING UNIT 330RURAL WATER SUPPLY SCHEMES 331STRATEGY 333
SECTOR MONITORING 334
MONITORING AND EVALUATION 334PAKISTAN POVERTY REDUCTION STRATEGY PAPER PROGRESS REPORT (PRSP) 334PAKISTAN SOCIAL AND LIVING STANDARDS MEASUREMENT SURVEY (PSLM) 335MULTIPLE INDICATOR CLUSTER SURVEY (MICS) BALOCHISTAN 335PAKISTAN DEMOGRAPHIC AND HEALTH SURVEY (PDHS) 335JOINT MONITORING PROGRAMME (JMP) OF WHO AND UNICEF 335DISABILITY 337GLOBAL ANALYSIS AND ASSESSMENT OF SANITATION AND DRINKING-WATER (GLAAS) 338PAKISTAN WATER OPERATORS NETWORK 338SCHOOL EDUCATION MANAGEMENT INFORMATION SYSTEM (SEMIS) 339ANNUAL STATE OF EDUCATION REPORT (ASER) 339PAKISTAN COUNCIL OF RESEARCH IN WATER RESOURCES (PCRWR) 339PUBLIC HEALTH ENGINEERING WATER TESTING LABORATORIES 339MONITORING AND EVALUATION CELL - PLANNING AND DEVELOPMENT DEPARTMENT 339SURVEYS AND EVALUATIONS BY STATE AND NON STATE ACTORS 340COLLATION, SYNTHESIS AND DISSEMINATION 340MONITORING AND REPORTING INFORMATION SYSTEMS 341PERFORMANCE MEASUREMENT FRAMEWORK 343STRATEGY 355
CONSOLIDATED SECTOR DEVELOPMENT PLAN 356
VISION AND STRATEGIC PRIORITIES 356STRATEGIC OBJECTIVES/OUTCOMES AND ACTIONS 359LEGISLATIONS, REGULATIONS, POLICIES AND STRATEGIES 359WATER RESOURCES 361WATER SUPPLY 363WATER QUALITY 366SANITATION (SEWERAGE AND DRAINAGE) 367SOLID WASTE 371HEALTH, HYGIENE AND NUTRITION 374EDUCATION 376SECTOR EFFICIENCY AND CAPACITY 378SECTOR FINANCING 380SECTOR COORDINATION 382SECTOR MONITORING 383IMPLEMENTATION PLAN 384PLAN OF ACTIVITIES 412ACRONYMS 473OPERATIONAL DEFINITIONS 478ANNEX 1 – BOTTLENECK ANALYSIS – SAFELY MANAGED WATER RESOURCES 483ANNEX 2 – BOTTLENECK ANALYSIS – SAFELY MANAGED SANITATION SERVICES 486ANNEX 3 – BOTTLENECK ANALYSIS – INSTITUTIONAL WASH 489ANNEX 4 – ACCESS TO IMPROVED WATER BY QUINTILES 492ANNEX 5 – ACCESS TO PIPED WATER BY QUINTILES 493ANNEX 6 – WATER QUALITY AND SDG TARGET FOR WATER 494

12
ANNEX 7 – ACCESS TO IMPROVED SANITATION BY QUINTILES 495ANNEX 8 – NO TOILET (OPEN DEFECATION) BY QUINTILES 496ANNEX 9 – HAND WASHING AND SDG TARGET FOR SANITATION 497ANNEX 10 – ZONES OF IRRIGATION DEVELOPMENT 498ANNEX 11 – ZONES OF SALINITY AND WATER LOGGING 499ANNEX 12 – PROPOSED WATER RESERVOIRS FOR KARACHI 500ANNEX 13 – PROPOSED SEWAGE TREATMENT PLANTS IN KARACHI 501ANNEX 14 – PROPOSED GARBAGE TRANSFER STATIONS FOR KARACHI 502ANNEX 15 – STAKEHOLDER ANALYSIS 503STAKEHOLDER INTERVIEWS 503PAKISTAN COUNCIL FOR RESEARCH IN WATER RESOURCES 503SINDH ENVIRONMENTAL PROTECTION AGENCY 504SINDH PLANNING AND DEVELOPMENT AND SPECIAL INITIATIVES DEPARTMENT 505PUBLIC HEALTH ENGINEERING AND RURAL DEVELOPMENT DEPARTMENT 505DIRECTORATE OF URBAN POLICY AND STRATEGIC PLANNING 506EDUCATION DEPARTMENT – REFORM SUPPORT UNIT 507KARACHI WATER SUPPLY AND SEWERAGE BOARD 507SINDH SOLID WASTE MANAGEMENT BOARD 508NORTH SINDH URBAN SERVICES CORPORATION 509CANTONMENT BOARD MALIR 510HYDERABAD WATER AND SANITATION AGENCY 510NED ENGINEERING UNIVERSITY OF ENGINEERING AND TECHNOLOGY 511MEHRAN UNIVERSITY OF ENGINEERING TECHNOLOGY 512NATIONAL RURAL SUPPORT PROGRAMME 513SINDH RURAL SUPPORT ORGANISATION 514RESEARCH AND DEVELOPMENT FOUNDATION 515HANDS 515WATERAID PAKISTAN 516PLAN PAKISTAN 517ASIAN DEVELOPMENT BANK 518FOCUS GROUP DISCUSSIONS 519WATER 519SEWERAGE/DRAINAGE 519TOILETS 519SOLID WASTE MANAGEMENT 520HAND WASHING 520GOVERNANCE 520NGOS INITIATIVES 520NATIONAL LADY HEALTH WORKERS PROGRAMME 520SCHOOL WASH 521

13
LIST OF FIGURES
Figure 1 - District map of Sindh 27Figure 2 - Main supply of drinking water trends 2007-08 to 2013-14 in Sindh 40Figure 3 - Sanitation trends 2007-08 to 2013-14 in Sindh 42Figure 4 - Water availability (cubic metres) and population growth 76Figure 5 - Climate Change Vulnerability Index 2015 78Figure 6 - Decadal temperature projections of selected centres 79Figure 7 - Decadal precipitation projections for selected centres 80Figure 8 - Monthly Rainfall Shift 81Figure 9 - Projected climate 2020-2030 82Figure 10 - Sindh Irrigation System 84Figure 11 - Sources of urban water supply in Sindh (PSLM 2014-15) 88Figure 12 - District wise distribution of improved drinking water source in urban areas (PSLM 2014-15) 89Figure 13 - Overall source of improved water supply by division (MICS 2014) 90Figure 14 - Overall source of improved water supply by district (MICS 2014) 91Figure 15 - Sources of rural water supply in Sindh (PSLM 2014-15) 92Figure 16 - District wise distribution of improved drinking water source in rural areas (PSLM 2014-14) 93Figure 17 - Status of improved water supply and water treatment (MICS 2014) 94Figure 18 - Percentage households without drinking water on premises (MICS 2014) 95Figure 19 - Existing Water Supply Network for Karachi 97Figure 20 - Location of surveyed water supply schemes 99Figure 21 - Water Supply Schemes by construction period 101Figure 22 - Quality of Drinking Water at Source 110Figure 23 - Quality of Drinking Water at Consumer's end 111Figure 24 - Mode of urban sanitation in Sindh (PSLM 2014-15) 119Figure 25 - District wise distribution of mode of sanitation in urban areas (PSLM 2014-15) 120Figure 26 - Mode of rural sanitation in Sindh (PSLM 2014-15) 121Figure 27 - District wise distribution of mode of sanitation in rural areas (PSLM 2014-15) 122Figure 28 - District profile of improved sanitation and place for hand washing 123Figure 29 - Equity profile of water and sanitation 124Figure 30 - Overall status of improved sanitation (MICS 2014) 125Figure 31 - Overall status of unimproved sanitation (MICS 2014) 126Figure 32 - Percentage household population using improved sanitation that is not shared (MICS 2014) 127Figure 33 - Type of Sanitation system used in Sindh 128Figure 34 - Location of Wastewater Treatment Plants in Karachi 132Figure 35 - Karachi Natural Nullahs and Drains 133Figure 36 - Storm Water Drainage System Karachi 134Figure 37 - Status of Garbage Collection in Sindh 146Figure 38 - Existing Landfill Sites in Karachi 147Figure 39 - Livestock slaughtered in Sindh 2011-12 150Figure 40 - Number of recognised slaughterhouses by district 2011-12 151Figure 41 - Decadal trends of Infant and Under 5 Mortality Rates in Sindh 159Figure 42 - Child mortality rates and improved sanitation 161Figure 43 - Childhood mortality rates and improved drinking water 162Figure 44 – Diarrhoea in last 30 days in children under 5 years 163Figure 45 - No Toilet and Diarrhoea in last 30 days in children under 5 years 164Figure 46 – Improved Water Supply and Economic Quintiles 165Figure 47 - Improved Sanitation and Quintiles 166Figure 48 – No Toilet and Economic Quintiles 167Figure 49 - Nutritional status and improved sanitation 171Figure 50 - Top five diseases seen as outpatients in Sindh in 2015 174Figure 51 – Improved water availability in schools in Sindh 186Figure 52 - Improved sanitation in schools in Sindh 187Figure 53 - Availability of drinking water in urban schools in Sindh 188

14
Figure 54 - Availability of drinking water in rural schools in Sindh 189Figure 55 - Availability of student latrines in urban schools in Sindh 190Figure 56 - Availability of student latrines in rural schools in Sindh 191Figure 57 - Status of school facilities in government primary schools 192Figure 58 - Status of school facilities in government middle and secondary schools 193Figure 59 - Primary schools with drinking water by tehsil 194Figure 60 - Middle and secondary schools with drinking water by tehsil 195Figure 61 - Primary schools with student latrines by tehsil 196Figure 62 - Middle and secondary schools with student latrines by tehsil 197Figure 63 - Decadal Per Capita Sectoral Trends 204Figure 64 - Per Capita Sectoral Spend Trends 2014-15 205Figure 65 - Provincial trends of source of drinking water supply 206Figure 66 - Distance to source of drinking water supply by province 206Figure 67 - Distance to source of drinking water supply in Sindh 207Figure 68 - Who installed water supply 207Figure 69 - Type of toilet used by province 208Figure 70 - Type of sanitation system used by province 208Figure 71 - Type of overall garbage collection system from household by province 209Figure 72 - Type of urban garbage collection system from household by province 209Figure 73 - Tube wells in Sindh 218Figure 74 - Current, Development and Total Pro-Poor Expenditure in Water and Sanitation 225Figure 75 - Sectoral expenditure as percentage of total pro-poor expenditure 226Figure 76 - Sectoral expenditure trends 227Figure 77 - Proportionate allocation and spend by department 229Figure 78 - Sub-sector allocation and percentage of sectoral allocation 230Figure 79 - Sector investment scenario at current rates and with 8% inflation (safely managed water supply and
sanitation) 313Figure 80 – Sub-sector investment at current rates (safely managed water supply and sanitation) 313Figure 81 - Sector investment scenario at current rates and with 8% inflation (improved water supply and
sanitation) 314Figure 82 – Sub-sector investment at current rates (improved water supply and sanitation) 314Figure 83 – Implementation Mechanism 328Figure 84 - Organogram for DCMU 330Figure 85 - Top 10 countries with the highest numbers of people (in millions) practicing open defecation 336Figure 86 - Disparities in rural improved sanitation coverage 337Figure 87 - Access to improved drinking water sources and sanitation facilities – disability perspectives 338Figure 88 - Existing monitoring and reporting systems 341

15
LIST OF TABLES
Table 1 - Use of Drinking Water Sources 25Table 2 - Use of Sanitation Facilities 26Table 3 - Multi-dimensional poverty in Pakistan - incidence, depth and severity 31Table 4 - Non-income multi-dimensional poverty incidence 32Table 5 - Household economic situation by quintiles 33Table 6 - Growing population in cities 34Table 7 - Additional Processes and Institutions affecting Water and Sanitation 52Table 8 - Summary of legislation and regulations relating to solid waste management 67Table 9 - Major problems with the water supply and sanitation system in Karachi 98Table 10 - Overall status of water quality (MICS 2014) 113Table 11 - Status of Sewerage System in Karachi 131Table 12 - Overview of solid waste management in selected secondary cities 152Table 13 - Nutritional status of children under five years in Sindh 170Table 14 - Comparison of service efficiency in water and sanitation agencies 210Table 15 - Status of efficiency of service 211Table 16 - Staffing Capacity for solid waste management in selected secondary cities 221Table 17 - Comparative structure in Local Government and Public Health Engineering 222Table 18 - Sectoral development allocation and expenditure 228Table 19 - Proportionate sectoral allocation by department 229Table 20 – Detailed sub-sectoral financial analysis of sectoral financing in ADP 2015-16 235Table 21 - Detailed costing for safely managed overall drinking water supply by district 241Table 22 - Detailed costing for safely managed urban drinking water supply by district 245Table 23 - Detailed costing for safely managed rural drinking water supply by district 247Table 24 - Detailed costing of safely managed overall sewerage and drainage system by district 249Table 25 - Detailed costing of safely managed urban sewerage and drainage system by district 253Table 26 - Detailed costing of safely managed rural sewerage and drainage system by district 255Table 27 - Detailed costing for improved overall drinking water supply by district 257Table 28 - Detailed costing for improved urban drinking water supply by district 261Table 29 - Detailed costing for safely managed rural drinking water supply by district 263Table 30 - Detailed costing of improved overall sanitation system by district 265Table 31 - Detailed costing of improved urban sanitation system by district 269Table 32 - Detailed costing of improved rural sanitation system by district 271Table 33 - Missing facilities (drinking water) in public sector primary schools 273Table 34 - Missing facilities (latrines) in public sector primary schools 275Table 35 - Missing facilities (drinking water) in public sector middle and secondary schools 277Table 36 - Missing facilities (latrines) in public sector middle and secondary schools 279Table 37 - Missing facilities (water and sanitation) at Basic Health Units 281Table 38 - Indirect Cost Legislation and Policies 283Table 39 - Indirect Costs Water Resources 285Table 40 - Indirect Costs Water Supply 286Table 41 - Indirect Costs Water Quality 287Table 42 - Indirect Costs Sanitation 288Table 43 - Indirect Costs Solid Waste 289Table 44 - Indirect Costs Health and Hygiene 290Table 45 - Indirect Costs Education 292Table 46 - Indirect Costs Sector Efficiency and Capacity 293Table 47 - Indirect Costs Sector Financing 294Table 48 - Indirect Costs Sector Coordination 295Table 49 - Indirect Costs Sector Monitoring 296Table 50 - District notional estimates (safely managed water supply and sanitation) 298Table 51 - District notional estimates (improved water supply and sanitation) 304Table 52 - Summary Indirect Costs 310Table 53 - Investment Overview of Sector Plan in Billion Rupees (safely managed water supply and sanitation) 311

16
Table 54 - Investment Overview of Sector Plan in Billion Rupees (improved water supply and sanitation) 312Table 55 - Comparative WASH indicators in PSLM, PDHS and MICS 346Table 56 - Proposed KW&SB, H-WASA and NSUSC Monitoring Indicators 351Table 57 - Proposed Monitoring Indicators for District Municipal Services 353

17
EXECUTIVE SUMMARY
Introduction
The periodic South Asia Conference on Sanitation (SACOSAN) and biennial meeting of Sanitationand Water for All has repeatedly identified sanitation issues in Pakistan, especially for ruralcommunities. Country participation at high-level meetings on Sanitation and Water for All in April2014 reiterated the government’s commitment to the preparation of provincial sector plans forwater and sanitation. The recent MICS 2014 indicators for WASH in Sindh have highlighted theurgency for improving WASH systems. Further, the worrisome state of nutritional deficiencydemands an accelerated plan to improve WASH as poor sanitation and contaminated drinkingwater are important causative factors of poor nutrition and child morbidity and mortality. TheLG&HTPD and PHE&RDD in collaboration with P&DD, Education and Health provided strategicguidance and facilitation for the development of a WASH Sector Development Plan 2016-2026with support of UNICEF and technical consultants.
Demographics
Sindh is a densely populated and most urbanised province of Pakistan accounting for 24% of thecountry's total population. The population of Sindh increased from 41.248 million in 2010, to45.998 million in 2015, and is expected to reach 70 million or more by 20501. About 52.5% of thepopulation is male and 47.5% is female. Similar proportions are found in all divisions. The trend ofurbanisation and a growing population will continue to increase demands for sector and sub-sector services.
Policies and Institutions
Sindh has a draft Drinking Water Policy 2016, draft Municipal Water Act 2012 and draft SanitationPolicy 2016. The National Sanitation Policy 2006 and National Drinking Water Policy 2009 guidedthe development of these provincial policies. The Water Sanitation and Hygiene (WASH) sector isoverseen by a number of departments, including Local Government and Housing Town PlanningDepartment (LG&HTPD), Public Health Engineering and Rural Development Department(PHE&RDD), General Services, Health, and Education for WASH in schools. These provincialdepartments are now working through an integrated approach to envision and design commonimplementation plans that are owned by multiple departments and supported by all majorsupport organisations working in the sector. Several national and international partnerscollaborate with the Government and include UNICEF, WSP, WaterAid, Plan International, RSPN,etc.
Strategic ActionsFinalise the Sindh Municipal Water Act; approve drinking water and sanitation policies; formulatea legal framework and operationalise the Sindh Water Commission to govern municipal water inaddition to implementing the Local Government Act 2013.
1 Bloom, David, Zeba A. Sathar, and Maqsood Sadiq. “Prospects for Economic Growth in Sindh under Alternative DemographicScenarios: The Case for a Rapid Fertility Decline,” Policy Brief. Islamabad, Pakistan: Population Council, Evidence Project. 2015.

18
Water Resources
Pakistan is considered to be a water-stressed country (rapidly moving to water-deficit) and manyof its regions are categorised as arid. Pakistan lies in an arid and semi-arid climate zone. Most ofSindh receives less than 140 millimetres of rainfall a year. (By contrast, among nations of similararea, Nigeria receives more than 1,500 millimetres, Venezuela more than 900, Turkey nearly 700.)Per capita water availability has declined rapidly since 1951 and is currently only 1050 cubicmetres/capita, which puts Pakistan in the category of a high water-stress country2.
Strategic ActionsImprove water resource utilisation through efficient project design and execution; strengthenmunicipal capacities in climate change adaptation, mitigation and resilience; develop district levelpreparedness for water safety and disaster risk reduction; develop and enhance rainwaterharvesting interventions in areas with ample precipitation.
Drinking Water
Overall, 90.5% of household members use an improved3 source of drinking water, while 12.8% ofhousehold members in households using unimproved drinking water use an appropriate watertreatment method. About 90% of urban and 91% of rural household members use an improveddrinking water source. Piped water into dwelling is found mostly in Karachi division (65.0%),followed by Hyderabad (20.0%) and Mirpur Khas (15.1%) divisions. The rest of Sindh indicates ahigh use of water from a protected well with highest rates found in Larkana division (86.3%) andSukkur division (77.3%). The results of Sindh MICS 2014 indicate that other than Karachi districtsthat attain about 20%-30% water treatment, all other districts rate less than 20% for watertreatment, even though a large proportion of districts are using improved water for drinking.About 25.5% of the proportion of households in Sindh do not have drinking water on premises.Tharparkar has the highest percentage of households without drinking water on premises (89.7%).
Strategic ActionsEnhance coverage of Improved and safely managed water supply to meet access gap; rehabilitateand maintain dysfunctional and non-functional schemes; upgrade water supply schemes in towns;enhance community awareness about water use, safety, maintenance and preservation in alldistricts through an effective BCC strategy.
Water Quality
The Sindh MICS 2014 found that 3.0% of household members in Sindh drink water contaminatedabove WHO standards for arsenic, 5.5% for Nitrate, 4.5% for Fluoride, 2.9% for Iron, 8.9% for hardwater and 23.6% for TDS. Further, 38.8% of household members drink water contaminated with
2 State of the Environment Report (draft) 2005. Government of Pakistan, Ministry of Environment3 Improved sources of drinking water are those using any of the following types of supply: piped water (into dwelling, compound,yard or plot, to neighbor, public tap/standpipe), tube well/borehole, protected well, protected spring, and rainwater collection.Bottled water is considered as an improved water source only if the household is using an improved water source for hand washingand cooking.
19
E.coli, while 66.0% drink water contaminated with coliforms. This indicates a serious water qualityissue in Sindh.
Strategic ActionsConduct quarterly water quality testing at water source and distribution network; establish districtlevel water quality testing laboratories; enhance community awareness about water quality(including adoption of treatment of safe drinking water in the household) enhanced in all districtsthrough an effective BCC strategy.
Sanitation
According to Sindh MICS 2014, on average 54.9% use improved sanitation, while 56.1% have aplace for hand washing. There is a general awareness about the need for a place for handwashingsince many districts that have low rates for improved sanitation have higher rates for a place forhandwashing. About 90.0% of urban, 22.1% of rural and 97.9% of households in Karachi divisionuse flush/pour flush latrines connected to piped sewer system. About 39.9% of householdpopulation in rural areas practice open defecation, which is highest in Mirpur Khas division at49.2%. The percentage of household population using improved sanitation that is not shared ishighest in Karachi (98.0%) and least in Tando Muhammad Khan (17.7%).
Strategic ActionsEnhance improved and safely managed sanitation services coverage to reduce access gap in urbanareas and rural areas, especially in those that are also nutrition-sensitive; establish wastewatertreatment plants established in towns; increase proportion of treated industrial wastewater;ensure improved and systematic management of Operation and Maintenance of sewerage anddrainage systems; enhance community awareness and social mobilisation regarding sanitation,nutrition and hygiene in all UCs through effective implementation of BCC strategy; and promotesafe sanitation practices in high open defecation zones, nutrition-sensitive and polio priority areas.
Solid Waste
A study4 estimated that the Solid Waste Generation Rate (kg/C/Day) for Karachi was 0.613kg/C/Day, while for Hyderabad, it was 0.563 kg/C/Day. Using the current estimated population ofKarachi of 24 million5, at least 14,712 tons per day or 5.37 million tons per year. Using an arbitrarymean Solid Waste Generation Rate of 0.330 kg/C/Day (average of urban and rural rates), the totalsolid waste generated per day in Sindh for a population of 44.807 million is about 14,786 tons perday, and about 5.397 million tons per year. Clearly, most of the solid waste is generated in Karachi.Only 31% of Sindh has proper disposal of waste solids (collected by any municipal institution,disposed of by solid waste management department or a private company vehicle collected fromhome). This ranges from 56% in urban to 4% in rural areas6.
4 (Draft) Guideline for Solid Waste Management June 2005. Pakistan Environment Protection Agency5 http://worldpopulationreview.com/world-cities/karachi-population/ accessed on 27 April 20166 Pakistan Social and Living Standards Measurement Survey, 2013-14
20
Strategic ActionsImplement integrated solid waste management implemented in districts; improve solid wastecollection and disposal; improve the efficiency of solid waste disposal and recycling; enhance safehospital high risk waste disposal; and enforce safe and hygienic Slaughterhouses.
Health, Hygiene and Nutrition
The Infant Mortality Rate (IMR) and Under 5 Mortality Rate (U5MR) remain high in Sindh. TheSindh MICS 2014 found an IMR of 82 per 1000 live births and U5MR of 104 per 1000 live births.Sindh MICS 2014 found that the lowest quintile is the most vulnerable to health risks and has theleast access to improved drinking water and improved sanitation. Further, high prevalence rates ofno toilet are found in the poorer quintiles compared to the richer ones. The issue of no toilet isfound predominantly in the rural compared to urban areas. Recent data from Sindh MICS 2014shows that more than four out of ten children under the age of five years in Sindh areunderweight (42%) and 17% are classified as severely underweight. Almost half of children underfive years (48%) are stunted or short for their age and one fourth (24%) children are severelystunted. Evidence from Sindh MICS 2014 indicates that nutritional deficiency rates show anincreasing trend when use of improved sanitation decreases further suggesting that low use ofimproved sanitation is a risk factor for poor nutrition status
Strategic ActionsImprove and make fully functional water and sanitation services in health facilities; implementHospital Waste Management Rules; implement multi-sector nutrition-sensitive WASHprogrammes in nutritionally deficient districts; integrate nutrition-sensitive WASH in healthpromotion in primary health care; and integrate nutrition-sensitive WASH in health advocacy andBCC campaigns and health weeks.
Education
Sindh Education Management Information System (SEMIS) found that 45% of schools had no toiletfacilities and 53% had no drinking water facility; both presenting particular barriers for girls. TheSindh Education Sector Plan identified lack of basic facilities (e.g. proper classrooms, washrooms,drinking water, security, etc.), especially in rural areas as one of the top seven key issues in theprovision of primary and elementary education. Of 46,039 educational institutions, only 22,724(just under 50%) have water facilities and 24,937 (just under 55%) have latrines. Presently, there isno module on WASH in either pre-service or in-service teacher training programmes. There is needfor a curriculum review to incorporate a separate section/module on nutrition-sensitive WASH. Astudy7 conducted at the national level showed WASH facilities in schools are not supportive tomenstrual hygiene management (MHM); majority of the girls rely on mothers and sisters for MHMrelated information; and little information is provided or discussed at school level. At present,there is no menstrual hygiene education for girls in middle and high schools in Sindh.
Strategic ActionsIntegrate nutrition-sensitive WASH in teacher training programme; integrate nutrition-sensitiveWASH in schools’ curriculum; integrate menstrual hygiene management in health and hygiene for
7 Menstrual Hygiene Management for Adolescent School Girls in KP and PAK, Pakistan, May 2013, UNICEF Pakistan

21
girls; and ensure 100% of schools with missing facilities have safely managed drinking water andlatrines.
Sector Efficiency and Capacity
Over the last decade, the per capita total sectoral expenditure has increased marginally from PKR149 in 2005-06 to PKR 164 in 2014-15, but when considered in the context of inflation, it isnegligible. Further, the per capita sectoral development spend has actually decreased from PKR137 in 2005-06 to PKR 117. This indicates diminishing prioritisation of public spending in thesector. On average, the proportion of per capita development spend to overall per capita sectoralspend between 2010-2015 is just under three-fourths (73%). The service efficiency of differentwater and sanitation agencies shows that KW&SB underperforms in most of the indicators onlysecond to WASA Quetta. It has low billing and collection ratios, a high staffing ratio, and no fee fornew sewerage connection. NSUSC has the lowest average unit production cost and staffing ratio. Acomparison of the basic structure in Local Government and Public Health Engineering indicatesthat the technical capacity for water supply and sewerage and drainage lies in public healthengineering, while administrative capacity lies with Local Government. This presents a majorchallenge to Local Government for providing O&M services as per current regulations. Thisanomaly needs to be corrected so that both installation and O&M of water supply and sewerageand drainage schemes rest with Public Health Engineering, while solid waste management andgeneral sanitation services rest solely with Local Government.
Strategic ActionsReduce systems leakages of Non Revenue Water and Unaccounted for Water; increase householdwater metering; improve and enhance efficient Billing and Collection; undertake systematicHuman Resource Development for the sub-sectors; and develop capacities of CBOs and civilsociety for integrated water supply, sanitation, hygiene and solid waste management.
Sector Financing
On analysis of sectoral expenditure trends, current expenditure as a percentage of total sectoralexpenditure has increased from 20.0% in 2010-11 to 28.9% in 2014-15. Conversely, developmentexpenditure as a percentage of total sectoral expenditure has decreased from 80.0% in 2010-11 to71.1% in 2014-15. The year on year change in development expenditure from the preceding yearhas vacillated from a -9.5% decrease in 2011-12, a 7.5% increase in 2012-13, followed by a -20.0%decrease in 2013-14, and then a 13.6% increase in 2014-15. These figures suggest that while therehas been an overall increase in sectoral funding for water and sanitation, overall investment in thesector in relation to total pro-poor development spending has actually reduced. Further, there isdiminishing prioritisation of investment in the sector compared to other sectors.
Strategic ActionsStratify sectoral budgeting and expenditure reporting separately for each sub-sector(environment, water supply, sewerage and drainage); increase Own Source Revenue (OSR) in sub-sectors by Town Councils; increase regulated private sector participation in sub-sectors; andincrease development expenditure allocation to and spending by sub-sectors.

22
Sector Coordination
Presently, there are two ways of managing the water supply schemes in Sindh. Generally, in urbanareas, LG&HTPD manages the schemes through its staff but has poor revenue collection from theusers or community based organisations (CBOs). Whereas in rural areas, the schemes are designedand executed by PHE&RDD, but on completion require to be handed over to LG&HTPD orentrusted to the local CBOs that includes operation and maintenance of the schemes. PHE&RDDdoes not have sufficient community mobilisation capacity, and requires additional capacitydevelopment support followed by policy reforms for appropriate well-defined community sharingand mobilisation mechanisms, and for O&M. The function of sanitation falls under the purview ofLG&HTPD, which is also involved in implementing the large drainage and sanitation schemes. It isalso involved in street payment and road construction in the villages. LG&HTPD has just initiatedthe Saaf Suthro Sindh programme through in which it shall implement the Pakistan Approaches toTotal Sanitation (PATS) in selected districts in association with local community organisations incollaboration with national and international partners. There is lack of clarity about the roles andresponsibilities among the stakeholders that has emerged as a result of SLGA 2014 and 18th
Constitutional Amendment.
Strategic ActionsStreamline and enhance provincial level coordination and programme management for WASH bybroadening the scope of the Multi-Sectoral Nutrition Steering Committee to encompass WASH,establish a Sector Coordination and Monitoring Unit in the Nutrition Unit, notify District WASHCommittees, and establish a District Coordination and Monitoring Unit for WASH under the DCOffice.
Sector Monitoring
Monitoring and reporting activities in the sector and sub-sector take place at various levels but arefragmented. Furthermore, there are challenges of coordination for monitoring and reporting dueto complexities in the roles and responsibilities of different stakeholders in the government,cantonment boards and defence housing authorities, non-government and private sectors.Monitoring and reporting activities in the sector and sub-sector take place at various levels but arefragmented. Furthermore, there are challenges of coordination for monitoring and reporting dueto complexities in the roles and responsibilities of different stakeholders in the government,cantonment boards and defence housing authorities, non-government and private sectors. Thereis no mechanism to collate and synthesise this information and disseminate to policy,management and operational level stakeholders. There is also no systematic approach for themonitoring and evaluation of sanitation projects.
Strategic ActionsDevelop monitoring and reporting mechanisms for water and sanitation schemes; improve andestablish the infrastructure for monitoring and reporting for water supply and sewerage anddrainage schemes; and enhance the monitoring and reporting capacity for water and sanitation.

23
PREAMBLE
Water and sanitation have been and are a priority for the Government of Sindh particularlybecause of the arid and hot climate and brackish ground water.
In recent times, several key steps have been taken by the Government of Sindh. These include thefollowing:
Sindh Water Management (Amendment) Act 2005 – this Act is derived from and replaces theSindh Water Management Ordinance, 2002, which established the Sindh Irrigation andDrainage Authority (SIDA) and repealed the Sindh Irrigation and Drainage Authority Act, 1997and the Sindh Irrigation Water Users’ Association Ordinance, 1982
Sindh Municipal Water Act (Draft) 2012 – this draft Act has proposed the establishment of aregulatory authority called the Sindh Municipal Water Commission. Upon establishment of theCommission, the responsibility for regulating the conservation, protection, utilisation,exploitation, development of water resources and the regulation of all municipal waterservices, including quality assurance of water, water services and tariff shall vest with theCommission
Sindh Environmental Protection Act 2013 – that lays special emphasis on management ofwater resources
Sindh Local Government Act 2013 – through which municipal functions include laying andmaintaining intra-city network of water supply and sanitation; conservancy; garbage, sewer orstorm water, solid or liquid waste, drainage, public toilets etc
Sindh Solid Waste Management Board Act 2014 – this Act led to establishment of a Boardcalled as the Sindh Solid Waste Management Board for the collection and disposal of solid andother waste in the Province of Sindh
Development of a draft Sindh Policy for Drinking Water, revision of the Sindh Sanitation Policy,and a draft strategy for Behavioural Change Communication (BCC) in 2015-16
Other important events have also been taking place at the same time.
At the regional level, the periodic South Asia Conference on Sanitation (SACOSAN) has highlightedsanitation issues in Pakistan, especially for rural communities. These forums have given impetus tothe formulation of national and provincial drinking water and sanitation policies and strategies,and the development of Pakistan Approaches to Total Sanitation (PATS).
The National Water Quality Monitoring Programme8 (NWQMP) initiated by the Pakistan Council ofResearch in Water Resources (PCRWR) found that of the bacterial contamination level (2002‐2006) was in the range of 73%‐100% for Hyderabad, 61%‐100% for Karachi and 67%‐83% forSukkur.
8 National Water Quality Monitoring Programme, Water Quality Status in Pakistan, Phase I-V, 2001-2006, Pakistan Council ofResearch in Water Resources

24
The Water Sanitation Programme (WSP), supported by the World Bank, helped establish thePakistan Water Operators Network 9 (P-WON), produced its first directory and facilitateddevelopment of a monitoring and reporting system for the network.
Sindh was severely affected by the massive floods in 2010-11 and this event alerted attention tothe vulnerability of water supply and sanitation system to climatic events. Urgent interventions byUN Agencies, international and national non-government organisations in water and sanitationadopted the Pakistan Approach to Total Sanitation (PATS), as they launched a massive programmeon rural sanitation that would reach 7 million people in the country affected by floods.
In 2012, a national sector review report10 on water, sanitation and hygiene was produced thatemphasised the need for provinces to develop sector plans, approach the sector holistically in asector wide approach, conduct sector capacity development needs assessment, and strengthenprovincial monitoring frameworks for the sub-sectors.
Pakistan submitted its first GLAAS report 11 in 2012 that helped stakeholders to identifyinformation gaps in the sector, human resource capacity status and encouraging trends ofprovincial governments for gradually increasing allocations to the sector.
In 2012, two other national reports were produced that looked at urban water supply andsanitation12, and rural water supply and sanitation13. The reports reinforced issues regardingefficiency and called for better coordination, improved sector financing and establishing aregulatory body.
Pakistan participated at the fifth SACOSAN meeting in Nepal in 2013 where it reiterated previouscommitments and identified research in water and sanitation as one of its emerging priorities14.
In 2014, national consultations were held by the Ministry of Planning, Development and Reformsand the Pakistan Water Partnership15 to discuss the post-2015 development agenda on water andsanitation, having recognised that Pakistan was off-track to meet its international obligations onsanitation and access to safe drinking water was still an issue due to poor quality. The consultationmade special emphasis on the need to improve by (15%) the sustainable use and development ofwater resources in Pakistan and reduce untreated wastewater by (2.5%), nutrient pollution by(5%) and increase wastewater reuse by (7%). The report highlighted the need to ‘Reduce, Recycleand Reuse’ wastewater to the extent possible.
9 http://pwon.org.pk/ accessed on 31st March 201510 Investing Wisely - Sanitation and Water - Saving Lives. Pakistan Sector Status Report 2012, Government of Pakistan11 UN-Water global annual assessment of sanitation and drinking-water (GLAAS) 2012 report: the challenge of extending andsustaining services. WHO 201212 Pakistan Water Supply and Sanitation Sector, Volume I. Urban Water Supply and Sanitation, 2012. The World Bank13 Pakistan Water Supply and Sanitation Sector, Volume II. Rural Water Supply and Sanitation, 2012. The World Bank14 Pakistan Sanitation Country Paper SACOSAN-V 2013. Government of Pakistan15 UN Process Towards a Post-2015 Development Agenda. Report on Pakistan National Consultations February 2014. Global WaterPartnership, 2014

25
An extensive international consultation was facilitated by the UN for goals and targets for thepost-2015 agenda, which resulted in formulation of Sustainable Development Goals16.
The status of water and sanitation in Pakistan when compared with other regional countriesindicates that while Pakistan has made good progress with regards to provision of water, it lagsbehind with respect to improved sanitation (Tables 1 and 2).
Pakistan has a commitment for Millennium Development Goals (MDGs)17, and specifically MDGGoal 7 that aims to promote sustainable development with a focus on sustainable access to safedrinking water and basic sanitation. Pakistan is on track regarding improving access to safedrinking water (919% against the target of 93%) and it is off track on access to sanitation (64%against the target of 90%). The province of Sindh is lagging slightly behind both the target ofimproved ‘source’ of water with 90.5% coverage against the target of 93%, and on access toimproved sanitation with an achievement of 64.6% against the target of 90%18.
Table 1 - Use of Drinking Water Sources
Country Improved (%) Unimproved (%)
TotalImproved
Piped onPremises
OthersImproved
OtherUnimproved
SurfaceWater
Afghanistan 55 12 43 39 6Bangladesh 87 12 75 13 0India 94 28 66 5 1Nepal 92 24 68 6 2Pakistan 91 39 52 7 2Sri Lanka 96 34 62 4 0
(Source: JMP Report 2015)
16 https://sustainabledevelopment.un.org/sdgsproposal accessed on 31st March 201517 Pakistan Millennium Development Goals Report 2013. Planning Commission, Government of Pakistan18 Multiple Indicator Cluster Survey 2014. Government of Sindh and UNICEF

26
Table 2 - Use of Sanitation Facilities
Country Improved (%) Shared (%) Unimproved (%) OpenDefecation (%)
Afghanistan 32 12 43 13Bangladesh 61 28 10 1India 40 10 6 44Nepal 46 18 4 32Pakistan 64 9 14 13Sri Lanka 95 4 1 0
(Source: JMP Report 2015)
In pursuance of the goals of the Government of Sindh to provide safe and improved drinking waterand improved sanitation to its population, and the recommendations ensuing from the variousdocuments, reports, conferences and technical consultations, the Local Government and HousingTown Planning Department (LG&HTPD) in collaboration with the Planning and DevelopmentDepartment (P&DD), the Public Health Engineering and Rural Development Department (PHED),facilitated by UNICEF, sought to develop a sector development plan for Water, Sanitation andHygiene (WASH) for the province of Sindh.
The process was initiated with a visioneering exercise held under the auspices of the LG&HTPD,where senior government officials from P&DD, PHE&RDD, Irrigation, School Education, and Healthparticipated together with UNICEF and consultants who facilitated the process. This inceptivemeeting provided a strategic direction to guide and steer the process of developing a sector plan.
A wide stakeholder consultation was undertaken to determine emerging priorities, develop aninsight into strategy, and synthesise common themes that would guide formulation of a sectorplan.
This 10-years WASH sector development plan incorporates resource mapping, sector analysis,prioritisation and proposed strategic actions. It also includes an institutional framework, plan ofaction for sectors and sub sectors, investment and sector financing, coordination and partnershipmechanism, resource mobilisation plan, and an M&E framework.

27
INTRODUCTION
Source: FAO. (In this map, the new district of Sujawal is shown within Thatta District)
Figure 1 - District map of Sindh
The province of Sindh (Fig 1) in Pakistan is the most urbanised of the four provinces in the country.The province has a land area of 140,915 sq. km and comprises of almost 16% of the country‘s landarea. The province is located in the south-east of Pakistan. Sindh province is bounded by the Thardesert to its east, the Kirthar mountains in the west, and the Arabian Sea to the south. The IndusRiver runs through its centre across a fertile plain. The climate is mainly tropical to sub-tropicaland Sindh is divided into three climatic regions - Siro (the upper region, centred on Jacobabad),Wicholo (the middle region, centred on Hyderabad), and Lar (the lower region, centred onKarachi).
Sindh receives an average annual rainfall of about seven inches, falling mainly during July andAugust. The southwest monsoon wind begins in mid-February and continues until the end ofSeptember, whereas the cool northerly wind blows during the winter months from October toJanuary.
28
The population is mainly comprised of Sindhis, Sindhis of Pashtun origin, Sindhis of Balochi origin,Urdu-speaking Mohajirs and their descendants, Punjabis and Pashtuns.
Administratively, the province is divided into Districts, Sub-districts (Talukas) and Union Councils.The districts are further grouped into seven divisions. The administrative units in the province areas follows:
Division DistrictsKarachi Karachi Central, Karachi East, Karachi South, Karachi West, Korangi,
MalirBanbhore Badin, Thatta, SujawalHyderabad Dadu, Hyderabad, Jamshoro, Matiari, Tando Allah Yar, Tando
Muhammad KhanSukkur Ghotki, Khairpur, SukkurLarkana Jacobabad, Kashmore, Larkana, Qambar Shahdadkot, ShikarpurMirpur Khas Mirpur Khas, Sanghar, Tharparkar, UmerkotShaheed Benazir Abad Naushahro Feroze, Shaheed Benazir Abad
29 Districts 119 Towns 1297 Union Councils
Furthermore, the province has the following educational and health institutions19:
Education (2009-10):o 45,044 primary schoolso 2,668 middle schoolso 1,893 secondary schoolso 225 Intermediate and Degree Colleges
Health (2012):o 6 Teaching Hospitalso 82 Civil, Major Specialised and Taluka Hospitalso 108 Rural Health Centreso 308 Basic Health Units (BHUs)o 520 Dispensarieso 40 Mother and Child Health Centres and 186 Tuberculosis Clinics
19 Development Statistics of Sindh 2013. Sindh Bureau of Statistics, Government of Sindh

29
Population
The population of the province is estimated to be 44.807 million people20 (about 318 persons persq. km) in 2012 and constitutes about 24% of the population of Pakistan. About 49.5% of thepopulation is urban and 50.5% is rural. According to the 1998 population census, the male tofemale population ratio is about 1.12:1, with a growth rate of 2.80%. Nearly 53.26% of Sindh’spopulation is under 20 years, and about 70.90% is under 30 years21. This indicates that Sindh has alarge youth dividend and is expected to dominate the population for another 30-35 years.
Health
Health indicators in Pakistan have shown relative improvements in the context of South Asia, butremain far from satisfactory. Pakistan ranks 147th in the Human Development Index (HDI)22, with anational HDI of 0.538 (Sindh’s HDI was reported as 0.507 in 2006-07 when the national HDI was0.56123), a Maternal Mortality Rate of 21424, Infant Mortality Rate of 82, Under 5 Mortality Rate of104, 42.0% children under five years with moderate and severe underweight, 48.0% childrenunder five years with moderate and severe stunting, 15.4% children under five years withmoderate and severe wasting, and skilled birth attendance at 65.7%25.
Public sector current expenditure for health in Sindh has grown from PKR 18.549 billion in 2010-11, PKR 30.587 billion in 2011-12, PKR 32.366 billion in 2012-13, PKR 35.514 billion in 2013-14, toPKR 40.107 billion in 2014-15. However, development expenditure on health grew from PKR 4.388billion in 2010-11, PKR 6.267 billion in 2011-12, PKR 11.143 billion in 2012-13, PKR 11.115 billion in2013-14, and PKR 11.031 billion in 2014-1526 . Between 2012 to 2015, the developmentexpenditure has averaged at PKR 11 billion per year with no significant change year on year duringthis period.
Education
Sindh has an overall literacy rate of 56% in 10+ years population, with 67% in males and 43% infemales, 37% in rural and 72% in urban areas. In rural areas, 53% of males were literate ascompared to 21% in females27. In rural Sindh28, about 37% of children aged 3-5 years are enrolledin pre-primary education, while 73% children aged 6-16 years are enrolled in school (82% in
20 Development Statistics of Sindh 2013. Sindh Bureau of Statistics, Government of Sindh21 Development Statistics of Sindh 2013. Sindh Bureau of Statistics, Government of Sindh22 Human Development Report 2015. UNDP23 http://unpo.org/article/10253 accessed on 21 May 201624 Sathar, Zeba A., Maqsood Sadiq, and Seemin Ashfaq. “Reducing maternal and child mortality in Sindh: The untapped potential offamily planning,” Policy Brief. Islamabad, Pakistan: Population Council, Evidence Project 2015.25 Multiple Indicator Cluster Survey (MICS) Sindh 2014. Government of Sindh26 Annual PRSP Budgetary Expenditures for FY 2010-11, FY 2011-12, FY 2012-13, FY 2013-14, and FY 2014-15 (Provisional). Ministryof Finance, Government of Pakistan27 Pakistan Social and Living Standards Measurement Survey 2013-14. Pakistan Bureau of Statistics28 Sindh (Rural) Education Scorecard. ASER 2014

30
government schools and 18% in non-state schools). Of the 27% aged 6-16 years who are out ofschool, 52% are girls.
Overall29, the situation in Sindh is worrisome, with a net enrolment rate of 48% of children aged 5-9 years (excluding Katchi class) at the primary level, with 61% in urban and 39% in rural Sindh.Overall, 7% of children aged 10-18 years old left school before completing primary level.
Currently, in children aged 6-16 years, 5.9% in urban Sindh30 and 25.7% in rural Sindh31 are out ofschool. About 19.4% of children aged 6-16 years in rural Sindh have never attended school, while6.3% drop out of school32.
According to the ASER 2015 Report (Sindh Rural)33, 59.0% of primary, 68.8% of elementary and80.0% of high schools had useable water in government schools. Further, only 46.2% of primary,81.2% of elementary and 70.0% of high schools had useable toilet in government schools.
Poverty
During the period of 2000s to 2013-14, the annual unemployment rate has ranged from 6.8 millionto 6.0 million and stabilising at about 3.6 million unemployed labour force34, while per capitaincome growth has fallen from 7% to under 0.5%35.
Although Pakistan has made significant progress in human development and poverty reductionover the past three decades, it is considered relatively slow over a long horizon. Social andeconomic exclusion has resulted in multiple deprivations for more than 50% of Pakistan’spopulation. This situation has only been worsened by the recent deluge of floods in 2010, 2011and 2013. Inflation reduced from a high 17.03% in FY 2008-09 to 4.81% in FY 2014-1536.
Multi-dimensional Poverty
It is now established that poverty is not determined by a single factor, but is the result of severalfactors. Poverty indicators are considered under a broad theme known as multi-dimensionalpoverty.
Multi-dimensional poverty in Pakistan (Table 3) has been estimated by using four main dimensions(income, education, health, housing and services) and eleven sub-dimensions (income –unidimension, years of education, read and write, immunisation, purity of water, pre-natal
29 Pakistan Social and Living Standards Measurement Survey 2013-14. Pakistan Bureau of Statistics30 Annual Status of Education Report – Pakistan 201431 Annual Status of Education Report – Pakistan National Report (Rural) 201532 Annual Status of Education Report – Pakistan National Report (Rural) 201533 Annual Status of Education Report – Pakistan National Report (Rural) 201534 Economic Survey of Pakistan 2014-15. Ministry of Finance, Government of Pakistan35 Analytical Review of the PSDP portfolio, Planning Commission, Government of Pakistan, 201136 Economic Survey of Pakistan 2014-15. Ministry of Finance, Government of Pakistan

31
consultation, occupancy status, electricity connection, gas connection, telephone connection,toilet)37.
Table 3 - Multi-dimensional poverty in Pakistan - incidence, depth and severity
Group % IncidenceM0
Contribution%
% DepthM1
Contribution%
% SeverityM2
Contribution%
Punjab 35.56 22.67 17.42 22.74 8.54 22.82
Urban 25.62 22.30 12.61 22.34 6.20 22.37
Rural 42.38 23.22 20.77 23.33 10.18 23.44
Sindh 38.40 24.48 18.85 24.61 9.26 24.75
Urban 25.50 22.19 12.55 22.24 6.17 22.26
Rural 47.29 25.91 23.17 26.02 11.35 26.13
KhyberPakhtunkhwa
38.39 24.48 18.66 24.36 9.07 24.24
Urban 29.73 25.87 14.60 25.87 7.17 25.87
Rural 42.54 23.30 20.63 23.17 10.01 23.05
Balochistan 44.49 28.37 21.67 28.29 10.55 28.19
Urban 34.05 29.63 16.68 29.55 8.18 29.51
Rural 50.33 27.57 24.46 27.47 11.89 27.38
Pakistan 38.31 100.00 18.73 100.00 9.16 100.00
Urban 27.64 100.00 13.57 100.00 6.66 100.00
Rural 44.80 100.00 21.86 100.00 10.67 100.00
(Source: Khan A et al. Mapping and Measuring of Multidimensional Poverty in Pakistan: Empirical Investigations, 2011)
On assessment of poverty with non-income deprivation indicators (Table 4), it was found that57.30% of the population was in a state of multi-dimension poverty38. In the case of Sindh, it was47.63% overall, and 26.66% for urban and 67.44% for rural.
37 Khan A et al. Mapping and Measuring of Multidimensional Poverty in Pakistan: Empirical Investigations, 201138 Jamal H. Assessing Poverty with Non-Income Deprivation Indicators: Pakistan, 2008-09. The Pakistan Development Review 50:4Part II (Winter 2011) pp.913–927

32
Table 4 - Non-income multi-dimensional poverty incidence
Area % Overall M0 % Urban M0 % Rural M0
Pakistan 57.30 25.68 53.35Punjab 36.93 22.42 43.58Sindh 47.63 26.66 67.44Khyber Pakhtunkhwa 56.10 36.53 60.00Balochistan 78.53 44.83 88.61
(Source: Jamal H. Assessing Poverty with Non-Income Deprivation Indicators: Pakistan, 2008-09. The Pakistan Development Review50:4 Part II (Winter 2011) pp.913–927)
Table 5 summarises key results from the recent Household Integrated Economic Survey 2010-1139,in which the sample population was divided into five quintiles. The 1st quintile corresponds to thepoorest 20% of the population, while the 5th quintile corresponds to the most affluent 20% of thepopulation. There is over three times difference in average monthly income between the 1st and5th quintiles. In the case of Sindh, it shows that the households in the 1st to 4th quintiles are in astate of deficit for the end of month household budgetary position.
A recent study40 by Sustainable Development Policy Institute has revealed the following in Sindh:
After Balochistan, Sindh has the second highest incidence of poverty where 33% of householdsare living in poverty, with 46% in rural and 20% in urban areas
Poor households in Sindh, on average, experience deprivation in 51% of the weighteddimensions
After Balochistan, Sindh has the second highest Multi-dimensional Poverty Index (MPI) scoreof 0.17; MPI for rural Sindh is 0.25 which is two and half times higher than for urban Sindh(0.1)
21% of households in Sindh are severely poor (34% rural and 8% urban)
39 Household Integrated Economic Survey 2010-11. Pakistan Bureau of Statistics40 Arif Naveed and Nazim Ali. Clustered Deprivation: District Profile of Poverty in Pakistan, 2012. Sustainable Development PolicyInstitute

33
Table 5 - Household economic situation by quintiles
QuintilesTotal 1st 2nd 3rd 4th 5th
Percentage Households 100 15.86 17.63 19.07 21.52 25.92Average Monthly Income per
Household in Rupees21785 11386 14274 16841 20784 37728
Members perHousehold
Pakistan 6.38 8.05 7.24 6.70 5.93 4.92Balochistan 7.08 8.09 7.65 7.19 6.55 5.64
KhyberPakhtunkhwa
7.17 9.33 8.08 7.42 6.50 5.09
Punjab 6.16 7.66 6.89 6.39 5.69 5.05Sindh 6.39 8.43 7.43 6.90 6.13 4.50
End of MonthHouseholdBudgetaryPosition in
Rupees Deficit(-) Surplus (+)
Pakistan 1955.9 258.52 435.89 661.67 1444.70 5405.07Balochistan 752.88 -100.24 169.45 1103.05 884.79 1855.53
KhyberPakhtunkhwa
1357.67 544.16 563.48 992.99 482.73 4130.98
Punjab 3060.07 825.89 804.42 1292.04 2253.15 7610.56Sindh -266.70 -1376.44 -455.46 -1155.09 -40.39 883.08
AverageMonthly Per
CapitaExpenditureHousing and
Rent in Rupees(includes
water andconservancy
charges)
Pakistan 421.96 121.6 186.71 259.95 381.28 1160.41Balochistan 274.81 136.3 183.89 247.38 340.48 647.61
KhyberPakhtunkhwa
273.34 90.9 139.35 192.94 299.32 826.88
Punjab 405.39 122.54 192.29 262.18 370.88 994.6Sindh 582.09 134.56 208.53 300.18 466.68 1815.87
(Source: Computation from Household Integrated Economic Survey 2010-11)
Urbanisation
Pakistan is one of the fastest urbanising countries in South Asia and the share of urban populationis increasing significantly. The population in rural areas decreased from 61.4% in 2014 to 60.8% in2015, whereas the population in urban areas increased from 38.5% in 2014 to 39.2% in 201541. InPakistan, the rural population is moving towards the cities due to reduction in the workopportunities in agriculture sector because of modern technology used in the sector and to searchbetter work openings especially in informal sector in cities. For these reasons, small and mediumsized cities of Pakistan are growing at a higher rate.
With an increasing population, Pakistan is the fifth most populous country in the world and secondlargest in South Asia. Pakistan’s urbanisation is expected to reach over 50% by 2025. However,actual urbanisation is probably much higher since the definitions used in Pakistan areadministrative rather than density based. By employing an amended definition, estimates ofactual urbanisation at present place 50% in cities.
41 Economic Survey of Pakistan 2014-15. Ministry of Finance, Government of Pakistan
34
While increasing urbanisation is considered useful for economic growth in Pakistan, where citiesproduce up to 80% of GDP, rising urban poverty, quantitative shortage, inequitable coverage andpoor quality of service delivery lead to further degradation of the urban environment. Three of thetop fifteen cities with populations of more than 1 million in 2030 are located in Sindh (Table 6).
While underground sewerage systems have been developed and do exist in the urban areas, ahigh proportion of the sewers are open drains (24%)42. These carry untreated effluent and poseserious health and environmental hazards.
Table 6 - Growing population in cities
City with more than 1 millionpopulation
Population 2030 (‘000)
Karachi 27,993
Lahore 14,626
Faisalabad 6,192
Rawalpindi 4,149
Multan 3,025
Hyderabad 3,005
Gujranwala 3,143
Peshawar 2,778
Islamabad 3,175
Quetta 2,038
Sargodha 1,074
Bahawalpur 1,903
Sialkot 1,087
Larkana 1,174
Sheikhupura 1,019
(Source: Pakistan: Framework for Economic Growth, 2011. Planning Commission, Government of Pakistan)
Solid Waste Management (SWM) is one of the rapidly growing challenges facing both urban andrural areas of Sindh. Recent estimates suggest that there is no garbage collection system in about44% of urban areas and 97% of rural areas in Sindh43. Municipal services only provide coverage ofgarbage collection to about a third (33%) of households in urban areas and to18% in rural areas.
An area of rising concern is the inadequate and unsafe disposal of hospital waste. The commonfinding is either of no hospital waste management system or where it does exit, incinerationtechnology is the main mode, which has its own hazards since it produces ash and emits acidic andtoxic gases. Other methods practiced include being disposed off by municipal landfills and burning
42 Pakistan Social and Living Standards Measurement Survey 2013-14. Pakistan Bureau of Statistics43 Pakistan Social and Living Standards Measurement Survey 2013-14. Pakistan Bureau of Statistics

35
waste in open air without any specific treatment44. There is need for introducing non-burningtechnologies for safe hospital waste disposal.
44 Shahida Rasheed, Saira Iqbal, Lubna A. Baig, Kehkashan Mufti. Hospital Waste Management in the Teaching Hospitals of Karachi.JPMA 55:192;2005
36
POLICY SHIFT FROM MDGS TO SDGSMember states decided on a single SDG goal for water and sanitation, that looks at the entirewater cycle from the resource, to services, and back to the resource.
Goal 6: Ensure availability and sustainable management of water and sanitation for all
The decision of member states is informed by the fact that all aspects of water touch on humandevelopment, and none should be looked at in complete isolation. The six key components of thisgoal include:
Drinking Water Sanitation and Hygiene Water Quality Water-use Efficiency Water Resource Management Eco-Systems
Two sub-components include ‘international cooperation and capacity development’, and ‘localparticipation’.
The indicator for SDG target 6.1 is ‘Proportion of population using safely managed drinking waterservices’. This represents a higher service threshold and a new ‘rung’ at the top of the drinkingwater service ladder used by JMP during the MDGs. The ladder aims to capture progressiveimprovements from no service at all (surface water) and use of unimproved water sources (noprotection against contamination), to using an improved water source (helps protect againstcontamination) which was the old MDG standard. If you have an improved facility close to home(within 30 minutes) this is now classed as a basic level of service (accessibility, quality, quantity)but the SDGs aim higher. In order to be classed as safely managed the improved facility shouldfirstly be located on premises (accessibility), secondly water should be available when needed(available), and thirdly it should be free from contamination (quality).
The indicator for SDG target 6.2 is ‘Proportion of population using safely managed sanitationservices including a handwashing facility with soap and water’. This represents a higher servicethreshold and a new ‘rung’ at the top of the sanitation ladder used by Joint MonitoringProgramme during the MDGs.
The purpose of the ladder is to capture progressive improvements from no service at all (opendefecation) and use of unimproved latrines (fixed point defecation), to using a basic sanitationfacility (which safely separates excreta from human contact). This was the old MDG standard andit is important to distinguish between facilities which are private and those which are shared withother households. In order to meet the new SDG standard, one not only needs to use an improvedfacility which is not shared with other households (now classed as basic) but the faecal wastesproduced should either be safely disposed on site, or transported and treated offsite. This reflectsa consensus that needs to address management of faecal wastes along the entire sanitation chain.

37
Last but not least, the proposed global SDG indicator combines use of safely managed sanitationservices and the presence of handwashing facilities with soap and water. This means that there isneed to monitor handwashing much more systematically in future.
This is summarised in the matrices below.

38
The key differences between the MDGs and SDGs are presented in the matrix below.
Aspect MDGs SDGsTargets MDG target (1990 – 2015)
Halve the proportion of peoplewithout sustainable access to safedrinking water and basicsanitation
SDG targets (2016 – 2030)Achieve universal and equitableaccess to safe and affordabledrinking water for allAchieve access to adequate andequitable sanitation and hygienefor all and end open defecationpaying special attention to theneeds of women and girls andthose in vulnerable situations
Indicators MDG target indicators Proportion of population
using an improved drinkingwater source
Proportion of populationusing an improved sanitationfacility
SDG targets indicators Percentage of the population
using safely manageddrinking water services
Percentage of the populationusing safely managedsanitation services, includinga hand-washing facility withwater and soap
Definitions MDG target indictors - definitions
Water supply: householdstaking their drinking waterfrom a household connection(piped water), a publicstandpipe, a borehole, aprotected dug well, aprotected spring, rain watercollection.
Limitations: water safety andsustainability not reflected
Sanitation: households usingtoilets connected to a publicsewer or a septic tank, usinga pour-flush toilet, a pitlatrine, a ventilated improvedpit latrine. Householdssharing an improved toiletNOT included.
Limitations: open disposal ofsewage, pit content notreflected
SDG target indicators –definitions
o Water Supply: Populationusing an improved drinkingwater source which is:o Accessible: located on
premiseso Available: available when
neededo Safe: free of faecal and
priority chemicalcontamination
o Sanitation: Population usingan improved sanitationfacility (including ahandwashing facility withwater and soap) that is:o not shared with other
householdso excreta are safely
disposed in situ ortransported and treatedoff-site
The Sindh WASH Sector Development Plan is designed to be SDG compliant and aims to meet SDGtargets, while recognising that some aspects like quality, safely managed, on-premises, not sharedetc. may take some time to be achieved.

39
SECTOR OVERVIEW
Demographics
Sindh is a densely populated and most urbanised province of Pakistan accounting for 24% of thecountry's total population. The population of Sindh increased from 41.248 million in 2010, to45.998 million in 2015, and is expected to reach 70 million or more by 205045. The populationgrowth rate in 1998 was 2.80%, and the highest was for Karachi district with 3.56%46. Between1981 and 1998, the population of Karachi district almost doubled from 5.437 million to 9.856million. Karachi City district alone had an estimated population of 16.459 million in 2012. Thelargest districts after Karachi district with a population over 1.5 million in 2012 are Larkana,Ghotki, Khairpur, Shaheed Benazirabad (previously Nawabshah), Dadu, Hyderabad, Badin, Thattaand Sanghar, while all the rest are under 1.5 million with Tando Mohammad Khan being thesmallest district with 0.6 million. About 52.5% of the population is male and 47.5% is female.Similar proportions are found in all divisions. The trend of urbanisation and a growing populationwill continue to increase demands for sector and sub-sector services.
Institutions
At provincial level, the four main departments/agencies responsible for water and sanitation areLocal Government and Town Planning Department (LG&TPD), Public Health Engineering and RuralDevelopment (PHE&RDD), Karachi Water and Sewerage Board (KW&SB) and Hyderabad Waterand Sanitation Authority (H-WASA). Generally, water supply schemes in urban areas aredeveloped and maintained by the LG&TPD, while schemes for rural areas are developed byPHE&RDD and then handed over to the communities. Further, KW&SB is responsible forproduction, transmission and distribution of potable water to the citizens of Karachi, while theNorthern Sindh Urban Services Corporation (NSUSC) develops and maintains water supplyschemes for seven cities (Khairpur Mirs, Sukkur, New Sukkur, Rohri, Larkana, Shikarpur andJacobabad). The Water and Sanitation Authority (WASA) Hyderabad has the responsibility toprovide water to the urban localities of Hyderabad. Coordination mechanisms between thedepartments/agencies need to be improved owing to the inter-dependence between the servicesrequired. Several national and international partners collaborate with the Government andinclude UNICEF, Sindh Rural Support Programme (SRSP), WSP, Plan International, etc.
With regards to governance of water and sanitation, the institutional structure is as follows:
At the provincial level – Local Government and Housing Town Planning Department(LG&HTPD), Public Health Engineering and Rural Development Department (PHE&RDD),Karachi Water and Sewerage Board (KW&SB); Karachi Development Authority; KarachiMetropolitan Corporation; Northern Sindh Urban Services Corporation (NSUSC); Hyderabad
45 Bloom, David, Zeba A. Sathar, and Maqsood Sadiq. “Prospects for Economic Growth in Sindh under Alternative DemographicScenarios: The Case for a Rapid Fertility Decline,” Policy Brief. Islamabad, Pakistan: Population Council, Evidence Project. 2015.46 Sindh Development Statistics 2013. Sindh Bureau of Statistics, Government of Sindh

40
Water and Sanitation Authority (H-WASA); Community Development Programme (CDP);Special Initiatives by Planning and Development Department (P&DD)
Local governments – Metropolitan Corporation; District Councils; Municipal Corporation;Municipal Committees and Union Administration are responsible
Rural Water Supply Schemes – planned, designed and executed by PHE&RDD, while operationand maintenance (O&M) is the responsibility of LG&HTPD and Community Based Organisations(CBOs)
Drinking Water
Figure 2 - Main supply of drinking water trends 2007-08 to 2013-14 in Sindh
(Source: Pakistan Social and Living Standards Measurement Surveys 2007-08, 2010-11, 2011-12, 2012-13 and 2013-14)
Overall in Sindh, 42% of households are using tap water as the main supply of drinking water in2013-14 as compared to 43% in 2010-11, followed by hand pump47 with 37% in 2013-14 ascompared to 34% in 2010-11 and motor pump with 8% in 2013-14 as compared to 12% in 2010-1148. The proportion of households using tap water as a main supply of drinking water is higher inurban areas, 73% as compared to only 8% in rural areas. Fig 2 illustrates that there is an increasing
47 “Other” includes public standpipe (supplied by tanker), water seller, canal, river, spring, stream, pond, mineral water, FiltrationPlant and other48 Pakistan Social and Living Standards Measurement survey 2012-2013 and 2013-14. Pakistan Bureau of Statistics, Government ofPakistan
41
trend of ‘others’ in urban areas and hand pump being used as a main supply of drinking water inrural areas.
While comparing districts, 73% of households in Hyderabad and 86% in Karachi districts use tapwater as the main supply of drinking water, followed by Jamshoro with 38%, Mirpur Khas with35% and Sukkur with 33%. On the other hand, Dadu, Matiari, Tando Allah Yar, Tando MohammadKhan, Jacobabad, Kashmore, Larkana, Shikarpur, Tharparkar, Khairpur and Nawabshah (ShaheedBenazirabad) have 10% or less of tap water.
The main supply of drinking water in rural areas is hand pump in 69%, followed ‘others’ by in 9%.
The Multiple Indicator Cluster Survey 2014 in Sindh49 reveals that overall 90.5% of householdmembers use an improved source of drinking water50. About 3.0% of household members usedrinking water with over 10 ppb Arsenic concentration.
Both surveys do not address the issue of quality of drinking water, which is an area of criticalconcern.
Of those households that use an unimproved source of drinking water supply (9.5%), only 12.8%household members use an appropriate water treatment method.
Sanitation
In Sindh51, about 65% households have flush toilet, with 98% in urban and 29% in rural areas.About 23% of households have non-flush toilet facilities, while 12% of households reported notoilet. In rural areas, 24% households reported having no toilet compared to 1% in urban areas.
With regards to districts, Tharparkar had the highest proportion of households with no toilet(47%), followed by Umer Kot with 35%, Badin with 32% and Thatta with 24%.
Figure 3 illustrates a rising trend of use of flush toilet in both overall and rural areas, although itseems very gradual in urban areas. Furthermore, there has been a 20% reduction in ‘No toilet’category in rural areas and 20% reduction overall in Sindh in the last five years.
49 Multiple Indicator Cluster Survey (MICS) Sindh 2014. Government of Sindh50 Includes piped water (into dwelling, compound, yard or plot, to neighbor, public tap/standpipe), tube well/borehole, protectedwell, protected spring, and rainwater collection. Bottled water is considered as an improved water source only if the household isusing an improved water source for hand washing and cooking.51 Pakistan Social and Living Standards Measurement survey 2013-2014. Pakistan Bureau of Statistics, Government of Pakistan

42
Figure 3 - Sanitation trends 2007-08 to 2013-14 in Sindh
(Source: Pakistan Social and Living Standards Measurement Surveys 2007-08, 2010-11, 2011-12, 2012-13 and 2013-14)
42
Figure 3 - Sanitation trends 2007-08 to 2013-14 in Sindh
(Source: Pakistan Social and Living Standards Measurement Surveys 2007-08, 2010-11, 2011-12, 2012-13 and 2013-14)
42
Figure 3 - Sanitation trends 2007-08 to 2013-14 in Sindh
(Source: Pakistan Social and Living Standards Measurement Surveys 2007-08, 2010-11, 2011-12, 2012-13 and 2013-14)
43
LEGISLATION AND POLICIES
The key legislations and policies and their salient features that relate to water and sanitation arepresented below.
Pakistan EPA Act, 1997
The Pakistan Environmental Protection Act 1997 was enacted on December 3, 1997. Some of itssalient features are as follows:
Pakistan Environmental Protection Council
Apart from ensuring environmental protection, the council is authorised to:
1. Approve comprehensive national environmental policies and ensure their implementationwithin the framework of a national conservation strategy as may be approved by the FederalGovernment from time to time
2. Provide guidelines for the protection and conservation of species, habitats, and Biodiversity ingeneral, and for the conservation of renewable and non-renewable resources
3. Consider the National Environment Report and give appropriate directions thereon
The Council may, either itself or on the request of any person or organisation, direct the FederalAgency or any Government Agency to prepare, submit, promote or implement projects for theprotection, conservation, rehabilitation and improvement of the environment, the prevention andcontrol of pollution, and the sustainable development of resources, or to undertake research inany specified aspect of environment.
Pakistan Environmental Protection Agency
Among its major activities, the agency is also responsible for:
1. Prepare, in coordination with the appropriate Government Agency and in consultation withthe concerned sectoral Advisory Committees, national environmental policies for approval bythe Council
2. Prepare and publish an annual National Environment Report on the state of the environment3. Prepare or revise, and establish the National Environmental Quality Standards (NEQS) with
approval of the Council4. Ensure enforcement of the National Environmental Quality Standards5. Establishing standards for the quality of the ambient air, water and land, by notification in the
official Gazette, in consultation with the Provincial Agency concerned6. Establish systems and procedures for surveys, surveillance, monitoring, measurement,
examination, investigation, research, inspection and audit to prevent and control pollution,and to estimate the costs of cleaning up pollution and rehabilitating the environment invarious sectors

44
Prohibition of Certain Discharges or Emissions
Subject to the provisions of this Act and the rules and regulations made there under, no personshall discharge or emit or allow the discharge or emission of any effluent or waste or air pollutantor noise in an amount, concentration or level which is in excess of the National EnvironmentalQuality Standards or, where applicable.
No person shall import hazardous waste into Pakistan and its territorial waters, ExclusiveEconomic Zone and historic waters.
Initial Environmental Examination and Environmental Impact Assessment
No proponent of a project shall commence construction or operation unless he has filed with theFederal Agency an initial environmental examination or, where the project is likely to cause anadverse environmental effect, an Environmental Impact Assessment (EIA), and has obtained fromthe Federal Agency approval in respect thereof.
Environmental Protection Order
Where the Federal Agency or a Provincial Agency is satisfied that the discharge or emission of anyeffluent, waste, air pollutant or noise, or the disposal of waste, or the handling of hazardoussubstances, or any other act or omission is likely to occur, or is occurring or has occurred inviolation of the provisions of this Act, rules or regulations or of the conditions of a license, and islikely to cause, or is causing or has caused an adverse environmental effect, the Federal Agency or,as the case may be, the Provincial Agency may, after giving the person responsible for suchdischarge, emission, disposal, handling, act or omission an opportunity of being heard, by orderdirect such person to take such measures that the Federal Agency or Provincial Agency mayconsider necessary within such period as may be specified in the order.
In particular and without prejudice to the generality of the foregoing power, such measures mayinclude:
1. Immediate to stoppage, preventing, lessening or controlling the discharge, emission, disposal,handling, act or omission, or to minimise or remedy the adverse environmental effect
2. Installation, replacement or alteration of any equipment or thing to eliminate or control orabate on a permanent or temporary basis, such discharge, emission, disposal, handling, act orCommission
3. Action to remove or otherwise dispose of the effluent, waste, air pollutant, noise, or hazardoussubstances
4. Action to restore the environment to the condition existing prior to such discharge, disposal,handling, act or omission, or as close to such condition as may be reasonable in thecircumstances, to the satisfaction of the Federal Agency or Provincial Agency
Further sections lay out the penalties applied to the various stakeholders in case of non-compliance with the Act.

45
Sindh Water Management (Amendment) Act, 2005
This Act is derived from and replaces the Sindh Water Management Ordinance, 2002, whichestablished the Sindh Irrigation and Drainage Authority (SIDA) and repealed the Sindh Irrigationand Drainage Authority Act, 1997 and the Sindh Irrigation Water Users’ Association Ordinance,1982. The functions of SIDA shall be to:
Operate and maintain the parts of the irrigation system such as barrages and outlets assignedto it
Operate and maintain the parts of the drainage system assigned to it including spinal drainsand inter-Area Water Board (AWB) drains
Carry out river flood protection and maintain the infrastructure in the Province of Sindh Advise the Government on any matter strategic or tactical, related to its functions and tasks or
to the water management system as a whole e.g. irrigation or drainage contribution rates,drought management and sea water intrusion
Manage the transition process, to promote the formation, growth and development of theAWBs and Farmer organisations (FOs) into self-supporting and financially self-sustainingentities within a period of seven to ten years of their establishment
Perform any other function conferred to it under this Act
Under this Act, the Government may constitute Area Water Boards (AWBs), together with theirrespective territorial jurisdiction, provided that the AWBs existing immediately before thecommencement of this Act shall continue to function until replaced by new AWBs under this Act.
Each AWB shall establish and maintain a Water Allocation Committee (WAC). If the AWB hasbranch canals taking off from the main canal and conveying water to FOs, the AWB shall alsoestablish and maintain WACs at branch level. For the purpose of a smooth interaction with thelocal communities in which the AWBs operate, each AWB may establish a Community AdvisoryCommittee (CAC).
In every local area, a group of non-elected farmers may, for energising the farming community andimproving service delivery, set a Water Course Association (WCA) and undertake voluntary,proactive and self-help initiatives. The WCA shall register with the respective FO.
In every local area, a group of non-elected farmers, who are interested, may undertake voluntary,proactive and self-help initiatives in connection with the drainage system and form a DrainageBeneficiaries’ Group (DBG) and register it with the FO.
The Act also proposes the establishment of a Regulatory Authority of Irrigation, Drainage andFlood Protection. The functions of the Regulatory Authority shall be to ensure compliance with thestatutory provisions laid down in this Act. In addition, the Regulatory Authority shall promoteeffective interaction and collaboration between SIDA, AWBs, FOs and their various support bodiesas well as fair dealing between FOs, WCAs, DBGs and their members. It shall, when invited to doso, arbitrate between them. Until the Regulatory Authority is established, SIDA shall perform thefunctions of the Regulatory Authority under this Act.

46
Sindh Municipal Water Act (Draft), 2012
This states that all water used, or intended to be used for drinking, domestic, recreational,horticultural, industrial or commercial purposes and such other purposes as may be prescribedshall be declared as municipal water. This categorises water into potable domestic for drinking,non-potable domestic, commercial, industrial, amenity, environmental and institutional.
The draft Act has proposed the establishment of a regulatory authority called the Sindh MunicipalWater Commission. Upon establishment of the Commission, the responsibility for regulating theconservation, protection, utilisation, exploitation, development of water resources and theregulation of all municipal water services, including quality assurance of water, water services andtariff shall vest with the Commission.
The Commission shall perform the following functions:
Manage all sources (shall be the custodian) of municipal water, on behalf of the provincialgovernment
Maintaining a comprehensive database of all sources of municipal water maintaining a comprehensive database of all the bulk and retail service providers in the
province Setting and notification of standards of water quality and quality of services delivered for all
municipal purposes Setting and notification of standards and norms for maintaining the quality of water taken
from or discharged into any water body Suggesting and notifying the measures and means for the effective and sustainable use of
water resources for water supply services Prescribing the regulations and methodologies for improving the nature, operation,
sustainability, operational efficiency and economic viability of water services Prescribing the requirements for persons who may install and operate water services works
and provide assistance and coordinate with the water utilities and water users for developingand improving the appropriation, usage and disposal of water
Present an annual report to the Government regarding the overall management andadministration of water, including recommendations on measures to be taken by theGovernment to enhance the quality or quantity of available water
Develop, promote and support training and professional development of officials and otherpersons engaged in provision or regulation of water supply and sanitation services
Carry out research and development, by itself or in collaboration with the specialisedinstitutions of research and higher education, either in the public sector or in the privatesector; aimed at conserving, improving and extending the water sources and water services inthe province
Advise the Government on all policy and planning matters related to municipal water
In prescribing standards, the Commission must consider:
The need for everyone to have a reasonable quality of life The need for equitable access to water services The operational efficiency and economic viability of water services

47
Any norms and standards for applicable tariffs for water services Any other laws or any standards set by other governmental or federal government agencies Any guidelines and standards prescribed under the Punjab Environmental Protection Act Any impact which the municipal water supply services might have on the environment The obligations of the Provincial Government as custodian of water resources
Water ServicesUnder water services, the draft Act further proposes the following:
1. Water and Sanitation Master Plan: Every local government must, within one year after thecommencement of this Act;
(a) As part of the city or regional master plan; or(b) Separately, if no process for city or regional master plan has been initiated, prepare
(i) A draft water & sanitation master plan for its area of jurisdiction: and(ii) A summary of that plan
(c) The contents of the master plan and summary shall be in accordance with the rules(d) The draft plan shall be circulated and approved by the council, after vetting by the Commission(e) The master plan shall be published on the website as well as printed and shall be madeavailable to the consumers at a reasonable cost(f) The summary of the plan shall be printed in sufficient numbers and shall be distributed free ofcost to all the consumers or potential consumers
2. Deviation from the Master Plan: No substantial deviation from the master plan is validunless it is embodied in a new master plan adopted in accordance with the procedure setout in the rules.
3. Reporting on Implementation of Local Government Plans:(1) A local government must report on the implementation of its plans in such manner and form asmay be prescribed during each financial year(2) The report must be:(a) Made within four months after the end of each financial year, and(b) Submitted to the Commission and the Department of Local Government(3) The Local Government must publicise a summary of its report(4) A copy of the report and of its summary must be available at the offices of the localgovernment for inspection upon payment of such fee as may be prescribed
48
Sindh Environmental Protection Act, 2014
Some of the salient features of the Sindh Environmental Protection Act 2014 are as follows:
The Government of Sindh shall, by notification in the official Gazette, establish a Council to beknown as the Sindh Environmental Protection Council, which shall among other provisions,approve the Sindh Environmental Quality Standards, and co-ordinate integration of the principlesand concerns of sustainable development into socio-economic and development policies, plansand programmes at the provincial, district and local levels.
The Government shall by a notification in the official Gazette establish the Sindh EnvironmentalProtection Agency to exercise the powers and perform the functions assigned to it under theprovisions of this Act. The Sindh Environmental Protection Agency shall prepare and publish anAnnual Environment Report on the state of the environment in the province; establish standardsfor the quality of the ambient air, water and land, by notification in the official Gazette inconsultation with the other relevant Government Departments/ Agencies; and revise theEnvironmental Quality Standards with approval of the Council.
Sindh Local Government Act, 2014
The main legislation at present that governs drinking water and sanitation is the Sindh LocalGovernment Act 2014. Some of the main provisions for water and sanitation under this Act arehighlighted below.
Functions to be Performed by the Metropolitan Corporation exclusively
Planning development and maintenance of Inter-district roads, bridges, street lights and stormwater drains.
Functions to be Performed by Corporations, other than Metropolitan CorporationMunicipal Committees and Town Committees
A Corporation, Municipal Committee or Town Committee shall, within the limits of the funds at itsdisposal provide or cause to be provided, a supply of wholesome water sufficient for public andprivate purpose.
Private Source of water supplyAll private sources of water supply within the Local Area concerned shall be subject to control,regulation and inspection by the Corporation, Municipal Committee or Town Committee.
DrainageA Corporation, Municipal Committee or Town Committee shall, within the limits of the funds at itsdisposal provide adequate system of public drains in the Local Area and all such drains shall be

49
constructed, maintained kept cleared and emptied with due regard to the health and convenienceof the public.
A Corporation, Municipal Committee or Town Committee may, and if required by Government,shall, in the prescribed manner, frame and execute a water supply scheme for the constructionand maintenance of such works for the provision, storage and distribution of water as may benecessary.
Where a piped water supply is provided, the Council concerned may supply water to private andpublic premises in such manner and on payment of such charges as the bye-laws may provide.
Private sources of water supply No new well, water-pump or any other sources of water for drinking purposes shall be dug,
constructed, or provided except with the sanction of the Council concerned The Council concerned may by notice require the owner or any person having the control of
any private source of water supply used for drinking-o to keep the same in good order and to clear these from silt, refuse and decaying matter
from time to time;o to protect the same from contamination in such manner as the Council concerned may
direct, ando if the water therein is proved to the satisfaction of the Council concerned to be unfit for
drinking purposes, to take such measures as may be specified in the notice to prevent theuse of such water for drinking purposes.
DrainageEvery owner or occupier of any land or building within the Local Area may, with the previouspermission of the Council concerned and subject to such terms and conditions, including thepayment of fees, as the Council may impose, cause his drains to be emptied into public drains.
All private drains shall be subject to control, regulation and inspection by the Council concernedand the Council may, in such manner as the bye-laws may provide, require the provision,alteration, covering, clearing and closing of private drains.
Drainage SchemesA Corporation, Municipal Committee or Town Committee may, and if so required by Government,shall prepare a drainage scheme in the prescribed manner for the construction of drains at publicand private expenses, and other works for the effective drainage and disposal of sullage.
A drainage scheme prepared under clause (1) shall be submitted for approval to Governmentwhich may approve it, reject it, or approve it subject to such modifications as it may deem fit.
The drainage scheme as approved by Government shall be executed and implemented in suchmanner within such period and by such authority as may be specified by Government.
The Council concerned may, by notice, require the owner of any building or land within the localarea -
o to construct such drains within the building or land or the street adjoining such building orland, as may be specified in the notice;

50
o to remove, alter, or improve any such drains; ando to take such other steps for the effective drainage of the building or land as may be
specified.
Functions of District Councils
To discharge the overall responsibility for the identification of projects and appraisal and approvalof projects prepared and to be constructed by Union Councils in the following sub-section:-
o Primary, Middle and Secondary Schoolso Rural Health Centreso Basic Health Unitso Family Welfare Clinicso Piped Water Supplyo Potable Water Storage Tankso Hand Pumpso Sanitationo Rural Roads
Functions of Union Councils
To act as construction agency for the following sub- sectors:-o Primary, Middle and Secondary Schoolso Rural Health Centreso Family Welfare Clinicso Basic Health Unitso Piped Water Supplyo Potable Water/Storage Tanks/Tube-wells, and Wellso Hand Pumpso Sanitationo Rural Roads
To encourage and to facilitate the formation of associations for collective use and collection ofcharges for services such as electric supply and water course management, co-operative tubewelldevelopment, co-operative for input supplies and output marketing, water-course management,etc.
Provision and maintenance of wells, water pumps, tanks, ponds, and other works for the supply ofwater.
Adoption of measures for preventing the contamination of the sources of water supply fordrinking.
Prohibition of the use of the water of wells, ponds, and other sources of water supply suspected tobe dangerous to Public Health.

51
Regulation or prohibition of the watering of cattle, bathing or washing at or near wells, ponds orother sources of water reserved tor drinking purposes.
Regulation or prohibition of the steeping of hemp jute or other plants in or near ponds or othersources of water supply.
Taxes, Rates, Tolls and Fees to be Levied by Karachi Metropolitan Corporation
Conservancy Tax. Drainage Tax.
Taxes, Rates, Tolls and Fees which may be Levied by Municipal Committees, TownCommittees and Corporations excluding the Metropolitan Corporations
Conservancy Rate. Rate for the execution of any work of Public Utility. Rate for the provision of water works or the supply of water.
Taxes, Rates, Tolls and Fees to be Levied by District Councils and Union Councils
Drainage Rate. Rate for the execution of any works of Public Utility. Conservancy Rate. Rate for the provision of water works or the supply of water.
Sindh Solid Waste Management Board Act, 2014
The Sindh Solid Waste Management Board Act 2014 provides for the establishment of a Boardcalled as the Sindh Solid Waste Management Board for the collection and disposal of solid andother waste in the Province of Sindh.
Some of the salient features and functions of the Board are as follows:
The Board shall have the right over the solid waste related issues, assets, funds and liabilitiesof the Councils and shall possess sole rights on all kinds of solid waste within the limits of allCouncils
The Board shall have the authority to grant permission to individuals, institutions industries,factories, workshops, furnaces, compost making and power generation from the solid waste,for segregation of the recyclable material from the waste, collection, treatment, sale andpurchase, recycling or disposal of any kinds of waste

52
Various legislations, rules and regulations impact on water and sanitation services in the provinceof Sindh. These are summarised in Table 7 below.
Table 7 - Additional Processes and Institutions affecting Water and Sanitation
FRESH WATERSindh Water Management Ordinance 2002(No. XL)
This Ordinance establishes a framework for executing andmanaging schemes for irrigation, drainage and floodmanagement. Water is defined broadly in section 2(r) as“any water standing or flowing on surface [sic] or foundin the soil at any place in the province”.
Sindh Irrigation and Drainage Authority Rules1999
These Rules were framed under the Sindh Irrigation andDrainage Authority Act 1997. Although the 1997 Act hasbeen repealed by the Sindh Water ManagementOrdinance 2002, rules framed under the 1997 Act are notspecifically repealed or saved by the 2002 Ordinance. TheRules specify terms and conditions related to the supplyof water, including the individual share of each canalcommand area, and allow the Authority to determinecharges for water supply as well as “non-water services”provided (sections 8–10). Criteria according to which theaggregate water entitlement of each canal commandarea is determined include an “increased requirement forindustrial, domestic, environmental, or health-relatedwater usage” (section 10(2)).
Coastal Development Authority Act 1994 (No.XXVIII)
This Act establishes an Authority that is responsible forthe development, improvement and beautification of thecoastal areas of Thatta and Badin districts (section 7(1)).The Authority may plan and execute schemes related to anumber of sectors including drinking water (section7(2)(a)).
Port Qasim Authority Act 1973 (No. XLIII) This federal Act establishes an Authority to oversee theplanning, development and management of Port Qasim.The Authority is charged with preparing a master plan forthe port area (section 10), and may call upon governmentagencies and local bodies to prepare and executeschemes in the port area related to matters over whichthese agencies ordinarily hold authority (section 11(2)).Among other activities, such schemes may provide forthe utilisation of water and “other natural resources”(section 11(2)(f)), as well as environmental control andthe prevention of pollution (section 11(2)(j)).
COASTAL AND MARINEKarachi Building and Town PlanningRegulations 2002 Notification No.SO(Land)HTP/KBCA-3-39/2000
These Regulations, issued under the Sindh BuildingsControl Ordinance 1979, provide exhaustive rules andprocedures for construction and development activitiesin the city (section 1-2). They apply to all of Karachiexcept for cantonment areas (section 1-1.3).
URBAN AND RURAL DEVELOPMENTSindh Development Authorities Laws(Amendment) Ordinance 2007
This Ordinance revives the Larkana and Sehwandevelopment authorities.
Sindh Development Authorities Laws (Revival This Ordinance revives the Lyari and Malir development

53
and Amending) Ordinance 2006 authorities.
Badin Development Authority Act 1995 (No.VII)
This Act establishes the Badin Development Authority,which is responsible for public works (section 7),including the supply and distribution of potable water(section 21).
Larkana Development Authority Act 1994 (No.XXI)
This Act establishes the Larkana Development Authority,which maintains public works, conducts research andprovides technical guidance for development activities,and collaborates with federal, provincial or private-sectoragencies engaged in development work (section 9).
Lyari Development Authority Act 1993 (No. Xof 1994 [sic])
This law establishes the Lyari Development Authority,which maintains public works, conducts research andprovides technical guidance for development activities,and collaborates with federal, provincial or private-sectoragencies engaged in development work (section 8).
Malir Development Authority Act 1993 (No. XIof 1994 [sic])
This Act establishes the Malir Development Authority,which is responsible for a wide range of developmentactivities. These include implementing schemes for thedevelopment of urban, rural and industrial areas (section8(1)(viii)), and the provision of “public works” (section8(1)(ix)).
Sehwan Development Authority Act 1993 (No.V of 1994 [sic])
This law establishes the Sehwan Development Authority,which is responsible for development activities in thetaluka of Sehwan, as well as other areas of Dadu district(section 1(2)). The Authority is responsible for the“overall development, improvement and modification” ofareas that lie within its jurisdiction (section 7(i)). Itformulates and enforces “schemes” (section 7(ii)), buildsand operates facilities for water supply, drainage,sewerage and solid waste disposal (section 7(iii)), andperforms “other functions” assigned to it by theprovincial government (section 7(v)). The Authority is alsoresponsible for the production and supply of potablewater to “Government agency” of (section 21).
Sindh Katchi Abadis Act 1987 (No. II) This law establishes an Authority to develop, improve and‘regularise’ squatter settlements, known as katchi abadis.The Authority is responsible for providing “civic amenitiesand civic services” to katchi abadis (section 11(2)(xiii)).This includes preparing schemes for the supply of water,gas and electricity; the construction of roads and streets;and arrangements for waste disposal (section 21).
Sindh Arid Zone Development Authority Act1985 (No. II)
This Act provides for the establishment of an Authority todevelop “arid zones” throughout the province. Such areasare defined in section 2(a) simply as those areas“declared as such” under section 3. The Authority isresponsible for developing “lands” and water resources,as well as roads and public amenities (section 12(2)(iii)).
Sindh Buildings Control Ordinance 1979 (No. V) This law provides for the regulation and control ofconstruction activities, and the establishment of areabuilding control authorities (section 4). Builders andproperty developers cannot operate without a licence(section 9). The building authority also grants licences toarchitects, planners, inspectors and engineers (section 8).The Karachi Building Control Authority (KBCA) wascreated under section 4 of this Ordinance.
Karachi Building and Town PlanningRegulations 2002 Notification No.
These Regulations, issued by the KBCA under section 21-Aof the Sindh Buildings Control Ordinance 1979, provide

54
SO(Land)HTP/KBCA-3-39/2000 exhaustive rules and procedures for construction anddevelopment activities in the city (section 1-2). Theyapply to all of Karachi except for cantonment areas(section 1-1.3).
Hyderabad Development Authority Act 1976(No. XIII)
This Ordinance establishes the Hyderabad DevelopmentAuthority, which is responsible for the “overalldevelopment, improvement and beautification” of urbanareas (section 9(1)(i)) in the now-defunct HyderabadDivision.
Karachi Development Authority Order 1957(No. 5)
This order, which establishes the Karachi DevelopmentAuthority, or KDA (section 3), provides for thedevelopment and improvement of certain areas in thecity. The KDA is responsible for water supply to“constituent bodies” (section 113) as well as individualconsumers (section 114).
(Adapted from Environmental Law in Pakistan Governing Natural Resources and the Processes and Institutions that affect them –Sindh. Part V. IUCN, 2007)
Karachi Water and Sewerage Board Act, 1996
The Karachi Water and Sewerage Board Act 1996 provides for the establishment of a Board forsupply of water and disposal of sewerage in the Karachi Division.
The main functions of the Board include the following:
(i) sanction in the manner and on payment of fees as may be prescribed by regulations:(a) water connection(b) water supply to tankers and(c) sewerage connection
(ii) levy, collect or recover rates, charges of fees for water supply and sewerage service,including arrears thereof(iii) have the power to reduce, suspend or disconnect the water supply in the event ofcontravention of the provisions of this Act or regulations(iv) have the power to impose surcharge, not exceeding double the amount due, if rates,charges or fees for water supply or sewerage service or the arrears thereof are not paid within thetime fixed by the Board(v) have full financial powers within the budget grant(vi) make regulations with the approval of the Government(vii) undertake construction improvement, maintenance and operation of:
(a) water works including wells and recharge facilities for collecting, purifying,pumping, storing and distributing water to all types of consumers.(b) Sewerage works for collecting, pumping, treating and disposing of sewerage andindustrial waste,
(viii) Assess the position of water supply from time to time and regulate water supply.(ix) Review the existing schemes or prepare new schemes relating to water works andsewerage work and undertake execution thereof with the approval of the Government,

55
(x) Regulate, control or inspect water connection, sewer lines and service lines includinginternal fittings.(xi) maintain accounts and records of the Board(xii) prepare and submit to Government schedule of water and sewerage tariff, rates, chargesor fees to be levied by it,(xiii) prepare and revise schedule of posts for the Board and submit it to the Government forapproval,(xiv) produce and supply potable water(xv) place, maintain aqueducts, conduits, sewers etc.
Supply of water and execution of schemes
(1) The Board shall be responsible for bulk production of potable water and its distribution inaccordance with the provisions of this Act.(2) The Board shall ensure that the water supplied by it is duly filtered, treated and tested andis fit for human consumption.(3) The Bard shall arrange retail distribution of water within its jurisdiction excluding the areasreceiving water supply through constituent Bodies.(4) The Board may, subject to availability, supply water to any person or authority in the areaor areas notified under this Act.(5) The Board shall continue to make bulk water supply to the constituent Bodies at such ratesand subject to such terms and conditions as may be determined by the Board.(6) A standing committee consisting of the Chairman or his nominee, Commissioner KarachiDivision and the Managing Director shall allocate and determine quantity of water to be suppliedto each constituent Body.
Provided that until such terms or conditions or quantity of water is determined, the Board shallcontinue the bulk water supply according to the arrangements existing immediately before thecommencement of this Act.
(7) If the Board does not accept the decision of the standing committee, the ManagingDirector shall report the matter to Government for appropriate orders and the orders issued byGovernment shall be complied with by the Board.
Explanation:- The tem “Constituent Bodies” shall mean and include the Karachi DevelopmentAuthority, Karachi Port Trust, Cantonment Board of Karachi, Sindh Industrial & Trading Estate,Karachi Pakistan Steel Mills Corporation Defence Service or any other body or organisationnotified by Government.
(8) Until otherwise notified by Government, the Authority shall continue to execute the HubDam Water Supply Stage I and Phase-IV of the Greater Karachi Bulk Water Supply Stage I andSewerage Disposal Projects.(9) The Board or any person authorised by it shall have right to place and maintain aqueducts,conduits and lines of mains, drains, sewers or pipes, over, under, along or across any immovableproperty without acquiring such property, and to enter on such property for the purpose ofexamining, repairing, altering or removing any aqueducts, conduits or lines of mains, sewers orpipes.

56
Pakistan Water Sector Strategy, 2002
The National Water Policy was one of the initiatives taken by the Government of Pakistan at thebeginning of the current millennium for the development of water sector in the country. ThePakistan Water Sector Strategy 2002 provided the road map for implementing the policy framedfor development of the water sector. The Strategy comprises three independent documents asunder:
1. The ‘National Water Sector Profile’ which summarises and details all aspects of wateravailability and utilisation as they exist. As such it will become a standard source document forall future work in water sector
2. The ‘National Water Sector Strategy’, which identifies the key issues and objectives for thewater sector and proposals for planning, development and management of water resourcesand their use in all water sub-sectors
3. The ‘Medium Term Investment Plan’ which identifies the key programmes and projects whichshould be undertaken up to 2011 as the initial contribution to achieve the objectives of thestrategy
As in the case of the National Water Policy, the Water Sector Strategy is also mainly focused onirrigation, which is the predominant user of water. However domestic water supply having the firstpriority in any water allocation the Strategy has given due importance to this sub-sector in itsdiscussions.
The following key factors have been identified by the Strategy as the driving force fordevelopment of water resources in the country:
1. Population growth2. Increasing agricultural demands3. Domestic water supply needs4. Dwindling water resources; and5. Cross cutting issues
Linking the discussion on water resources and domestic water supply is the factor of additionaldemand of water for domestic needs by 2025. This would result in a shortfall of 11.3 million acrefeet of water per annum available for irrigation if additional water resources are not developed.
Water conservation is a key component of the strategy. Most of the water saving will have tocome from the irrigation sub-sector because it is by far the largest user of water.
Water quality has been identified as one of the main issues in water sector in Pakistan and itsimprovement a key component of the strategy. Poor water quality affects all sub-sectors as well asthe quality of life of the people. Pollution of water sources is caused mainly by municipal andindustrial waste water disposal and disposal of saline and chemically polluted agricultural runoff.Attacking this problem will require the cooperation of several agencies including municipal serviceproviders and industrial sector.

57
Institutional and management issues also cut across the whole of the water sector. The lack offinancial sustainability in water service delivery, caused by low levels of water tariff and theircollection, has led to a strain on governmental resources and deteriorating infrastructure indomestic as well as irrigation sub-sectors. Failure to improve this will result in continueddeterioration and poor service delivery.
The water sector strategy lays out a road map to guide the management and development ofwater sector and service delivery in water industry.
The Strategy divides the primary issues in the water sector into three categories, namely,Institutional and Management issues, Social and Financial Issues and Technical Issues.
The Institutional and Management issues include- inadequate coordination between variousorganisations of various sub-sector of water; Absence of an inter-ministerial, inter-provincial bodyto oversee water sector planning, management and development; changing administration underthe devolution plan and uncertainty in technical capacity during transition, particularly in domesticwater supply and sanitation sub-sectors; and need for improvement of water sector infrastructureand activities.
Social and Financial Issues include: Limited availability of funds for the water sector; lack offinancial sustainability in water sector services due to low level of public sector funds for O&M andinsufficient cost recovery; limited private sector investment or participation; and inadequatepublic awareness of water sector issues.
Technical Issues include: Increasing demand for water; inefficient use of water; inadequatedomestic water supply and sanitation coverage and quality of service; deteriorating water quality;and deteriorating infrastructure.
The key elements of the strategy for the water sector comprise water conservation, stakeholderparticipation in management, improving public awareness and understanding of issues, a goodquality MIS for water, improving cooperation and coordination amongst various agencies in thewater sector, ensuring long terms financial sustainability of infrastructure and services throughreasonable cost recovery, improvement of water quality, and involvement of the private sector.
The details of the strategy relating to domestic water supply and sanitation sub-sectors are asfollows.
Overall Objectives
The main objectives of the strategy are to:
1. Increase coverage of clean water supply for urban population to 96%2. Increase coverage of functional sanitation for urban population to 80%3. Achieve full compliance with EPA standards for drinking water4. Achieve full compliance with EPA standards for wastewater disposal5. Develop a water quality Information Management System

58
Financial Objectives
Achieve financial sustainability in all water sector developments through:1. Appropriate levels of cost recovery to make operating agencies financially viable2. Appropriate tariffs to ensure provision of adequate services to all users, including poor and
disadvantaged3. Urban wastewater charges based on cost recovery and “polluter to pay‟ principle4. Private sector participation in appropriate areas of water management
Water Quality Objectives
Water quality objectives based on:
1. Establishing and maintaining water quality standards for potable water2. Ensuring that wastewater effluent is treated before disposal3. Preservation of surface and groundwater resource to ensure sustainability of supply
Management Measures
1. Establishing a Coordinating and Support body on a country-wide basis for urban water supplyand sanitation sub-sector
2. Developing a strategy and medium and long-term plan including tariff levels, improvedcollection methods, demand management measures, participation by the private sector, andinfrastructure improvement and expansion
3. Formulating appropriate institutional arrangements for smaller cities and towns in the light ofDevolution Plan
Technical Measures
1. Renew the existing operational assets to address the maintenance backlog2. Expand water supply and sanitation networks to increase coverage to the stated targets3. Develop additional surface and groundwater resources to meet growth in demand4. Construct new sewage disposal networks in line with EPA‟s effluent disposal regulations
National Drinking Water Policy, 2009
The policy provides a framework to the federal government, provincial governments, Azad JammuKashmir, Federally Administered Tribal Areas, local governments and development authorities toaddress the issues and challenges facing Pakistan in terms of access to safe drinking water.
The goal of the policy is to provide clean and safe drinking water to improve the quality of life ofpeople through decreased death and illness caused by water borne diseases at an affordable costand in an equitable, efficient and sustainable manner by 2020. The key principles of the policyinclude:
59
1. Providing access to safe drinking water to every citizen of Pakistan by developing new andwater supply systems in urban and rural areas especially the neglected areas by usingimproved technology and standardisation
2. Allocate water for domestic purposes such as drinking, hygiene, sanitation etc. on priority basis3. Take measures to protect and conserve the surface and groundwater resources by developing
ambient water quality standards, rain water harvesting, community management of localresources, recycling of water, etc.
4. Using water treatment systems and methods to ensure provision of safe drinking water5. Involving communities especially women and children in planning, implementation,
monitoring, and operation and maintenance of water supply systems6. Creating public awareness through intensive information, education and communication
campaigns to promote water safety and conservation, and sage hygienic practices7. Carry out capacity development efforts to streamline and upgrade the roles and
responsibilities of various agencies concerned with the water sector at the provincial andfederal levels
8. Promote public private partnerships for enhancing access to safe water, O & M of water supplysystems, resource mobilisation and capacity development
9. Carry out continuous research and development initiatives to develop new approaches andinnovative ideas
National Sanitation Policy, 2006
The policy provides broad framework and guidelines to all governments to enhance and supportsanitation coverage in the country through the formulation of sanitation strategies, plans andprograms for improving the quality of life of people and a providing a healthy work environment.
The overall sanitation and sewerage coverage in Pakistan is very low. The urban areas fare slightlybetter than the rural areas. Yet data on the occurrence of cases of diarrhoea suggests that peoplesuffer repeated and continuous exposure to polluted water. Almost 40% of all reported diseasesand 30% of all deaths in the country are attributable to faecal contamination of water due tomixing up of water supply and sewerage lines.
The provision of water supply and sanitation facilities in rural areas has considerably increased inthe past few years. Apart from reducing health problems this has also considerably improved thefinancial and economic condition of the poor. There is marked improvement in infant mortalityrates due to supply of safer water. There is noticeable reduction in diseases like diarrhoea, typhoidand cholera due to successful implementation of rural water supply and sanitation schemes inKhyber Pakhtunkhwa, Punjab and Sindh. However, the coverage is still low and concerted effortsare needed throughout the country to continue improvement in coverage as well as quality ofwater supply and sanitation in the rural areas to promote health and hygiene.
The policy primarily focuses on the following activities/premises:
1. Safe disposal of excreta by using sanitary latrines, creating a open defecation freeenvironment, industrial and agricultural wastes, safe disposal of liquid and solid wastes, andpromotion of health and hygienic practices in the country

60
2. Develop and utilise sewage and water treatment facilities for domestic and industrial use3. Promote the concept of Community Led Total Sanitation4. Develop an institutional and financial framework for the agencies concerned in this sector,
along with capacity building initiatives5. Carry out public awareness programmes6. Using appropriate, low cost, easy and cost effective technology7. Achieve sustainable development through the above initiatives8. The sanitation initiatives will be financed by the government9. For monitoring the industrial and municipal effluents, EPA will be the responsible body10. Increasing numbers and access to public toilets11. Promoting public private partnership12. Safe disposal of hospital waste by following the Hospital Waste Management Rules 200513. Provision of incentives and rewards to tehsils/towns for the implementation of the sanitation
policy
National Climate Change Policy, 2012
The Ministry of Climate Change launched Pakistan’s new climate change policy in 2012. Pakistanhas been identified as one of the top 16 countries with a high climate change vulnerability index.Many sectors like water resources, agriculture and livestock, human health, forestry, biodiversity,ecosystems, are at great risk of being affected by climate change.
The new policy recommends policy measures and proposes mitigation strategies in particular forenergy, transport, town planning, industries, agriculture and livestock and forestry sectors.
While mitigation for water resources is a much broader area, beyond the scope of this review,introduction of climate change mitigation strategies in town planning particularly for water,sanitation and solid waste management is particularly pertinent. Two policy measuresrecommended, among others, that have a direct bearing on water supply, sanitation and solidwaste are:
Make installation of wastewater treatment plants an integral part of all sewerage schemes Ensure separate collection, disposal and re-use of recyclable, composite and biodegradable
waste, preferably at source Introduce local rainwater harvesting measures
Hospital Waste Management Rules, 2005
Under these Rules, every hospital is responsible for proper management of waste generated by ittill its final disposal in accordance with provisions given in these Rules. The Rules require eachhealthcare facility to constitute a waste management team, and to prepare and implement awaste management plan. The Rules also include guidelines for waste segregation, collection,transportation, storage, and disposal. The Government of Sindh has developed its Sindh HospitalWaste Management Rules, 2014 adapted from the Hospital Waste Management Rules, 2005.

61
Draft Sindh Drinking Water Policy, 2016
The Vision and Mission of the draft Policy are as follows:
VisionOur vision for the population of Sindh is to provide safely managed drinking water whose supply isadequate, well maintained and sustainable; and to enhance public awareness about health,nutrition and hygiene related to safe drinking water.
PrinciplesThe main principles of Sindh Drinking Water Policy, adapted from the National Drinking WaterPolicy 2009 and aligned with the Sustainable Development Goals, are as follows:
Access to safely managed drinking water is a fundamental right of every citizen and that it isthe responsibility of the Government to ensure its provision to all citizens
Water allocation for drinking purposes shall be given priority over other uses In order to ensure equitable access, special attention shall be given to removing the existing
disparities in coverage of safe drinking and for addressing the needs of the poor and thevulnerable
Recognising that inadequate and unsafe water supply and sanitation are a major cause ofdiarrhoea and nutritional deficiency in children, which as a consequence contribute towardschild mortality, safely managed drinking water supply and sanitation shall be integrated inhealth, nutrition and school health programmes
Access shall be increased to high quality nutrition-sensitive services, including access to water,sanitation facilities, and hygiene
Key hygiene actions (safe drinking water, handwashing with soap, safe disposal of excreta, andfood hygiene) shall be integrated as essential components in all nutrition programmes
Realising the fact that access and availability of safe drinking water affects all aspects of life ofcitizen, a multi sectoral approach, involving different departments of the government, shall beadopted to address the issues related to safe drinking water
Being cognisant of the fact that women are the main providers of domestic water supply andmaintainers of hygienic household environment, their participation in planning,implementation, monitoring and operation & maintenance of water supply systems shall beensured, and WASH shall be integrated in maternal and neonatal health programmes
Responsibilities and resources shall be delegated to local authorities to enable them todischarge their assigned functions with regard to provision of safe water supply
A supportive policy framework shall be developed that encourages alternate options throughprivate provision, public-private partnerships, the role of NGOs and community organisations
The execution of component-sharing model for government programmes and projects shall bepromoted to ensure financial sustainability and community and private sector involvement indevelopment and O&M
Low cost technologies in water and sanitation, that are easy and cost-effective to maintainshall be developed and used

62
The Goals and Objectives of this Policy are highlighted below.
Goals and Objectives
Overall Goal: The goal of the Sindh Drinking Water Policy is to improve the quality of life of peopleof Sindh by reducing morbidity and mortality caused by water-borne diseases through provision ofsafely managed and potable drinking water to the entire population that is located on premises,available when needed, and free from contamination, affordable and of sufficient quantity, and ina way that is efficient, equitable and sustainable.
The specific objectives of the Policy are as follows:
Objectives:
1. Introduce legislative measures and regulations to create an enabling framework for safelymanaged drinking water supply, regulation of water usage, extraction, treatment,transportation and distribution
2. Ensure that all drinking water resources and supply systems are protected with communityinvolvement
3. Develop district level drinking water availability plans for urban and rural areas to ensureimproved planning for equitable access
4. Enhance the coverage of safely managed drinking water supply in the province to achievethat Sustainable Development Goals (SDGs) targets of universal access
5. Develop criteria for installation of new drinking water supply schemes and ensure that allnew schemes are safely managed, rationalised and constructed through need basedcriteria so that all areas and communities are served
6. Develop standardised service delivery models for both urban and rural drinking watersupply schemes to improve efficiency, cost-effectiveness, improve monitoring andsustainability
7. Develop mechanisms for reuse, recycle and recharge of wastewater for other municipaland productive uses
8. Ensure that all drinking water supply systems are designed and constructed in line with thenational drinking water quality standards and all municipal discharges comply withNational Environment Quality Standards (NEQS)
9. Install water treatment plants at existing drinking water supply schemes where requiredand incorporate water treatment facilities in all new drinking water supply schemes
10. Ensure development of water safety plans for all drinking water supply systems11. Develop and sustain regular drinking water quality monitoring and surveillance, and
institute mechanisms for remedial action12. Increase public awareness about water borne and water-related diseases (including polio),
nutrition and hygiene, and enhance the role of communities for household watertreatment/storage, water safety and conservation, and safe hygiene practices
13. Ensure that drinking water supply projects are nutrition sensitive and integrated in health,nutrition and school health programmes

63
14. Institutionalise WASH in schools (infrastructure and 3 stars) and introduce curricularchange to incorporate health, nutrition and hygiene and improved and safe water andsanitation practices among school children
15. Institute adaptation measures and disaster risk reduction and mitigation strategies tominimise the impact of climatic events on drinking water supply systems
Draft Sindh Sanitation Policy, 2016
The Goal and Targets of the draft Policy are as follows:
GoalThe goal of the Provincial Sanitation policy is to ensure that the entire population of Sindh hasaccess to a safely managed sanitation service and sanitary environment that is also nutrition-sensitive and hygienic. The motto of this policy is ‘Saaf Suthro Sindh’.
TargetsIts key targets are:
1. Eradicate Open Defecation from Sindh Province by 2025, while 70% villages of 13 highpriority districts achieve the status of open defecation free by 2020.
2. 100% households in Sindh have access to and use sanitary latrines by 2025, while 70% ofrural households in high priority districts will achieve this by 2020.
3. Strengthen and implement liquid waste management with sewer lanes andcovered/improved drains with 85% coverage of urban areas and 60% coverage in ruralareas.
4. Create and develop wastewater treatment mechanisms to cover 75% of urban areas and40% in rural areas by 2025.
5. More than 90% of rural households and 100% of urban households wash hands with soapat critical times by 2025.
6. Implement integrated solid waste management with 100% coverage in urban areas and60% in rural areas of Sindh by 2025.
PrinciplesThe main principles of draft Sindh Sanitation Policy are as follows:
The Policy aligns itself with the goals and targets of the SDGs for sanitation, which requiresanitation services to be safely managed, have a private improved facility where faecal wastesare safely disposed on site or transported and treated off-site; plus a handwashing facility withsoap and water
The sanitation policy adheres itself to the pursuit of total sanitation as outlined in PATS, withinthe province, which refers to the complete eradication of all indiscriminate and unhygienicpractices including disposal of excreta, foul water and solid waste.
64
Safely managed sanitation services is a fundamental right for all persons in Sindh province, andshould be ensured through enhanced access to marginalised and low resource areas withequitable distribution of resources. Recognition of inequities and rights based programmingwill be given key emphasis during the planning, execution and monitoring of sanitationprogrammes.
The policy seeks to prioritise the areas that pose the greatest risk to human health namelyhygiene awareness and excreta disposal, and then address the environmental health risks thatare posed by poor drainage and solid waste disposal.
Recognising that inadequate and unsafe water supply and sanitation are a major cause ofdiarrhoea and nutritional deficiency in children, which as a consequence contribute towardschild mortality, safe drinking water supply and sanitation should be integrated in health,nutrition and school health programmes
Increase access to high quality nutrition-sensitive services, including access to water, sanitationfacilities, and hygiene
Integrate key hygiene actions (safe drinking water, handwashing with soap, safe disposal ofexcreta, and food hygiene) as essential components in all nutrition programmes
The policy shall promote the community led approaches to strengthen the demand for safelymanaged improved sanitary conditions that emerges from local communities. The multi-stakeholder partnerships and collaborations comprising of citizens, governments, civil society,non-governmental organisations (NGOs), donors, academia, media, etc. be encouraged tomaximise the synergies in designing and implementation of interventions.
Affordable (in terms of designs as well as availability of water) and cost effective technicalsolutions with necessary modifications and adaptations in technical standards to be consistentwith cultural sensitivities of specific communities will be identified and marketed.
Sustainability of the services shall be ensured by mobilising and engaging existing structures,where possible like LHWs, UC secretaries, NGOs and private sector in service delivery andreporting of WASH.
The component sharing model as envisaged in the National Sanitation Policy will beinstitutionalised gradually in which the community is responsible to construct lane andneighbourhood level sewers (internal development) on self-help basis and the governmentfocuses on trunks, disposal and treatment unit (external development).
The role of women shall be an integral component of behavioural change communicationstrategies and project planning, implementing and monitoring through capacity developmentand social mobilisation of relevant stakeholders.
An independent monitoring and evaluation system will be established and maintained to trackprogress under the sanitation agenda and also to operationalise incentives envisaged in thispolicy.

65
Pakistan Approaches to Total Sanitation, 2010
Pakistan Approaches to Total Sanitation (PATS) developed under the leadership of Climate ChangeDivision of the Cabinet Secretariat, (former Ministry of Environment) has been successfully rolledout in Pakistan with the support of Provincial Governments, UNICEF and civil society partners.PATS underpins an Integrated Total Sanitation approach that seeks for sanitation demandcreation, sustaining the demand through supply side interventions, promoting participatoryhygiene, attaining 100% adequate drainage and wastewater treatments, linkages developmentwith duty bearers and knowledge management and accountability. PATS extends an active socialmobilisation strategy by building a cadre of human resources who inspire and empower thecommunities to construct technically sound and viable latrines which are connected to a securedisposal system and achieve total sanitation status, sustainably adopt hygiene practices andcontinuously use improved sanitation facilities.
PATS calls for humanitarian-development nexus in sanitation programmes and includes sanitationmarketing strategies to achieve total sanitation in an urban or rural human settlement. Large scalesanitation programmes following PATS approach have been implemented by sanitation sectorpartners in the aftermath of 2010 floods, which affected the whole country. Evaluation of theseprogrammes and subsequent sanitation programmes in response to floods in 2011 and 2012 hashelped refinement of programme design under PATS, especially in harmonising humanitarian-development interventions. It is estimated that more than 8 million people have achieved ‘OpenDefecation Free’ (ODF) status as a result of at scale programmes under PATS since its launch inMarch 2011. Another achievement of PATS approach is that all sanitation sector partners haveadopted it and sanitation programmes implemented under this approach at scale are beingadopted by the government in terms of funding and implementation.
Community Led Total Sanitation
Community Led Total Sanitation (CLTS) methodology is an entry point to achieve “total sanitation”and not total sanitation in itself. CLTS is an effective approach for triggering action to changedefecation behaviours at the community level and to create demand for improved sanitationfacilities. Sanitation, as a whole is an entry point for greater social change and communitymobilisation. The steps identified under CLTS include:
Pre-triggering: selecting community and developing a better-defined sense of community
Triggering: educating the community regarding the consequences of living in a faecallycontaminated environment until they come to the realisation that they are eating, washing in, anddrinking each other’s faeces. Some of the triggering activities include defecation area transect,mapping of defecation areas, calculations of faeces and medical expenses, triggering disgust andignition. The “ignition” captures the moment when the community becomes mobilised to takecollective action to stop the ingestion of each other’s faeces and improve their poor sanitation.
Post-triggering: Once communities typically pledge to improve their sanitation by either becomingopen-defecation free or by adopting improved sanitation technologies, there is a danger thatthese pledges do not come to fruition without follow-up work. Follow-up activities include

66
immediate follow-up and encouragement, community action follow-up i.e. engaging withcommunities to agree furthering action plans to achieve other sanitation outcomes includingexternal systems, participatory monitoring and indicators setting, verifying and certifying OpenDefecation Free (ODF) status, celebrations and the monitoring and sustaining of ODF status
School Led Total Sanitation
A significant component of PATS is School Led Total Sanitation (SLTS). The SLTS approach is usedfor promotion of good health practices where children largely helped in changing perceptions atcommunity level. The usage of a forum like the teacher-student WASH club proves highlysuccessful in imparting hygiene communication messages at scale. Additional enabling factorssuch as training programmes for schoolteachers, capacity building and awareness raising of villagebased development organisations, coordination and support for the district level governmenteducation department play significant roles in the programme’s success. SLTS is being used as anopening intervention in PATS programme at scale in transition from humanitarian to developmentas it provides an opportunity to mobilise the disaster affected communities with dignity, pride andself-respect.
Solid Waste Management
Several legal rules and institutional framework deal with solid waste management in the country.These include Pakistan Environmental Protection Act (PEPA) 1997, the National EnvironmentalQuality Standards (NEQS), Hazardous Substances Rules of 1999, Guidelines for Hospital WasteManagement 1998, Hospital Waste Management Rules 2005, Hazardous Substances Rules 2003,and several other regulations, rules and standards.
Several legislations, regulations and rules are applicable to Solid Waste Management (SWM).These are summarised in Table 8.
Draft Solid Waste Management GuidelinesDraft Solid Waste Management (SWM) Guidelines were developed by the Pakistan EnvironmentalProtection Agency in 2005 in collaboration with UNDP and JICA and provide a useful reference formunicipal services.
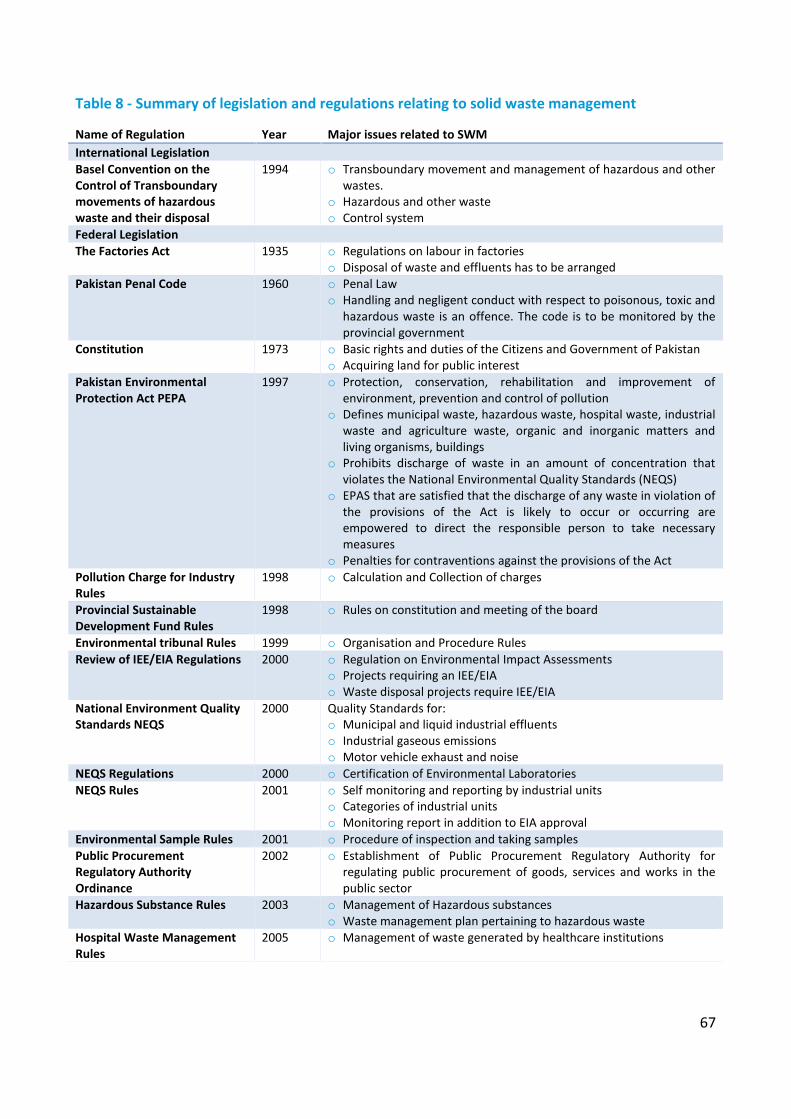
67
Table 8 - Summary of legislation and regulations relating to solid waste management
Name of Regulation Year Major issues related to SWMInternational LegislationBasel Convention on theControl of Transboundarymovements of hazardouswaste and their disposal
1994 o Transboundary movement and management of hazardous and otherwastes.
o Hazardous and other wasteo Control system
Federal LegislationThe Factories Act 1935 o Regulations on labour in factories
o Disposal of waste and effluents has to be arrangedPakistan Penal Code 1960 o Penal Law
o Handling and negligent conduct with respect to poisonous, toxic andhazardous waste is an offence. The code is to be monitored by theprovincial government
Constitution 1973 o Basic rights and duties of the Citizens and Government of Pakistano Acquiring land for public interest
Pakistan EnvironmentalProtection Act PEPA
1997 o Protection, conservation, rehabilitation and improvement ofenvironment, prevention and control of pollution
o Defines municipal waste, hazardous waste, hospital waste, industrialwaste and agriculture waste, organic and inorganic matters andliving organisms, buildings
o Prohibits discharge of waste in an amount of concentration thatviolates the National Environmental Quality Standards (NEQS)
o EPAS that are satisfied that the discharge of any waste in violation ofthe provisions of the Act is likely to occur or occurring areempowered to direct the responsible person to take necessarymeasures
o Penalties for contraventions against the provisions of the ActPollution Charge for IndustryRules
1998 o Calculation and Collection of charges
Provincial SustainableDevelopment Fund Rules
1998 o Rules on constitution and meeting of the board
Environmental tribunal Rules 1999 o Organisation and Procedure RulesReview of IEE/EIA Regulations 2000 o Regulation on Environmental Impact Assessments
o Projects requiring an IEE/EIAo Waste disposal projects require IEE/EIA
National Environment QualityStandards NEQS
2000 Quality Standards for:o Municipal and liquid industrial effluentso Industrial gaseous emissionso Motor vehicle exhaust and noise
NEQS Regulations 2000 o Certification of Environmental LaboratoriesNEQS Rules 2001 o Self monitoring and reporting by industrial units
o Categories of industrial unitso Monitoring report in addition to EIA approval
Environmental Sample Rules 2001 o Procedure of inspection and taking samplesPublic ProcurementRegulatory AuthorityOrdinance
2002 o Establishment of Public Procurement Regulatory Authority forregulating public procurement of goods, services and works in thepublic sector
Hazardous Substance Rules 2003 o Management of Hazardous substanceso Waste management plan pertaining to hazardous waste
Hospital Waste ManagementRules
2005 o Management of waste generated by healthcare institutions

68
Name of Regulation Year Major issues related to SWMProvincial and Local LegislationSindh Solid Waste Management BoardAct
2014 o For collection and disposal of all solid waste, to arrangefor effective delivery of sanitation services, to providepollution free environment and to deal with otherrelevant matters
Sindh Solid Waste Management Policy 2006 o Sindh Solid Waste Management Policy is intended tosupport and guide the Sindh City District Governmentand Taluka Municipal Administrations (TMA) to frametheir own solid waste management (SWM) strategies,plans and programmes and is the result of stakeholderconsultations held at the Taluka and provincial levels
Sindh Hospital Waste Management Rules 2014 o Hospital Waste Management Plan based oninternationally or nationally recognized environmentalmanagement practices, standards, which shall efficientlyand effectively address the hospital waste
Sindh Local Government Act 2014 o Local Councils establishment and scope of serviceso Solid waste management, treatment and disposalo Industrial and hospital hazardous and toxic waste
treatment and disposalSindh Environmental Protection Act 2014 o Environment control including control of air, water and
soil pollution in accordance with Federal and Provinciallaws and standards
Sindh Environmental Quality StandardsRules
2014 o The Sindh Environmental Quality Standards Rules, 2014provide for Self-Monitoring and Reporting by Industry
Inter-sectoral Nutrition Strategy Sindh
The National Nutrition Survey 2011 indicates that Sindh is the most food deprived province ofPakistan where only 28% households are food secure (21.1% food insecure without hunger, 33.8%food insecure with moderate hunger and 16.8% food insecure with severe hunger). In order toaddress this serious public health issue, the Government of Sindh has launched an Inter-sectoralNutrition Strategy for the province.
The Inter-sectoral nutrition strategy for Sindh aims to reduce chronic malnutrition in children aged0-24 months by 10 percentage points (from an estimated 49.8% to 39.8% by the end of 2016), irondeficiency anaemia in children from 73% to 62% and maternal anaemia from 59% to 49% by theend of 2016 through sustainable, effective and inter-sectoral interventions.
The operational objectives of the strategy are:
(i) Improve nutritional outcomes in the Sindh province with a focus on sustainable, effectiveinter-sectoral interventions
(ii) Strengthen the provincial capacity for developing, mobilizing and stewarding inter-sectoralintervention developed through public private partnership;
(iii) Integration and mainstreaming of nutrition in agricultural education, agriculture services andcommunity development programmes;
(iv) Promote nutrition health of women and children through linking mother and child health withsocial protection, and food security interventions to produce long term sustained results;

69
(v) Promote programmatic complementarities and geographical convergence throughcoordinating the strategic sectoral plan
(vi) Provide a broad Monitoring and Evaluation Framework for monitoring of nutrition sectorstrategy by Department of Health and partners
Specific actions pertaining to water and sanitation under the strategy include:
1) Provide safe drinking water and good sanitation facilities through: Legislating “Execution,Operation & Maintenance of water and sanitation policy”; defining Role of District Councils,Municipal Committees, Union Councils and PHED”; and prepare a grand strategy that prioritiseschemes in districts that are high risk for malnutrition.
2) Enhance community ownership for follow up maintenance of the new schemes throughreviving project implementation teams (PIT) in high risk areas (PIT consists of CommunityDevelopment Officer, Assistant Community Development Officer and Hygiene Educator).
3) Strengthen capacity of the service providers (Water & Sanitation) to ensure provision of safewater on WHO Standards.
4) Induct environment specialist at each district level for ensuring and monitoring quality ofexisting and upcoming WASH facilities by following WHO standards.
5) Establish intra sectoral monitoring cell to ensure that water and sanitation schemes meet theminimum WHO standards.
6) Undertake social mobilisation campaign to promote health and hygiene behaviour in thecommunity such as protection of water source, follow-up maintenance of schemes.
7) Participate in integration of WASH related messages in the curriculum of outreach workersfrom different sectors.
8) Provide technical assistance and support to Education and Literacy department for: inclusion of standardised messages related to environmental hygiene in their curriculum ensuring the availability of WASH facilities in school environment
9) Introduce new WASH schemes in prioritised areas.
10) Rehabilitation, improvement, extension and augmentation of WASH schemes.
11) Participate actively in the forum established for generating evidence to influence policythrough research.
12) Participate in the inter-sectoral nutrition coordination committee.

70
Draft WASH Behaviour Change and Communication Strategy,2016
A draft Behaviour Change and Communication (BCC) strategy has been developed by LG&HTPD.
Its Vision and Mission are as follows:
VisionThe Sindh BCC Strategy envisions for sustainable and safe hygiene environment by 2025 toenhance the living standards of the people of Sindh.
MissionThe Sindh BCC Strategy will strive for effective implementation relevant government developmentplans, processes and methods, resulting in improved hygiene in relation to water and sanitation toreduce the burden of water borne and sanitation related diseases.
PrinciplesThe main principles of Sindh BCC strategy are the following:
The Government owns the responsibility for ensuring safe drinking water, improved sanitationand safe hygiene by recognising these as basic human rights of the people.
Access to clean drinking water, improved sanitation with appropriate disposal and goodhygiene practices are prerequisites for healthy human life especially reductions in morbidityand mortality rate among the children.
Water allocation and rationing for drinking and domestic purposes will be prioritised overother usages along with promoting judicious use for sanitation and hygiene purposes.
Inclusion and equity shall be promoted by placing emphasis on eliminating the disparities inthe coverage and access to safe drinking water, improved sanitation and hygiene practices forpoor and vulnerable groups including women, elderly, disabled and children.
Social mobilisation especially concerning women engagement will be promoted and enhancedin planning, implementation, monitoring and maintenances of water supply, total sanitationsolutions and hygiene practices.
Capacities and resources of the local government and newly elected councils shall beaugmented in effective service delivery for safe drinking water, improved sanitation andenvironment friendly hygiene.
Engagement with media and local opinion makers will be maintained and strengthenedthrough dialogues, capacity development and awareness raising sessions.
The transformation of poor indigenous practices contrary to healthy behaviours shall besought through evidence based information sharing and community appreciation.

71
The BCC Strategy has the following Goals and Objectives
Overall GoalAchieve Sustainable Development Goal targets for water, sanitation and hygiene, by reducingmorbidity and mortality caused by faecal-oral contamination due to inadequate sanitation, poorhygiene practices and a lack of access to safe drinking water.
Objectives
Social Mobilisation1. Facilitate the creation of a sustainable environment that is open defecation and litter free
ensuring appropriate liquid disposal and waste management through effective mobilisationof communities and stakeholders.
2. Encourage communities and other stakeholders to construct and use the latrines at thehouseholds and important public places while ensuring safe disposal of human excreta.
3. Strengthen immunity against water borne diseases including diarrhoea, stunting, wasting,etc. through promotion of good behavioural practices including hand washing, watertreatments, menstrual hygiene and personal cleanliness.
4. Use participatory community driven approaches for local solutions and ownerships underthe umbrella of Pakistan Approach to Total Sanitation
Knowledge Management and Research1. Generate knowledge and evidence regarding consequences and impact of poor sanitation,
low quality drinking water and lack of appropriate hygiene practices
Training and Capacity Building1. Enhance and develop the capacities of all key stakeholders comprising of government
institutions, civil society, academia, research organisations, NGOs, media and local councilsin understanding the social norms and environmental sustainability.
2. Train local councils and elected representatives about social mobilisation approaches andneeds for enhanced resource allocations for WASH.
3. Inform stakeholders and the communities about health burden and economic losses atdifferent levels due to poor water and sanitation services and practices.
Enabling Environment1. Mobilise support for integration of water, sanitation and hygiene aspects in different
development programmes and policies including heath, environment, education, housing,urban development and town planning.
Legislation and Institutional Challenges
The Sindh Local Government Act 2014 delegates planning and management of water supply andsanitation schemes including water rates, etc. to the local government but the newly electedgovernments and even LG&HTPD are unclear about the distinction between the expected rolesfrom LG&HTPD and PHE&RDD. Even with placement of Local Government in Sindh, there is lack of

72
clarity about the utilisation and planning of funds for sanitation on the part of these local bodieselected representatives. There is need for revision in the SLGA 2013 to clearly indicate the role ofPHE&RDD for rural water supply and sanitation, operation and maintenance, and to direct transferof personnel and funds as appropriate.
It appears that there is sufficient legislation and policy pronouncement already in place, however,the motivation, coordination, resources, participation of beneficiaries and institutional capacity toeffectively implement them appear to be sorely missing52. Additionally, there would appear to beoverlaps and lack of clarity in responsibilities for interrelated agencies and a lot of the legislation isvery prescriptive and ‘over-specified’ which enforces strict bureaucratic routines and stifles thedevelopment of new ways of working.
From the foregoing, it is apparent that there exists a wide range of legislations to regulate,administer and provide guidelines for the functions and authority of institutions directly involvedin the water and sanitation sector. However, the lack of an overall framework or strategy withinwhich legislative controls are to be implemented and the absence of inter-linkages, or synergybetween the various Acts and Ordinances has had little impact on management of drinking waterand sanitation services. There is a pressing need for a comprehensive legislative review thatunderpins water supply and sanitation issues including community participation and O&M issues,so that harmonised acts for drinking water and sanitation can provide the legal and institutionalframework for planning, services, sector coordination, and monitoring and evaluation, in place ofthe fragmented state of affairs at present.
52 The Study on Water Supply and Sewerage System in Karachi in the Islamic Republic of Pakistan, 2008. Japan InternationalCooperation Agency (JICA), Karachi Water & Sewerage Board (KW&SB)

73
Strategy
Legislations, Regulations, Policies and StrategiesStrategicObjectives/Outcomes
Short Term Actions1 - 3 years
Medium Term Actions4 - 6 years
Long Term Actions7 - 10 years
Finalisation of draftedpolicies and theirimplementation
Approval of Draft DrinkingWater Policy, Revised DraftSanitation Policy, and DraftBehaviour ChangeCommunication Strategyand their implementation
Sindh Local GovernmentAct 2013 provisions forWASH operationalised
Conduct a review of theSLGA and develop Rules ofBusiness for LG&HTPD andPHE&RDD. Seekamendment in SLGA 2013to clearly indicate role ofPHE&RDD in rural watersupply and sanitation,O&M, and provideadministrative transfer ofstaff and funds
Municipal water governedby a legal framework
Enactment andpromulgation of the SindhMunicipal Water Act (draft)
City and Town masterplans developed andincorporate zone-wisedevelopment of watersupply, sewerage anddrainage, and solid wastemanagement
Industrial wastewatermanagement regulationsput into effect in industrialzones and curbs to stoppollution enforced
Sindh Water Commissionperforms its functions as aregulatory body
Establishment of the SindhWater Commission
Tariff structure revised
Minimum service deliverystandards established formunicipal services (watersupply, sanitation, solidwaste management)
Ensure that each localgovernment has a masterplan on water, sanitationand solid wastemanagement for its area ofjurisdiction
At least 25% localgovernments achieveminimum service deliverystandards for municipalservices (water, sanitation,solid waste management)
At least 50% localgovernments achieveminimum service deliverystandards for municipalservices (water supply,sanitation, solid wastemanagement)
Legislative review toharmonise existinglegislation, policies andrules
Legislative review ofdrinking water acts,policies, regulations anddevelopment ofharmonised new acts,regulations and guidelines,
Periodic review of newlegislations, policies andregulations and theirimplications for WASH
Periodic review of newlegislations, policies andregulations and theirimplications for WASH

74
including O&M
Introduce legislativechange in SLGA 2014 forPHE&RDD to beresponsible for O&M ofwater and sewerage anddrainage schemes, andtransfer resources andmanpower to PHE&RDD fortheir proper maintenance
Legislative review ofsanitation, sewerage anddrainage acts, policies,regulations anddevelopment ofharmonised new acts,regulations and guidelines,including O&M
Sectoral operatingprocedures (designguidelines) for planningand managementdeveloped
Development of StandardOperating Procedures(design guidelines) forwater planning,management and O&M forPHE&RDD
Development of StandardOperating Procedures(design guidelines) forwastewater and solidwaste planning,management and O&M forLG&HTPD
Operational guidelines forCBOs for water andsanitation developed
Development of guidelinesfor CBOs for projectmanagement and O&M ofwater supply schemes
Development of guidelinesfor CBOs for projectmanagement and O&M forsanitation, sewerage anddrainage schemes
Municipal services dutybearers have necessarymanagerial and leadershipskills for an integrated,safely managed andnutrition-sensitive watersupply, sewerage anddrainage, and solid wastemanagement programme
Orientation and capacitybuilding programme of 2big cities, 119 town and1297 union council officialson application ofregulations, policies andstrategies in planning,development and deliveryof municipal services thatare integrated, safelymanaged and nutrition-sensitive
At least 50% of 2 big cities,119 town and 1297 unioncouncil officials haveparticipated in a capacitybuilding programme onplanning for andimplementing watersupply, sewerage anddrainage, and solid wastemanagement that areintegrated, safely managedand nutrition-sensitive
At least 90% of 2 big cities,119 town and 1297 unioncouncil officials haveparticipated in a capacitybuilding programme onplanning for andimplementing watersupply, sewerage anddrainage, and solid wastemanagement that areintegrated, safely managedand nutrition-sensitive
75
WATER RESOURCES
Pakistan is considered to be a water-stressed country (rapidly moving to water-deficit) and manyof its regions are categorised as arid. Pakistan lies in an arid and semi-arid climate zone.
Pakistan’s Water Resources
According to the AQUASTAT database on water resources53, the status in Pakistan is summarisedbelow:
Long-term annual average precipitation – 494 mm/year Surface water54 produced internally (2014) – 47.4 km3/year Ground water produced internally (2014) – 55 km3/year Overlap55 between surface water and ground water (2014) – 47.4 km3/year Internal Renewable Water Resources (IRWR) (2014) – 55 km3/year Total Actual Renewable Water Resources (TARWR) (2014) – 246.8 km3/year Dependency Ratio – 78% TARWR per inhabitant in 2014 – 1306 m3/year Fresh water withdrawal as proportion of TARWR withdrawn (MDG Indicator in 2008) – 74.35%
The World Water Report 201356 indicated that the total freshwater withdrawal in Pakistan was183.5 km3/year, with a Per Capita withdrawal of 993 m3/person/year. About 5% of freshwater waswithdrawn for domestic use, 1% of industrial use and 94% for agricultural use. About 52m3/person/year of freshwater is withdrawn for domestic use.
The Indus basin has a large groundwater aquifer covering a gross command area of 16.2 millionHectares (Ha).
In 2005, the total dam capacity was an estimated 23.36 km3. By 2012, there were three largehydropower dams and 50 smaller dams (no more than 15 m high), while 11 smaller dams wereunder construction57.
The designed live storage capacity of the three large hydropower dams in the Indus basin is 22.98km3 (Tarbela 11.96 km3, Raised Mangla 10.15 km3, which includes recent raising of 3.58 km3, andChashma 0.87 km3). The current live storage capacity of these three large hydropower dams is17.89 km3, representing an overall loss of storage of 22%58. Pakistan can barely store 30 days of
53 Water resource information by country/territory and MDG Water Indicator, FAO-AQUASTAT database, April 201654 1 Million Acre Foot (MAF) is equivalent to about 1.233 Km3
55 Overlap is water shared by both the surface water and groundwater systems56 World Water Report 2013 – Data Table 2, Freshwater withdrawal by country and sector (2013 update)57 Irrigation in Southern and Eastern Asia in Figures. Aquastat Survey 2011. FAO, Rome, 201258 Country Assistance Strategy, 2005. Pakistan’s economy running dry. World Bank, Pakistan Resident Mission, Islamabad.

76
water in the Indus Basin Irrigation System (IBIS). Each km3 of storage capacity lost means 1km3/year less water that can be supplied with a given level of reliability. There is an urgent needfor storage just to replace capacity that has been lost as a result of sedimentation. Given the highsilt loads from the young Himalayas, two large reservoirs are silting rapidly.
Per capita water availability has declined rapidly since 1951 and is currently only 1050 cubicmeters/capita, which puts Pakistan in the category of a high water-stress country59 (Fig 4). About95% of water usage is for agriculture, 1% for industrial use, and 4% for domestic and municipaluse60.
Figure 4 - Water availability (cubic metres) and population growth
(Source: State of the Environment Report (draft) 2005. Government of Pakistan, Ministry of Environment)
59 State of the Environment Report (draft) 2005. Government of Pakistan, Ministry of Environment60 Pakistan Water Sector Strategy. National Water Sector Profile, Vol 5, 2002. Ministry of Water and Power, Government ofPakistan
3446
65 84
115
139.5
158.4167.72
195
5260
3888
2751
2129
15551282
1100 1066 915
0
50
100
150
200
250
0
1000
2000
3000
4000
5000
6000
1951 1961 1971 1981 1991 2002 2006 2010 2020
Population(Million)
WaterAvailabilityCm/Person

77
Freshwater Footprints
Freshwater footprints61 are reported in terms of water volumes consumed (evaporated orincorporated into a product) or polluted per unit of time. A water footprint has three components:green, blue, and grey. The “blue water” footprint refers to use of surface water and groundwater.The “green water” footprint is the volume of rainwater consumed, which is particularly relevant inagricultural production. The “grey water” footprint is a measure of freshwater pollution and isdefined as the volume of freshwater required to assimilate a load of pollutants.
The water footprint of national consumption is defined as the total volume of freshwater that isused to produce the goods and services consumed by the inhabitant of the nation. It consists oftwo components: the internal and external water footprint of national consumption.
The internal water footprint is defined as the use of domestic water resources to produce goodsand services consumed by the nation’s population. It is the sum of the water footprint within thenation minus the volume of virtual-water export to other nations related to the export of productsproduced with domestic water resources. The external water footprint is defined as the volume ofwater resources used in other nations to produce goods and services consumed by the populationin the nation under consideration.
A study on national water footprints found that Pakistan had the following footprints for domesticand industrial sectors:
Water Footprint of Domestic Water Consumption in millions of m3/yearo Blue water footprint – 327o Grey water footprint – 2943
Water Footprint of Consumption of Industrial Products in millions of m3/year:o Blue water footprint – 148.4 (126.9 internal; 21.5 external)o Grey water footprint – 2657 (2383 internal; 274 external)
By comparison, United Kingdom has a blue water footprint of 207 and grey water footprint of 242for domestic water consumption; and an internal blue water footprint of 245.6 and grey waterfootprint of 117 for consumption of industrial products. This indicates the high degree offreshwater wastage in domestic and industrial sectors in Pakistan.
Climate Change
According to the World Water Development Report 201562, three years of repeated floods in2010, 2011 and 2012 in Pakistan inflicted serious damage on the national economy, halving itspotential economic growth. The economy grew on average at a rate of 2.9% per year during this
61 Mekonnen, M. M., and A. Y. Hoekstra. 2011. National Water Footprint Accounts: The Green, Blue and Grey Water Footprint ofProduction and Consumption. Value of Water Research Report Series No. 50. Delft, Netherlands: UNESCO-IHE Institute for WaterEducation.62 World Water Development Report 2015. Water for a Sustainable World. UNESCO on behalf of UN-Water

78
period. That is less than half the rate of 6.5% that Pakistan could potentially have achieved if it hadnot faced economic and human losses associated with flooding. Pakistan lost a total of 3,072 livesand US$16 billion to the 2010-2012 floods. An initial estimate made by the National DisasterManagement Authority of the floods’ impact shows agriculture sector losses at US$2 billion due todamages to 1.05 million acres of standing crops. Consecutive years of flooding have also pushedup the country’s inflation and unemployment rate because the flooding has disrupted supplychains, damaged major crops like sugarcane, rice and cotton, and hampered industrialproduction63.
Pakistan lies in the zone that faces one of the highest risks of climate change in the world64. Figure5 illustrates that most of Pakistan lies in the high-extreme risk category. The negative effect offloods alone is estimated to be USD 6 billion per year. The Intergovernmental Panel on ClimateChange (IPCC) has predicted that the Indus Basin is likely to face more frequent extreme eventslike floods and droughts of more severity and coverage. While climate change is likely to causemore floods, it is also likely to lead to a deepening water scarcity as well since the Indus systemdepends on glacier melt for about 45% of its flow, which is one of the highest dependency rates inthe world.
Figure 5 - Climate Change Vulnerability Index 2015
(Source: Maplecroft, 2015)
63 Pakistan Economic Survey 2010-11. Special Section 2: Flood Impact Assessment. Islamabad, Ministry of Finance.64 http://reliefweb.int/sites/reliefweb.int/files/resources/Climate_Change_2015_Press_Countries_V01.pdf
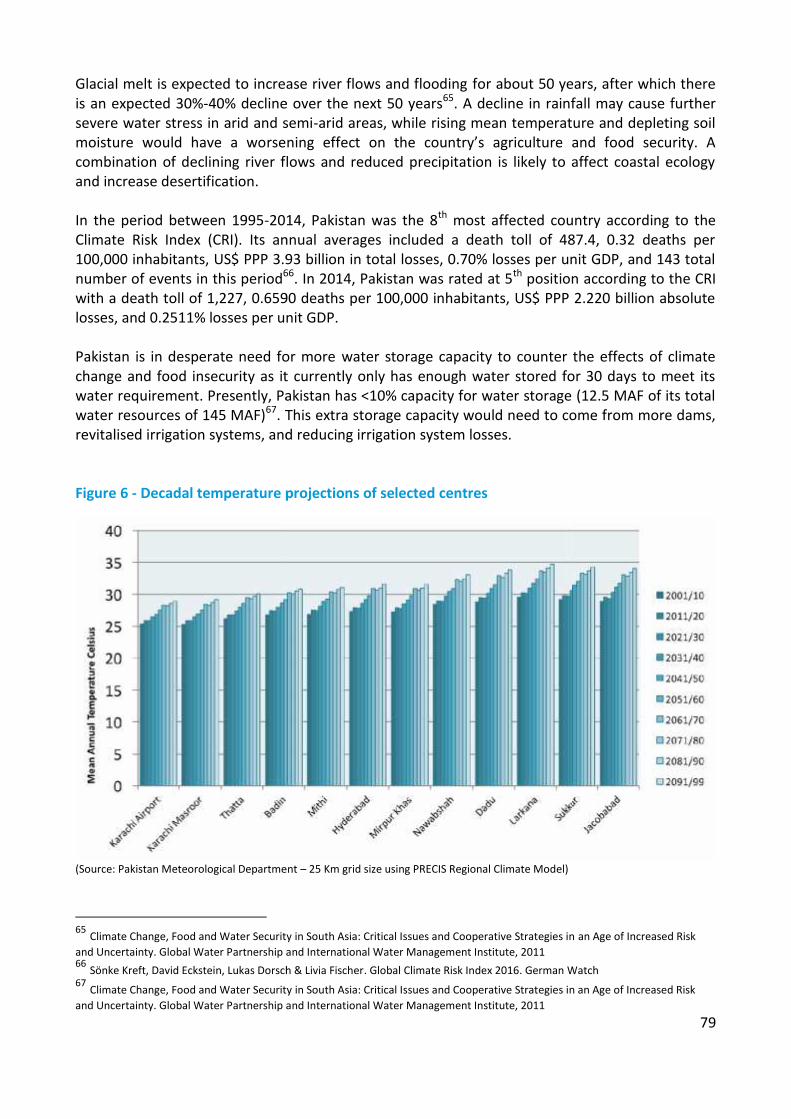
79
Glacial melt is expected to increase river flows and flooding for about 50 years, after which thereis an expected 30%-40% decline over the next 50 years65. A decline in rainfall may cause furthersevere water stress in arid and semi-arid areas, while rising mean temperature and depleting soilmoisture would have a worsening effect on the country’s agriculture and food security. Acombination of declining river flows and reduced precipitation is likely to affect coastal ecologyand increase desertification.
In the period between 1995-2014, Pakistan was the 8th most affected country according to theClimate Risk Index (CRI). Its annual averages included a death toll of 487.4, 0.32 deaths per100,000 inhabitants, US$ PPP 3.93 billion in total losses, 0.70% losses per unit GDP, and 143 totalnumber of events in this period66. In 2014, Pakistan was rated at 5th position according to the CRIwith a death toll of 1,227, 0.6590 deaths per 100,000 inhabitants, US$ PPP 2.220 billion absolutelosses, and 0.2511% losses per unit GDP.
Pakistan is in desperate need for more water storage capacity to counter the effects of climatechange and food insecurity as it currently only has enough water stored for 30 days to meet itswater requirement. Presently, Pakistan has <10% capacity for water storage (12.5 MAF of its totalwater resources of 145 MAF)67. This extra storage capacity would need to come from more dams,revitalised irrigation systems, and reducing irrigation system losses.
Figure 6 - Decadal temperature projections of selected centres
(Source: Pakistan Meteorological Department – 25 Km grid size using PRECIS Regional Climate Model)
65 Climate Change, Food and Water Security in South Asia: Critical Issues and Cooperative Strategies in an Age of Increased Riskand Uncertainty. Global Water Partnership and International Water Management Institute, 201166 Sönke Kreft, David Eckstein, Lukas Dorsch & Livia Fischer. Global Climate Risk Index 2016. German Watch67 Climate Change, Food and Water Security in South Asia: Critical Issues and Cooperative Strategies in an Age of Increased Riskand Uncertainty. Global Water Partnership and International Water Management Institute, 2011

80
Decadal temperature trends by the Pakistan Meteorological Department for selected cities/townsin Sindh illustrate (Fig 6) that by 2050 the average temperatures will have risen by 2.50 C and in2100 by about 50 C. This is expected to have disastrous effects on water lost through evaporation,and subsequent increased groundwater mining, and reduction in agriculture yield therebyworsening food insecurity.
Decadal projections of precipitation (Fig 7) show that while there may be periods of varyingrainfall, there is a general trend for mean rainfall per day to decrease over the next eighty years.
Rainfall patterns too have changed since the 2010 super floods. There has been a latitudinalredistribution of precipitation that has resulted in increased seasonal and annual precipitation anda westward shift (80-100 Km) of Monsoonal rainfall. This means that rainfall over the catchmentareas of the eastern rivers has decreased (moved away). Furthermore, the probability ofoccurrence of heavy rainfall events leading to flash floods/floods would be high over the westernrivers instead of the eastern rivers in the future. This implies that the north-west parts of thecountry are extremely vulnerable to floods. Fig 8 and Fig 9 illustrate the monthly rainfall shift tomore precipitation in non-conventional months and drier winter periods.
Figure 7 - Decadal precipitation projections for selected centres
(Source: Pakistan Meteorological Department – 25 Km grid size using PRECIS Regional Climate Model)
The latitudinal redistribution of Monsoonal rainfall westward, declining decadal projection ofmean annual rainfall and rising decadal project of average temperatures have major implicationsfor water resource management and agriculture on one hand, and the safety and sustainability ofwater and sanitation systems in the light of climatic events like floods on the other. Climatechange adaptation of water and sanitation systems would be a critical need in the future.

81
Figure 8 - Monthly Rainfall Shift
(Source: Pakistan Meteorological Department)
Jan Feb Mar Apr May Jun Jul Aug Sep Oct Nov Dec
100 mm ----Monthly Rainfall Shift
Jan Feb Mar Apr May Jun Jul Aug Sep Oct Nov Dec
100 mm ----Climate: 1991-2010
Jan Feb Mar Apr May Jun Jul Aug Sep Oct Nov Dec
100 mm ----Climate: 2011-2020
DRY
WET
WET
WETTEST
DRY
DRIER
DRIER
DRIEST
Winter Monsoon
Climate: 1991-2010
Climate: 2010-2020
Climate: 1961-1990
Wet
Wet
DryDry

82
Figure 9 - Projected climate 2020-2030
(Source: Pakistan Meteorological Department)
Vulnerability to Climate Change
Analysis of the recent evidence emerging from flood affected areas regarding the health, waterand sanitation repercussions are of serious concern:
Health facilities and sanitation infrastructure was severely damaged Access to safe water and sanitation was severely curtailed thereby increasing the vulnerability
of people to infectious and water borne diseases such as diarrhoea, typhoid, intestinal wormsand hepatitis. In many cases water pipes were contaminated with sewage water and the use oftoilets in most flood affected districts dropped by 50%
The incidence of cholera, malaria and polio increased over the past one year in Pakistan
A ranking of agro-ecological zones in Pakistan according to their vulnerability68 to climate changeshows the following:
68 Malik SM, Awan H, Khan N: Mapping vulnerability to climate change and its repercussions on human health in Pakistan.Globalisation and Health 8:31, 2012
Jan FebMar Apr May Jun Jul Aug Sep Oct Nov Dec
Rainfall
Wet Period Dry Period
6 Months (Mar – Aug)…………… Wet Window6 Months (Sep – Feb)…………… Dry Window
Winter
Monsoon

83
Balochistan is the most vulnerable region with high sensitivity and low adaptive capacity. Themajor threats posed by climate change in Balochistan include droughts and increase in meantemperature
Low-intensity Punjab (mostly consisting of South Punjab) is the next most vulnerable region.The region is prone to floods as well as rise in temperature. The region has a high degree ofsensitivity and low adaptive capacity
Cotton/Wheat Sindh is the third most vulnerable region. It is vulnerable to both floods anddroughts. The degree of sensitivity is high. However, the coping capacity falls in the 'medium'rank. The rain-fed (Barani) Punjab has a high degree of exposure to climate change due to itsgreater variability in precipitation, but relatively better adaptive capacity
In a situation where Pakistan is ploughing through a state of development deficiency, building itsadaptive capacity to climate change is challenging to say the least. However, the formulation ofthe new National Climate Change Policy 2012 is an encouraging step. Decadal forecasts ofincreasing floods and droughts suggest that mitigation planning for 2030 and 2050 needs to beginnow.
Water Resource Development in Sindh69, 70
The basic lifeline of Sindh province, and indeed Pakistan, is the River Indus. It is one of the twenty-one largest rivers in the World with regard to annual flow. It is 3,180 km long and crosses China,India and Pakistan with a watershed of 1.165 million sq. km before merging into the Arabian Seanear Thatta.
The main flow of surface water is through the irrigation canal system. The water from the RiverIndus is diverted to the canal system through barrages, while the main canals are further dividedinto branch canals, distributaries, minor canals and water courses. The canal system in Sindh hasthree barrages, namely, Guddu Barrage, Sukkur Barrage and Kotri Barrage (Fig 10).
The total gross command area (GCA) is 14.391 million acres, with 3 Barrages, 14 main canals,1,462 branch canals, distributaries and minors, and 42,000 water courses. More than 95% of theirrigation is from canal water. The system runs 13,234 miles in form of main canals, branch canals,distributor canals and minor canals. Approximately 80% of the area is underlain by salinegroundwater. Apart from the irrigation system, Sindh has a drainage system which as such is notcontiguous and integrated. There are 13 existing surface drainage systems in Sindh, which serve atotal area of over 6.2 million acres (2.5 MHA) and have an aggregate length of about 2,981 miles(4,800 km). In addition, there are two sub-surface drainage systems, which serve an area of 0.10million acres (0.04 MHA).
69 Nazeer Essani, General Manager, SIDA (Sindh Irrigation & Drainage Authority). Water Sector Development in Sindh: A case ofIrrigation Reforms, 200970 Sindh Water Resources Development and Management Investment Programme, 2010. Sindh Irrigation and Power Developmentand Asian Development Bank
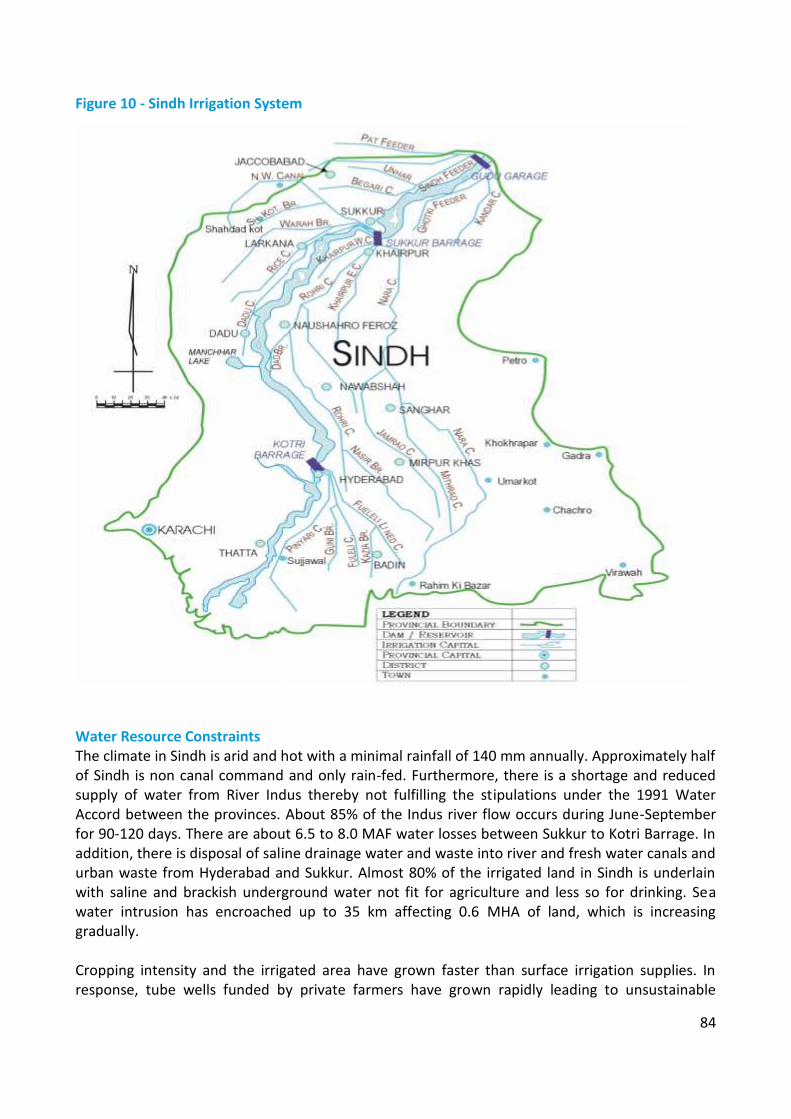
84
Figure 10 - Sindh Irrigation System
Water Resource ConstraintsThe climate in Sindh is arid and hot with a minimal rainfall of 140 mm annually. Approximately halfof Sindh is non canal command and only rain-fed. Furthermore, there is a shortage and reducedsupply of water from River Indus thereby not fulfilling the stipulations under the 1991 WaterAccord between the provinces. About 85% of the Indus river flow occurs during June-Septemberfor 90-120 days. There are about 6.5 to 8.0 MAF water losses between Sukkur to Kotri Barrage. Inaddition, there is disposal of saline drainage water and waste into river and fresh water canals andurban waste from Hyderabad and Sukkur. Almost 80% of the irrigated land in Sindh is underlainwith saline and brackish underground water not fit for agriculture and less so for drinking. Seawater intrusion has encroached up to 35 km affecting 0.6 MHA of land, which is increasinggradually.
Cropping intensity and the irrigated area have grown faster than surface irrigation supplies. Inresponse, tube wells funded by private farmers have grown rapidly leading to unsustainable

85
exploitation of groundwater. The irrigation infrastructure, due to high discharges from the Indus,is operating under flows that are higher than the design discharge. This reduces operationalefficiency. The whole irrigation system suffers from deferred maintenance, especiallydistributaries and minors, and drains are neglected. Often, small channels operate without controlgates and regulators.
There is no water storage facility in Sindh except the Chotiary reservoir (0.7 MAF) which runslower than capacity. There are 10 declared wetlands of international importance (Ramsar Sites).However, there is not enough water to feed them through regular supply, seepage or rain, andthis poses a major environmental threat. The River Indus below Kotri is dry. Furthermore, theurban water consumer is growing fast- Karachi alone takes 1,200 cusecs and its demand isincreasing. By 2025, Sindh requires additional 25 MAF to meet agriculture and non agriculturedemand. Sindh also needs water for development of Thar Coal, which is a major challenge.
The Sindh canal command is 5.1 MHA. About 1.3 MHA is cultivable waste that could be broughtunder irrigation if water were available. About 50% of the total Sindh Canal Command has nodrainage facility. As a result, 32% of the irrigated area is saline and 43% waterlogged, with Badinand Thatta being 80% or more. The drainage effluent from Punjab and Balochistan poses a waterquality threat to the River Indus from upper riparian and thereby affecting lower riparian Sindh.Furthermore, 2,135 km is flood protective embankment-bund and heavy floods can causedisasters as has been witnessed in recent years. The River Indus provides an uninterrupted supplyof water to Karachi Metropolis through 100 miles of transportation. However, there is no majorrevenue/ recovery. The irrigation system efficiency is reduced to approximately 30%.
Distribution inequities are another major impediment to water resource management in Sindh.Poor, tail end and small farmers, women and peasants are most vulnerable. The rural and urbanelites have switched from land to fish farms thereby drawing more water than is allocated. Watertheft and tampering is commonplace, while use of Illegal pumping machines and cuts are commonas there no checks and control.
Direct Outlets (DOs) form a serious constraint to judicious water distribution. Only the powerfuland influential elite can get a DO sanctioned. Approximately 20-30% of irrigated command isserved by DOs, especially in the Nara Canal. The DOs constitute a major constraint in distributionequities because from a practical standpoint, DOs do not come under rotation.
Rainwater Harvesting
PHED Karachi has completed Ten Small Dams (Retention Weirs) in rural areas of Karachi and one isstill in progress with different pounding capacity to harness rain water to raise ground water fordrinking water and agricultural purposes. In the recent rains in Karachi, the maximum number ofthese dams filled to full capacity.

86
Strategy
Water ResourcesStrategicObjectives/Outcomes
Short Term Actions1 - 3 years
Medium Term Actions4 - 6 years
Long Term Actions7 - 10 years
Improved water resourceutilisation through efficientproject design andexecution
P&DD to issue thefollowingAdvisories/Circulars:
All future reservoirs – basicdesign will have outlets fordrinking water dependingon storage capacity
Gravity flow lines are usedwhere feasible
Every embankment musthave provision for pipeoutlet for drinking water
There must be waterstorage provision in designfor outlet in times ofcalamity – all fieldengineers would need tocomply and ensure that adrinking water supplycomponent was part oftheir projects and ensurethat a share for drinkingwater is allocated
It is mandatory to includeGIS mapping for everydrinking water supplyproject
Every new drinking watersupply scheme must havean outlet for distribution tolocal schools and healthfacilities - All newPHE&RDD Water Supplyschemes must ensure thatthey provide an extensionwater pipe to the nearbyschool with its water tank
District profiles developedfor water resourcemanagement anddevelopment
Conduct a study on waterresource management anddevelopment in eachdistrict and map availablewater resources withpotential for domestic andmunicipal use (5 districts inshort-term) and
Conduct a study on waterresource management anddevelopment in eachdistrict and map availablewater resources withpotential for domestic andmunicipal use (10 districtsin medium-term) and
Conduct a study on waterresource management anddevelopment in eachdistrict and map availablewater resources withpotential for domestic andmunicipal use (14 districtsin long-term) and
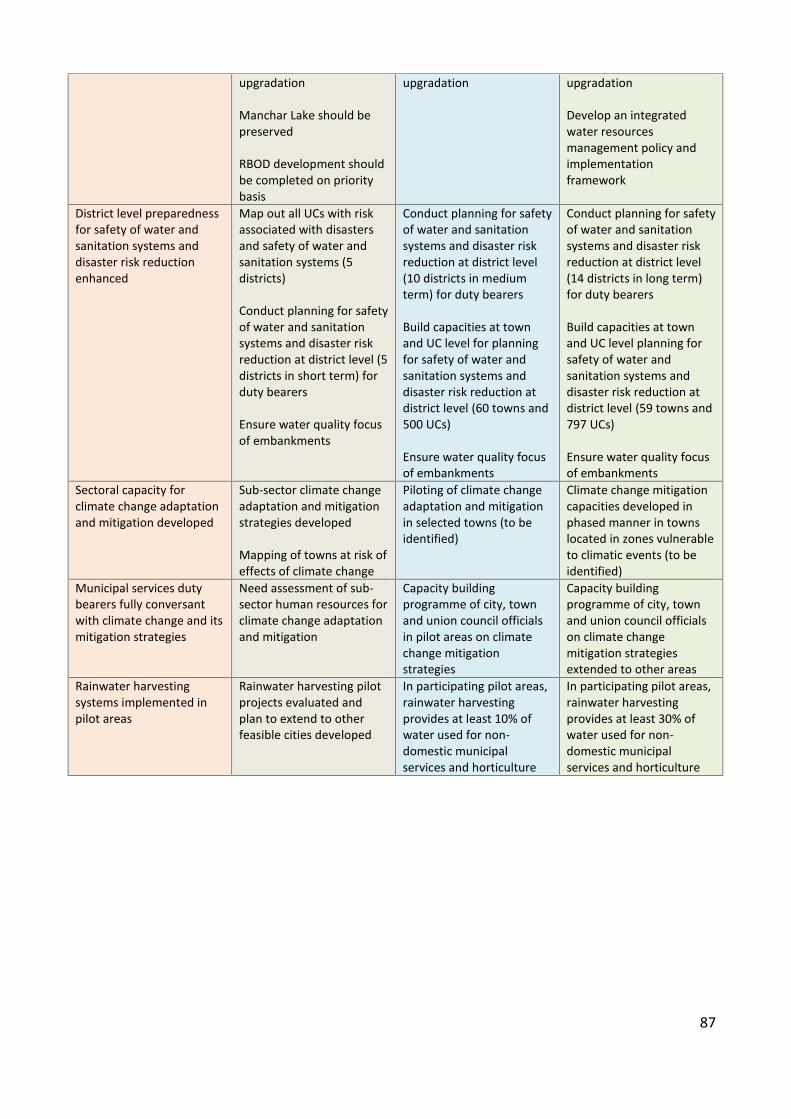
87
upgradation
Manchar Lake should bepreserved
RBOD development shouldbe completed on prioritybasis
upgradation upgradation
Develop an integratedwater resourcesmanagement policy andimplementationframework
District level preparednessfor safety of water andsanitation systems anddisaster risk reductionenhanced
Map out all UCs with riskassociated with disastersand safety of water andsanitation systems (5districts)
Conduct planning for safetyof water and sanitationsystems and disaster riskreduction at district level (5districts in short term) forduty bearers
Ensure water quality focusof embankments
Conduct planning for safetyof water and sanitationsystems and disaster riskreduction at district level(10 districts in mediumterm) for duty bearers
Build capacities at townand UC level for planningfor safety of water andsanitation systems anddisaster risk reduction atdistrict level (60 towns and500 UCs)
Ensure water quality focusof embankments
Conduct planning for safetyof water and sanitationsystems and disaster riskreduction at district level(14 districts in long term)for duty bearers
Build capacities at townand UC level planning forsafety of water andsanitation systems anddisaster risk reduction atdistrict level (59 towns and797 UCs)
Ensure water quality focusof embankments
Sectoral capacity forclimate change adaptationand mitigation developed
Sub-sector climate changeadaptation and mitigationstrategies developed
Mapping of towns at risk ofeffects of climate change
Piloting of climate changeadaptation and mitigationin selected towns (to beidentified)
Climate change mitigationcapacities developed inphased manner in townslocated in zones vulnerableto climatic events (to beidentified)
Municipal services dutybearers fully conversantwith climate change and itsmitigation strategies
Need assessment of sub-sector human resources forclimate change adaptationand mitigation
Capacity buildingprogramme of city, townand union council officialsin pilot areas on climatechange mitigationstrategies
Capacity buildingprogramme of city, townand union council officialson climate changemitigation strategiesextended to other areas
Rainwater harvestingsystems implemented inpilot areas
Rainwater harvesting pilotprojects evaluated andplan to extend to otherfeasible cities developed
In participating pilot areas,rainwater harvestingprovides at least 10% ofwater used for non-domestic municipalservices and horticulture
In participating pilot areas,rainwater harvestingprovides at least 30% ofwater used for non-domestic municipalservices and horticulture

88
WATER SUPPLY
Urban Water Supply
Coverage
The recent PSLM 2014-1571 survey shows that tap water (69%) is the prominent source of drinkingwater supply in households urban areas followed by motor pump (11%) (Fig 11).
Figure 11 - Sources of urban water supply in Sindh (PSLM 2014-15)
(Source: Pakistan Social and Living Standards Measurement Survey, 2014-15)
Figure 12 shows that Karachi, Mirpur Khas and Hyderabad had the highest percentages of tapwater at 85%, 79.0% and 72% households respectively. The lowest rates for tap water were foundin Naushahro Feroze (0%), Larkana (1%), Shikarpur (3%) and Jacobabad (4%). High rates oftanker/truck or vendor were found in Jacobabad (84.7%), Shahdadkot (26.9%), Karachi (9.8%) andThatta (9.7%). The highest use of open well was found in Tharparkar (17.3%).
71 Pakistan Social and Living Standards Measurement Survey 2014-15. Pakistan Bureau of Statistics
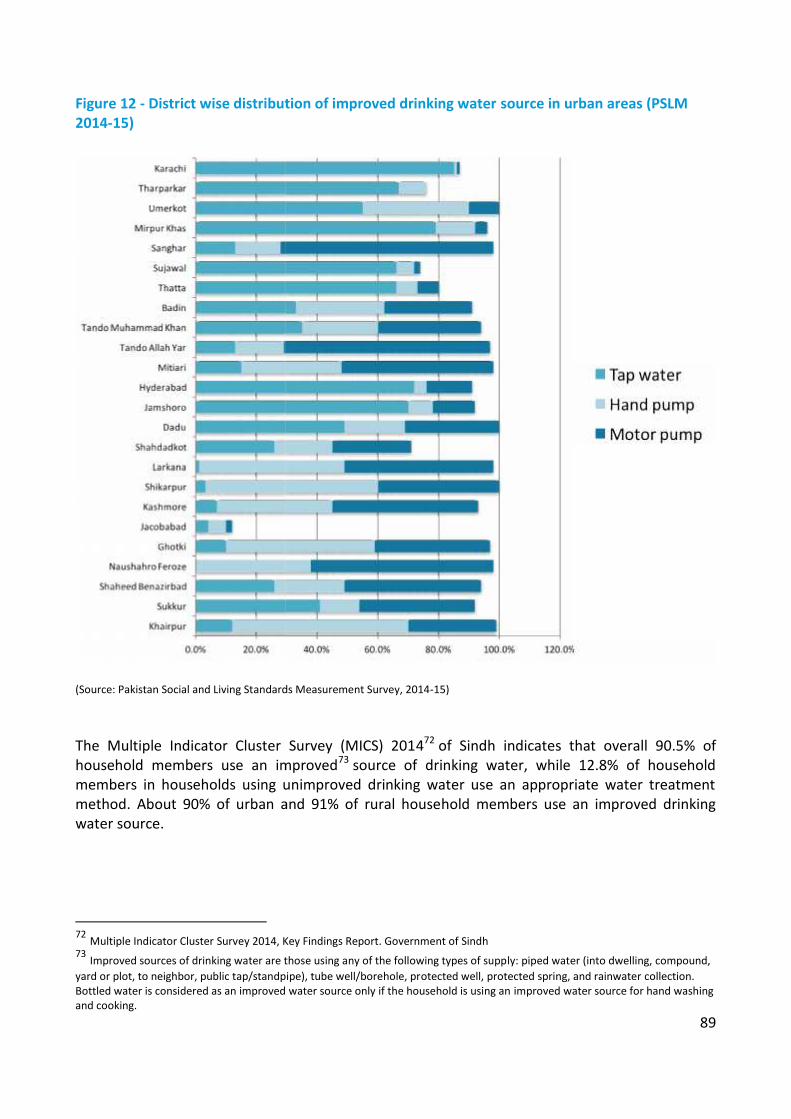
89
Figure 12 - District wise distribution of improved drinking water source in urban areas (PSLM2014-15)
(Source: Pakistan Social and Living Standards Measurement Survey, 2014-15)
The Multiple Indicator Cluster Survey (MICS) 201472 of Sindh indicates that overall 90.5% ofhousehold members use an improved73 source of drinking water, while 12.8% of householdmembers in households using unimproved drinking water use an appropriate water treatmentmethod. About 90% of urban and 91% of rural household members use an improved drinkingwater source.
72 Multiple Indicator Cluster Survey 2014, Key Findings Report. Government of Sindh73 Improved sources of drinking water are those using any of the following types of supply: piped water (into dwelling, compound,yard or plot, to neighbor, public tap/standpipe), tube well/borehole, protected well, protected spring, and rainwater collection.Bottled water is considered as an improved water source only if the household is using an improved water source for hand washingand cooking.
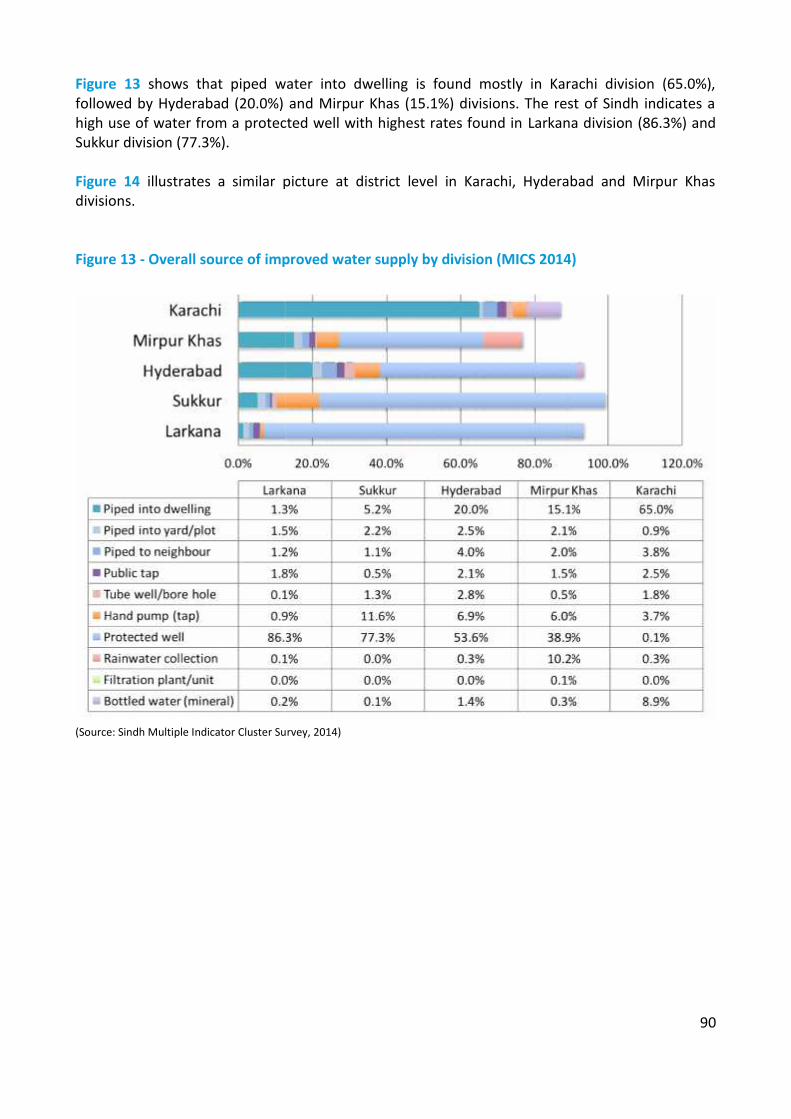
90
Figure 13 shows that piped water into dwelling is found mostly in Karachi division (65.0%),followed by Hyderabad (20.0%) and Mirpur Khas (15.1%) divisions. The rest of Sindh indicates ahigh use of water from a protected well with highest rates found in Larkana division (86.3%) andSukkur division (77.3%).
Figure 14 illustrates a similar picture at district level in Karachi, Hyderabad and Mirpur Khasdivisions.
Figure 13 - Overall source of improved water supply by division (MICS 2014)
(Source: Sindh Multiple Indicator Cluster Survey, 2014)

91
Figure 14 - Overall source of improved water supply by district (MICS 2014)
(Source: Sindh Multiple Indicator Cluster Survey, 2014)
91
Figure 14 - Overall source of improved water supply by district (MICS 2014)
(Source: Sindh Multiple Indicator Cluster Survey, 2014)
91
Figure 14 - Overall source of improved water supply by district (MICS 2014)
(Source: Sindh Multiple Indicator Cluster Survey, 2014)

92
Rural Water Supply
The PHE&RDD of the Government of Sindh is the department responsible for providing access tosafe drinking water in the rural areas of the province. Presently, data regarding water supplyschemes and coverage at district and provincial levels is maintained by LG&TPD and PHE&RDD.
Coverage
Figure 15 - Sources of rural water supply in Sindh (PSLM 2014-15)
(Source: Pakistan Social and Living Standards Measurement Survey, 2014-15)
The recent PSLM 2014-1574 survey shows that hand pump is the prominent source of drinkingwater supply in rural areas followed by motor pump (Fig 15). However, about 18% of householdsuse ‘other’ sources of drinking water supply usually from unimproved sources (unprotected well,unprotected spring, tanker-truck, cart with small tank/drum, surface water75 etc).
Fig 16 shows that Karachi and Jamshoro districts had the highest percentages of tap water at 54%and 38% households respectively. The lowest rates of tap water were found in Kashmore (0%),Khairpur (0.2%) and Shikarpur (0.3%). Kashmore, Jacobabad and Tando Muhammad Khan had highrates of use of hand pumps in 98%, 93% and 93% respectively. The highest rate of use of motorpump was found in Dadu at 34%.
74 Pakistan Social and Living Standards Measurement Survey 2014-15. Pakistan Bureau of Statistics75 River, stream, dam, lake, pond, canal, irrigation scheme

93
Figure 16 - District wise distribution of improved drinking water source in rural areas (PSLM2014-14)
(Source: Pakistan Social and Living Standards Measurement Survey, 2014-15)
The preliminary results of Sindh MICS 2014 indicate that other than Karachi districts that attainabout 20%-30% water treatment, all other districts rate less than 20% for water treatment, eventhough a large proportion of districts are using improved water for drinking (Fig 17).
Figure 18 illustrates the proportion of households without drinking water on premises. Tharparkarhas the highest percentage of households without drinking water on premises (89.7%) with aprovincial average of 25.5%.

94
Figure 17 - Status of improved water supply and water treatment (MICS 2014)
(Source: Sindh Multiple Indicator Cluster Survey, 2014)
94
Figure 17 - Status of improved water supply and water treatment (MICS 2014)
(Source: Sindh Multiple Indicator Cluster Survey, 2014)
94
Figure 17 - Status of improved water supply and water treatment (MICS 2014)
(Source: Sindh Multiple Indicator Cluster Survey, 2014)

95
Figure 18 - Percentage households without drinking water on premises (MICS 2014)
(Source: Sindh Multiple Indicator Cluster Survey, 2014)
95
Figure 18 - Percentage households without drinking water on premises (MICS 2014)
(Source: Sindh Multiple Indicator Cluster Survey, 2014)
95
Figure 18 - Percentage households without drinking water on premises (MICS 2014)
(Source: Sindh Multiple Indicator Cluster Survey, 2014)

96
Water Supply Issues
Work done by the Urban Unit Government of Sindh has identified the following key challenges indrinking water supply76:
Weak institutional arrangements with overlapping of roles and responsibilities
Weak coordination mechanisms
High proportion of non-revenue water
Dysfunctional water supply and sanitation schemes
Ageing infrastructure
Water and sanitation schemes driven by political interests – they are not demand driven andnot based on need assessment
Poor water quality from polluted and contaminated sources
Inadequate waste water treatment facilities
High dependency on surface water which is depleting
Issues with Karachi Water Supply
Karachi faces a chronic problem of water shortage in supplies to meet the constantly growingdemand. There are some major challenges in the area of management of services and the supplydeficiencies in both quantity and quality of water.
The water demand amounts to approximately 752 MGD (in 2005); against this demand thecapacity of the supply system is 646 MGD, giving rise to a shortfall of 106 MGD in bulk supply77.But the amount of water supplied to the consumers by the service remains short by about 35%due to losses in transmission from leakages, friction and large scale unauthorised diversion orthefts. To meet the current shortages adequately and the demand up to 2020 (when themetropolitan population will increase to 27.5 million), the bulk water supply from the Indus andother sources will need to be augmented to double the quantum of the present supply. Figure 19illustrates the existing water supply network in Karachi.
About 60% of the households are connected to the supply network. Under the present conditions,water supply is irregular and inequitable. Water is supplied only for a few hours, generally fourhours daily and that too at a very low pressure. Inequitable distribution marks the supply systemas some areas receive more water, and some too little to meet their needs. There are some areaswhich are not connected to the system and get water on payment through tankers.
There is also a serious concern about water quality. The existing filtration facilities are not enoughto subject all supplies to clarifier process; about 60% of water is filtered and the rest is only
76 Khalid M Siddiqui, DG UP&SP. State of Urban Water Supply & Sanitation Sector in Sindh. Pakistan Urban Forum Karachi 201477 Adapted from Karachi Strategic Development Plan 2020. Master Plan Group of Offices, City District Government Karachi

97
disinfected through chlorination. Some contamination may also occur in transmission to the endconsumers.
Improvements in the system depend on public financing, for the existing tariffs only generateinsufficient revenues to cover operational and maintenance costs. Enhancement of tariffs is clearlylinked to the economic structure of consumer population besides improvement in service delivery.Efficiency of the delivery system is intricately tied up with the financial viability and relatedmanagement issues.
Figure 19 - Existing Water Supply Network for Karachi
(Source: Karachi Strategic Development Plan 2020. Master Plan Group of Offices, City District Government Karachi)
Table 9 summarises key problems affecting the water supply system in Karachi.

98
Table 9 - Major problems with the water supply and sanitation system in Karachi
Major Problems Symptoms ConsequencesPoor conditions of waterdistribution system
An inflow of 550 MGD: Only55 % of total waterrequirement
Water demand to reach 1,400MGD by 2020, Potential forsaving 1/3rd of suppliedwater.
Lack of autonomy Intermittent water supply-available 2-4 hours per day
High level of leakage Low system pressure Contamination: 30,000
people, mostly children, dieeach year in the city78
Inequitable distribution 8 million people (40% of city
population) have access toSewerage system
Customers’ distrust in KW&SBand the services it provides
Distribution System: 40-45years
Reluctance to pay for theservices
Insufficient revenues Access levels to water
declined: 91 % (2007) to 89%(2013)
Less than 10% of sewagewater treated.
Weak financial capacity High level of receivables
Tanker supplies Illegal connections Low tariffs 6.5 employees per 1000
connections
Insufficient revenues Low morale of KW&SB staff JICA recommendations-USD
250m/Year investment for 10years – which is 0.6 % of CityGDP
Absence of measured suppliesand volumetric chargingsystem
De-facto bankrupt utility (gapof USD 9 million / month)
Delay in capital replacement Delay in system expansion Poor current maintenance Poor working environments
(offices & equipment) Reliance on Government
funding (for capital andoperational expenditure)
Collection in past 5 years:declined - 61% to 59 %
Yearly expenditure: US$ 106million vs US$ 60 millionrevenue, yearly electricity billonly US$ 66m,
Outstanding arrearsestimated at $460M: $179M(retail); $281M (bulk), NonWater Revenue estimated to60% (or USD240 million in2015)
Deteriorating services Deteriorating assets Low morale of KW&SB staff Political interference
(Source: Adapted from The Study on Water Supply and Sewerage System in Karachi in the Islamic Republic of Pakistan. Report. VolII, 2008. Japan International Cooperation Agency (JICA) and Karachi Water & Sewerage Board (KW&SB); and Workshop on ReformLed Investment Plan of KW&SB 2016 Karachi)
78 WWF 2011 Report
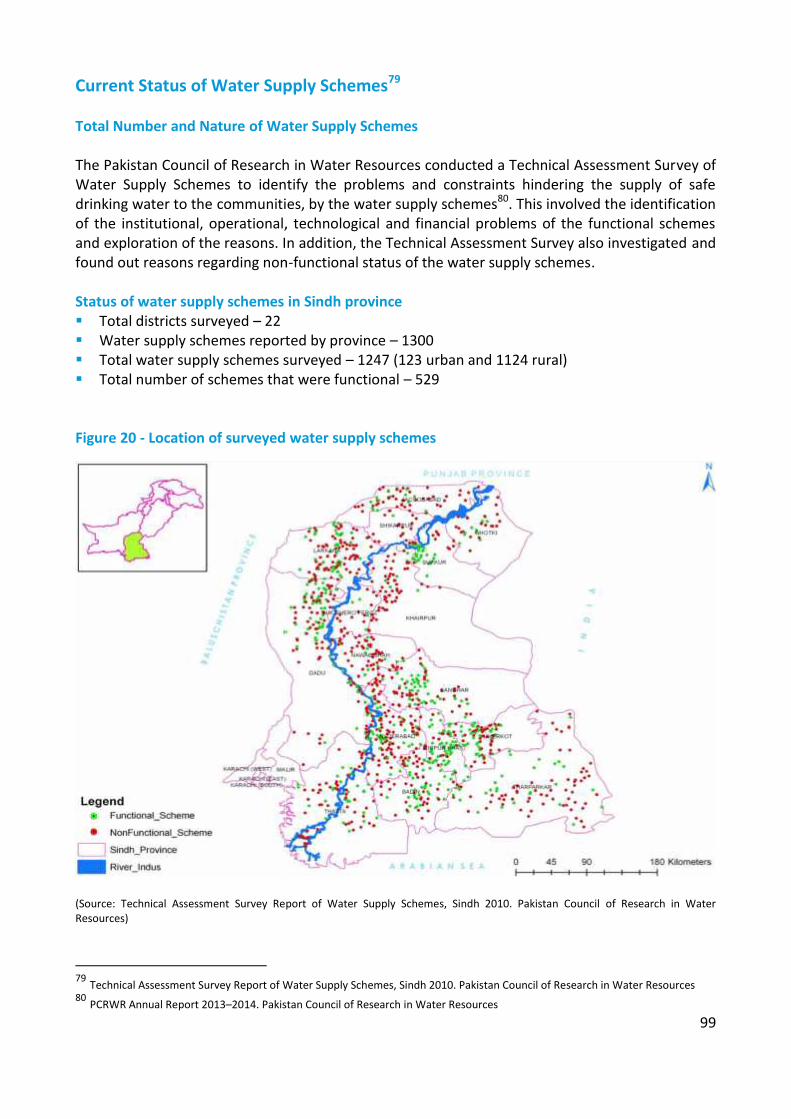
99
Current Status of Water Supply Schemes79
Total Number and Nature of Water Supply Schemes
The Pakistan Council of Research in Water Resources conducted a Technical Assessment Survey ofWater Supply Schemes to identify the problems and constraints hindering the supply of safedrinking water to the communities, by the water supply schemes80. This involved the identificationof the institutional, operational, technological and financial problems of the functional schemesand exploration of the reasons. In addition, the Technical Assessment Survey also investigated andfound out reasons regarding non-functional status of the water supply schemes.
Status of water supply schemes in Sindh province Total districts surveyed – 22 Water supply schemes reported by province – 1300 Total water supply schemes surveyed – 1247 (123 urban and 1124 rural) Total number of schemes that were functional – 529
Figure 20 - Location of surveyed water supply schemes
(Source: Technical Assessment Survey Report of Water Supply Schemes, Sindh 2010. Pakistan Council of Research in WaterResources)
79 Technical Assessment Survey Report of Water Supply Schemes, Sindh 2010. Pakistan Council of Research in Water Resources80 PCRWR Annual Report 2013–2014. Pakistan Council of Research in Water Resources

100
The results showed that out of a total of 1247 water supply schemes in the province, 718 (58%)are non-functional (Fig 20). Of these non-functional schemes, 75% are temporarily closed whilethe remaining (25%) appear to be permanently closed.
Reasons for Non Functional (temporarily closed) Water Supply Schemes
Lack of funds Missing/theft/damage of electrical and mechanical components Breakage in transmission/distribution network Shortage of water Lack of interest Community dispute/collection of O&M funds/non-payment of electricity bill Shortage of staff/improper design Low pressure Damage of well Rehabilitation of scheme Flood affected
Period of construction of Water Supply Schemes
The Technical Assessment Survey81 revealed that 107 schemes (9%) are older than 27 years.Nearly 16% of the schemes are 20 to 25 years old, 28% schemes are 15 –20 years old, whereas47% schemes are 10 – 15 years old (Fig 21). During the 10 years’ period (1982 to 1991) that maybe considered much older, a higher number of schemes were constructed in all the tehsils.
Most of the schemes have used galvanised iron pipes for the distribution system. The useful life ofthis material is less than 20 years, and therefore requires rehabilitation of even the functionalolder water supply schemes.
81 Technical Assessment Survey Report of Water Supply Schemes, Sindh 2010. Pakistan Council of Research in Water Resources

101
Figure 21 - Water Supply Schemes by construction period
(Source: Computed from Technical Assessment Survey Report of Water Supply Schemes, Sindh 2010. Pakistan Council of Researchin Water Resources)
101
Figure 21 - Water Supply Schemes by construction period
(Source: Computed from Technical Assessment Survey Report of Water Supply Schemes, Sindh 2010. Pakistan Council of Researchin Water Resources)
101
Figure 21 - Water Supply Schemes by construction period
(Source: Computed from Technical Assessment Survey Report of Water Supply Schemes, Sindh 2010. Pakistan Council of Researchin Water Resources)

102
Recent Initiatives for Water Supply by Government of Sindh
Sindh Cities Improvement Programme
Sindh Cities Improvement Investment Programme (SCIP) is an Asian Development Bank (ADB)assisted US$ 400 million infrastructure and service delivery reform programme, which aims toimprove water supply, wastewater management, and solid waste management (SWM) services in20 participating secondary cities through establishment of government-owned, professionallymanaged Urban Services Corporations; urban sector reforms and investment in water supply,wastewater and solid waste management infrastructure. This has been initiated as the NorthSindh Urban Services Corporation (NSUSC). There are plans to establish two other similarcorporations – Central Sindh Urban Services Corporation (CSUSC) and Southern Sindh UrbanServices Corporation (SSUSC).
Northern Sindh Urban Services Corporation
The North Sindh Urban Services Corporation has been established under the CompaniesOrdinance 1984 for the secondary cities of the Northern cluster of Sindh Province. This UrbanServices Corporation aims to aggregate participating Tehsil Municipal Administration’s (TMAs)water supply, waste water and solid waste management operation in a single institution toleverage economies of scale, introduce new skills and management, and increase focus onoperations, maintenance and financial management. Presently, NSUSC is being implemented in 7cities (Sukkur/New Sukkur, Rohri, Khairpur Mirs, Shikarpur, Larkana, Jacobabad and Ghotki). Inparticipating TMAs, the focus of water supply system includes:
Network mapping and planning Source identification, development, improvement, and augmentation Raw water transmission, storage, and treatment Treatment plant rehabilitation Treated water storage, transmission, and distribution Distribution network and service connection improvement Leak detection and reduction; bulk and individual water metering Water quality monitoring Ground water testing Access current and future water demand
Desalination Plants
The Pakistan Water and Power Development Authority (WAPDA) has completed the task ofinstalling six desalination plants along Manchar lake for providing potable water to the peopleresiding in the areas adjacent to the lake. There are also plans underway to install desalinationplants with a capacity to convert several million gallons per day (MGD) of seawater into potablewater to supplement the drinking water supply needs of Karachi.

103
K-IV Drinking Water Project
Greater Karachi Bulk Water Supply Scheme K–IV has been envisioned at a cost of Rs. 25.522 billionwith 50 % share of Government of Sindh, to address the water shortage issues of Karachi82.Presently, Karachi is drawing 1200 cusecs (650 MGD) approved quota of water from Indus, whichis insufficient for the ever-increasing water demand of 24 million people of Karachi. K-IV project isplanned for provision of additional 1200 cusecs (650 MGD) in 3 phases from Keenjhar Lake whencomplete by 2025. Government of Sindh has allocated 485 cusecs (260 MGD) of additional waterquota for the first phase of K-IV project, which will be completed by 2018. Additionally, theprovincial government has plans to revive the Hub Dam and generate another 100 MGD ofdrinking water.
Matching Grants from Federal Government
Matching grants from the Federal Government includes expansion of the raw water filtration plantand supply network for supplying clean water to Hyderabad (Hyderabad Package), an urban watersupply scheme in Benazirabad, and a water supply and drainage scheme in Tando Jam (HyderabadPackage) (District Hyderabad).
Special Initiatives
The Government of Sindh intends to design 2,500 Ultra Filtration (UF) and Reverse Osmosis (RO)Plants in 4 Phases through Special Initiatives83 till 2018. The Government completed installationof 500 plants under Phase-I all over Sindh, out of which 361 are fully functional. Out of 750 plantsunder Phase-II, 180 Plants are installed and functional. 750 RO Plants under Phase-III are approvedentirely for district Tharparkar, out of which 330 plants are fully functional. In addition, the SindhCoal Authority also established 8 RO Plants for Tharparkar.
The Government is developing a database on drinking water quality in Karachi, Hyderabad andKotri.
The Karachi Water and Sewerage Board (KWSB) successfully maintained operation of 11,000 kmpipelines, 1,100 million gallons of fluid, 400,000 valves and 250,000 manholes during the secondyear of the Government (2014-2015).
Thar Coal
As part of the Thar Coal Project under Energy, installation of RO desalination plant 25 villagesTharparkar, upgradation 2 RO plants Mithi and Islamkot, and installation 6 RO desalination plants6 villages Tharparkar is under way.
82 Budget 2015-16. Budget Speech, Minister for Finance, Finance Department, Government of Sindh83 Adapted from Sindh Province Assessment of the Quality of Governance 2014-15. Pakistan Institute of Legislative Developmentand Transparency (PILDAT)

104
Other Initiatives
A project is under way with the Information, Science and Technology Department for a Barani areawater availability study and pilot water supply project in Malir.
The Irrigation Department is upgrading the Kinjhar Lake system for water supply to Karachi.
Construction of drains, sewerage and water supply system has been initiated in different KatchiAbadies in Shaheed Benazirabad, Khairpur, Larkana, Sukkur, Hyderababd, Mirpurkhas, Thatta andKarachi.
Water supply schemes are also being implemented through the Community DevelopmentProgramme for Sustainable Development Goals in the form of Federal Government grants toMembers of Provincial Assembly (MPAs), and through the Social Protection Priority DevelopmentProgrammes in the form of Federal Government grants to Members of the National Assembly(MNAs).

105
Strategy
Water SupplyStrategicObjectives/Outcomes
Short Term Actions1 - 3 years
Medium Term Actions4 - 6 years
Long Term Actions7 - 10 years
URBAN WATER SUPPLYAll cities, towns and UCshave surveys, strategiesand action plans forintegrated water supply,water safety, sewerage anddrainage, storm waterdrainage and solid wastemanagement
(common to water supply,sanitation and solid waste)
All cities have completedbaseline surveys, GISmapping and strategies,and start implementingaction plans for integratedwater supply, water safety,sewerage and drainage,storm water drainage andsolid waste managementon need basis
Develop integrated watersupply, water safety,sanitation, storm waterdrainage and solid wastemanagement action plansfor all cities
At least 50% of UCs (500)have completed baselinesurveys, GIS mapping andstrategies, and startimplementing action plansfor integrated watersupply, water safety,sewerage and drainage,storm water drainage andsolid waste managementon need basis
Develop integrated watersupply, water safety,sanitation, storm waterdrainage and solid wastemanagement action plansfor 500 UCs
At least 100% UCs (797)have completed baselinesurveys, GIS mapping andstrategies, and startimplementing action plansfor integrated watersupply, water safety,sewerage and drainage,storm water drainage andsolid waste managementon need basis
Develop integrated watersupply, water safety,sanitation, storm waterdrainage and solid wastemanagement action plansfor 797 UCs
Improved and safelymanaged water supplycoverage enhanced tomeet access gap
Develop an SOP for all newand existing water supplyschemes to provideimproved and safelymanaged drinking waterwhich is: Accessible: located on
premises Available: available
when needed Safe: free of faecal and
priority chemicalcontamination
Augmented byimproved transmissionand distributionnetworks andincreased overheadreservoir capacity
Plan and implement safelymanaged water supplyschemes to reduce accessgap By 20% in short term improved availability
from 4 hours to 6hours daily
piped drinking waterthat is ‘fit for drinking;in at least 25% of areas
Plan and implement safelymanaged water supplyschemes to reduce accessgap By 50% in medium
term improved availability
from 6 hours to 8hours daily
piped drinking waterthat is ‘fit for drinking;in at least 50% of areas
Execution of schemes oncost sharing basis i.e.Community invests inmaintenance and internalcomponent, whileGovernment invests forexternal component
Install water flow monitorsat tube wells; alsointroduce flow monitors atvalves
Plan and implement safelymanaged water supplyschemes to reduce accessgap By 100% in long term improved availability
from 8 hours to 12hours daily
piped drinking waterthat is ‘fit for drinking;in at least 75% of areas
Execution of schemes oncost sharing basis i.e.Community invests inmaintenance and internalcomponent, whileGovernment invests forexternal component
Install water flow monitorsat tube wells; alsointroduce flow monitors atvalves
106
Execution of schemes oncost sharing basis i.e.Community invests inmaintenance and internalcomponent, whileGovernment invests forexternal component
Install water flow monitorsat tube wells; alsointroduce flow monitors atvalves
Water supply schemes in119 towns upgraded
Storage capacity needs ofcities and townsdetermined
Upgrade water supplyschemes in 30 townsincluding extra overheadstorage capacity
Upgrade water supplyschemes in 40 townsincluding extra overheadstorage capacity
Upgrade water supplyschemes in 49 townsincluding extra overheadstorage capacity
RURAL WATER SUPPLYDysfunctional and non-functional schemesrehabilitated andmaintained (538 schemesfit for repair plus 200additional schemes)
Rehabilitate 260dysfunctional and non-functional water supplyschemes
Rehabilitate 278dysfunctional and non-functional water supplyschemes
Rehabilitate 200 newlydysfunctional and non-functional water supplyschemes
Ageing water supplyschemes infrastructurereplaced (50 schemes peryear)
Replace infrastructure ofageing water supplyschemes (more than 20years) – 150 schemes
Replace infrastructure ofageing water supplyschemes (more than 20years) – 150 schemes
Replace infrastructure ofageing water supplyschemes (more than 20years) – 200 schemes
Energy efficient watersupply schemes (600)
Map areas that havepersistent power shortage
Introduce solar energysupported water supplyschemes
At least 180 water supplyschemes converted to solarenergy
All new water supplyschemes are solar energycompliant where feasible
At least 180 water supplyschemes converted to solarenergy
At least 240 water supplyschemes converted to solarenergy
Community awarenessabout water use, safety,maintenance andpreservation enhanced inall districts through aneffective BCC strategy
Conduct communityawareness sessions,including women andchildren, and disseminatekey messages developedunder BCC strategy byusing billboards andleaflets in each districtevery year
Conduct communityawareness sessions,including women andchildren, and disseminatekey messages developedunder BCC strategy byusing billboards andleaflets in each districtevery year
Conduct communityawareness sessions,including women andchildren, and disseminatekey messages developedunder BCC strategy byusing billboards andleaflets in each districtevery year
Strengthen communitydevelopment activities ofPHE&RDD for social
Recruit 2 social mobilisersper UC and orient in waterissues and maintenance
Maintain 2 socialmobilisers per UC andorient in water issues and
Maintain 2 socialmobilisers per UC andorient in water issues and

107
mobilisation and O&M(2594 social mobilisers)
maintenance maintenance

108
WATER QUALITY
National Water Quality Monitoring Programme
The National Water Quality Monitoring Programme (NWQMP)84 was initiated by Pakistan Councilof Research in Water Resources (PCRWR) in 2002. It was the premier project of the year whichgenerated the first detailed water quality profile of 23 major cities of the country. The NWQMPcontinued for five years (2002‐2006). During this phase, 357 water samples from 364 selectedwater sources were collected, adopting the uniform sampling criteria and analysed for 79 physico‐chemical parameters, including trace, ultra-trace elements and bacterial indicators. Theanalytical findings were compared to World Health Organisation (WHO) guidelines and PakistanStandards Quality Control Authority (PSQCA) standards for drinking water.
In Sindh Province85, all the 15 sources monitored in Hyderabad city were found unfit mainly due tobacteriological contamination (93%), excessive levels of iron (47%) and turbidity (93%). Karachi,the largest metropolitan city and capital of Sindh province revealed 93% unsafe water sources dueto the presence of bacteriological contamination (86%), Total Dissolved Solids (TDS) and fluoride(4%), sodium, chlorides, sulphate (7%), nitrate (11%) and iron (18%). Only 2 out of a total of 28were found safe. In Sukkur, 11 out of 12 sources were unfit because of bacteriologicalcontamination (67%) and turbidity (50%), hardness, chlorides, sodium, potassium, arsenic andfluoride (8%), nitrate (25%), sulphate and TDS (17%).
The bacterial contamination level (2002‐2006) was in the range of 73%‐100% for Hyderabad,61%‐100% for Karachi and 67%‐83% for Sukkur.
HyderabadWater samples were collected from 15 sources covering the main localities of Hyderabad city. Nosource was found to be supplying safe drinking water to the citizens. The analysis of the waterquality data showed that 93% of the water samples were contaminated due to Coliforms andE.coli bacterium and a high level of Turbidity. One sample (7%) was found with a high level ofCalcium (Ca), 7 samples (47%) contained excess Fe contents and 13 samples (87%) containedexcess Aluminium (Al).
KarachiWater samples were collected from 28 sources that covered the major part of the metropolis.Only two sources were found to be safe. It was noticed that 86% of the water samples werecontaminated with Coliforms and E.coli and 7% of the samples had high Sodium (Na), Chloride (Cl)and Sulphate (SO4) ions more than allowed under permissible limits. Similarly, 4% of the sampleswere found with an excessive ionic concentration of Ca, Magnesium (Mg), hardness, Potassium(K), Fluoride (F) and TDS, and 18% were identified having high levels of Iron (Fe). About 64% of thesamples had excessive aluminium while 4% of the samples had high Nickel (Ni) contents. 11% of
84 National Water Quality Monitoring Programme, Water Quality Status in Pakistan, Phase I-V, 2001-2006, Pakistan Council ofResearch in Water Resources85 Water Supply Schemes (7), Tap (41), Hand Pump (7) (Total:55)

109
the samples were found with high levels of Nitrate (NO3) and one sample (4%) was found with anexcessive level of Fluoride.
SukkurFrom Sukkur, 12 sources covering the entire city were selected for water sampling. The analysis ofthe water samples showed that only one source was supplying safe drinking water. It was foundthat 67% of the water samples were microbiologically contaminated and 50% of them werecontaining a high level of turbidity. High levels of turbidity were observed in tap and water supplydistribution systems because the major source of water supplied to the city was drawn from theIndus River containing suspended colloidal material. About 25% of the samples possessed a higherconcentration of Ca, and NO3, while 17% of the samples showed excessive contents of SO4. Theanalysis also showed that 80% of the samples possessed high values of hardness, Cl, Na, K, F andArsenic (As). About 17% of the samples had high TDS and 8.3% of the samples were found withhigh contents of Al.
Rural AreasIn rural areas of Sindh province water quality monitoring of three districts was completed86.
In Hyderabad district, 410 water samples from 20% villages of all the union councils were collectedand tested. The analytical data compared with Pakistan Standards and Quality Control Authority(PSQCA) standards demonstrated that 23% water samples were contaminated with TotalColiforms, 20% with Turbidity and 48% samples had higher level of TDS. Data analysis andcomparison with PSQCA water quality standards showed that 82% water sources were unsafe andonly 18% were found to be safe for drinking purpose in rural areas of the district.
In Karachi district, altogether 75 water samples from 20% villages of all the union councils werecollected and tested following American Public Health Association (APHA) protocols. The analyticaldata demonstrated that 76% water samples were contaminated with Total Coliforms and 56%samples had excessive level of TDS. An overall analytical picture showed that 95% water sampleswere unsafe and remaining 5% were safe for drinking purpose in rural areas of the district.
In Sukkur district, 260 water samples from 20% villages of all the union councils were collected andanalysed. The analytical data demonstrated that 16% water samples were contaminated withTotal Coliforms and 35% samples had excessive level of TDS. An overall analytical profile of Sukkurdistrict showed that 48% water samples were found unsafe and remaining 52% were safe fordrinking purpose in rural areas of the district.
Technical Assessment of Water Supply Schemes
The Pakistan Council of Research in Water Resources conducted a technical assessment of 1247water supply schemes in Sindh province87. The key results are presented in Figs 22 and 23.
86 Muhammad Aslam Tahir, Hifza Rasheed and Saiqa Imran. Water Quality Status in Rural Areas of Pakistan, 2010. Pakistan Councilof Research in Water Resources87 Technical Assessment Survey Report of Water Supply Schemes, Sindh 2010. Pakistan Council of Research in Water Resources

110
Figure 22 - Quality of Drinking Water at Source
(Source: Technical Assessment Survey Report of Water Supply Schemes, Sindh 2010. Pakistan Council of Research in WaterResources)
Fig 22 illustrates that only three districts (Larkana, Shikarpur and Kashmore) had a score of 100%‘water fit for drinking’ of the samples tested. All other districts were less than 20% except forJacobabad at 21% and Naushero Feroze at 20%. The analysis of water samples collected from thewater sources of the water supply schemes indicates that 95% of the total collected samples areunsafe for drinking purpose. It has been found that water of these sources is unsafe for drinkingpredominantly because of microbiological contamination, though there is evidence of physical aswell as chemical contamination.
Fig 23 illustrates the analysis of water samples collected from the houses of the consumers of thefunctional water supply schemes and reveals that 98% of the total collected samples are unsafefor drinking purposes. The causes of contamination are not indifferent from that of water atsource. Microbiological contamination is again predominant at the consumers’ end, which prevailson all the functional water supply schemes, among the districts. In Larkana, 100% of the sampleswere fit for drinking, followed by Kashmore at 50% and Shikarpur at 25%. All other districts scoredless than 10%, with Naushero Feroze at 10%.

111
Figure 23 - Quality of Drinking Water at Consumer's end
(Source: Technical Assessment Survey Report of Water Supply Schemes, Sindh 2010. Pakistan Council of Research in WaterResources)
Bottled Water Quality
The poor quality of drinking water has forced a large cross-section of citizens to buy bottled water.However, many of the mineral water companies were found selling contaminated water. Tomonitor and improve the quality of bottled water, the Government of Pakistan through Ministry ofScience and Technology has designated the task for quarterly monitoring of bottled/mineral waterbrands to PCRWR. According to the monitoring report for Sindh88 for the quarter January toMarch, 2016, the following findings were noted.
Of a total of 111 brands tested by PCRWR for water quality tests in 15 cities across the country, 89brands were safe (80%), 22 were unsafe (20%), 19 were chemically unsafe (17%), 3 were
88 Quarterly Report Bottled Water Quality (January - March, 2016). Pakistan Council of Research in Water Resources, Ministry ofScience and Technology

112
microbiologically unsafe (3%), 64 brands remained consistent in two neighbouring quarters (58%),47 new brands were introduced (42%), and 36 brands became unavailable (32%).
For Sindh, the following results were found for various brands and the respective cities where theywere manufactured.
Hyderabad – Noble, AFRA, NG Fresh Water, Pak Life Jamshoro – Pearl Karachi – OSIO, Sunlay, Blu Plus, Al Sahar, Zindagi, Marbella, Simply Pure, Al-Habib, Livon, Aqua
Water, Silver, Vinh, ORION, DAM, Aaab-e-Sehat, Aqua Arabia, Al-Masafi Hub (Balochistan) – Crystal Maya, Batina Pure
ArsenicThe following brands available in Sindh were found to contain high levels of Arsenic (more thanthe safe limit of 10 ppm) - NG Fresh Water (85 ppm), Al-Habib (62 ppm), Silver (70 ppm), ORION(68 ppm).
PotassiumAqua Arabia (22 ppm) exceeded the safe limit of 10 ppm.
The following brands tested safe for both chemical and microbiological quality – Noble, AFRA, PakLife, Pearl, OSIO, Sunlay, Blu Plus, Al Sahar, Zindagi, Marbella, Simply Pure, Livon, Aqua Water,Vinh, DAM, Aaab-e-Sehat, Al-Masafi, Crystal Maya, Batina Pure
Five brands were found unsafe out of 24 tested (21%).
Bacteriological contamination carries a risk of cholera, diarrhoea, dysentery, hepatitis, andtyphoid, while arsenic contamination carries a risk of cancer (lungs, bladder, skin, prostrate,kidney, nose and liver), diabetes kidney disease, hypertension, heart disease, birth defects, blackfoot diseases. Sodium contamination carries a risk of hypertension.
Table 10 indicates that 3.0% of household members in Sindh drink water contaminated aboveWHO standards for arsenic, 5.5% for Nitrate, 4.5% for Fluoride, 2.9% for Iron, 8.9% for hard waterand 23.6% for TDS. Further, 38.8% of household members drink water contaminated with E.coli,while 66.0% drink water contaminated with coliforms. This indicates a serious water quality issuein Sindh.

Table 10 - Overall status of water quality (MICS 2014)
Percentage ofwater quality
testing samplehouseholds usingimproved sourceof drinking water
Percentage of household members with Number ofhouseholdmembers
Bacterial contamination* morethan 10
ppb
>10ppm
>1.5ppm
>0.30ppm
>500ppm
above>1000ppm
E.coli Total Coliform
Arsenic Nitrate Fluoride Iron Hardwater
TotalDissolved
Solids(TDS)
Percentage ofhousehold
members with E.coli in household
drinking water(>=1 cfu/ml)
Number ofhouseholdmembers
Percentage ofhousehold
members withother coliformrisk level equal
or above 1cfu/ml
Number ofhouseholdmembers
Total 91.0 3.0 5.5 4.5 2.9 8.9 23.6 12,849 38.8 12,258 66.0 11,757DivisionLarkana 93.3 0.5 4.6 2.1 0.2 16.5 39.3 1,713 28.5 1,617 51.6 1,592Sukkur 99.6 10.2 8.7 6.2 5.4 7.2 24.2 2,215 21.2 2,196 58.3 2,144Hyderabad 94.2 4.7 2.4 3.1 4.9 14.6 36.1 2,969 44.4 2,788 60.1 2,605Mirpur Khas 78.8 0.0 14.3 19.2 3.8 16.3 41.7 1,238 56.0 1,199 81.2 1,077Karachi 87.4 0.0 3.8 1.5 1.1 1.2 4.6 4,714 43.0 4,459 74.9 4,339AreaUrban 89.8 0.9 4.6 2.1 1.3 4.9 13.2 6,657 42.3 6,340 71.7 6,072Rural 92.4 5.1 6.4 7.1 4.6 13.0 34.5 6,193 35.0 5,918 60.0 5,685Wealth index quintilePoorest 85.5 3.5 6.4 11.5 3.5 18.0 43.1 2,496 39.5 2,417 59.5 2,254Second 95.3 4.9 8.0 5.6 4.8 13.9 37.2 2,673 30.8 2,557 55.3 2,494Middle 87.4 3.4 6.4 2.2 3.2 6.9 20.9 2,694 38.3 2,556 73.0 2,443Fourth 89.3 1.0 2.6 1.8 2.0 2.0 6.9 2,521 45.6 2,384 73.5 2,353Richest 97.8 1.7 3.6 1.3 0.7 2.9 8.2 2,465 40.3 2,345 69.0 2,214(Source: Sindh Multiple Indicator Cluster Survey, 2014)

Water Resources Research Institutes and Laboratories
Some key water institutes conduct research on water resources and quality. These institutes havea vital role in building a water quality profile in Sindh.
Pakistan Council of Research in Water Resources
The following capacity building and training was carried out by PCRWR for Sindh89.
Capacity Building Training Programmes under the Project Provision of Safe Drinking Water38th Technician Training Course for Water Supply Agencies of Northern, Areas and Sind wasconducted from March 24-28, 2014 at PCRWR Headquarters Islamabad. During the course,lectures were delivered on importance of water, hazards of usage of unsafe water and its relatedaspects, besides laboratory demonstrations on water quality testing/monitoring and field visits.
Water Quality Testing/Treatment and Operation & Maintenance (O&M) of Water SupplySchemesThree training programmes of 4-days each were conducted in March 2014, at PCRWR WaterQuality Laboratory Karachi, to strengthen the capacity of human resource of PHED, H-WASA,Village Development Associations (VDAs), Community Based Organisations (CBOs) and otherimplementing partners on Water Quality Testing/Treatment and O&M of water supply schemes.These trainings were organized with financial and technical assistance of UNICEF (Sindh).
Training Programme for the Professionals of Regional Laboratories of PCRWRThe experts of National Water Quality Laboratory (NWQL) visited PCRWR Regional Laboratories(Peshawar, Abbottabad, Karachi, Hyderabad, Sukkur, Badin, Tandojam, Nawabshah, Lahore,Multan, Dera Ghazi Khan, Bahawalpur and Sahiwal) during February to March 2014 and providedonsite training, on water quality analysis, ISO-17025 management and technical requirements, tothe professionals of regional laboratories. The objective of this extensive training programme wasto prepare the laboratories, to achieve ISO- 17025 Accreditation.
Research and DevelopmentSome of the research and development projects90 undertaken by PCRWR include the following:
Combating Drought and Desertification in the Thar Desert by Management of Water ResourcesThe project entails (1) Carrying out a comprehensive survey to document the existing status ofwater resources management and agriculture activities in the project area; (2) Conductingresearch for effective utilization of land and water resources by establishing a Research andDissemination Station in Thar Desert; (3) Developing viable techniques of rainwater harvesting,saline and fresh groundwater utilization and desertification control in the area for agriculture,livestock, and human consumption; and (4) Disseminating efficient techniques for large-scaleadaptation for agriculture and socio-economic development. Some of the key achievements of theproject include the following:
89 Pakistan Council of Research in Water Resources Year Book 2013-14, Ministry of Science and Technology, Government ofPakistan90 Pakistan Council of Research in Water Resources Year Book 2013-14, Ministry of Science and Technology, Government ofPakistan
115
Catchment area around earthen pond (150 ft x 150 ft x 20 ft) constructed at Khario Nara FieldStation was developed by removing obstacles to increase the efficiency of runoff and toharvest maximum rainwater during rainy season.
Different types of vegetables like bitter gourd, lady finger, lufa gourd, bottle gourd and squashmelon have been grown on pitcher irrigation system by using mix water (sweet and tube wellwater) on an area of 0.25 acre.
Cluster bean grown on 20 acres. Grafting of 700 zizyphus, trees completed during the entire period of the project but due to
unfortunate incident of fire occurred on August 4, 2014, 200 trees were burnt. Currentlypruning of 50 trees is in process and after that grafting process will remain under progress infuture along with applying anti-termite medicines within the roots. The plants were irrigatedwith ground saline water successfully
Metrological data (temperature, wind velocity, pan evaporation, rainfall and humidity) wascollected regularly.
Monitoring activities at constructed rainwater harvesting ponds, mini dam and dug wells atcommunity land are in progress.
Pakistan Council for Scientific and Industrial Research
The Pakistan Council for Scientific and Industrial Research (PCSIR) Laboratories Complex inKarachi 91 is undertaking research in disposal of hazardous wastes, recycling of municipalwastewater and industrial effluents, and monitoring of water and air pollution.
Climate Change, Alternate Energy and Water Resources Research InstituteIslamabad
The former Water Resources Research Institute (WRRI) established under the National AgriculturalResearch Centre (NARC) has been renamed the Climate Change, Alternate Energy and WaterResources Institute92 (CAEWRI). Its mandate includes (1) To optimise the productivity of water useunder rain-fed and irrigated environment; (2) To develop sustainable balance between resourceutilisation and its replenishment; (3) Climate change impact assessment on water resources andagriculture, its adaptation and mitigation; and (4) Alternate energy resourcesproduction/harvesting and management.
91 http://www.pcsir.gov.pk/Karachi_lab_RD.html92 http://www.parc.gov.pk/index.php/en/caewri-home

116
Drainage and Reclamation Institute of Pakistan
Drainage and Reclamation Institute of Pakistan (DRIP)93 in Tando Jam was established in 1975,under PCRWR with the mandate to conduct research in drainage and reclamation of waterloggedand salt affected soils, groundwater resources development and management, soil and watermanagement and other related aspects. DRIP has successfully introduced tile drainage technologyamongst the progressive farmers, for reclamation of waterlogged and salt affected soils withfarmers’ participation in capital and responsibility, of the operation and maintenanceexpenditures. Similarly, the farmers have benefited from skimming well technology, byaugmenting irrigation supplies, by pumping freshwater floating over native saline groundwater.Monitoring and evaluation of installed drainage projects has generated scientific data, for planningof future drainage projects. It has state of the art automated lysimeter research station to conductvarious water management studies.
The Water Quality Laboratories of Karachi, Hyderabad, Badin and Shaheed Benazir Abad are alsoequipped with the state of the art facilities and are providing service to the public and privatesectors, under the administrative control of DRIP.
Arid Zone Research Institute
The Arid Zone Research Institute (AZRI), Umerkot94 is working under the administrative control ofDirector General, Southern Zone Agricultural Research Centre (SARC), Karachi. Its objectivesinclude, to:
enhance productivity of arid and semi-arid agriculture of Thar and surrounding areas byidentifying crop, livestock and socio-economic constraints
generate baseline data on arid agriculture and develop protocol for maximum utilisation ofland and the arid region of Thar and adjoining irrigated belt of lower Sindh
develop procedures for rain water conservation for production of agricultural crops in aridzone
conserve and promote the natural vegetation of Thar region for livestock production
Its main areas of research under land and water management include:
Use of alternative energy sources for pumping water in agriculture (Solar, Wind and Biogas) Installation of drip irrigation system for cultivation of grafted ber (Zizyphus spp) Rain water harvesting Pitcher plantation Soil and water conservation though plantation Use of wind mill for pumping of ground water
93 Adapted from http://pcrwr.gov.pk/regionaltandojam.aspx94 Adapted from http://www.parc.gov.pk/index.php/en/azri-home
117
Recent Initiatives for Water Quality in Sindh
Water Testing Laboratories in Districts
Pakistan Council of Research in Water Resources (PCRWR) is implementing a project called“Provision of Safe Drinking Water” in the country95. The objectives of this project, which started in2005, include the following:
Establish 19 water quality monitoring laboratories in 19 districts in the country to providedependable water analysis facilities for the provision of safe drinking water
Conduct Water Quality Monitoring to identify the problems hindering in the supply of safedrinking water
Install pilot/demonstration water conditioning and filtration plants for larger scale adoption bythe federal and local Governments
Impart training to the technical staff of all water supply schemes of four provinces, AzadJammu and Kashmir (AJK), Federally Administered Tribal Areas (FATA) and Northern Areas
Investigate and identify the causes of pollution in water resources and to suggest the remedialmeasures for water quality improvement
The following activities are planned under this project:
1) Establishment of Water Quality Testing Labs in 18 districts across the country (now upgradedto 19 districts96)
2) Installation of Demonstration Water Conditioning and Filtration Plant in 24 districts across thecountry (now upgraded to 25 districts97)
3) Physical Survey of all Completed Water Supply Schemes (PHED/WASA)4) Training and Capacity Building of Staff associated with Water Supply Schemes5) Investigation and Identification of Causes of Pollution and Contamination of Water Supply6) Regular Monitoring and Surveillance of Water Supply Schemes/Agencies
As part of this project, PCRWR is in the process of establishing water quality testing laboratories inSukkur and Badin in Sindh.
Science and Technological Research Division
The Federal Government has funded a scheme for ‘Demarcation of Groundwater Quality Zones inIndus Plain and Marginal Areas for Sustainable Development and Management of Groundwater(Lower Indus Plain)’, which is being undertaken by PCRWR.
95 Provision of Safe Drinking Water (Revised PC-I), January 2014. Pakistan Council of Research in Water Resources, Ministry ofScience and Technology96 Pakistan Council of Research in Water Resources Year Book 2013-14, Ministry of Science and Technology, Government ofPakistan97 Pakistan Council of Research in Water Resources Year Book 2013-14, Ministry of Science and Technology, Government ofPakistan
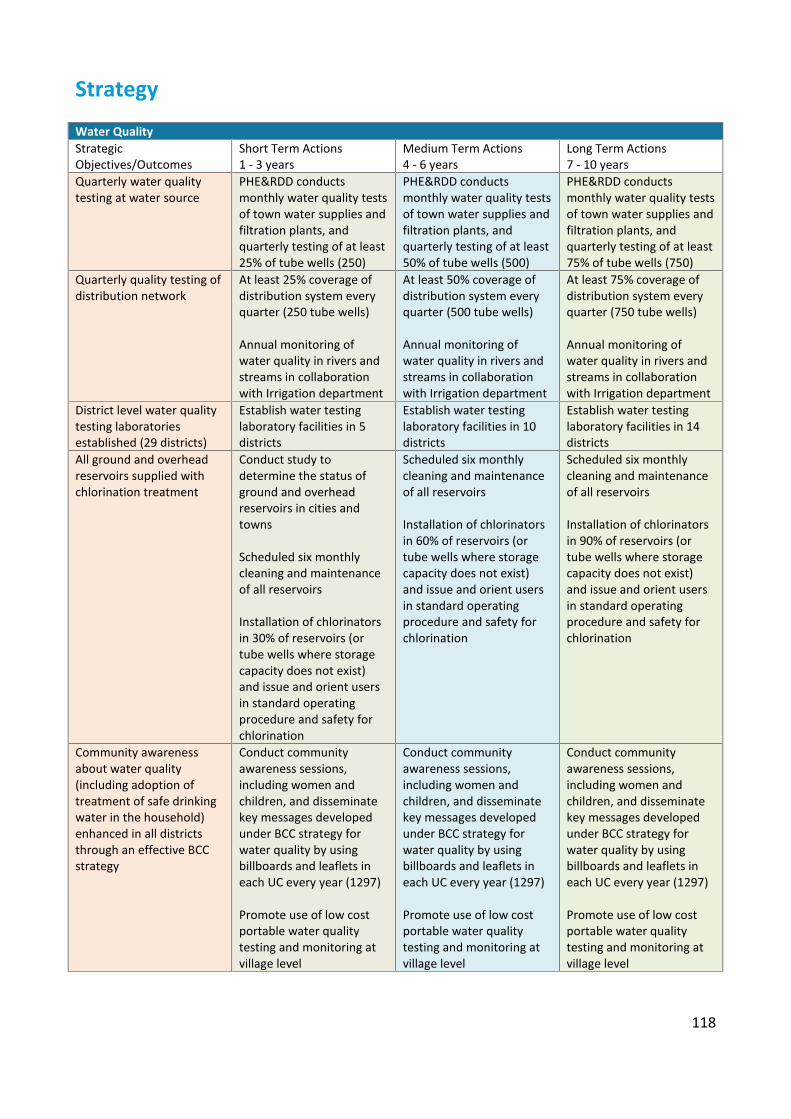
118
Strategy
Water QualityStrategicObjectives/Outcomes
Short Term Actions1 - 3 years
Medium Term Actions4 - 6 years
Long Term Actions7 - 10 years
Quarterly water qualitytesting at water source
PHE&RDD conductsmonthly water quality testsof town water supplies andfiltration plants, andquarterly testing of at least25% of tube wells (250)
PHE&RDD conductsmonthly water quality testsof town water supplies andfiltration plants, andquarterly testing of at least50% of tube wells (500)
PHE&RDD conductsmonthly water quality testsof town water supplies andfiltration plants, andquarterly testing of at least75% of tube wells (750)
Quarterly quality testing ofdistribution network
At least 25% coverage ofdistribution system everyquarter (250 tube wells)
Annual monitoring ofwater quality in rivers andstreams in collaborationwith Irrigation department
At least 50% coverage ofdistribution system everyquarter (500 tube wells)
Annual monitoring ofwater quality in rivers andstreams in collaborationwith Irrigation department
At least 75% coverage ofdistribution system everyquarter (750 tube wells)
Annual monitoring ofwater quality in rivers andstreams in collaborationwith Irrigation department
District level water qualitytesting laboratoriesestablished (29 districts)
Establish water testinglaboratory facilities in 5districts
Establish water testinglaboratory facilities in 10districts
Establish water testinglaboratory facilities in 14districts
All ground and overheadreservoirs supplied withchlorination treatment
Conduct study todetermine the status ofground and overheadreservoirs in cities andtowns
Scheduled six monthlycleaning and maintenanceof all reservoirs
Installation of chlorinatorsin 30% of reservoirs (ortube wells where storagecapacity does not exist)and issue and orient usersin standard operatingprocedure and safety forchlorination
Scheduled six monthlycleaning and maintenanceof all reservoirs
Installation of chlorinatorsin 60% of reservoirs (ortube wells where storagecapacity does not exist)and issue and orient usersin standard operatingprocedure and safety forchlorination
Scheduled six monthlycleaning and maintenanceof all reservoirs
Installation of chlorinatorsin 90% of reservoirs (ortube wells where storagecapacity does not exist)and issue and orient usersin standard operatingprocedure and safety forchlorination
Community awarenessabout water quality(including adoption oftreatment of safe drinkingwater in the household)enhanced in all districtsthrough an effective BCCstrategy
Conduct communityawareness sessions,including women andchildren, and disseminatekey messages developedunder BCC strategy forwater quality by usingbillboards and leaflets ineach UC every year (1297)
Promote use of low costportable water qualitytesting and monitoring atvillage level
Conduct communityawareness sessions,including women andchildren, and disseminatekey messages developedunder BCC strategy forwater quality by usingbillboards and leaflets ineach UC every year (1297)
Promote use of low costportable water qualitytesting and monitoring atvillage level
Conduct communityawareness sessions,including women andchildren, and disseminatekey messages developedunder BCC strategy forwater quality by usingbillboards and leaflets ineach UC every year (1297)
Promote use of low costportable water qualitytesting and monitoring atvillage level

119
SANITATION
Urban and Rural Sanitation
Coverage
The recent PSLM 2014-1598 survey shows that flush toilet is the prominent mode of sanitation in97% of households in urban areas. No toilet was found in less than 1% of households (Fig 24).
Figure 24 - Mode of urban sanitation in Sindh (PSLM 2014-15)
(Source: Pakistan Social and Living Standards Measurement Survey, 2014-15)
Figure 25 shows that in urban areas, Mitiari and Umerkot had the highest percentages of no toiletat 11% and 9% respectively. Jamshoro and Sujawal had the highest flush use at 100%. In over afourth of households (26.9%), the flush toilet was connected to open drains.
In rural areas however, the rates of no toilet were thirty-one times as high at 15.7% as comparedto urban areas (Fig 26). Furthermore, Fig 27 shows that the highest percentages for no toilet werefound in Umerkot (50%), Tharparkar (47%), Sujawal (41%), Thatta (28%) and Matiari (26%). In overa fifth of households (21.7%), the flush toilet was connected to open drains.
98 Pakistan Social and Living Standards Measurement Survey 2014-15. Pakistan Bureau of Statistics

120
Figure 25 - District wise distribution of mode of sanitation in urban areas (PSLM 2014-15)
(Source: Pakistan Social and Living Standards Measurement Survey, 2014-15)
120
Figure 25 - District wise distribution of mode of sanitation in urban areas (PSLM 2014-15)
(Source: Pakistan Social and Living Standards Measurement Survey, 2014-15)
120
Figure 25 - District wise distribution of mode of sanitation in urban areas (PSLM 2014-15)
(Source: Pakistan Social and Living Standards Measurement Survey, 2014-15)

121
Figure 26 - Mode of rural sanitation in Sindh (PSLM 2014-15)
(Source: Pakistan Social and Living Standards Measurement Survey, 2014-15)
121
Figure 26 - Mode of rural sanitation in Sindh (PSLM 2014-15)
(Source: Pakistan Social and Living Standards Measurement Survey, 2014-15)
121
Figure 26 - Mode of rural sanitation in Sindh (PSLM 2014-15)
(Source: Pakistan Social and Living Standards Measurement Survey, 2014-15)

122
Figure 27 - District wise distribution of mode of sanitation in rural areas (PSLM 2014-15)
(Source: Pakistan Social and Living Standards Measurement Survey, 2014-15)
Figure 28 illustrates that on average 54.9% use improved sanitation, while 56.1% have a place forhand washing. There is a general awareness about the need for a place for handwashing sincemany districts that have low rates for improved sanitation have higher rates for a place forhandwashing.
Figure 29 indicates that the poorest and second quintiles have the lowest rates for use ofimproved sanitation and having a place for hand washing. However, even in the poorest category,63.1% had soap or other cleansing agent available.
Figure 30 indicates that 90.0% of urban, 22.1% of rural and 97.9% of households in Karachi divisionuse flush/pour flush latrines connected to piped sewer system.
Figure 31 illustrates that 39.9% of household population in rural areas practice open defecation,which is highest in Mirpur Khas division at 49.2%.
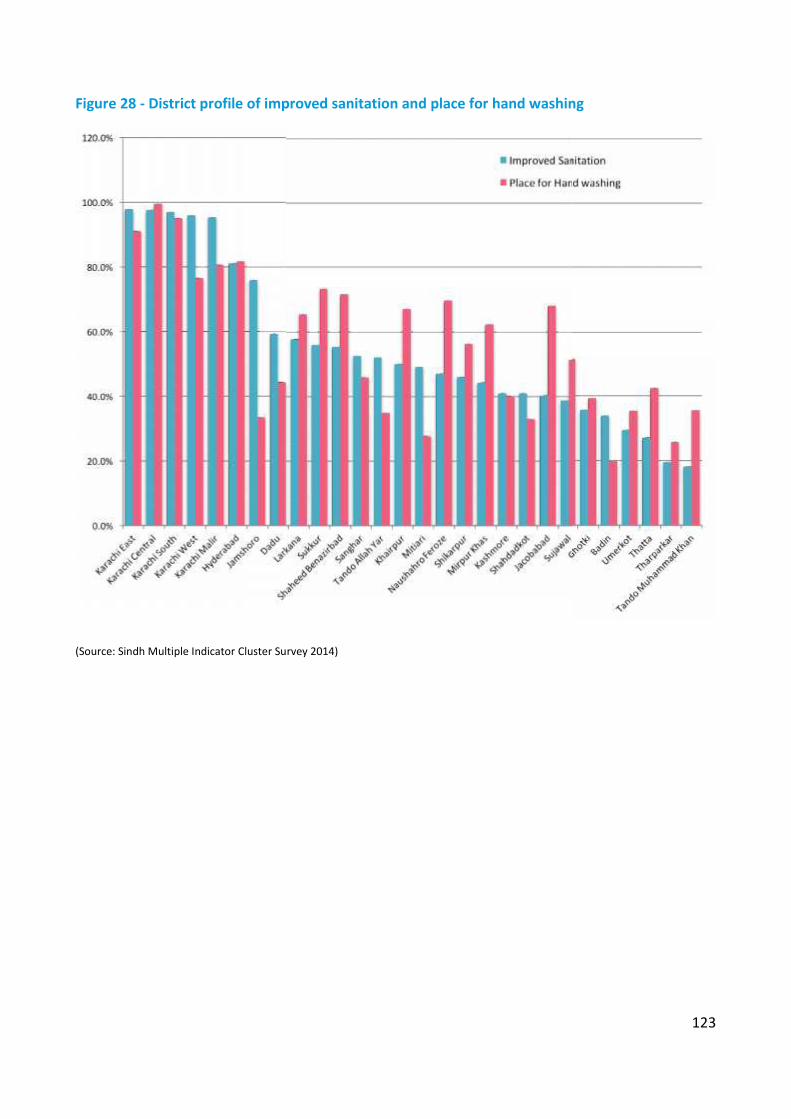
123
Figure 28 - District profile of improved sanitation and place for hand washing
(Source: Sindh Multiple Indicator Cluster Survey 2014)
123
Figure 28 - District profile of improved sanitation and place for hand washing
(Source: Sindh Multiple Indicator Cluster Survey 2014)
123
Figure 28 - District profile of improved sanitation and place for hand washing
(Source: Sindh Multiple Indicator Cluster Survey 2014)
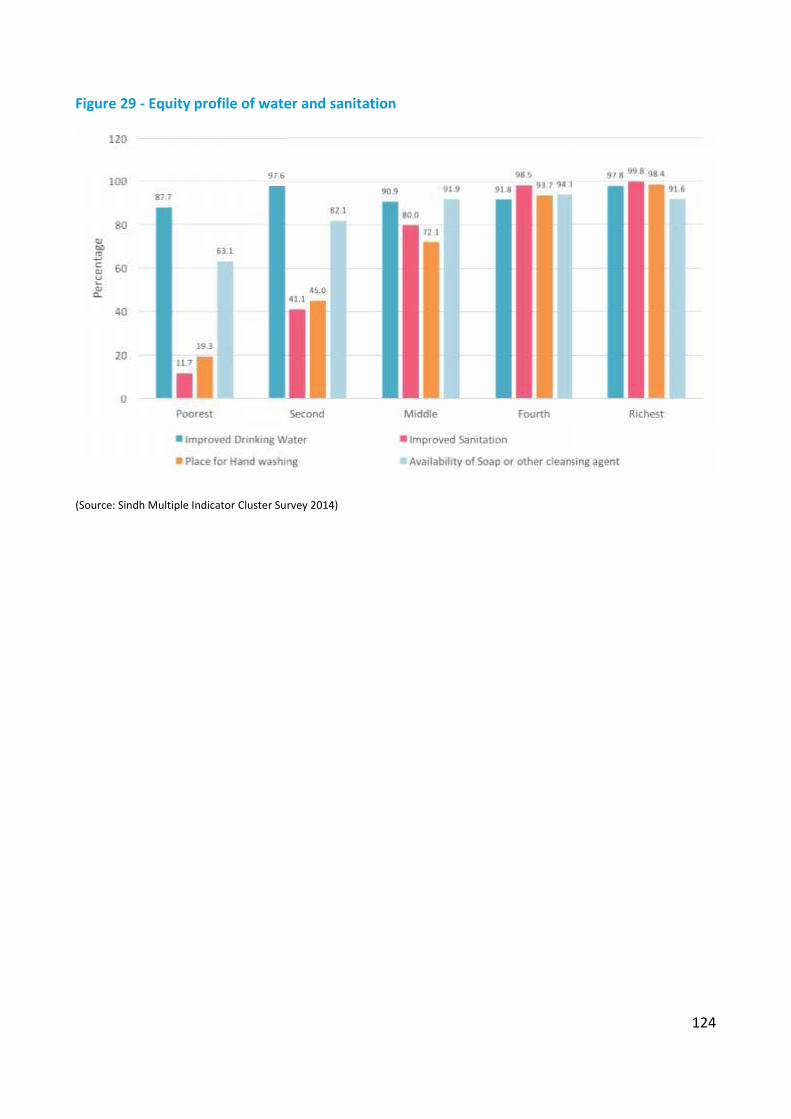
124
Figure 29 - Equity profile of water and sanitation
(Source: Sindh Multiple Indicator Cluster Survey 2014)
124
Figure 29 - Equity profile of water and sanitation
(Source: Sindh Multiple Indicator Cluster Survey 2014)
124
Figure 29 - Equity profile of water and sanitation
(Source: Sindh Multiple Indicator Cluster Survey 2014)

125
Figure 30 - Overall status of improved sanitation (MICS 2014)
(Source: Sindh Multiple Indicator Cluster Survey 2014)
125
Figure 30 - Overall status of improved sanitation (MICS 2014)
(Source: Sindh Multiple Indicator Cluster Survey 2014)
125
Figure 30 - Overall status of improved sanitation (MICS 2014)
(Source: Sindh Multiple Indicator Cluster Survey 2014)

126
Figure 31 - Overall status of unimproved sanitation (MICS 2014)
(Source: Sindh Multiple Indicator Cluster Survey 2014)
126
Figure 31 - Overall status of unimproved sanitation (MICS 2014)
(Source: Sindh Multiple Indicator Cluster Survey 2014)
126
Figure 31 - Overall status of unimproved sanitation (MICS 2014)
(Source: Sindh Multiple Indicator Cluster Survey 2014)
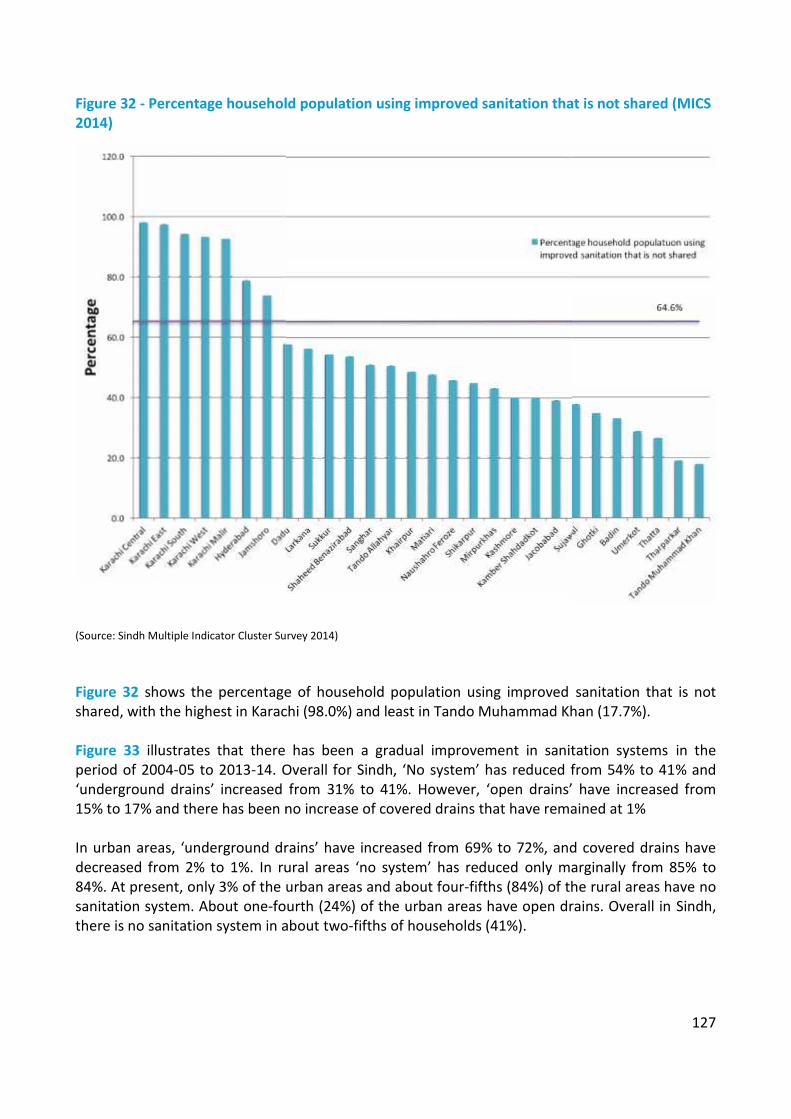
127
Figure 32 - Percentage household population using improved sanitation that is not shared (MICS2014)
(Source: Sindh Multiple Indicator Cluster Survey 2014)
Figure 32 shows the percentage of household population using improved sanitation that is notshared, with the highest in Karachi (98.0%) and least in Tando Muhammad Khan (17.7%).
Figure 33 illustrates that there has been a gradual improvement in sanitation systems in theperiod of 2004-05 to 2013-14. Overall for Sindh, ‘No system’ has reduced from 54% to 41% and‘underground drains’ increased from 31% to 41%. However, ‘open drains’ have increased from15% to 17% and there has been no increase of covered drains that have remained at 1%
In urban areas, ‘underground drains’ have increased from 69% to 72%, and covered drains havedecreased from 2% to 1%. In rural areas ‘no system’ has reduced only marginally from 85% to84%. At present, only 3% of the urban areas and about four-fifths (84%) of the rural areas have nosanitation system. About one-fourth (24%) of the urban areas have open drains. Overall in Sindh,there is no sanitation system in about two-fifths of households (41%).

128
Figure 33 - Type of Sanitation system used in Sindh
(Source: Pakistan Social and Living Standards Measurement Survey, 2004-05, 2005-06, 2007-08, 2011-12 and 2013-14)
Sewerage and Drainage Issues
Some of the key sewerage and drainage issues identified in Karachi are also to a large extentgermane to urban sanitation in general99. These include:
Absence of comprehensive master plans for cities and towns – there is urgent need for masterplans for sewerage implementation in line with the city planning, to implement seweragefacilities based on it and to revise the plan on regular basis taking social and physical changesinto account
Limited budget allocation for sewerage facilities – since the tariff collected in water supply andsewerage sector is very limited, the budget allocated for sewerage sector is limited, too. Withthe limited budget, it is almost impossible to operate and maintain existing sewerage facilitiesso as they function as planned and to extend or newly construct sewerage facilities to meetthe future requirements
99 The Study on Water Supply and Sewerage System in Karachi in the Islamic Republic of Pakistan, 2008. Japan InternationalCooperation Agency (JICA), Karachi Water & Sewerage Board (KW&SB)
129
Improper operation and maintenance of sewerage facilities – mainly due to the limited budgetand personnel allocated for operation and maintenance of sewerage facilities, existing facilitiesare not operated properly. Improper maintenance might lead to earlier aging of facilities andnon-compliance with the effluent quality standard
Insufficient sewerage facilities – existing sewerage facilities for sewage collection and itstreatment are far from sufficient in quantity to serve the rapidly increasing population.Additional sewage collection systems including branch sewers, trunk sewers and pumpingstations need to be constructed to improve the living environment of the citizens. In the samemanner, existing sewage treatment plants need to be extended and new plants have to beinstalled to treat all the generated sewage to improve water qualities of public water bodies,especially of Arabian Sea
Insufficient information on facilities – sewers, pumping stations and sewage treatment plantsconsist of civil structures, mechanical and electrical equipment. For efficient and effectiveoperation and maintenance of these facilities, it is necessary to equip their as-built drawings,list and specifications on site. However, site surveys have usually found that there was littleinformation on these items, especially about sewers
Inefficient record of operation and maintenance works – in the same manner, littleinformation in written form is available on the performance of pumping and treatmentfacilities such as flow rates, operation hours, water qualities, facility failures and repairs and soforth
Absence of operation and maintenance manuals – manuals for operation and maintenance ofsewerage facilities are not available. It is very difficult to operate and maintain seweragefacilities in a proper way without O&M manuals

130
Wastewater
Disposal of wastewater is a guide to potential water contamination. About 59% of Sindh’shouseholds have disposal of wastewater (sewerage connected with main line, sewerageconnected with open drain or septic tank), ranging from 97% in urban and 16% in rural areas100.
Karachi City Wastewater101, 102
Karachi is most industrialised and urbanised city of Pakistan. More than 450 million gallons ofwastewater is generated per day by different types of industrial processes and human operations.There are only three wastewater treatment plants in Karachi city working at Haroonabad (TP1),Mahmoodabad (TP2) and Mauripur (TP3), which can treat less than 30% of the total wastewatergenerated. Sindh Industrial Estate (SITE), Korangi Industrial Area (KIA) and Landhi Industrial Area(LIA) are important industrial sites of Karachi whose wastewater influxes indirectly into theArabian Sea without any treatment. In addition, untreated industrial effluents and domesticwastewater from other resources is also being discharged into the Arabian Sea. Therefore, morethan 70% of the wastewater goes into the Arabian Sea without any treatment.
Major rivers of Punjab discharge their wastewater load into the River Indus, which ultimatelydischarges its pollution load into the Arabian Sea at Keti Bunder endangering aquatic life and fish.Besides containing other toxicants, this wastewater contains large quantities of heavy/tracemetals/metalloids, cyanides, phenols, oils and greases and suspended solids resulting in highvalues of biological and chemical oxygen demand and low dissolved oxygen threatening aquaticlife and as well as fish. It is also suspected that, influx of this untreated wastewater is also makingthe water quality of the Arabian Sea unfit for recreation purposes at different sea spots likeParadise Point, Hawks Bay, Sand Spit, Keamari, Manora, Clifton and Sea View.
In 2007, according to KW&SB, Karachi was producing about 446 MGD of sewage per day. Thethree treatment plants have a collective maximum design capacity of 151 MGD of treatment ofeffluents. However, only about 90 MGD of total sewage is treated, while 356 MGD wastewaterremains untreated. Out of this 356 MGD, about 196 MGD drains into Lyari river, 98 MGDwastewater finds its way into Malir river, which ultimately discharges into the sea, whereas 22MGD percolates into the ground and becomes part of ground water. There is still 139 MGD ofsewage water that remains unaccounted.
More recent data from KW&SB shows that of 472 MGD of sewage generated daily in Karachi, onlyabout 50 MGD is treated, leaving 422 MGD untreated (Table 11).
100 Pakistan Social and Living Standards Measurement Survey, 2013-14101 Mahmood Hussain. Competitive Performance Evaluation of Waste Water Treatment Plants of Karachi and Impact of UntreatedWaste Water on Some Edible Fishes of Arabian Sea (Thesis, 2007). Department of Chemistry, University of Karachi102 Rashid Ali Panhwer. Wastewater Problem and its Complications for “Karachi”. Journalist Blog 2011, Associated Press of Pakistan
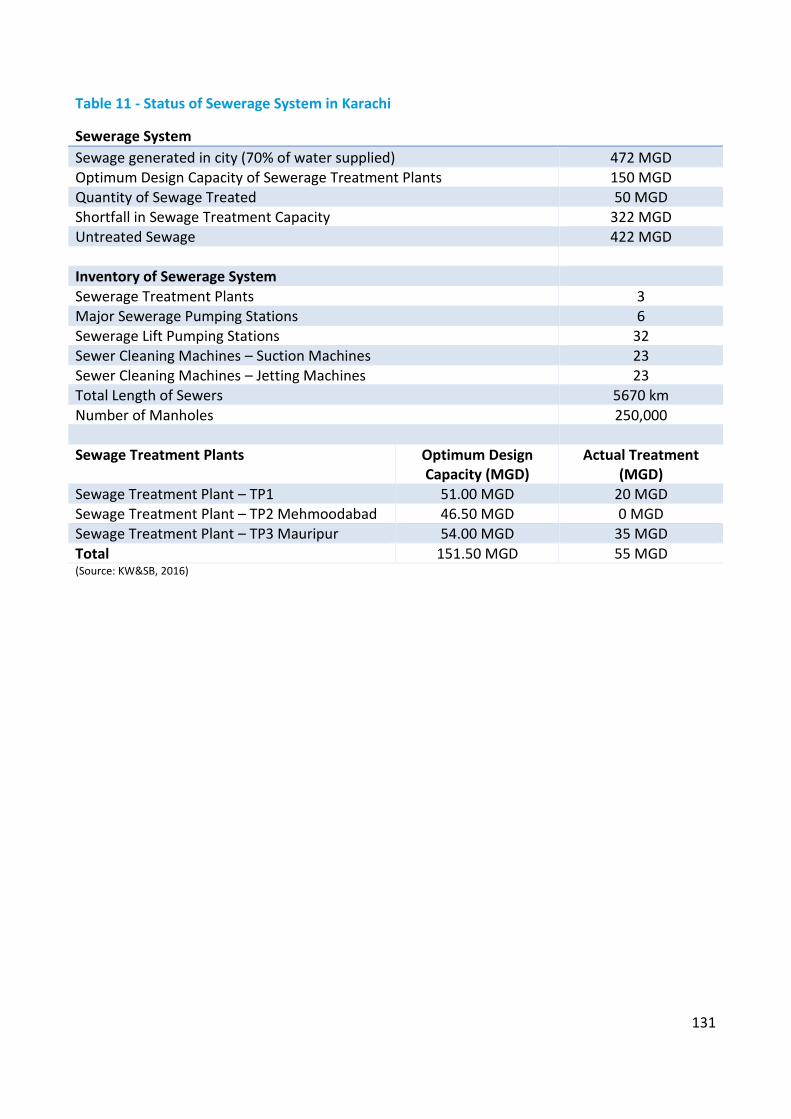
131
Table 11 - Status of Sewerage System in Karachi
Sewerage SystemSewage generated in city (70% of water supplied) 472 MGDOptimum Design Capacity of Sewerage Treatment Plants 150 MGDQuantity of Sewage Treated 50 MGDShortfall in Sewage Treatment Capacity 322 MGDUntreated Sewage 422 MGD
Inventory of Sewerage SystemSewerage Treatment Plants 3Major Sewerage Pumping Stations 6Sewerage Lift Pumping Stations 32Sewer Cleaning Machines – Suction Machines 23Sewer Cleaning Machines – Jetting Machines 23Total Length of Sewers 5670 kmNumber of Manholes 250,000
Sewage Treatment Plants Optimum DesignCapacity (MGD)
Actual Treatment(MGD)
Sewage Treatment Plant – TP1 51.00 MGD 20 MGDSewage Treatment Plant – TP2 Mehmoodabad 46.50 MGD 0 MGDSewage Treatment Plant – TP3 Mauripur 54.00 MGD 35 MGDTotal 151.50 MGD 55 MGD(Source: KW&SB, 2016)

132
Key issues with Sewerage and Wastewater disposal in Karachi City
The existing sewerage system serves a large part of the city. There are some areas including katchiabadis and other informal settlements which are not sewered and lack proper disposal system.The sewered areas of central and southern Karachi are connected to existing treatment plants,while other sewered areas discharge wastewater without treatment directly into nullahs, rivers orthe sea103.
System performance is marred by glaring deficiencies. The collection network has a low coverageand lacks major interceptors and sufficient treatment capacity. Most sewage flows into the nullahsand rivers which run as open sewers through the urban area, causing highly obnoxious, insanityconditions with serious health risks and unpleasant environment for the residents of adjoiningneighbourhoods.
There are other problems in the system that are caused by poor maintenance such as low numberof manholes and frequent effluent overflow onto the streets. Further, most of the network, laid25-35 years ago, needs replacement and upgrading to carry the present sewage load which hasincreased much above its capacity. In addition to network improvements, major capitalinvestments are required for building the wastewater treatment capacity and improving sanitarycondition by eliminating untreated sewage (Fig 34 and 35).
Figure 34 - Location of Wastewater Treatment Plants in Karachi
(Source: Karachi Strategic Development Plan 2020. Master Plan Group of Offices, City District Government Karachi)
103 Adapted from Karachi Strategic Development Plan 2020. Master Plan Group of Offices, City District Government Karachi

133
Figure 35 - Karachi Natural Nullahs and Drains
(Source: Orangi Pilot Project, Research and Training Institute, Karachi)
Sea PollutionDue to improper handling of waste and insufficient/negligible treatment facilities available withrespective organisations, marine/sea pollution is continuously increasing. The major sources of seapollution are as follows104:
Disposal of untreated waste water generated from industrial areas located in Karachi Disposal of untreated waste water generated from Fertilizers discharging into river and canals Disposal of untreated waste water generated from different districts adjacent to River Indus Disposal of untreated waste water generated from KW&SB Disposal of untreated waste water generated from Defence Housing Authority Karachi Disposal of untreated waste water generated from Karachi Port Trust Disposal of untreated waste water generated from Cantonment Boards Disposal of untreated waste water generated from Right Bank Outfall Drain (RBOD) I & II Disposal of untreated waste water generated from Sugar mills in Sindh
104 Provincial Assembly Sitting on 16th February 2016. http://www.pas.gov.pk/index.php/business/stn/en/31/927 accessed on 27April 2016

134
Storm Water Drainage
Karachi has an annual average monsoon rainfall varying 125-250 mm whereas winter rainfall isabout 25 mm. There are two main non-perennial rivers, the Malir and Lyari rivers, crossing thethickly populated city areas before falling into Arabian Sea.
The natural drainage system of Karachi consists of the Lyari and Malir rivers, and their tributariesor nullahs (Fig 36)105. Because of urban development and excessive occupation at the banks of theLyari River and its tributary nullahs of Gujro and Orangi, the natural drainage has been destroyedand almost completely obliterated. As a result, the runoff of storm water is prevented from goinginto the natural channels, thus overflowing into the streets and parts of the residential areas. Theareas worst affected are North Nazimabad, Liaquatabad, and SITE.
In the inner city, the low-lying areas of Saddar, Chundrigar Road, Bunder Road and Lyari becomeheavily inundated during the rainy spells mainly due to inadequate storm water drainage system.Extensive flooding occurs in parts of the Gulshan-e-Iqbal along the University Road, SocietiesUnion area along Shahrah-e-Faisal and Tipu Sultan Road. katachi abadis of Mehmoodabad andManzoor Colony located on the Malir River bank are also worst affected by excessive flooding andstagnant water.
Figure 36 - Storm Water Drainage System Karachi
(Source: Karachi Strategic Development Plan 2020. Master Plan Group of Offices, City District Government Karachi)
105 Adapted from Karachi Strategic Development Plan 2020. Master Plan Group of Offices, City District Government Karachi
135
Heavy rains were recorded in August,2006 resulting in high intensity uncontrolled gushing flowsovertopping medians and other infrastructure features of road transportation network. Shahra-e-Faisal was among such hard hit areas wherefrom catchments of Shahra-e-Qaideen and adjoiningareas of Hill Park and Shaheed-e-Millat resulted in the massive blockade of vehicular traffic whichlasted well over 5 hours in complete choking conditions. The ripple effect was felt from Gulshan-e-Iqbal to areas of Korangi, Landhi and inner city areas such as Saddar. This situation occurs/resultsfrom the following reasons:
Due to irregular and illegal land utilisation practices in the past, most of the natural drainage,nullahs and low lying areas which were left as open areas were converted into developed landsnotwithstanding the requirements of providing alternate and man-made disposal channels andthus disturbing the natural flow conditions and consequently resulting in uncontrolled stormdrainage pattern especially during a high intensity storm/rainfall.
It is a general observation that due to lack of an organised solid waste disposal system in thecity, a substantial percentage of solid waste is regularly disposed in the open storm drainagechannels especially from adjoining localities which obviously results in complete choking orpartially interrupted flow conditions in the event of storm. This practice is universally seenalong the major drainage channels/nullahs such as Gujro and Orangi where the occupants ofthe katchi abadis due to the unavailability of any local waste collection and disposal systemsinvariably indulge in such practices. Almost all the residents of North Nazimabad areas willacknowledge similar practices in the localized drains mainly being used as dumpsters ratherthan an interconnecting interceptor drainage system. The resulting reduced and narrowchannel width does not provide the adequate hydraulic radius and the flow capacities and inmost cases results in localized ponding scenarios with overflows topping the streets andconnecting roads.
It is also observed that the existing interceptor drains along roads sides are also not fullyfunctional mainly due to change in local topography and the slopes conditions. The stormsewers need major survey in terms of existing storm sewer network layout, interconnectivity,slopes, inverts and conveyance assessments.
It is observed that all major intra-city drains overflow with storm water flowing at fullcapacities overtopping road medians and resulting in uncontrolled flow conditions affectingresidential and commercial activities in the respective areas.

136
Recent Initiatives for Sanitation in Sindh
Sindh Cities Improvement Project
Under SCIP, the NSUSC is being implemented in 7 cities (Sukkur/New Sukkur, Rohri, Khairpur Mirs,Shikarpur, Larkana, Jacobabad and Ghotki). The focus on improving sanitation includes thefollowing:
Preparation of strategic sanitation plans System mapping and planning Leak detection and reduction; drainage and sewerage network improvements Rebuilding of pumping stations Provision of equipment Rehabilitation and expansion of stabilisation ponds Rehabilitation and construction of wastewater treatment plant
Some salient plans in progress or completed include the following:
Sukkur/New Sukkur Rehabilitation of 03 water treatment plants (WTP) and waste water facilities at Sukkur,
Khairpur and Shikarpur Cities "Contract No. 2499-Pak/ICB/C03". Work in progress 33% Construction of extension of WTP at Numaish Gah of 18 MGD together with Force main to
Adam Shah Reservoir including meters pressure measuring devices Replacement of old water mains and supply and laying of all new mains/transmission lines
including district meters as part of Master Plan, supply and install appropriate leakagedetection and NRW Equipment to reduce physical leakage from water supply networks
Laying of new ring/trunk mains, including bulk meters and refurbishment of an elevated tank(OHR), and additional HSR
Construction of water treatment plant at Sukkur Airport Road of 6 MGD together with desiltingand capacity enhancement of storage lagoons and alternative supply of treated water fromNumaish Gah via Adam Shah service reservoir
4 Additional DNI Zones – replacement of distribution network, household connections,installation of domestic and commercial meters and associated investment in transmissionlines. Designed to provide 3,000 customers with 24/7 potable water supply at Sukkur
Construction of new raw water intake on the River Indus at Sukkur Establishment of NRW reduction and pressure management zones with required resources at
Sukkur, New Sukkur. Supply of sewer/drain cleaning equipment, 4 Jetting machines, 4 sucking machines for New
Sukkur New Sukkur (1 Jetting + 1 Sucking Machine) Supervisory Control and Data Acquisition (SCADA) system for water supply and waste water
facilities at Sukkur, New Sukkur
Rohri Improvement of sewerage system and waste water treatment system at in Karo Naro and
improvement of Umar Kash Wah and New Yard Loco Shed (area) Sewerage Disposal Station atRohri
137
Supply of sewer/drain cleaning equipment, 4 Jetting machines, 4 sucking machines for NewSukkur, Rohri, Shikarpur and Ghotki
Khairpur Mirs Improvement of sewerage system Khairpur City (completed in-2010) Rehabilitation of 03 water treatment plants and waste water facilities - work in progress 33% Procurement of diesel generator sets for the disposal of wastewater (06 Shikarpur and 05
Khairpur) - Project Completed Rehabilitation of wastewater treatment plant at existing stabilisation Ponds at Jamali Goth,
Khairpur Diverting wastewater of all disposal stations from Mir Wah canal to safe discharge point by
providing additional force-main for disposal stations at Khairpur SCADA system for water supply and waste water facilities at Khairpur, Rohri, Sukkur, New
Sukkur, Ghotki, Shikarpur and Jacobabad
Shikarpur Replacement of blocked sewers with covered drains Rehabilitation of 03 water treatment plants and waste water facilities - work in progress 33% Procurement of diesel generator sets for the disposal of wastewater (06 Shikarpur and 05
Khairpur) - project completed
Larkana Sanitation, drainage, sewerage strategy and prioritised works (completed-in 2012) Rehabilitation and Improvement of sewerage and drainage system of Larkana (based on
detailed design of sewerage project consultancy of Federal Government) including 13transformers for 13 disposal stations where new submersible pumps have been installed
Jacobabad Small capital works/projects for operational improvement of water supply and sewerage
system of Jacobabad and Ghotki SCADA system for water supply and waste water facilities at Khairpur, Rohri, Sukkur, New
Sukkur, Ghotki, Shikarpur and Jacobabad
Ghotki Small capital works/projects for operational improvement of water supply and sewerage
system of Jacobabad and Ghotki Supply of sewer/drain cleaning equipment, 4 Jetting machines, 4 sucking machines for New
Sukkur, Rohri, Shikarpur and Ghotki SCADA system for water supply and waste water facilities at Khairpur, Rohri, Sukkur, New
Sukkur, Ghotki, Shikarpur and Jacobabad
Karachi Sewerage (S-III) Project
Karachi Sewerage Project S-III is a mega project for treated sewerage disposal for Karachi106 havinga cost of Rs. 7.982 billion out of which Federal Government has to contribute Rs. 3.991 billion. The
106 Greater Karachi Sewerage Plan S III 2007-11 PC-1. Government of Sindh

138
project is conceived to enhance the capacity of sewerage treatment of 500 MGD. The totalsewerage generated in the city is 465 MGD. Rs. 1 billion has been allocated in the ADP 2015-16.This project will have immense environmental and health related benefits, in keeping with thevision of a clean, green Sindh107. The project has a cost sharing mechanism between Governmentof Pakistan, Government of Sindh and Karachi Ports Trust.
Saaf Suthro Sindh Programme
The Saaf Suthro Sindh (SSS) Programme is an initiative of the LG&TPD, Government of Sindh,which has been conceived as an additional component of the Sindh Inter-sectoral NutritionSupport Programme (NSP).
The common objective of the SSS programme and the NSP is to improve the nutritional status ofthe rural communities through sanitation interventions. The SSS programme is also aligned withthe Federal Government Vision 2025 and aims to achieve an open defecation free Sindh by 2025.The SSS will be implemented through the Directorate of Sanitation based in the LG&TPD which willbe responsible for all sanitation related interventions in the province and also maintain integratedcoordination with the Nutrition Programme for the desired results of SSS. The SSS is the first phasefor achieving the 2025 objectives and will target 50% villages in 13 districts of Sindh. Thesedistricts include:
1) Jacobabad, 2) Kashmore, 3) Kambar-Shahdadkot, 4) Larkana, 5) Tharparker, 6) Badin, 7) Sanghar8) Tando Muhammad Khan 9) Umarkot 10) Shikarpur 11) Dadu 12) Thatta; and 13) Sujawal
The SSS builds upon PATS by selecting the CLTS and Sanitation Marketing approaches as theinstruments of change. The SSS model is an advanced model with additional components thathave been included based on learnings from best practices. These include linkages with dutybearers, participatory health and hygiene, and development of end of pipe treatment. Behaviourchange and sustainability beyond the life of the project are also an integral part of the SSS projectwith some linkages with schools. At the provincial level, a Directorate of Sanitation will beestablished at LG&TPD for implementing the programme activities while working closely withNGOs – called Implementation Partners (IPs).
Sindh Municipal Services Delivery Programme
The US Government through USAID in Pakistan has earmarked a grant of US$ 66.0 million for thedevelopment of municipal infrastructure in six selected towns in 2010 flood affected districts ofthe province. Under the Sindh Municipal Services Delivery Programme (SMSDP) emphasis wasgiven to smaller towns, falling outside the purview of SCIP. Accordingly, Jacobabad, Qambar,Shahdadkot, Mehar, Khairpur Nathan Shah and Johi were selected for the USAID assisteddevelopment work under the programme. In the first phase, the construction works on JacobabadWater Supply System are currently underway while work on Waste Water and Solid WasteSystems in Jacobabad have also been initiated.
107 Budget 2015-16. Budget Speech, Minister for Finance, Finance Department, Government of Sindh
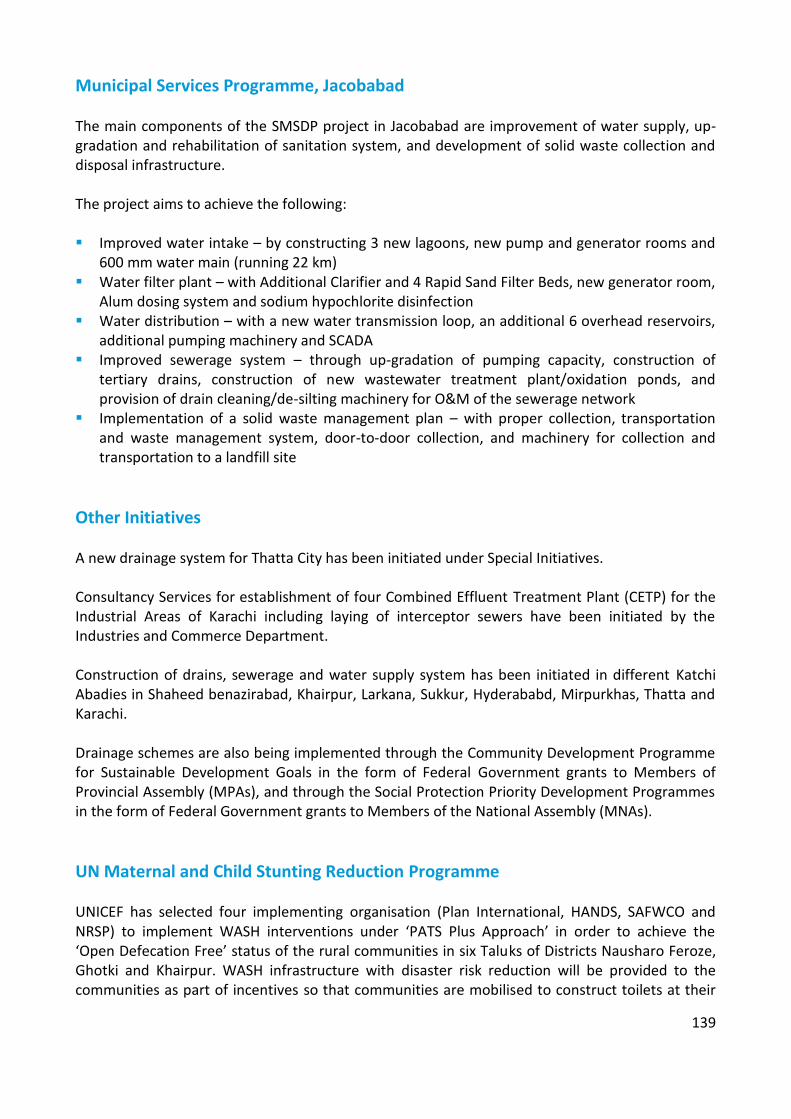
139
Municipal Services Programme, Jacobabad
The main components of the SMSDP project in Jacobabad are improvement of water supply, up-gradation and rehabilitation of sanitation system, and development of solid waste collection anddisposal infrastructure.
The project aims to achieve the following:
Improved water intake – by constructing 3 new lagoons, new pump and generator rooms and600 mm water main (running 22 km)
Water filter plant – with Additional Clarifier and 4 Rapid Sand Filter Beds, new generator room,Alum dosing system and sodium hypochlorite disinfection
Water distribution – with a new water transmission loop, an additional 6 overhead reservoirs,additional pumping machinery and SCADA
Improved sewerage system – through up-gradation of pumping capacity, construction oftertiary drains, construction of new wastewater treatment plant/oxidation ponds, andprovision of drain cleaning/de-silting machinery for O&M of the sewerage network
Implementation of a solid waste management plan – with proper collection, transportationand waste management system, door-to-door collection, and machinery for collection andtransportation to a landfill site
Other Initiatives
A new drainage system for Thatta City has been initiated under Special Initiatives.
Consultancy Services for establishment of four Combined Effluent Treatment Plant (CETP) for theIndustrial Areas of Karachi including laying of interceptor sewers have been initiated by theIndustries and Commerce Department.
Construction of drains, sewerage and water supply system has been initiated in different KatchiAbadies in Shaheed benazirabad, Khairpur, Larkana, Sukkur, Hyderababd, Mirpurkhas, Thatta andKarachi.
Drainage schemes are also being implemented through the Community Development Programmefor Sustainable Development Goals in the form of Federal Government grants to Members ofProvincial Assembly (MPAs), and through the Social Protection Priority Development Programmesin the form of Federal Government grants to Members of the National Assembly (MNAs).
UN Maternal and Child Stunting Reduction Programme
UNICEF has selected four implementing organisation (Plan International, HANDS, SAFWCO andNRSP) to implement WASH interventions under ‘PATS Plus Approach’ in order to achieve the‘Open Defecation Free’ status of the rural communities in six Taluks of Districts Nausharo Feroze,Ghotki and Khairpur. WASH infrastructure with disaster risk reduction will be provided to thecommunities as part of incentives so that communities are mobilised to construct toilets at their

140
household level. WASH in Schools (WinS) component will be addressed under ‘Three StarApproach’ to improve the learning environment for school children and teachers – particularlygirls. WinS interventions will also ensure that school children have access to WASH facilities intheir learning environment and group handwashing will be promoted through the provision ofhandwashing stations so that daily group handwashing becomes the regular feature for theiractivities.
Rural Sanitation Scale-up Strategy
The strategy to scale up rural sanitation e.g. under the ‘UN Maternal and Child Stunting ReductionProgramme’ includes:
Extensive series of activities undertaken to improve the living conditions of people and toachieve 100% ODF at Taluka level.
Under the cascading model, social mobilisation activities will be one of the key components toachieve this goal/objective through Social Mobilisers, Community Resource Persons and LadyHealth Workers.
Overall project will be implemented by combining hardware and software components thatare necessary to create a healthy environment and to develop or support safe water,sanitation and hygiene practices. It focuses on development of life-skills, a healthy and safeenvironment for the targeted population.
The implementation strategy is guided by human rights based approaches particularly ensuring‘Equity’ agenda and ‘Gender Mainstreaming’ embedded within WASH interventionsexclusively. In addition, ‘Disaster Risk Reduction’ approaches will be adopted to ‘buildresilience’ of rural communities during the emergency situations – particularly floods in Sindh.
As a result of project interventions in targeted areas, the initiative aims to achieve the following:
Water Supply: people (including women and children) will have access to safe drinking waterthrough the provision of small water supply systems (raised hand pumps with DRR) – waterquality monitoring and testing will be given due consideration and project interventions willensure to build the capacity of service providers, WASH Committees as well as communities –much focus will also be given on ‘community led water safety and security’ planning so thatpeople have access to safe drinking water.
Rural Sanitation under PATS Plus Approach: By the end of the project, all project areas will bedeclared/certified as 100% Open Defecation Free – under sanitation, a series of interventionswill be undertaken like adaptation of cascading model for extensive social mobilisation andtriggering communities to construct toilets through social mobilisers, community resourcepersons and LHWs, formation of WASH Committees, identification of local masons andentrepreneurs and ‘Behaviour Change Communication’ campaigns at community leveltargeting the key segments. Standardised capacity building planning and trainings shall bedelivered by implementing partners to all local activists (including social organisers,community resource persons, WASH Committees, local masons and entrepreneurs). Thesetrainings will ensure to roll out cascading model and achieve the quality results.

141
Health and Hygiene: Health and hygiene related key messages and sessions will be deliveredto the community so that key social norms are created particularly, handwashing with soapduring critical times and proper use of toilet and water safety practices through educatingthem on household water treatment options.
WASH in Schools: School children in target areas will have access to WASH facilities in theirschools. WASH clubs will be institutionalised after providing improved WASH facilities inschools which would help in mobilising households to move up the sanitation ladder and adoptimproved practices e.g. treatment of water by boiling before use at household level,construction of latrines and consuming a balanced diet. Children at school are direct recipientsof improved WASH services at school which help in improving enrolment and retention rates,especially among girls at the age of puberty. In addition, under ‘Three Star Approach’, grouphandwashing will be promoted through the provision of handwashing stations so that dailygroup handwashing becomes the regular feature for their activities. This activity will beorganised as part of the routine of institutionalized WASH clubs. Evidence from previousprogrammes of UNICEF has shown the link between group hand washing at school by childrenand promotion of hand washing practices at household level by them after school. This activitywill follow the three star approach guidelines which will help in engaging children and schoolauthorities to help their school graduate from one star to two and then three stars using aprescribed methodology. School children would directly benefit from this activity butpromotion of hand washing with soap at household level by them will also benefit the targetgroup and help in community mobilization efforts through other activities. MenstruationHygiene Management will be addressed as a cross cutting theme and will be the keycomponent of WinS interventions.
WASH in Health Facilities: Catchment populations in target areas will have access to WASHfacilities in health centres. Improved WASH facilities would be provided in healthcarefacilities/and CMAM sites, adopting construction manuals and standards, for reducingvulnerability of WASH related infections in pregnant/lactating women and children visiting thehealthcare facilities. Improved WASH activities at healthcare facilities will also help inimproving health seeking behaviour, reporting cases of diarrhoea and promoting goodpractices e.g. use of latrines with more dignity and privacy, especially important for women.WASH facilities are a pre-requisite to inculcate improved behaviour in healthcare facilities.
Orangi Pilot Project
In the urban areas, the Orangi Pilot Project–Research and Training Institute (OPP-RTI) hasdemonstrated strategies for community participation, engagement with local governments, andengagement with utilities. It also conducts documentation and analysis of the sector. Directassistance to communities in Orangi town in north-western Karachi and the demonstration effectof OPP-RTI’s work benefited over 108,000 households (more than 865,000 people) in nearly 7,600lanes, representing almost 90% of the entire settlement of Orangi. Collectively, communitiesinvested nearly US$1.7 million of their own money in their community’s sewerage system108.
108 Pakistan Water Supply and Sanitation Sector. Volume III Executive Summaries, April 2013. International Bank forReconstruction and Development/The World Bank
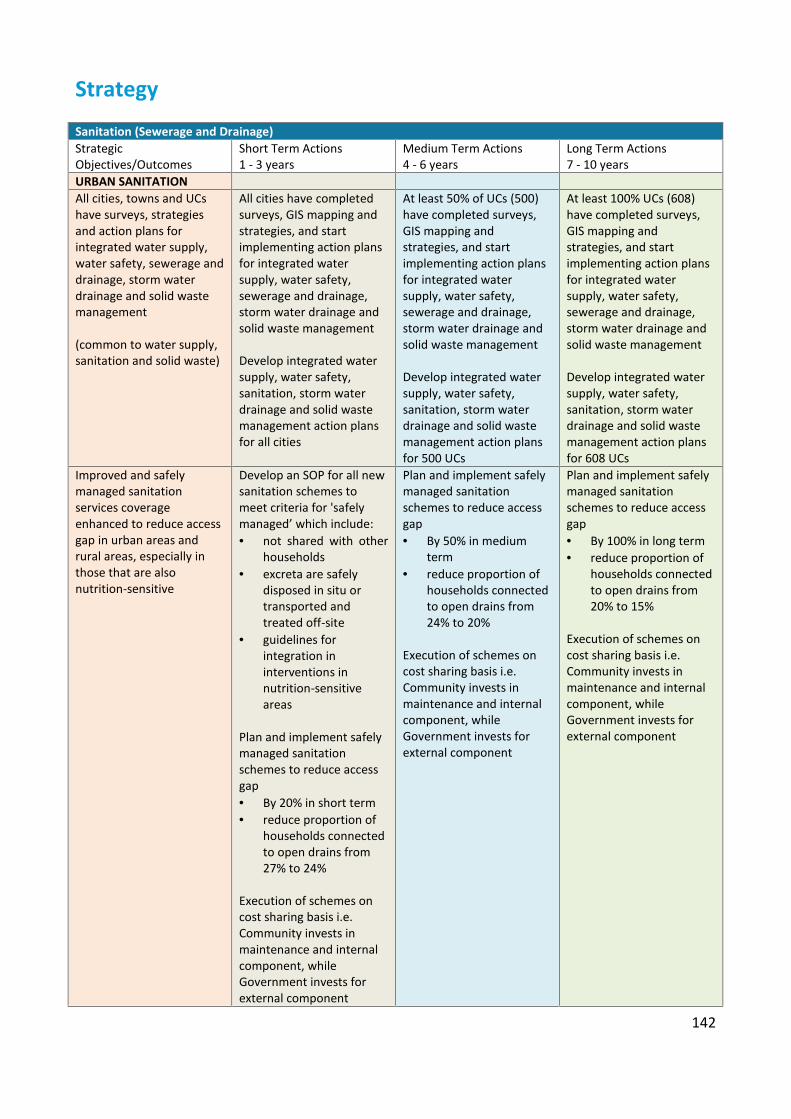
142
Strategy
Sanitation (Sewerage and Drainage)StrategicObjectives/Outcomes
Short Term Actions1 - 3 years
Medium Term Actions4 - 6 years
Long Term Actions7 - 10 years
URBAN SANITATIONAll cities, towns and UCshave surveys, strategiesand action plans forintegrated water supply,water safety, sewerage anddrainage, storm waterdrainage and solid wastemanagement
(common to water supply,sanitation and solid waste)
All cities have completedsurveys, GIS mapping andstrategies, and startimplementing action plansfor integrated watersupply, water safety,sewerage and drainage,storm water drainage andsolid waste management
Develop integrated watersupply, water safety,sanitation, storm waterdrainage and solid wastemanagement action plansfor all cities
At least 50% of UCs (500)have completed surveys,GIS mapping andstrategies, and startimplementing action plansfor integrated watersupply, water safety,sewerage and drainage,storm water drainage andsolid waste management
Develop integrated watersupply, water safety,sanitation, storm waterdrainage and solid wastemanagement action plansfor 500 UCs
At least 100% UCs (608)have completed surveys,GIS mapping andstrategies, and startimplementing action plansfor integrated watersupply, water safety,sewerage and drainage,storm water drainage andsolid waste management
Develop integrated watersupply, water safety,sanitation, storm waterdrainage and solid wastemanagement action plansfor 608 UCs
Improved and safelymanaged sanitationservices coverageenhanced to reduce accessgap in urban areas andrural areas, especially inthose that are alsonutrition-sensitive
Develop an SOP for all newsanitation schemes tomeet criteria for 'safelymanaged’ which include: not shared with other
households excreta are safely
disposed in situ ortransported andtreated off-site
guidelines forintegration ininterventions innutrition-sensitiveareas
Plan and implement safelymanaged sanitationschemes to reduce accessgap By 20% in short term reduce proportion of
households connectedto open drains from27% to 24%
Execution of schemes oncost sharing basis i.e.Community invests inmaintenance and internalcomponent, whileGovernment invests forexternal component
Plan and implement safelymanaged sanitationschemes to reduce accessgap By 50% in medium
term reduce proportion of
households connectedto open drains from24% to 20%
Execution of schemes oncost sharing basis i.e.Community invests inmaintenance and internalcomponent, whileGovernment invests forexternal component
Plan and implement safelymanaged sanitationschemes to reduce accessgap By 100% in long term reduce proportion of
households connectedto open drains from20% to 15%
Execution of schemes oncost sharing basis i.e.Community invests inmaintenance and internalcomponent, whileGovernment invests forexternal component

143
Wastewater treatmentplants established in 119towns (12 per year)
Establish wastewatertreatment plants in 36towns
Establish wastewatertreatment plants in 36towns
Establish wastewatertreatment plants in 47towns
Water supply andsanitation schemes linkedwith wastewater treatment
At least 25% of newschemes have in-builtwastewater treatmentfacility
Incorporate wastewatertreatment options (likeoxidation ponds, wetlands,sewerage treatment units,community septic tanks) inrural sanitation schemes
At least 50% of newschemes have in-builtwastewater treatmentfacility
Incorporate wastewatertreatment options (likeoxidation ponds, wetlands,sewerage treatment units,community septic tanks) inrural sanitation schemes
At least 75% of newschemes have in-builtwastewater treatmentfacility
Incorporate wastewatertreatment options (likeoxidation ponds, wetlands,sewerage treatment units,community septic tanks) inrural sanitation schemes
Monitor contaminationlevels of industrial effluent
LG&HTPD, PHE&RDD,Irrigation department,PCSIR and SindhEnvironment ProtectionAgency map majorindustrial wastewaterflows and conduct periodicwastewater testing andpublic reporting ofindustrial effluent quality
Environment protectionregulations enforced
Hazard and risk GISmapping of contaminatedrivers and water bodiesdone
Conduct periodicwastewater testing andpublic reporting ofindustrial effluent quality
Environment protectionregulations enforced
Conduct periodicwastewater testing andpublic reporting ofindustrial effluent quality
Environment protectionregulations enforced
Increased proportion oftreated industrialwastewater
Set up Combined EffluentTreatment Plant (CETP) forcluster of industries wherefeasible
Identify industries withhigh volume of untreatedeffluent and prioritise forenforcement of regulations
At least 5% of industrialwastewater treated
At least 10% of industrialwastewater treated
Optimal sewage flowcapacity maintained
Sewage flows determinedfor all cities and towns, andsix monthly de-silting andcleaning of 30% drains andsewers with safe sludgedisposal in towns andzones in cities
Six monthly de-silting andcleaning of 60% drains andsewers with safe sludgedisposal in towns andzones in cities
Six monthly de-silting andcleaning of 90% drains andsewers with safe sludgedisposal in towns andzones in cities
Optimal status of sewermaintenance equipment(sucking machine, jettingmachine, sucking/jettingmachine)
Status of equipmentavailability andfunctionality determinedfor each town and cityzone
At least 30% of towns andcity zones equipped withsewer maintenanceequipment
At least 60% of towns andcity zones equipped withsewer maintenanceequipment
At least 90% of towns andcity zones equipped withsewer maintenanceequipment
Adequate and functionalcollector and branch
Status of collector andbranch sewers in each city
Phased replacement of25% non-functional
Phased replacement of50% non-functional

144
sewers and town determined
Phased replacement orlaying of new linesinstituted
collector and branchsewers or laying of newlines instituted
collector and branchsewers or laying of newlines instituted
Optimal functionality ofpumping stations
Status of pumping stationsin each city and towndetermined
Phased rehabilitation planinstituted for at least 30%dysfunctional pumpingstations
Phased rehabilitation planinstituted for at least 60%dysfunctional pumpingstations
Phased rehabilitation planinstituted for at least 90%dysfunctional pumpingstations
Systematic management ofOperation andMaintenance of sewerageand drainage systems
Develop O&M manual forsewerage and drainageincluding sewer desiltingsafety measures
Train LG&HTPD andPHE&RDD staff in use ofO&M manual
Refresher training toLG&HTPD and PHE&RDDstaff on use of O&Mmanual
Refresher training toLG&HTPD and PHE&RDDstaff on use of O&Mmanual
RURAL SANITATIONImplement rural sanitationscale-up strategy innutrition and WASHprogrammes
Ensure provision of smallwater supply systems,implement PATS PlusApproach, disseminatehealth and hygiene relatedkey messages onhandwashing with soapduring critical times andproper use of toilet andwater safety practicesthrough educating them onhousehold watertreatment options,establish WASH clubs inschools, promotehandwashing throughprovision of handwashingstations, and establishWASH in Health Facilities(13 priority districts)
Ensure provision of smallwater supply systems,implement PATS PlusApproach, disseminatehealth and hygiene relatedkey messages onhandwashing with soapduring critical times andproper use of toilet andwater safety practicesthrough educating them onhousehold watertreatment options,establish WASH clubs inschools, promotehandwashing throughprovision of handwashingstations, and establishWASH in Health Facilities(13 ongoing + 6 otherdistricts)
Ensure provision of smallwater supply systems,implement PATS PlusApproach, disseminatehealth and hygiene relatedkey messages onhandwashing with soapduring critical times andproper use of toilet andwater safety practicesthrough educating them onhousehold watertreatment options,establish WASH clubs inschools, promotehandwashing throughprovision of handwashingstations, and establishWASH in Health Facilities(19 ongoing + 10 otherdistricts)
Community awareness andsocial mobilisationregarding sanitation,nutrition and hygieneenhanced in all UCsthrough effectiveimplementation of BCCstrategy
Conduct communityawareness sessions,including women andchildren, and disseminatekey messages developedunder BCC strategy byusing billboards andleaflets in each UC everyyear (1297 UCs)
Conduct communityawareness sessions,including women andchildren, and disseminatekey messages developedunder BCC strategy byusing billboards andleaflets in each UC everyyear (1297 UCs)
Conduct communityawareness sessions,including women andchildren, and disseminatekey messages developedunder BCC strategy byusing billboards andleaflets in each UC everyyear (1297 UCs)
2 Community ResourcePersons (preferably onemale and one female)deployed for BCC for each
Deploy and orient 2594Community ResourcePersons in 1297 UCs
Maintain 2594 CommunityResource Persons in 1297UCs
Maintain 2594 CommunityResource Persons in 1297UCs

145
UC (2594 CommunityResource Persons)Safe sanitation practicespromoted in high opendefecation zones,nutrition-sensitive andpolio priority areas
Develop provincial anddistrict level road maps onPATS/ODF for identifiedvillages in 13 prioritydistricts
Incentivising the ODFvillages by laying of watersupply scheme, seweragesystem, waste watertreatment, etc in 13priority districts
Execution of schemes oncost sharing basis i.e.Community invests ininternal component, whileGovernment invests forexternal component in 13priority districts
Collaborate withinternational partners andNGOs for integrating WASHcomponent ininterventions in nutrition-sensitive areas, andstrengthening the supplyside interventionsespecially sanitationmarketing (training ofmasons, entrepreneurs andsmall businesses) in 13priority districts
Develop provincial anddistrict level road maps onPATS/ODF for identifiedvillages in 6 additionaldistricts
Incentivising the ODFvillages by laying of watersupply scheme, seweragesystem, waste watertreatment, etc in 6additional districts
Execution of schemes oncost sharing basis i.e.Community invests ininternal component, whileGovernment invests forexternal component in 6additional districts
Collaborate withinternational partners andNGOs for integrating WASHcomponent ininterventions in nutrition-sensitive areas, andstrengthening the supplyside interventionsespecially sanitationmarketing (training ofmasons, entrepreneurs andsmall businesses) in 6additional districts
Develop provincial anddistrict level road maps onPATS/ODF for identifiedvillages in 10 additionaldistricts
Incentivising the ODFvillages by laying of watersupply scheme, seweragesystem, waste watertreatment, etc in 10additional districts
Execution of schemes oncost sharing basis i.e.Community invests ininternal component, whileGovernment invests forexternal component in 10additional districts
Collaborate withinternational partners andNGOs for integrating WASHcomponent ininterventions in nutrition-sensitive areas, andstrengthening the supplyside interventionsespecially sanitationmarketing (training ofmasons, entrepreneurs andsmall businesses) in 10additional districts
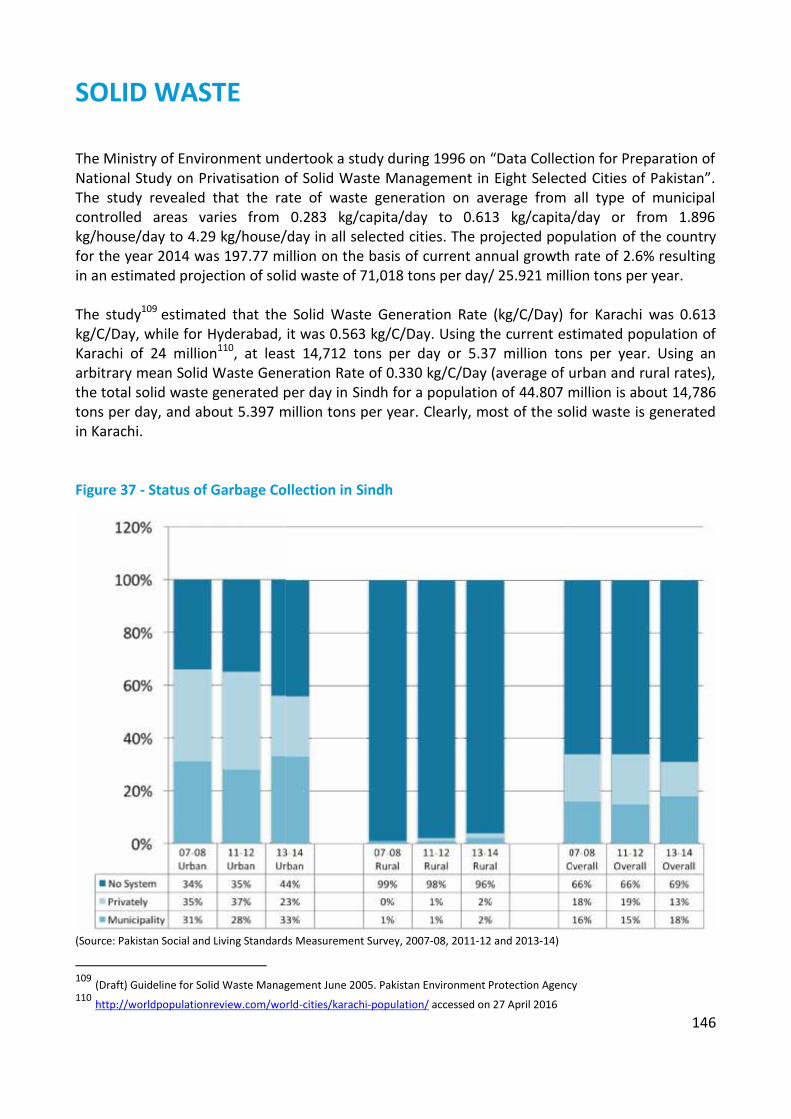
146
SOLID WASTE
The Ministry of Environment undertook a study during 1996 on “Data Collection for Preparation ofNational Study on Privatisation of Solid Waste Management in Eight Selected Cities of Pakistan”.The study revealed that the rate of waste generation on average from all type of municipalcontrolled areas varies from 0.283 kg/capita/day to 0.613 kg/capita/day or from 1.896kg/house/day to 4.29 kg/house/day in all selected cities. The projected population of the countryfor the year 2014 was 197.77 million on the basis of current annual growth rate of 2.6% resultingin an estimated projection of solid waste of 71,018 tons per day/ 25.921 million tons per year.
The study109 estimated that the Solid Waste Generation Rate (kg/C/Day) for Karachi was 0.613kg/C/Day, while for Hyderabad, it was 0.563 kg/C/Day. Using the current estimated population ofKarachi of 24 million110, at least 14,712 tons per day or 5.37 million tons per year. Using anarbitrary mean Solid Waste Generation Rate of 0.330 kg/C/Day (average of urban and rural rates),the total solid waste generated per day in Sindh for a population of 44.807 million is about 14,786tons per day, and about 5.397 million tons per year. Clearly, most of the solid waste is generatedin Karachi.
Figure 37 - Status of Garbage Collection in Sindh
(Source: Pakistan Social and Living Standards Measurement Survey, 2007-08, 2011-12 and 2013-14)
109 (Draft) Guideline for Solid Waste Management June 2005. Pakistan Environment Protection Agency110 http://worldpopulationreview.com/world-cities/karachi-population/ accessed on 27 April 2016

147
Only 31% of Sindh has proper disposal of waste solids (collected by any municipal institution,disposed of by solid waste management department or a private company vehicle collected fromhome) (Fig 37). This ranges from 56% in urban to 4% in rural areas111.
Karachi City Solid Waste
The performance of solid waste management system has always been a major cause of concern,as this municipal service was traditionally wanting in such basic aspects as primary collection ofgarbage and safe transfer to the landfill sites.
Approximately 9,000 tons of solid waste were being generated each day in 2005112. Households,trade and industrial establishments, construction activity and a variety of institutions contribute inwaste generation. The amount of solid wastes is expected to substantially increase with the rapidgrowth of population and economic activity. By the year 2020, the solid waste generation mayapproach 16,000 to 18,000 tons each day. The quality of civic life is closely related and affected bythe sanitary conditions in the residential neighbourhoods and other areas, where efficientcollection of garbage is the key to clean and healthy environment.
Figure 38 - Existing Landfill Sites in Karachi
(Source: Karachi Strategic Development Plan 2020. Master Plan Group of Offices, City District Government Karachi)
111 Pakistan Social and Living Standards Measurement Survey, 2013-14112 Adapted from Karachi Strategic Development Plan 2020. Master Plan Group of Offices, City District Government Karachi

148
it is estimated that of the total household solid waste generated daily within the City DistrictKarachi, around 4,500 tons is lifted and of this, not more than 2,000 tons makes it to one of thetwo designated city "landfill" sites - actually open dumping sites. The remainder is eitherrecovered for recycling (an estimated 1,500 tons per day) or is disposed of by burning or by illegaldumping into open drains or onto roadsides or open land (an estimated 1,400 tons)113. It isestimated that some 55,000 families depend on the informal solid waste recycling industry fortheir livelihood and with more than 1,000 operating units that the industry is worth some Rs 1.2Billion per annum.
It is important to effectively organise primary collection of garbage i.e. from the households(within the Union Councils) and locations of origin/generations such as markets, industrial areas,hospitals and recreational places. The city conspicuously lacks garbage transfer stations whichneed to be developed for better handling of the garbage and transfer to sanitary landfills (Fig 38).
Poor planning, inappropriate technology and poor management are obviously the main areas ofconcern needing serious efforts on the part of the local government and other agencies towardsefficient management and modern technological development of this sector.
Hospital Waste
Various studies have reported the waste generation in urban centres of Pakistan, however, thereis paucity of data on the situation in Sindh. In Pakistan, however, all hospital waste includinghazardous waste is considered to be a part of municipal solid waste.
There is little data on the true estimate of hospital waste being generated in Karachi City. Thereare no discrete criteria for the categorisation of hospital / clinical / healthcare unit / biohazardwaste. Furthermore, the segregation practice is not discretely observed. It is commonly observedthat segregation practices are limited or restricted to the boundaries of the source only and aremostly applied where there are source segregation practices at source. Outside the point ofgeneration of source in more than 95% cases the waste is a commingled waste i.e. mixed withmunicipal solid waste (MSW). Therefore, in order to estimate the realistic quantities of hospitalwaste being generated in Karachi, comprehensive studies should be undertaken to characterisethe type, composition and quantities of hospital waste generated.
Only 140 health care units (HCUs) in Karachi City dispose of their waste through incineration plantsrun by City District Government (CDG)114. The remaining HCUs dispose of their waste along withthe municipal waste. This poses a health hazard. The reasons of health hazards are:
Non-registration of HCUs either with Health Department, Government of Sindh or with CityGovernment and
Non-presence of Environment Protection Agency of Sindh at grass root level
113 Solid waste management the most important element constituting the environmental health. UKessays, March 2015114 Solid waste management the most important element constituting the environmental health. UKessays, March 2015

149
The CDG installed two incineration plants at Mewa Shah in 1996. Each has a capacity of 1000kg/hour. Incineration takes place at 800 0C in 10 minutes. At present 140 hospitals/clinics areincinerating their waste through these incinerators.
A study115 was undertaken to evaluate the current practices of segregation approaches, storagearrangements, collection and disposal systems in eight teaching hospitals of Karachi. Out of theeight hospitals visited, two (25%) were segregating sharps, pathological waste, chemical,infectious, pharmaceutical and pressurised containers at source. For handling potentiallydangerous waste, two (25%) hospitals provided essential protective gears to its waste handlers.Only one (12.5%) hospital arranged training sessions for its waste handling staff regularly. Five(62.5%) hospitals had storage areas but mostly they were not protected from access ofscavengers. Five (62.5%) hospitals disposed of their hazardous waste by burning in incinerators,two (25%) disposed of by municipal landfills and one (12.5%) was burning waste in open airwithout any specific treatment. No record of waste was generally maintained. Only two (25%)hospitals had well documented guidelines for waste management and a proper wastemanagement team.
A similar study was conducted at Shaheed Mohtarma Benazir Bhutto Medical University(SMBBMU) Hospital Larkana.to assess the hospital waste management system at different medicalwards and to determine the total daily waste generation rates116. The study found that theaverage generation rate of hospital and infectious waste was about 1.072 and 0.453 kg/bed/dayrespectively. It also observed that the existing hospital waste management system was lower thanprescribed standards. The poor waste management system in the hospital was mainly due toineffective segregation, collection, storage and dumping of waste. In addition, lack of training andprotective equipment for sanitary staff, scarcity of funds and inadequate policy of wastetreatment were also the main causes of inappropriate waste management.
The Government of Sindh has developed its Hospital Waste Management Rules 2014. However, itswide scale adoption remains a challenge. In 2015, on the directives of Minister Environment,notices for personal hearings under Section 21 (1) of Sindh Environmental Protection Act 2014were issued to 30 hospitals in the province for non-compliance of the directives requiring them tosubmit a comprehensive Hospital Waste Management Plan117.
115 Shahida Rasheed, Saira Iqbal, Lubna A. Baig, Kehkashan Muft. Hospital Waste Management in the Teaching Hospitals ofKarachi. JPMA 55:192;2005116 Kishan Chand Mukwana, Kamran Ahmed Samo, Abdul Qayoom Jakhrani. Assessment of Hospital Waste Management Systemand Generation Rates at SMBBMU Hospital Larkana. Quaid-e-Awam University Research Journal of Engineering, Science &Technology, Volume 13, No. 2, Jul-Dec. 2014117 Notices issued to 30 hospitals upon failure to submit waste management plan. Health Watch.http://healthwatch.pk/2015/12/1971 accessed on 27 April 2016
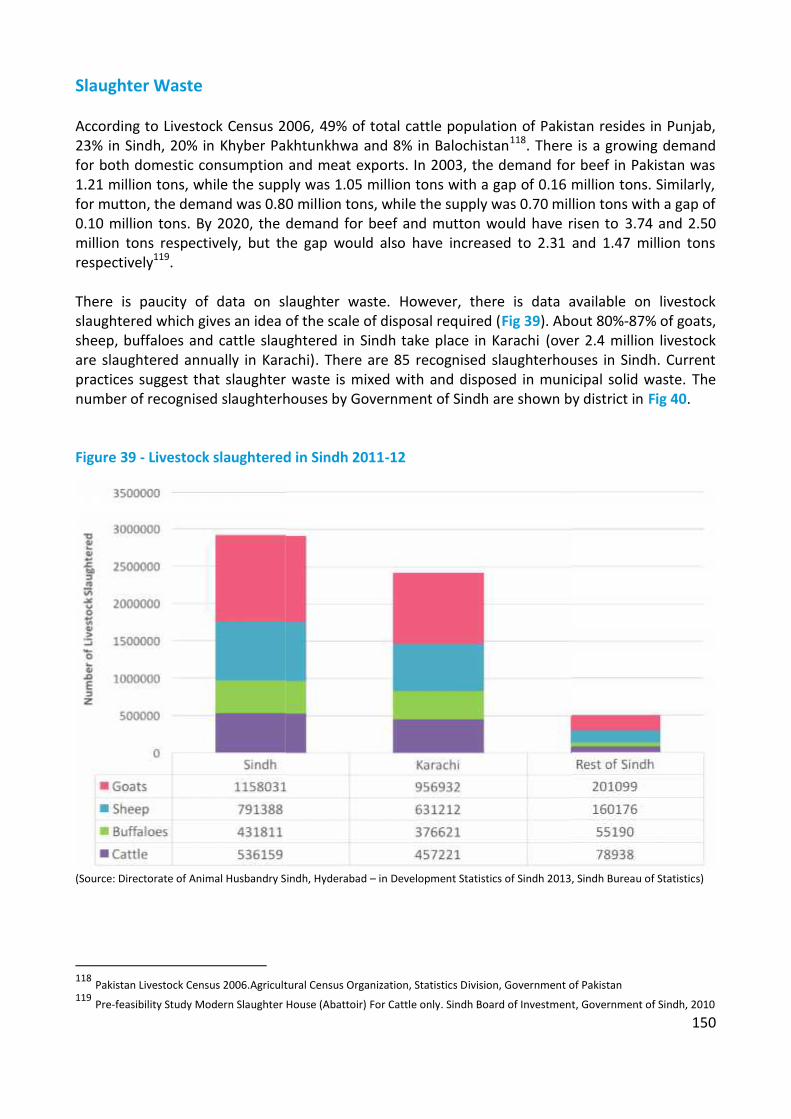
150
Slaughter Waste
According to Livestock Census 2006, 49% of total cattle population of Pakistan resides in Punjab,23% in Sindh, 20% in Khyber Pakhtunkhwa and 8% in Balochistan118. There is a growing demandfor both domestic consumption and meat exports. In 2003, the demand for beef in Pakistan was1.21 million tons, while the supply was 1.05 million tons with a gap of 0.16 million tons. Similarly,for mutton, the demand was 0.80 million tons, while the supply was 0.70 million tons with a gap of0.10 million tons. By 2020, the demand for beef and mutton would have risen to 3.74 and 2.50million tons respectively, but the gap would also have increased to 2.31 and 1.47 million tonsrespectively119.
There is paucity of data on slaughter waste. However, there is data available on livestockslaughtered which gives an idea of the scale of disposal required (Fig 39). About 80%-87% of goats,sheep, buffaloes and cattle slaughtered in Sindh take place in Karachi (over 2.4 million livestockare slaughtered annually in Karachi). There are 85 recognised slaughterhouses in Sindh. Currentpractices suggest that slaughter waste is mixed with and disposed in municipal solid waste. Thenumber of recognised slaughterhouses by Government of Sindh are shown by district in Fig 40.
Figure 39 - Livestock slaughtered in Sindh 2011-12
(Source: Directorate of Animal Husbandry Sindh, Hyderabad – in Development Statistics of Sindh 2013, Sindh Bureau of Statistics)
118 Pakistan Livestock Census 2006.Agricultural Census Organization, Statistics Division, Government of Pakistan119 Pre-feasibility Study Modern Slaughter House (Abattoir) For Cattle only. Sindh Board of Investment, Government of Sindh, 2010

151
Figure 40 - Number of recognised slaughterhouses by district 2011-12
(Source: Directorate of Animal Husbandry Sindh, Hyderabad – in Development Statistics of Sindh 2013, Sindh Bureau of Statistics)
151
Figure 40 - Number of recognised slaughterhouses by district 2011-12
(Source: Directorate of Animal Husbandry Sindh, Hyderabad – in Development Statistics of Sindh 2013, Sindh Bureau of Statistics)
151
Figure 40 - Number of recognised slaughterhouses by district 2011-12
(Source: Directorate of Animal Husbandry Sindh, Hyderabad – in Development Statistics of Sindh 2013, Sindh Bureau of Statistics)

152
Overview of solid waste management practices
Table 12 illustrates the practices in selected secondary cities as part of data obtained for the SindhEnvironment Management Programme. It shows less than satisfactory solid waste management,outmoded collection and disposal methods, lack of adequate equipment and infrastructure andlow operating efficiency.
Table 12 - Overview of solid waste management in selected secondary cities
Mirpur Khas Umerkot Johi Larkana Shikarpur SukkurUrbanpopulation(2006)
231,276 55,615 29,296 38,996 164,727 240,776
CollectionvehiclesTractortrolleys 6 4 2 8 5 7
Dumpertrucks 2 5
Containercarriers 1
Mechanicalloaders 2 2 1 1
Donkey carts 9 1 20 10 11Hand carts 70 21 10 40 24 150Primary-secondarytransfer
Open heaps Open heaps Open heaps Open heaps Open heaps Open heaps
Disposalmethods
Opendumping
Opendumping
Opendumping
Opendumping
Opendumping
Opendumping
Hospitalwastes
Collected withmunicipalwastes
Burnt at siteNegligible (onsite indisposal)
Opendumping
Collected withmunicipalwastes
Collected withmunicipalwastes
Dead animals Collected withmunicipalwastes
Collected withmunicipalwastes
Collected withmunicipalwastes
Collected withmunicipalwastes
Collected withmunicipalwastes
Collected withmunicipalwastes
Annualexpenditure(Rs)
16,686,000 9,224,700 3,185,000 3,070,000 13,517,000 29,732,000
Collectioncost/ton (Rs) 952 1487 550 766 823 1037
Cost perinhabitant peryear (Rs)
72 166 51 79 82 123
Collectionefficiency (%) 48 80 73 62.5 65 72
Staff per 1000population 1.5 2.59 1.06 0.97 0.92 1.79
Contractsawarded toprivate sector
1 1
(Source: Urban Municipal Services Sindh Secondary Cities Urban Sector Assessment Prepared under ADB PPTA 4534 – Sindh BasicUrban Services Project, 2007)
153
Recent Initiatives for Solid Waste in Sindh
Sindh Cities Improvement Project
Under SCIP, the NSUSC is being implemented in 7 cities (Sukkur/New Sukkur, Rohri, Khairpur Mirs,Shikarpur, Larkana, Jacobabad and Ghotki). This includes investments in primary and secondarystorage and collection, waste reduction, recycling / reuse and recovery (including incinerationwhere appropriate), treatment, and final sanitary disposal. The Solid Waste Management (SWM)also includes:
Construction of landfill facilities Procurement of specialised solid waste collection and disposal equipment Provision of improved communal bins for waste storage
Some salient plans in progress or completed include the following:
Sukkur/New Sukkur Skip platforms for solid waste collection (project completed in 2011) Additional SWM secondary collection equipment and skips and system, and replacement of
old TMA system including new solid waste management secondary collection equipment(including road mechanical sweepers and small skid loaders for all T1 and T2 Towns. 3.5 cmSkips (68 Nos), Side Loading Trucks (13 Nos), Skid Loader (2 Nos))
Rohri Site investigation for SWM landfill sites (in progress since July 2011- due to land issues) Skip platforms for solid waste collection (project completed in 2011)
Khairpur Mirs Site investigation for SWM landfill sites (in progress since July 2011- due to land issues) Skip platforms for solid waste collection (project completed in 2011) Construction of three sanitary landfill sites, disposal works, landfill equipment landfill in Rohri,
Sukkur, Khairpur and Shikarpur Additional SWM secondary collection equipment and skips and system, and replacement of
old TMA system including new solid waste management secondary collection equipment(including road mechanical sweepers and small skid loaders for all T1 and T2 Towns
Shikarpur Site investigation for SWM landfill sites (in progress since July 2011- due to land issues) Skip platforms for solid waste collection (project completed in 2011) Construction of three sanitary landfill sites, disposal works, landfill equipment landfill in Rohri,
Sukkur, Khairpur and Shikarpur Additional SWM secondary collection equipment and skips and system, and replacement of
old TMA system including new solid waste management secondary collection equipment(including road mechanical sweepers and small skid loaders for all T1 and T2 Towns
Larkana Skip platforms for solid waste collection (project completed in 2011)

154
Construction of three sanitary landfill sites, disposal works, landfill equipment landfill in Rohri,Sukkur, Khairpur and Shikarpur
Additional SWM secondary collection equipment and skips and system, and replacement ofold TMA system including new solid waste management secondary collection equipment(including road mechanical sweepers and small skid loaders for all T1 and T2 Towns
Ghotki Construction of three sanitary landfill sites, disposal works, landfill equipment landfill in Rohri,
Sukkur, Khairpur and Shikarpur Additional SWM secondary collection equipment and skips and system, and replacement of
old TMA system including new solid waste management secondary collection equipment(including road mechanical sweepers and small skid loaders for all T1 and T2 Towns
Sindh Solid Waste Management
Government of Sindh has established the Sindh Solid Waste Management Board to support localcouncils in managing municipal solid waste, medical hazardous waste and industrial hazardouswaste in all cities of the province120.
Sindh Government has assigned very high priority to this sector as it has a direct impact on thehealth of the people and environment of cities. In its Phase I, Integrated Solid Waste ManagementProjects are being started in 06 districts of Karachi, Hyderabad, Shaheed Benazirabad and Larkanadistricts. These projects are being undertaken on fast track basis and will be on ground fromOctober 2015 onwards. In Phase II, 10 districts of Sindh will be taken up and in Phase III allremaining districts will be completed.
Sindh Solid Waste Management Board is introducing Integrated Municipal Solid WasteManagement Projects whereby the present method of manual sweeping and collection andtransportation of garbage will be replaced by a modern, scientific and environment friendlysystem of mechanical sweepers, door to door collection of garbage, complete ban on burning ofgarbage, and transportation of waste from community dustbins to Garbage Transfer Stations andthen to Sanitary Engineered Landfill sites.
These initiatives include the following under Services, General Administration and CoordinationDepartment:
Establishment of six garbage transfer stations with Material Recovery (MR) and RefusedDerived Fuel (RDF) facility in Karachi
Development of new sanitary engineered landfill site in Karachi Development of sanitary engineered existing 2 landfill sites and their scientific improvement in
Karachi Integrated solid waste Management Project Nawabshah Municipal Committee, Shaheed
Benazirabad District. (Phase I) (Front end Collection System and two Garbage TransferStations)
120 Budget 2015-16. Budget Speech, Minister for Finance, Finance Department, Government of Sindh

155
Integrated Municipal Solid Waste Management Project Nawabshah Municipal Committee,Shaheed Benazirabad District (Phase-II) – landfill site and material recovery facility
Integrated Municipal Solid Waste Management Project Municipal Corporation, Larkana (Phase-I)
Integrated Municipal Solid Waste Management Project Municipal Corporation, Larkana (Phase-II) – landfill site and material recovery facility
156
Strategy
Solid WasteStrategicObjectives/Outcomes
Short Term Actions1 - 3 years
Medium Term Actions4 - 6 years
Long Term Actions7 - 10 years
All cities, towns and UCshave surveys, strategiesand action plans forintegrated water supply,water safety, sewerage anddrainage, storm waterdrainage and solid wastemanagement
(common to water supply,sanitation and solid waste)
All cities have completedsurveys, GIS mapping andstrategies, and startimplementing action plansfor integrated watersupply, water safety,sewerage and drainage,storm water drainage andsolid waste management
Develop integrated watersupply, water safety,sanitation, storm waterdrainage and solid wastemanagement action plansfor all cities
Conduct wastecharacterisation studies(including hospital waste)for mega cities
At least 50% of UCs (500)have completed surveys,GIS mapping andstrategies, and startimplementing action plansfor integrated watersupply, water safety,sewerage and drainage,storm water drainage andsolid waste management
Develop integrated watersupply, water safety,sanitation, storm waterdrainage and solid wastemanagement action plansfor 500 UCs
Conduct wastecharacterisation studies(including hospital waste)for intermediate cities
At least 100% UCs (608)have completed surveys,GIS mapping andstrategies, and startimplementing action plansfor integrated watersupply, water safety,sewerage and drainage,storm water drainage andsolid waste management
Develop integrated watersupply, water safety,sanitation, storm waterdrainage and solid wastemanagement action plansfor 608 UCs
Integrated solid wastemanagement implementedin 29 districts (5 in shortterm, 10 in medium term,and 13 in long term)
Develop integrated solidwaste management in 5districts (Karachi,Hyderabad, ShaheedBenazirabad and Larkana)
Develop integrated solidwaste management in 10districts
Develop integrated solidwaste management in 14districts
Town and UC level profilesdeveloped for wastewaterand solid waste in 119towns and 1297 UCs
Conduct a study onwastewater and solidwaste in 119 towns todevelop townlevel profiles (includinginfrastructure, equipmentand staffing)
Conduct a study onwastewater and solidwaste in 1297 UCs todevelop UC level profiles(including infrastructure,equipment and staffing)
Periodic updating of townand UC level profiles
Periodic updating of townand UC level profiles
Solid waste collection anddisposal
At least 70% of solid wastegenerated is collected anddisposed of per day
At least 30 town councilsproviding door to doorcollection service
Village based solid wastemanagement piloted inselected villages
At least 80% of solid wastegenerated is collected anddisposed of per day
At least 60 town councilsproviding door to doorcollection service
Village based solid wastemanagement scaled up to10% villages in Sindh
At least 90% of solid wastegenerated is collected anddisposed of per day
At least 100 town councilsproviding door to doorcollection service
Village based solid wastemanagement scaled up to30% villages in Sindh
Effective solid wastemanagement
Develop a minimumstandards list of staffing,
Upgrade the hardware andequipment for solid waste
Upgrade the hardware andequipment for solid waste
157
hardware and equipmentfor solid wastemanagement and upgradein 30 town councils (10 peryear)
management in 30 towncouncils (10 per year)
management in 40 towncouncils (10 per year)
Efficient Solid wastedisposal and recycling
At least 30% town councilshave established transferstations to reduce disposaltime
Recycle at least 10% ofsolid waste by systematicseparation
Sanitary landfill optionsidentified for towns wherefeasible
At least 60% town councilshave established transferstations to reduce disposaltime
Recycle at least 15% ofsolid waste by systematicseparation
At least 20 towns served bysanitary landfill sites
At least 90% town councilshave established transferstations to reduce disposaltime
Recycle at least 20% ofsolid waste by systematicseparation
At least 40 towns served bysanitary landfill sites
Waste to Energy Formalise contracts withcompanies for waste toenergy options
At least each mega city hasa WTE option in place
At least each intermediatecity has a WTE in place
Safe hospital high riskwaste disposal
Health departmentestablishes hospital wastemanagement committeesin each hospital in line withthe Environmental andMedical WasteManagement Guidelines
Health department incollaboration withLG&HTPD orients eachhospital wastemanagement committeeon Environmental andMedical WasteManagement Guidelines,municipal solid waste andhigh risk waste and theirseparate disposal
Each mega city andintermediate city has acentralised and functionalhigh risk hospital wastedisposal facility
At least 50% of hospitalhigh risk waste disposed ofsafely
Each town has acentralised and functionalhigh risk hospital wastedisposal facility
At least 60% of hospitalhigh risk waste disposed ofsafely
At least 90% of hospitalhigh risk waste disposed ofsafely
Safe and hygienicSlaughterhouses
Update status of allslaughterhouses(recognised andunrecognised) in eachdistrict and prioritise thosefor rehabilitation, solid
Provide refresher trainingon slaughterhouse safetyand hygiene practiceguidelines to 100%slaughterhouse staff inrecognised
Provide refresher trainingon slaughterhouse safetyand hygiene practiceguidelines to 100%slaughterhouse staff inrecognised
158
waste and wastewatermanagement
Develop slaughterhousesafety and hygiene practiceguidelines and orient 100%slaughterhouse staff inrecognisedslaughterhouses in safehandling and disposal ofcarcass, entrails, hides, andwastewater
At least 30% of municipalservices dispose ofslaughterhouse solid wastesafely
slaughterhouses in safehandling and disposal ofcarcass, entrails, hides, andwastewater
At least 60% of municipalservices dispose ofslaughterhouse solid wastesafely
slaughterhouses in safehandling and disposal ofcarcass, entrails, hides, andwastewater
At least 90% of municipalservices dispose ofslaughterhouse solid wastesafely
Efficient and effectivemanagement of IndustrialSolid Waste
Determine the currentstatus of industrial solidwaste production anddisposal
Develop strategies andactions for efficient andeffective management ofindustrial solid waste
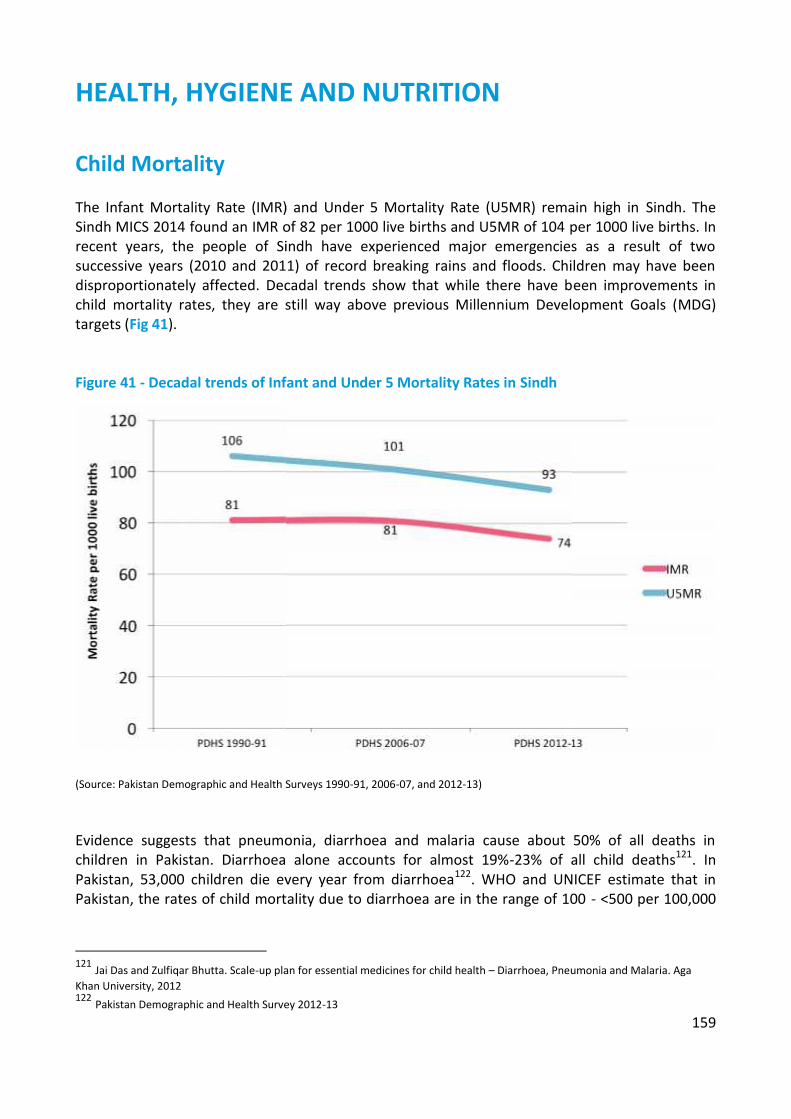
159
HEALTH, HYGIENE AND NUTRITION
Child Mortality
The Infant Mortality Rate (IMR) and Under 5 Mortality Rate (U5MR) remain high in Sindh. TheSindh MICS 2014 found an IMR of 82 per 1000 live births and U5MR of 104 per 1000 live births. Inrecent years, the people of Sindh have experienced major emergencies as a result of twosuccessive years (2010 and 2011) of record breaking rains and floods. Children may have beendisproportionately affected. Decadal trends show that while there have been improvements inchild mortality rates, they are still way above previous Millennium Development Goals (MDG)targets (Fig 41).
Figure 41 - Decadal trends of Infant and Under 5 Mortality Rates in Sindh
(Source: Pakistan Demographic and Health Surveys 1990-91, 2006-07, and 2012-13)
Evidence suggests that pneumonia, diarrhoea and malaria cause about 50% of all deaths inchildren in Pakistan. Diarrhoea alone accounts for almost 19%-23% of all child deaths121. InPakistan, 53,000 children die every year from diarrhoea122. WHO and UNICEF estimate that inPakistan, the rates of child mortality due to diarrhoea are in the range of 100 - <500 per 100,000
121 Jai Das and Zulfiqar Bhutta. Scale-up plan for essential medicines for child health – Diarrhoea, Pneumonia and Malaria. AgaKhan University, 2012122 Pakistan Demographic and Health Survey 2012-13

160
children123. PSLM 2014-15 found that overall 6% of children under five had diarrhoea in the past30 days preceding the survey, with urban at 8% and rural at 5%. The prevalence of diarrhoea washighest in Naushahro Feroze (12%), Hyderabad (10%) and Sanghar (10%), and lowest in Kashmore,Shahdadkot and Dadu (each at 2%). About 96% of children under five years with diarrhoeareceived treatment from a practitioner.
Sindh MICS 2014 found 69.2% of children under 5 years who had diarrhoea in the last 2 weekssought advice or treatment from a health facility or provider; 11.6% of children under 5 years withdiarrhoea in the last 2 weeks received oral rehydration solution (ORS) and zinc; and 41% ofchildren under 5 years with diarrhoea in the last 2 weeks received ORT (ORS packet, pre-packagedORS fluid, recommended homemade fluid or increased fluids) and continued feeding during theepisode of diarrhoea.
PDHS 2012-13 found that of children under 5 years, 21.9% in urban and 23.9% in rural Sindhsuffered from diarrhoea in the two weeks preceding the survey. The survey also found that overallin Pakistan, children aged 6-11 months (35.3%) were the most vulnerable and were three timesmore likely to have had diarrhoea than children aged 48-59 months (12%). In Pakistan124, 10.8% ofall deaths in children under 5 years of age and 17.7% of all child deaths were due to diarrhoea. InSindh, 10.1% of all deaths in children under 5 years of age were due to diarrhoea, and this was thefifth most important cause after birth asphyxia (21.5%), sepsis (16.1%), pneumonia (13.7%) andprematurity (10.3%).
Figure 42 illustrates that as the rates of improved sanitation decrease, the rates of IMR and U5MRincrease. This trend however is visible when IMR and U5MR rates are compared to improveddrinking water suggesting that low rates of improved sanitation are a risk factor for child mortality(Fig 43).
123 Liu L, Johnson HL, Cousens S, et al. Child Health Epidemiology Reference Group of WHO and UNICEF. Global, regional, andnational causes of child mortality: an updated systematic analysis for 2010 with time trends since 2000. Lancet. 2012;379(9832)124 Pakistan Demographic and Health Survey 2006-07
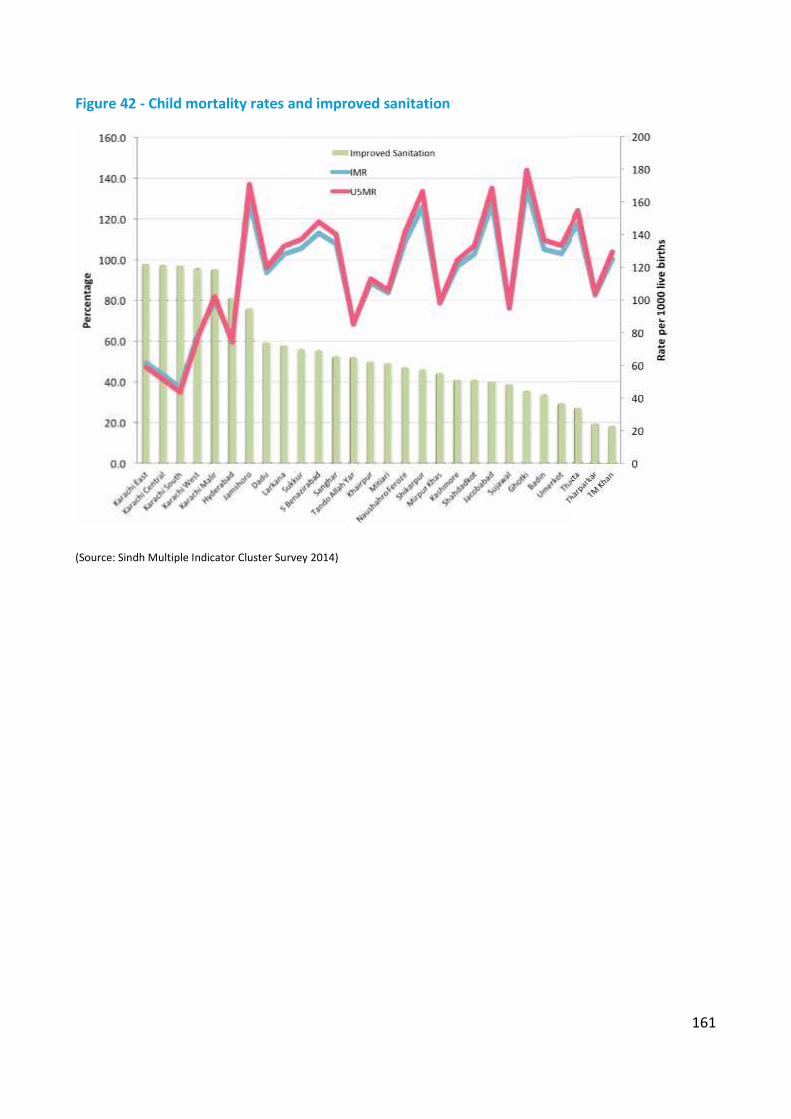
161
Figure 42 - Child mortality rates and improved sanitation
(Source: Sindh Multiple Indicator Cluster Survey 2014)
161
Figure 42 - Child mortality rates and improved sanitation
(Source: Sindh Multiple Indicator Cluster Survey 2014)
161
Figure 42 - Child mortality rates and improved sanitation
(Source: Sindh Multiple Indicator Cluster Survey 2014)

162
Figure 43 - Childhood mortality rates and improved drinking water
(Source: Sindh Multiple Indicator Cluster Survey 2014)
Diarrhoea
On a review of the status of diarrhoea in the last 30 days in children under 5 years, generally theprevalence of diarrhoea is more in urban areas than rural areas (Fig 44). Of particular note areurban diarrhoea rates in Naushahro Feroze (24%), Sanghar (20%), and Tando Muhammad Khan(14%). Hyderabad has similar rates for urban (10%) and rural (11%). A high rural rate is also seenfor Sukkur (11%).
When rural diarrhoea rates for each district are overlain with no toilet rates, the data suggeststhat in most districts there may be other factors like water quality that may be responsible fordiarrhoea in children under 5 years (Fig 45). The trends in Sukkur and Naushahro Feroze aresuggestive of an association between no toilet and diarrhoea. Similar trends are also observed forShaheed Benazirabad, Ghotki, Shikarpur, Larkana, Shahdadkot, Tando Allah Yar and Karachi.

163
Figure 44 – Diarrhoea in last 30 days in children under 5 years
(Source: Pakistan Social and Living Standards Measurement Survey, 2014-15)
163
Figure 44 – Diarrhoea in last 30 days in children under 5 years
(Source: Pakistan Social and Living Standards Measurement Survey, 2014-15)
163
Figure 44 – Diarrhoea in last 30 days in children under 5 years
(Source: Pakistan Social and Living Standards Measurement Survey, 2014-15)

164
Figure 45 - No Toilet and Diarrhoea in last 30 days in children under 5 years
(Source: Pakistan Social and Living Standards Measurement Survey, 2014-15)
Economic QuintilesFigures 46 and 47 show that the lowest quintile is the most vulnerable to health risks and has theleast access to improved drinking water and improved sanitation. Interestingly, in the higherquintiles, the rate of improved water supply actually decreases due to use of other sources ofwater supply like tanker. Furthermore, Fig 48 illustrates the high prevalence rates of no toilet inthe poorer quintiles compared to the richer ones. The issue of no toilet is found predominantly inthe rural compared to urban areas.

165
Figure 46 – Improved Water Supply and Economic Quintiles
(Source: Pakistan Social and Living Standards Measurement Survey, 2014-15)
165
Figure 46 – Improved Water Supply and Economic Quintiles
(Source: Pakistan Social and Living Standards Measurement Survey, 2014-15)
165
Figure 46 – Improved Water Supply and Economic Quintiles
(Source: Pakistan Social and Living Standards Measurement Survey, 2014-15)

166
Figure 47 - Improved Sanitation and Quintiles
(Source: Pakistan Social and Living Standards Measurement Survey, 2014-15)
166
Figure 47 - Improved Sanitation and Quintiles
(Source: Pakistan Social and Living Standards Measurement Survey, 2014-15)
166
Figure 47 - Improved Sanitation and Quintiles
(Source: Pakistan Social and Living Standards Measurement Survey, 2014-15)
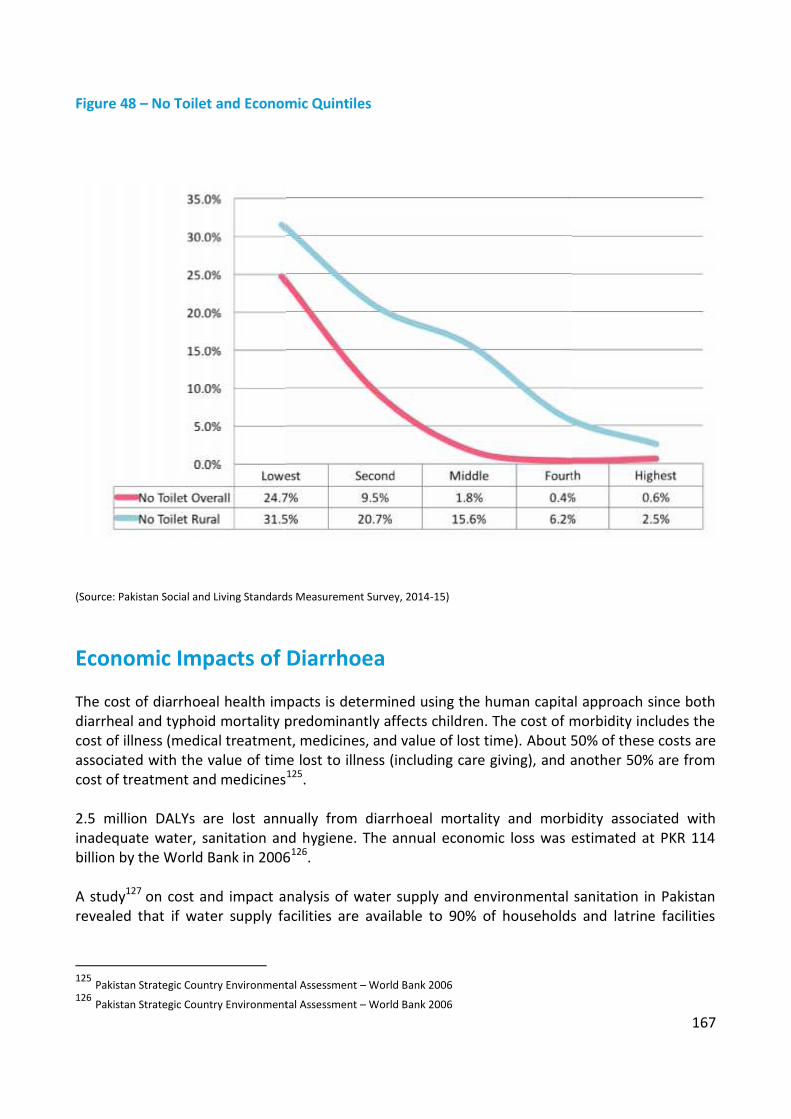
167
Figure 48 – No Toilet and Economic Quintiles
(Source: Pakistan Social and Living Standards Measurement Survey, 2014-15)
Economic Impacts of Diarrhoea
The cost of diarrhoeal health impacts is determined using the human capital approach since bothdiarrheal and typhoid mortality predominantly affects children. The cost of morbidity includes thecost of illness (medical treatment, medicines, and value of lost time). About 50% of these costs areassociated with the value of time lost to illness (including care giving), and another 50% are fromcost of treatment and medicines125.
2.5 million DALYs are lost annually from diarrhoeal mortality and morbidity associated withinadequate water, sanitation and hygiene. The annual economic loss was estimated at PKR 114billion by the World Bank in 2006126.
A study127 on cost and impact analysis of water supply and environmental sanitation in Pakistanrevealed that if water supply facilities are available to 90% of households and latrine facilities
125 Pakistan Strategic Country Environmental Assessment – World Bank 2006126 Pakistan Strategic Country Environmental Assessment – World Bank 2006

168
available to at least 60% of households in villages, the Benefit to Costs ratio is 2.7 at 6% discountrate and 1.75 at 12% discount rate.
Recent data from the Economics of Sanitation Initiative supported by WSP suggests that theeconomic impact of poor sanitation and water in Pakistan may be as high as 3.94% of GDP128.
A report from the World Bank on water and sanitation to reduce child mortality129 found that 25deaths or more per 1000 children born could be prevented by investing in water and sanitationinfrastructure. This difference accounts for about 40% of the gap between current child mortalityrates and the 2015 target set in the Millennium Development Goals. For Pakistan, the cost per LifeYear Saved relative to GDP per capita (in 2007) is about 20%, which is highly cost-effective.
The report also found that the average cost per life-year saved ranges between 65% and 80% ofdeveloping countries’ annual gross domestic product per capita. The results suggest thatinvestment in water and sanitation is a highly cost-effective policy option, even when only themortality benefits are taken into consideration. Taking into account the additional expectedbenefits, such as reduced morbidity, time spending, and environmental hazards, would furtherincrease the benefit-cost ratio.
The WHO estimates that the return on US$1 investment is in the range US$5 to US$36, with aglobal average of US$8130. Using meta-analysis, a reduction in diarrhoea frequency include:
Improved hygiene - 37% reduction Improved sanitation - 32% reduction Improved water supply - 25% reduction Improved water quality - 31% reduction Multiple - 33% reduction
Economic benefits that arise from water and sanitation improvements include:
Direct economic benefits of avoiding diarrhoeal disease - less expenditure on treatment ofdiarrheal disease and related health seeking costs
Indirect economic benefits related to health improvement - value of avoided days lost at workor school, impact on school attendance of girls, avoided time lost of caretaker of sick children,and economic contribution of a saved life due to diarrheal disease
Non-health benefits related to water and sanitation improvement - time savings related towater collection or accessing sanitary facilities; benefits to agriculture and industry ofimproved water supply; more efficient management of water resources
A per capita annual economic benefit of at least US$15 is achieved, if universal coverage forcombined water and sanitation interventions is done.
127 Cost and impact analysis of water supply and environmental sanitation in Pakistan. Pakistan Institute of DevelopmentEconomics, 2002128 Pakistan Briefing: Economic impact of water and sanitation. Sanitation and Water for All, 2012129 Water and sanitation to reduce child mortality, World Bank 2011130 Economic and health effects of increasing coverage of low cost household drinking water supply and sanitation interventions tocountries off-track to meet MDG target 10. World Health Organisation, 2007

169
Hygiene
Data from the Sindh MICS 2014 found the following:
43.7% of children age 0-2 years had their last stools disposed of safely 66.5% of households had a specific place for hand washing where water and soap or other
cleansing agent were present 82% of households had soap or other cleansing agent available
Personal hygiene and household sanitationA baseline cross-sectional household survey was conducted of eight key family practices in Sindhin 5 districts, which were selected using criteria for representing different socio-cultural andgeographical strata in the province of Sindh131. These included: Malir, Hyderabad, Tando Allah Yar,Naushahro Feroze and Jacobabad, which represented 58% rural and 42% urban areas.
The survey found that about 94% mothers reported that water was always available. The mainsource of water for 62% of the population was a hand pump, particularly in rural areas. Similarly,the majority of the study population in rural areas did not have modern flush system for safedisposal of faeces. Around 52% mothers reported rinsing off neonatal faeces while 20% threw itaway. Most of the responding mothers mentioned that they used soap for hand washing afterusing the toilet (81%) and after attending a child who had defecated (76%). Data collectorsobserved that houses they visited were generally clean. 72%, had water containers covered (88%),soap was present in bathroom/toilet and a dust bin was present in the house (42%). Only 25%mothers reported to use dustbin for collecting garbage while rest would throw it in the street.
Furthermore, assessment of hygiene and sanitation practices revealed that despite wide spreadavailability of water and toilet facilities, caregivers still throw faeces of neonates outside home.Majority of study respondents reported to throw household garbage in the street/yard. The studyfound wide variability in the availability of toilet facilities between study districts, and urban andrural areas indicating inequity and geographical disparity. Practice of hand washing with soap afterusing a toilet or attending a child for defecation has been reported as adequate while only fewreported washing hands with soap before and after eating and cooking, which might haveincreased the risk of transmitting infection to the newborn.
131 Baseline survey of eight key family practices in Sindh, June 2010 –June 2011. A project funded by The Maternal and NewbornHealth Programme-Research and Advocacy Fund (RAF). Implemented by Provincial Health Development Centre Sindh, Jamshoroand Department of Health, Government of Sindh

170
Nutrition and Diarrhoea
Recent data from Sindh MICS 2014 (Table 13) shows that more than four out of ten children underthe age of five years in Sindh are underweight (42%) and 17% are classified as severelyunderweight. Almost half of children under five years (48%) are stunted or short for their age andone fourth (24%) children are severely stunted. The results also show that 15% of the children arewasted or thin for their height and only 1% of children are overweight or too heavy for theirheight.
Table 13 - Nutritional status of children under five years in Sindh
Description Indicator Value in %Underweight Prevalence
Percentage of children under age 5 who fall below(a) minus two standard deviations (moderate andsevere)(b) minus three standard deviations (severe)of the median weight for age of the WHO standard
(a) Moderate and severe 42.0
(b) Severe 17.0
Stunting PrevalencePercentage of children under age 5 who fall below(a) minus two standard deviations (moderate andsevere)(b) minus three standard deviations (severe)of the median height for age of the WHO standard
(a) Moderate and severe 48.0
(b) Severe 24.4
Wasting PrevalencePercentage of children under age 5 who fall below(a) minus two standard deviations (moderate andsevere)(b) minus three standard deviations (severe)of the median weight for height of the WHOstandard
(a) Moderate and severe 15.4
(b) Severe 3.6
(Source: Sindh MICS 2014)
Evidence from studies around the world have demonstrated unequivocally the link betweeninadequate sanitation, diarrhoea and nutritional deficiency. The key findings include:
Improvements in sanitation were associated with increases in height ranging from 0.8 cm to1.9 cm132
Odds of stunting at 24 months of age increase by a factor of 1.05 with each episode ofdiarrhoea133
Hand washing reduced the risk of diarrhoea by 30%134
132 Steven Esrey. Water, waste and well being. Am J Epidemiol Vol 143 No 6:608-623, 1996133 William Checkley et al. Multi-country analysis of the effects of diarrhoea on childhood stunting. Int J Epidemiol. Aug 2008;37(4): 816–830134 Zulfiqar Bhutta et al. What works? Interventions for maternal and child undernutrition and survival. Published Online

171
WASH interventions reduced the frequency by diarrhoea by almost a third – hygiene (37%);sanitation (32%); water supply (23%); water quality (31%); and multiple (33%)135
Evidence from Sindh MICS 2014 indicates that nutritional deficiency rates show an increasingtrend when use of improved sanitation decreases further suggesting that low use of improvedsanitation is a risk factor for poor nutrition status (Fig 49).
Figure 49 - Nutritional status and improved sanitation
(Source: Sindh Multiple Indicator Cluster Survey 2014)
Health, Nutrition and Hygiene
Health, nutrition and hygiene modules with special emphasis on water and sanitation would needto be developed for incorporation in training programmes for LG&HTPD and PHE&RDD. Similarmodules would need to be developed for integration into training curricula of Lady HealthWorkers for health promotion in communities. All new drinking water supply schemes would need
January 17, 2008 DOI:10.1016/S0140-6736(07)61693-6135 Prüss-Üstün A, Bos R, Gore F, Bartram J. Safer water, better health: costs, benefits and sustainability of interventions to protectand promote health. World Health Organisation, Geneva, 2008

172
to incorporate a mandatory nutrition-sensitive health, nutrition and hygiene component as part ofthe community participation process.
Drinking water supply and sanitation schemes would need to be made nutrition-sensitive andwhere feasible an integrated multi-sectoral approach adopted with health, nutrition andeducation programmes. This may include the adopting an integrated nutrition-sensitive WASH andNutrition approach136, which includes among others:
Handwashing with soap at critical times Safe disposal of infant and animal faeces Safe water treatment and storage Exclusive breastfeeding Complementary feeding Prevent stunting and maternal and child anaemia in the first 1,000 days and improve infant
and young child feeding Referring malnourished children to health care facilities Rehabilitating drinking water supplies Promoting point-of-use water treatment Conducting nutrition (cooking) and food hygiene demonstrations
Communities would need to be encouraged to adopt essential food safety actions that include:
Keep food preparation areas clean, including hands, surfaces, and utensils Separate raw and cooked food Cook food thoroughly Keep foods at safe temperatures Use safe water and raw materials
Essential Nutrition Actions would need to be adopted within integrated nutrition-sensitive WASHprogrammes and include the following:
Promotion of optimal breastfeeding during the first six months Promotion of optimal complementary feeding starting at six months with continued
breastfeeding to 2 years old and beyond Promotion of optimal nutrition for women Promotion of optimal nutritional care of sick and severely malnourished children Promotion of adequate intake of iron and folic acid and prevention and control of anaemia for
women and children Promotion of adequate intake of iodine by all members of the household Prevention of vitamin A deficiency in women and children
136 WASH & Nutrition. Water and Development Strategy. Implementation Brief January 2015. USAID
173
Public awareness campaigns on water and health and nutrition issues would need to be promotedwith the help of non-governmental agencies, educational institutions and mass media.Standardised messages and effective materials would need to be developed for use within health,nutrition and WASH programmes.

174
Recent Initiatives for Health in Sindh
District Health Information System
The District Health Information System (DHIS) is an improvement to the earlier HealthManagement Information System and now collects and reports health data from all districts. InSindh, by 2012 DHIS had been implemented in 21 districts137. By 2012, the overall reportingcompliance in Sindh was 79%. District data for 2012 shows that the commonest single cause foradmission to secondary hospitals in Sindh was diarrhoea/dysentery accounting for 27.5% of alladmissions to secondary hospitals. DHIS 2015 data for Sindh138 shows that the top five diseasesinclude acute respiratory infections, diarrhoea/dysentery, fever due to other causes, suspectedmalaria and scabies. Diarrhoea/dysentery alone accounts for about 8.1%, which is the singlelargest category after acute respiratory infections (Fig 50).
Figure 50 - Top five diseases seen as outpatients in Sindh in 2015
(Source: District Health Information System, Annual Report 2015. PPHI, Sindh)
137 National Integrated Feedback Report 2013. District Health Information System. NHIRC, Departments of Health and WHO138 http://203.170.79.131/DHISReport/dhis_sindhwise.php accessed on 29 April 2016

175
Multi-Sector Nutrition Support Programme
In order to address the issue nutritional deficiency, the Government of Sindh has planned anutrition specific intervention called the Nutrition Support Programme (NSP). The overall goal ofthe project139, costing Rs. 4.118 billion is to improve the nutritional status of male and femalechildren under five years and that of pregnant and lactating women in nine selected districts(Jacobabad, Kashmore-Kandhkot, Larkana, Qambar-Shahdadkot, Badin, Tando Muhammad Khan,Sanghar, Umerkot and Tharparkar). The project will be implemented with the support of thePeople’s Primary Healthcare Initiative (PPHI) Sindh through the use of their staff and primaryhealth care facilities. The key role in implementing the project will belong to the Lady HealthWorkers (LHWs) and Community Midwives (CMWs) who will mainly focus on communityawareness, screening and referrals.
The Sindh Department of Health/World Bank-funded PC-1 is approved for 9 of Sindh’s 23 districtsfor nutrition programming and will be integrated within the primary health care activities. Non-governmental organisation (NGO) partners will implement activities in non-LHW covered areas.The World Bank is also implementing a WASH project coordinated with the Sindh Nutrition Cell inaddition to its support to the public sector’s Integrated Management of Childhood Illnesses(IMNCI), Mother Newborn and Child Health (MNCH) Programme, and Expanded Programme ofImmunisation (EPI) in Thatta-Sujawal districts.
Currently, USAID’s flagship Maternal and Child Health Programme focuses on 15 districts of Sindhwith an aim to improving reproductive, maternal, newborn, and child health through enhancedservice delivery at 1,500 fully functional, standardised 24/7 MNCH Centres. Merlin is implementinga European Union-funded Women’s and Infant Nutrition Program (EU WINS) (2013 -2016) projectin Thatta, with Action against Hunger (ACF) working in Dadu, and Save the Children working inShikarpur districts. The Pakistan Emergency Food Security Alliance (PEFSA) is a consortium ofNGOs, funded by the European Community Humanitarian aid Office (ECHO), which isimplementing a WASH/Nutrition programme and, UNICEF plans to layer additional elements ofWASH or infant and young child feeding activities in order to have a full slate of stunting reductionactivities. This type of layering could allow for consolidation of funding from a variety of sources toachieve a common impact. Currently, the Sindh Nutrition Cell, Micronutrient Initiative, UNICEF,and WFP are collaborating on fortification initiatives, such as universal salt iodization and wheatflour fortification.
A multi-sector project has been launched (the partners include UNICEF Nutrition, UNICEF WASHand The World Bank) whose purpose is to contribute towards a reduction in stunting rates byfocusing on the 1,000 days critical window, through a multi-sectoral approach in targeted districtsof Sindh. The project aims to support the scale up of evidence-based nutrition-specificinterventions and nutrition-sensitive interventions, with emphasis on greater equity for greaterimpact. UNICEF has initiated its first phase of the project in collaboration with Plan International inTaluka Moro (District Nausharo Feroze), Taluka Mirpur Mathelo (District Ghotki), and TalukaKotdiji (District Khairpur).
139 Annual Plan 2015-16. Ministry of Planning, Development and Reform, Government of Pakistan

176
Nutrition-specific interventions will aim to improve outcomes in the following focus areas:
a. Infant and young child feeding and care (IYCF) in the first two years of lifeb. Micronutrient nutrition and anaemia control in young childrenc. Early detection and treatment of severe wasting in young childrend. Women’s nutrition with a focus on pre pregnant, pregnant and lactating motherse. Cross-cutting communication elements – which will include harmonised training for NGO
implementing partners and LHWs consisting of health, WASH and nutrition elements to bedeveloped and implemented during the first year of the programme
Nutrition-sensitive interventions will aim to improve outcomes in Water, Sanitation and Hygiene(WASH). With WASH, the main focus will be on reducing the incidence and severity of infection inchildren while controlling environmental enteropathy and its potential negative impact onchildren’s linear growth. This will encompass efforts to maintain an adequate water supply, bothin terms of quality and quantity, sufficient means of sanitation (encouraging community-basedapproaches for ‘total sanitation’ that seek to eliminate the practice of open defecation), capacitydevelopment of service providers and improved hygienic practices (hand washing with soap).
Sindh Accelerated Action Plan for Reduction of Stunting and Malnutrition –Sehatmand Sindh
In view of the urgency to address malnutrition as a top priority in Sindh, an Accelerated ActionPlan (AAP) namely Sehatmand Sindh” has been prepared for the reduction of stunting andmalnourishment by 2021 with a ten years aim to reduce stunting from 48% to 30% in first fiveyears (by 2021) and 15% by 2026 in Sindh by increasing and expanding coverage of multi-sectoralinterventions, that are known to reduce stunting in first five years of children’s lives.
A number of interventions are proposed under various sectors, some of which will have direct andimmediate impact on prevention of stunting - health, sanitation, hygiene, social protection andSocial & Behavioral Change Communication (SBCC) - while a couple of sectors like agriculture andeducation that will manifest their impact on stunting rates in longer term period interventions.The strategic focus of all interventions will be on all such segments of the population that arenutritionally vulnerable and on whom stunting prevention strategies could be most responsive.These include: the first 1,000 days of child’s life, children of 24-59 months and the women ofreproductive age with particular attention to adolescent girls.
The key areas proposed here include: Expanding Coverage of nutrition specific services throughstrengthening facility based care, revitalising the LHW programme, leveraging NGOs and varioushealth department programmes; dovetailing nutrition services with the Costed ImplementationPlan for family planning; agriculture for nutrition, improved sanitation and hygiene with focus onmaking districts open defecation free and hand washing practices; social protection support topoorest pregnant women for seeking health care and improving nutrition related behavior; andengaging education sector for improving nutrition knowledge, skills and behaviors among childrenand adolescent girls. All these areas will be supported by intensive SBCC, engaging civil society

177
organizations and enhanced monitoring and supervision mechanisms including a third partyevaluation at mid-term and end of five years.
Nutrition sensitive Conditional Cash Transfers for the poor in Sindh
Social protection through Conditional Cash Transfers (CCT) is one of the important interventionsfor prevention of stunting. CCT is one of the mechanisms included in the Sehatmand Sindhprogramme. The Government of Sindh shall fund the CCT using the same mechanism and channelas being envisaged for other sectors whereby the development partner will support the proposedplan by matching the commitment of government.
The CCT interventions are proposed to be implemented in a phased manner. To begin with a pilotshall be undertaken in two districts (Tharparkar and Umerkot) where most of the NSP (NutritionSupport Programme) interventions are already being rolled out including community basednutrition service contracts with NGOs to those villages that are not covered through LHWs. Theone-year pilot shall help in streamlining the process, develop registration and disbursementmechanisms and test the feasibility of attaching the nutrition services conditionality to cashtransfers. The marketing and education material prepared for the pilot could also be tested for itseffectiveness and acceptability. Once the pilot is evaluated, the lessons would be applied and theCCT intervention then rolled out to Phase 1 districts.
Sindh Health Sector Strategy 2012-2020
The Health Sector Strategy has a special focus area on Nutrition and stresses on need formainstreaming of key evidence based nutrition interventions through health sector andcoordination with other department on nutrition as part of a larger provincial inter-sectoralstrategy on nutrition inclusive of micro-nutrient supplementation, community based awarenessand counselling, and inter-sectoral measures such as birth spacing, water and sanitation and foodsecurity programmes.
Under Strategy 1.6a: Intersectoral district based pilots on nutrition and social developmentthrough collaboration with BISP, water and sanitation, education and other sectors:
Strategic Action 1.6.1a Inter-sectoral pilots on nutrition - Inter-sectoral pilots on nutrition Pilotsin catchment area of FLCF
o Links for inter-sectoral action on under-nutrition with other departments such as waterand sanitation, food, education, PDMA etc. Poverty reduction projects in conjunctionwith BISP, Bait-ul-Mal and NGOs
Under Strategy 3.2: Mainstreaming of evidence based action for under-nutrition in healthpackages and establishing linkages with other sectors for integrated pilots:
Strategic Action - 3.2.3 Inter-sectoral action - Inter-sectoral pilots at district level for multi -pronged enhancement of nutrition with related departments such as food, water andsanitation, education, BISP etc
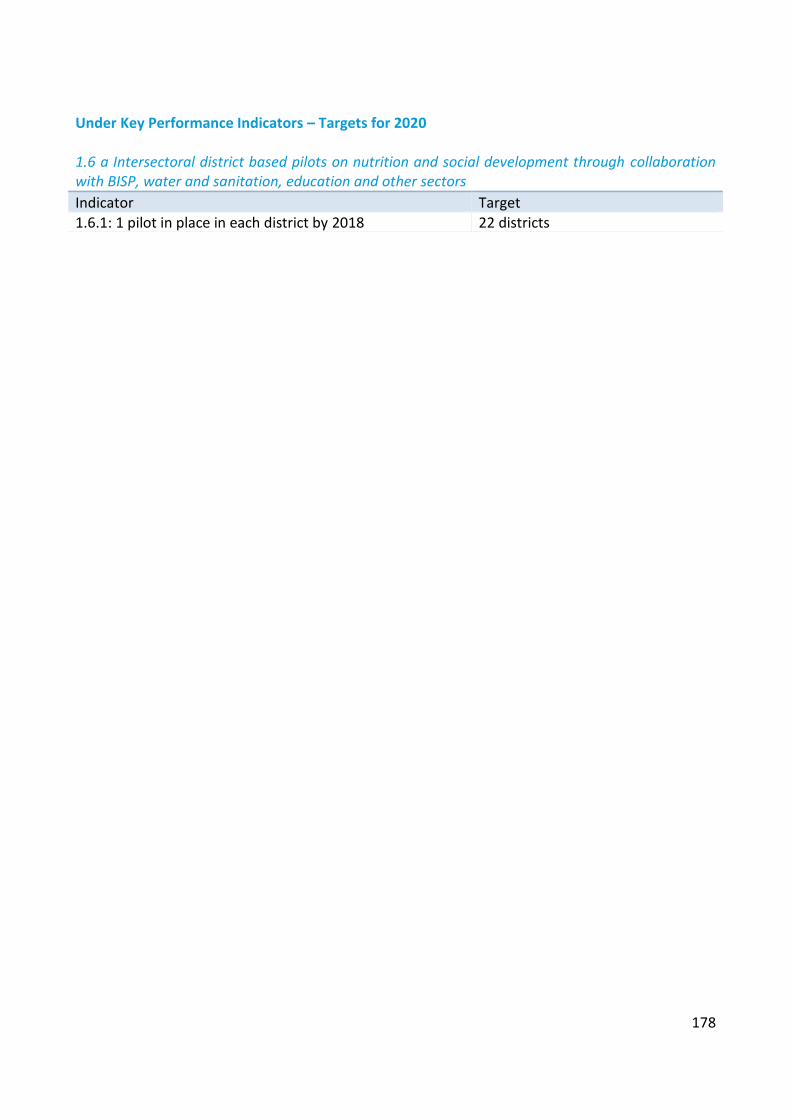
178
Under Key Performance Indicators – Targets for 2020
1.6 a Intersectoral district based pilots on nutrition and social development through collaborationwith BISP, water and sanitation, education and other sectorsIndicator Target1.6.1: 1 pilot in place in each district by 2018 22 districts
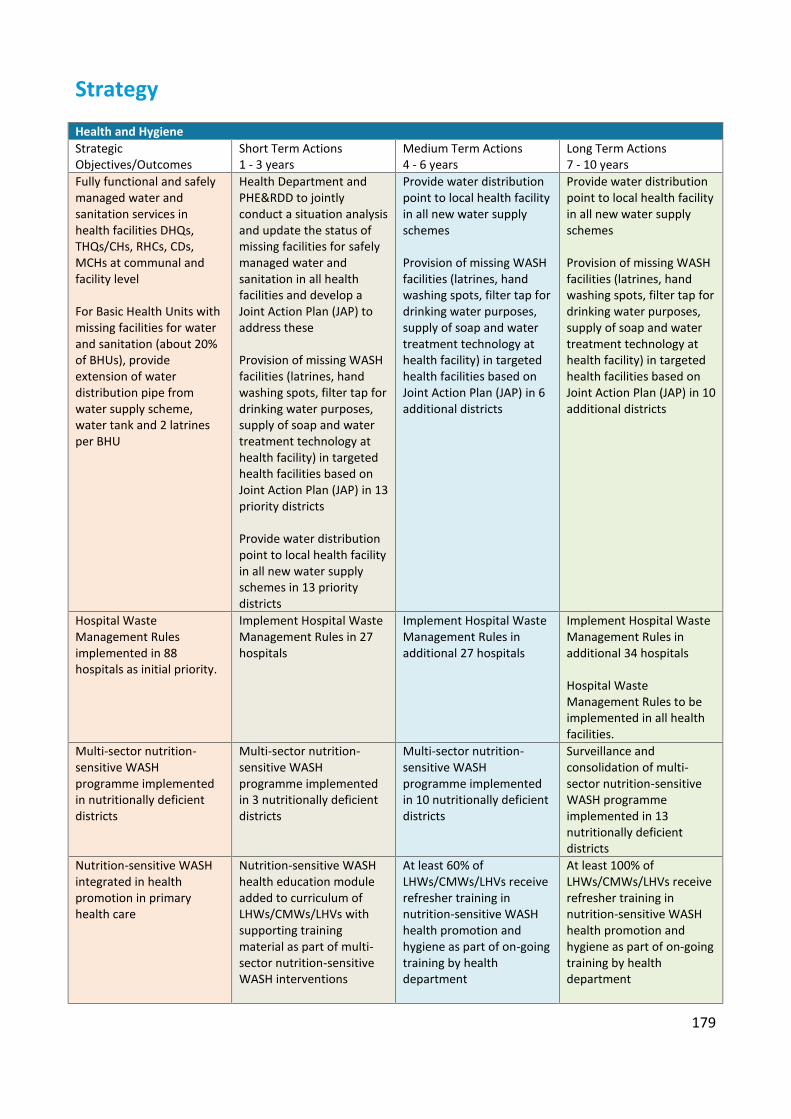
179
Strategy
Health and HygieneStrategicObjectives/Outcomes
Short Term Actions1 - 3 years
Medium Term Actions4 - 6 years
Long Term Actions7 - 10 years
Fully functional and safelymanaged water andsanitation services inhealth facilities DHQs,THQs/CHs, RHCs, CDs,MCHs at communal andfacility level
For Basic Health Units withmissing facilities for waterand sanitation (about 20%of BHUs), provideextension of waterdistribution pipe fromwater supply scheme,water tank and 2 latrinesper BHU
Health Department andPHE&RDD to jointlyconduct a situation analysisand update the status ofmissing facilities for safelymanaged water andsanitation in all healthfacilities and develop aJoint Action Plan (JAP) toaddress these
Provision of missing WASHfacilities (latrines, handwashing spots, filter tap fordrinking water purposes,supply of soap and watertreatment technology athealth facility) in targetedhealth facilities based onJoint Action Plan (JAP) in 13priority districts
Provide water distributionpoint to local health facilityin all new water supplyschemes in 13 prioritydistricts
Provide water distributionpoint to local health facilityin all new water supplyschemes
Provision of missing WASHfacilities (latrines, handwashing spots, filter tap fordrinking water purposes,supply of soap and watertreatment technology athealth facility) in targetedhealth facilities based onJoint Action Plan (JAP) in 6additional districts
Provide water distributionpoint to local health facilityin all new water supplyschemes
Provision of missing WASHfacilities (latrines, handwashing spots, filter tap fordrinking water purposes,supply of soap and watertreatment technology athealth facility) in targetedhealth facilities based onJoint Action Plan (JAP) in 10additional districts
Hospital WasteManagement Rulesimplemented in 88hospitals as initial priority.
Implement Hospital WasteManagement Rules in 27hospitals
Implement Hospital WasteManagement Rules inadditional 27 hospitals
Implement Hospital WasteManagement Rules inadditional 34 hospitals
Hospital WasteManagement Rules to beimplemented in all healthfacilities.
Multi-sector nutrition-sensitive WASHprogramme implementedin nutritionally deficientdistricts
Multi-sector nutrition-sensitive WASHprogramme implementedin 3 nutritionally deficientdistricts
Multi-sector nutrition-sensitive WASHprogramme implementedin 10 nutritionally deficientdistricts
Surveillance andconsolidation of multi-sector nutrition-sensitiveWASH programmeimplemented in 13nutritionally deficientdistricts
Nutrition-sensitive WASHintegrated in healthpromotion in primaryhealth care
Nutrition-sensitive WASHhealth education moduleadded to curriculum ofLHWs/CMWs/LHVs withsupporting trainingmaterial as part of multi-sector nutrition-sensitiveWASH interventions
At least 60% ofLHWs/CMWs/LHVs receiverefresher training innutrition-sensitive WASHhealth promotion andhygiene as part of on-goingtraining by healthdepartment
At least 100% ofLHWs/CMWs/LHVs receiverefresher training innutrition-sensitive WASHhealth promotion andhygiene as part of on-goingtraining by healthdepartment
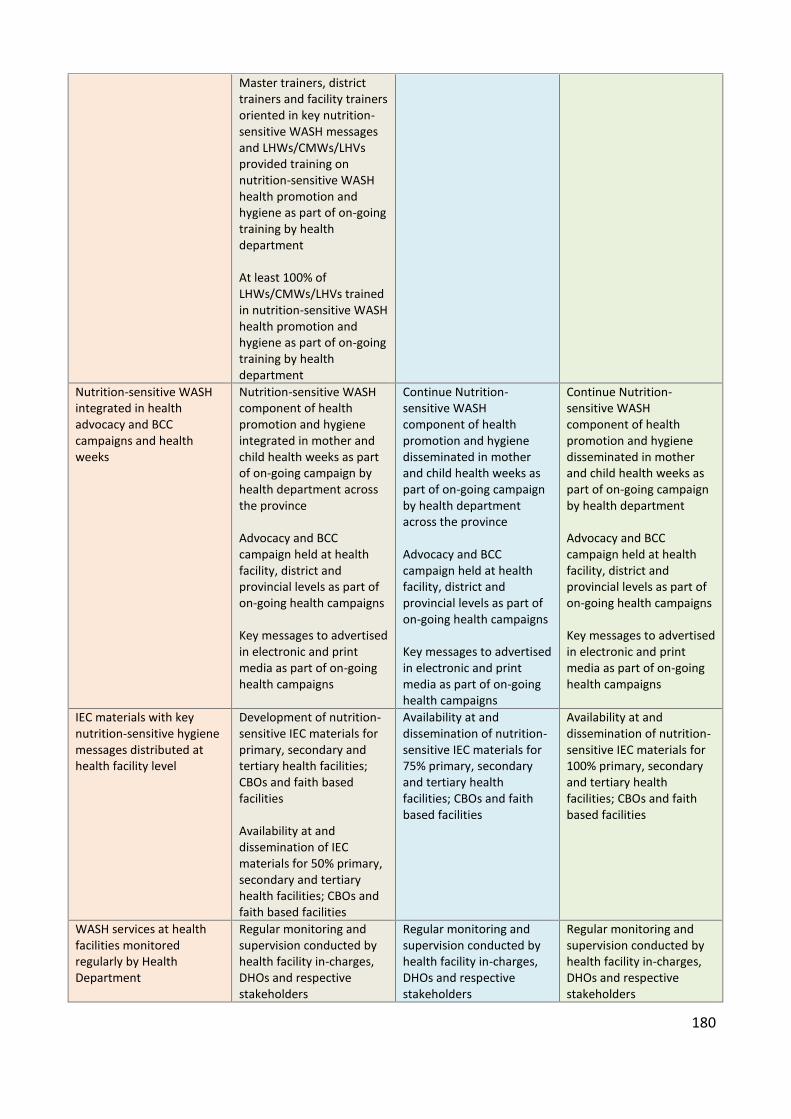
180
Master trainers, districttrainers and facility trainersoriented in key nutrition-sensitive WASH messagesand LHWs/CMWs/LHVsprovided training onnutrition-sensitive WASHhealth promotion andhygiene as part of on-goingtraining by healthdepartment
At least 100% ofLHWs/CMWs/LHVs trainedin nutrition-sensitive WASHhealth promotion andhygiene as part of on-goingtraining by healthdepartment
Nutrition-sensitive WASHintegrated in healthadvocacy and BCCcampaigns and healthweeks
Nutrition-sensitive WASHcomponent of healthpromotion and hygieneintegrated in mother andchild health weeks as partof on-going campaign byhealth department acrossthe province
Advocacy and BCCcampaign held at healthfacility, district andprovincial levels as part ofon-going health campaigns
Key messages to advertisedin electronic and printmedia as part of on-goinghealth campaigns
Continue Nutrition-sensitive WASHcomponent of healthpromotion and hygienedisseminated in motherand child health weeks aspart of on-going campaignby health departmentacross the province
Advocacy and BCCcampaign held at healthfacility, district andprovincial levels as part ofon-going health campaigns
Key messages to advertisedin electronic and printmedia as part of on-goinghealth campaigns
Continue Nutrition-sensitive WASHcomponent of healthpromotion and hygienedisseminated in motherand child health weeks aspart of on-going campaignby health department
Advocacy and BCCcampaign held at healthfacility, district andprovincial levels as part ofon-going health campaigns
Key messages to advertisedin electronic and printmedia as part of on-goinghealth campaigns
IEC materials with keynutrition-sensitive hygienemessages distributed athealth facility level
Development of nutrition-sensitive IEC materials forprimary, secondary andtertiary health facilities;CBOs and faith basedfacilities
Availability at anddissemination of IECmaterials for 50% primary,secondary and tertiaryhealth facilities; CBOs andfaith based facilities
Availability at anddissemination of nutrition-sensitive IEC materials for75% primary, secondaryand tertiary healthfacilities; CBOs and faithbased facilities
Availability at anddissemination of nutrition-sensitive IEC materials for100% primary, secondaryand tertiary healthfacilities; CBOs and faithbased facilities
WASH services at healthfacilities monitoredregularly by HealthDepartment
Regular monitoring andsupervision conducted byhealth facility in-charges,DHOs and respectivestakeholders
Regular monitoring andsupervision conducted byhealth facility in-charges,DHOs and respectivestakeholders
Regular monitoring andsupervision conducted byhealth facility in-charges,DHOs and respectivestakeholders

181
EDUCATION
National Sanitation Policy 2006
The National Sanitation Policy 2006 of Pakistan recommends a sanitation training/awarenessraising programme at all educational and teachers training institutes. The National EducationPolicy 2009 lays emphasis on a school health programme along with health education.
With the support of United Nations Programme for Pakistan, the school health initiative has beenpiloted in selected districts of four provinces, and school health education materials have beendeveloped. The materials include the importance of hand washing and clean drinking water.However, these training materials have not been institutionalised in pre-service and in-serviceteachers training curriculum as envisaged in both national policies.
Sindh Education Sector Plan 2014 - 2018
The Sindh Education Sector Plan140 (SESP) 2014-18 developed by the Education and LiteracyDepartment, Government of Sindh has the following components:
1) Increasing Equitable Access to Early Childhood Education, Primary, Middle/Elementary andSecondary education
2) Improving the Curriculum and Learning Outcomes3) Improving Teacher Quality4) Strengthening Governance and Service Delivery5) Improving Resource Allocation6) Adult Literacy and Non-formal Basic Education7) Cross-cutting areas (ICT, Education in Emergencies, Gender Equity, Social Cohesion and Public-
Private Partnerships for Education)
In 2011-12, Sindh Education Management Information System (SEMIS) found that 45% of schoolshad no toilet facilities and 53% had no drinking water facility; both presenting particular barriersfor girls.
The SESP identified lack of basic facilities (e.g. proper classrooms, washrooms, drinking water,security, etc.), especially in rural areas as one of the top seven key issues in the provision ofprimary and elementary education.
SEMIS 2011-12 identified the following missing facilities with respect to toilets and drinking water.
140 Sindh Education Sector Plan 2014-2018. Education and Literacy Department, Government of Sindh.

182
Missing Facilities (identified by SEMIS in 2011-12) Out of 43,089 primary and 2,554 elementary schools, 17,299 primary and 586 elementary
schools are without toilet; and 20,346 primary and 945 elementary schools are withoutdrinking water
There are 175 secondary and higher secondary schools without toilet; and 294 withoutdrinking water
The SESP has the following objectives, strategies and targets with respect to toilets and drinkingwater.
Objective Strategy Targets/OutcomesIncrease Access at PrimaryLevel
Provision of basic facilitiesin schools
Basic facilities will beprovided on a prioritybasis, i.e. toilets will begiven preference overboundary walls
6,920 schools with toiletfacilities (40%)
20,346 with drinking water(100%)
Ensure balanced andstandardised infrastructurefacilities in the province andbuild capacity at all levelsthrough dissemination ofstandards
Develop infrastructurestandards
Well-defined budgetallocations for schoolfacilities
Capacity building for theapproved standards
Activities Prepare proposal for well-
defined budget allocationsand secure approval (55-75% for classroomdevelopment; 25-45% forother facilities such asboundary walls and schoolgate, drinking and domesticwater facilities, separatetoilets for girls and boys,provision of alternatesources of electricity whererequired)
Design parameters Toilet facilities
o 25:1 for girlso 40:1 for boys
Water facilitieso For domestic use: 45-100 litres per heado Separate drinking water system 4-6 litres per head

183
Sindh Teacher Education
Sindh Teacher Education Development Authority
The Sindh Teacher Education Development Authority (STEDA) has been established to oversee andregulate the teacher training activities and to maintain the standards of the trainings and thetraining providers. The Education Department, through STEDA, has introduced higher professionalqualification for teachers (4 year B.Ed. Honours)
Provincial Institute of Teacher Education
The Provincial Institute of Teacher Education (PITE) is the main structure141 that assists theEducation and Literacy Department and STEDA in formulation of policy and teacher development.Its main functions include:
Undertake qualitative and quantitative research in Teacher Education Design and experiment research based innovative approaches and programmes in teacher
education Develop leadership qualities in management of Teacher Education Institutes (TEIs) through
professional development courses Assist STEDA in quality assurance in Teacher Education Programmes Develop strong coordination and linkage with the partners at district, provincial, national and
international level for the development of the teacher education
Since its establishment, some of the major achievements of PITE Sindh include:
Training of 30000 teachers across Sindh province Training of 2000 Education Officers Development of several Modules and manuals of the Training Participation in the process of National Curriculum 2006 Participation in the National Education Policy 2009 Collaborated with national and international development partners in the implementation of
variety of interventions in Sindh province Supported Reforms Support Unit (RSU) in the implementation of Teacher Education
Development Policy 2009: Pilot of Continuing Professional Development framework in Sindhprovince in year 2010 and 2011
Supported RSU in the implementation of Education Management Reforms Policy 2009: Pilot ofSindh Education Sector Management Course in year 2011 and 2012
PITE Sindh has six major components. These include:
Initial Teacher Education (ITE) Continuing Professional Development (CPD) Educational Leadership Development Centre (ELDC) Human Resource Development Centre (HRDC)
141 Education and Literacy Department, Government of Sindh
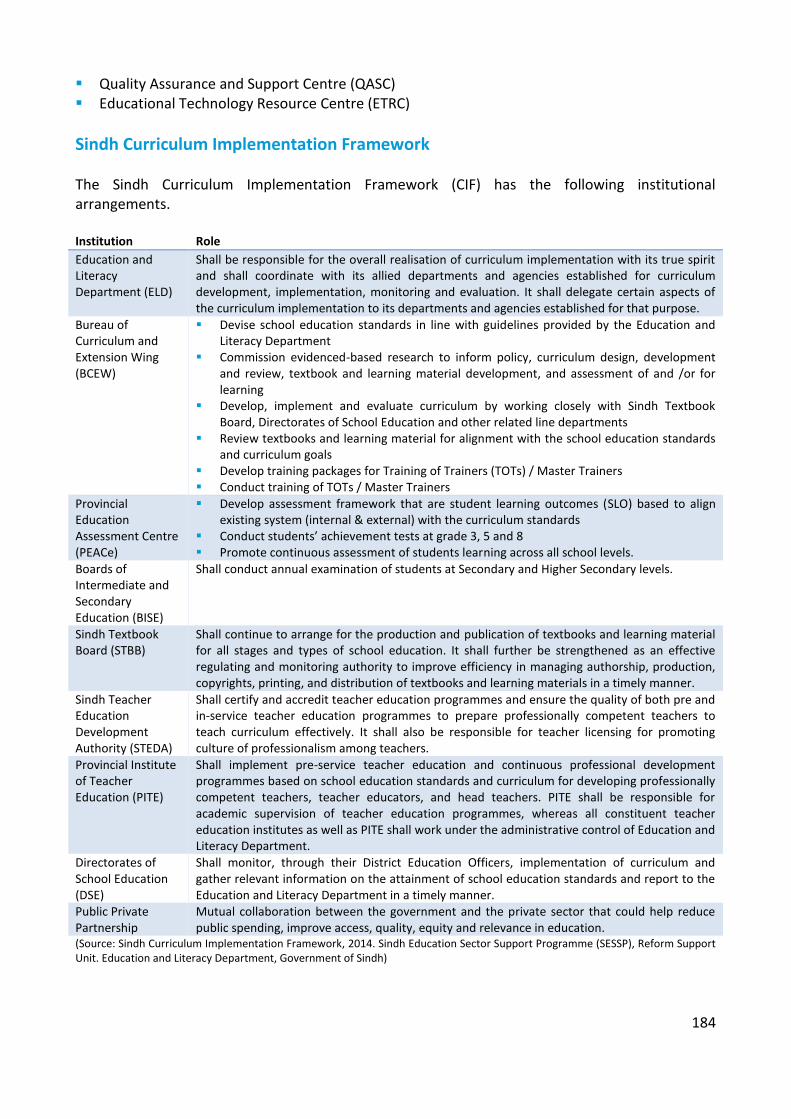
184
Quality Assurance and Support Centre (QASC) Educational Technology Resource Centre (ETRC)
Sindh Curriculum Implementation Framework
The Sindh Curriculum Implementation Framework (CIF) has the following institutionalarrangements.
Institution RoleEducation andLiteracyDepartment (ELD)
Shall be responsible for the overall realisation of curriculum implementation with its true spiritand shall coordinate with its allied departments and agencies established for curriculumdevelopment, implementation, monitoring and evaluation. It shall delegate certain aspects ofthe curriculum implementation to its departments and agencies established for that purpose.
Bureau ofCurriculum andExtension Wing(BCEW)
Devise school education standards in line with guidelines provided by the Education andLiteracy Department
Commission evidenced-based research to inform policy, curriculum design, developmentand review, textbook and learning material development, and assessment of and /or forlearning
Develop, implement and evaluate curriculum by working closely with Sindh TextbookBoard, Directorates of School Education and other related line departments
Review textbooks and learning material for alignment with the school education standardsand curriculum goals
Develop training packages for Training of Trainers (TOTs) / Master Trainers Conduct training of TOTs / Master Trainers
ProvincialEducationAssessment Centre(PEACe)
Develop assessment framework that are student learning outcomes (SLO) based to alignexisting system (internal & external) with the curriculum standards
Conduct students’ achievement tests at grade 3, 5 and 8 Promote continuous assessment of students learning across all school levels.
Boards ofIntermediate andSecondaryEducation (BISE)
Shall conduct annual examination of students at Secondary and Higher Secondary levels.
Sindh TextbookBoard (STBB)
Shall continue to arrange for the production and publication of textbooks and learning materialfor all stages and types of school education. It shall further be strengthened as an effectiveregulating and monitoring authority to improve efficiency in managing authorship, production,copyrights, printing, and distribution of textbooks and learning materials in a timely manner.
Sindh TeacherEducationDevelopmentAuthority (STEDA)
Shall certify and accredit teacher education programmes and ensure the quality of both pre andin-service teacher education programmes to prepare professionally competent teachers toteach curriculum effectively. It shall also be responsible for teacher licensing for promotingculture of professionalism among teachers.
Provincial Instituteof TeacherEducation (PITE)
Shall implement pre-service teacher education and continuous professional developmentprogrammes based on school education standards and curriculum for developing professionallycompetent teachers, teacher educators, and head teachers. PITE shall be responsible foracademic supervision of teacher education programmes, whereas all constituent teachereducation institutes as well as PITE shall work under the administrative control of Education andLiteracy Department.
Directorates ofSchool Education(DSE)
Shall monitor, through their District Education Officers, implementation of curriculum andgather relevant information on the attainment of school education standards and report to theEducation and Literacy Department in a timely manner.
Public PrivatePartnership
Mutual collaboration between the government and the private sector that could help reducepublic spending, improve access, quality, equity and relevance in education.
(Source: Sindh Curriculum Implementation Framework, 2014. Sindh Education Sector Support Programme (SESSP), Reform SupportUnit. Education and Literacy Department, Government of Sindh)

185
Missing Facilities
The Sindh Education Management Information System (SEMIS) of Education and LiteracyDepartment142 indicates that there are the following schools in Sindh:
42,900 primary schools – of which 9,532 are boys, 6,264 are girls and 27,104 are mixed 2,429 elementary and middle schools – of which 577 are boys, 695 are girls 1,157 are mixed 2,065 higher secondary and secondary schools – of which 716 are boys, 633 are girls and 716
are mixed
The Annual Status of Education Report143 (ASER) for 2015 presents the scorecard for rural Sindh asfollows:
42,297 children aged 3-16 years in 25 districts surveyed 727 schools in 703 villages surveyed A total of 13,984 households visited The current state of enrolment is:
o Children 3-5 years – 37% enrolled (of which 70% are in government schools and 30% innon-state schools)
o Children 6-16 years – 73% enrolled (of which 82% are in government schools and 18%in non-state schools). Of the 33% who are out of school, 52% are girls and 48% boys
Of all rural government primary schools – only 59% have usable water and 48% have usabletoilets
The recent Pakistan Education Statistics Report 2014-15144 indicates that only 47.0% of primary,60.3% of middle, 86.4% of secondary schools have availability of water (Fig 51). The report furtherindicates (Fig 52) that:
50.7%, 69.6% and 93.7% of boys primary, middle and upper secondary have improvedsanitation facilities
54.0%, 69.3% and 95.7% of girls primary, middle and upper secondary have improvedsanitation facilities
Figures 53 and 54 illustrate the status of availability of drinking water in urban and rural schools,while Figs 55 and 56 illustrate the status of availability of student latrine facilities in urban andrural schools.
142 Pakistan Education Statistics 2014-15. National Education Management Information System, Academy of Educational Planningand Management, Ministry of Federal Education and Professional Training, Government of Pakistan, February 2016143 Annual Status of Education Report. ASER-Pakistan 2014. Sindh (Rural) Scorecard144 Pakistan Education Statistics 2014-15. National Education Management Information System, Academy of Educational Planningand Management, Ministry of Federal Education and Professional Training, Government of Pakistan, February 2016
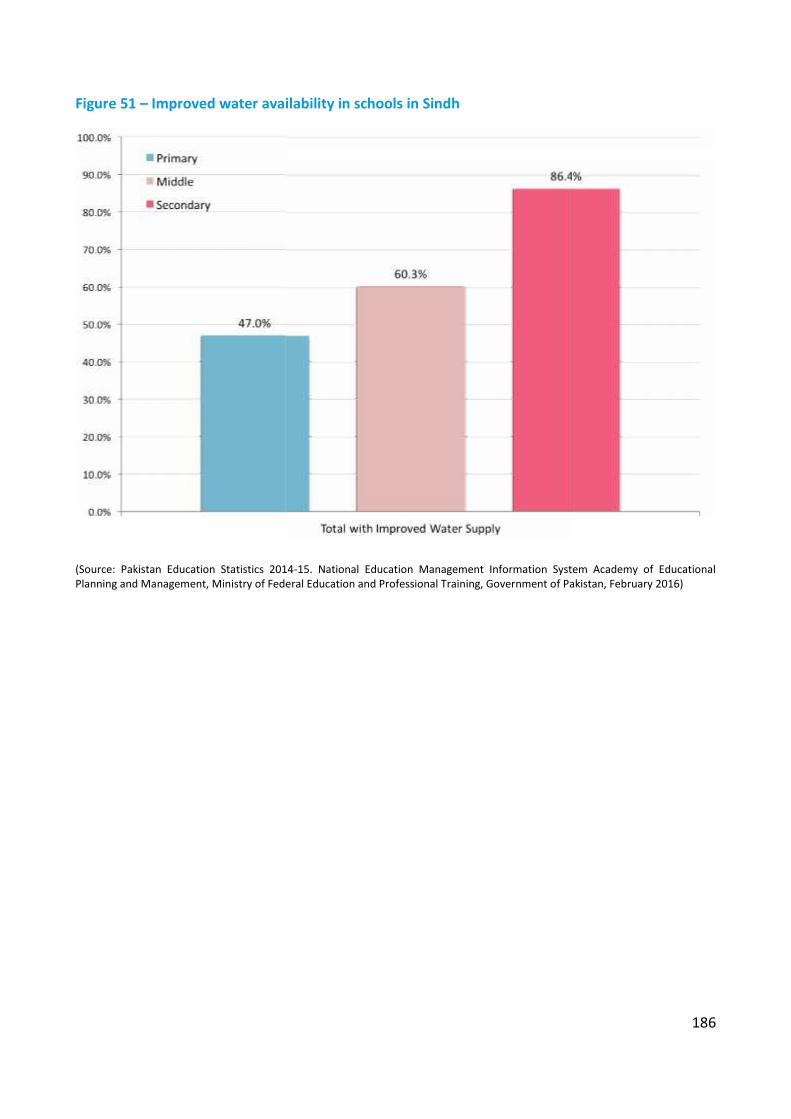
186
Figure 51 – Improved water availability in schools in Sindh
(Source: Pakistan Education Statistics 2014-15. National Education Management Information System Academy of EducationalPlanning and Management, Ministry of Federal Education and Professional Training, Government of Pakistan, February 2016)

187
Figure 52 - Improved sanitation in schools in Sindh
(Source: Pakistan Education Statistics 2014-15. National Education Management Information System Academy of EducationalPlanning and Management, Ministry of Federal Education and Professional Training, Government of Pakistan, February 2016)
187
Figure 52 - Improved sanitation in schools in Sindh
(Source: Pakistan Education Statistics 2014-15. National Education Management Information System Academy of EducationalPlanning and Management, Ministry of Federal Education and Professional Training, Government of Pakistan, February 2016)
187
Figure 52 - Improved sanitation in schools in Sindh
(Source: Pakistan Education Statistics 2014-15. National Education Management Information System Academy of EducationalPlanning and Management, Ministry of Federal Education and Professional Training, Government of Pakistan, February 2016)

188
Figure 53 - Availability of drinking water in urban schools in Sindh
(Source: Pakistan Education Statistics 2014-15. National Education Management Information System Academy of EducationalPlanning and Management, Ministry of Federal Education and Professional Training, Government of Pakistan, February 2016)

189
Figure 54 - Availability of drinking water in rural schools in Sindh
(Source: Pakistan Education Statistics 2014-15. National Education Management Information System Academy of EducationalPlanning and Management, Ministry of Federal Education and Professional Training, Government of Pakistan, February 2016)
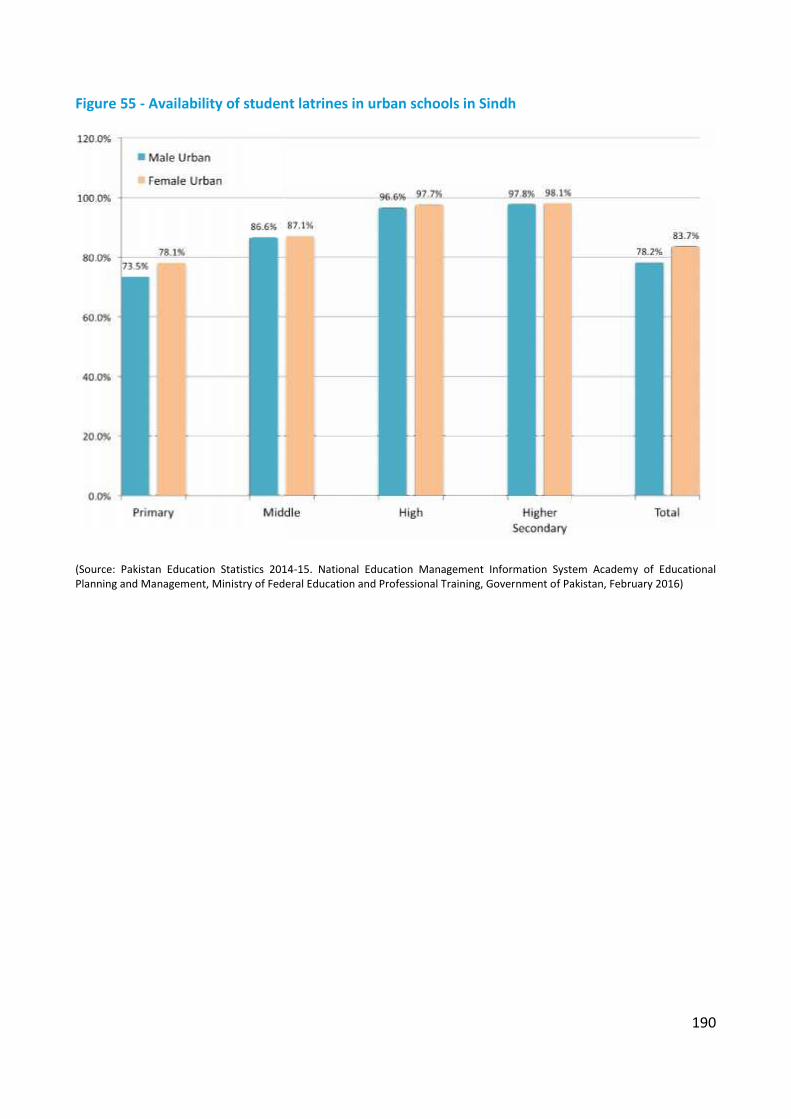
190
Figure 55 - Availability of student latrines in urban schools in Sindh
(Source: Pakistan Education Statistics 2014-15. National Education Management Information System Academy of EducationalPlanning and Management, Ministry of Federal Education and Professional Training, Government of Pakistan, February 2016)

191
Figure 56 - Availability of student latrines in rural schools in Sindh
(Source: Pakistan Education Statistics 2014-15. National Education Management Information System Academy of EducationalPlanning and Management, Ministry of Federal Education and Professional Training, Government of Pakistan, February 2016)
The Pakistan Education Atlas 2015145 was launched recently and is a joint project betweenNational Education Management Information System (NEMIS), Academy of Educational Planningand Management (AEPAM), Ministry of Education, Trainings and Standards in Higher Education,Government of Pakistan and Vulnerability Analysis and Mapping (VAM) Unit, United NationsWorld Food Programme (WFP) Pakistan in collaboration with UNESCO and UNICEF.
The atlas shows that in government primary schools in Sindh, (Fig 57). Kashmore (25%), Sujawal(28%) and Thatta (31%) stand out with very low scores for availability of student latrines, whileMatiari (29%), Sujawal (14%) and Thatta (18%) have very low scores for availability of drinkingwater.
In contrast, in government middle and secondary schools in Sindh, (Fig 58). Jacobabad, Sujawaland Tharparkar score 41% or less for drinking water supply, while Jacobabad and Tharparkar scoreless than 60% for student latrines.
145 Pakistan Education Atlas 2015. National Education Management Information System (NEMIS), Academy of EducationalPlanning and Management (AEPAM), Government of Pakistan and Vulnerability Analysis and Mapping (VAM) Unit, United NationsWorld Food Programme (WFP) Pakistan
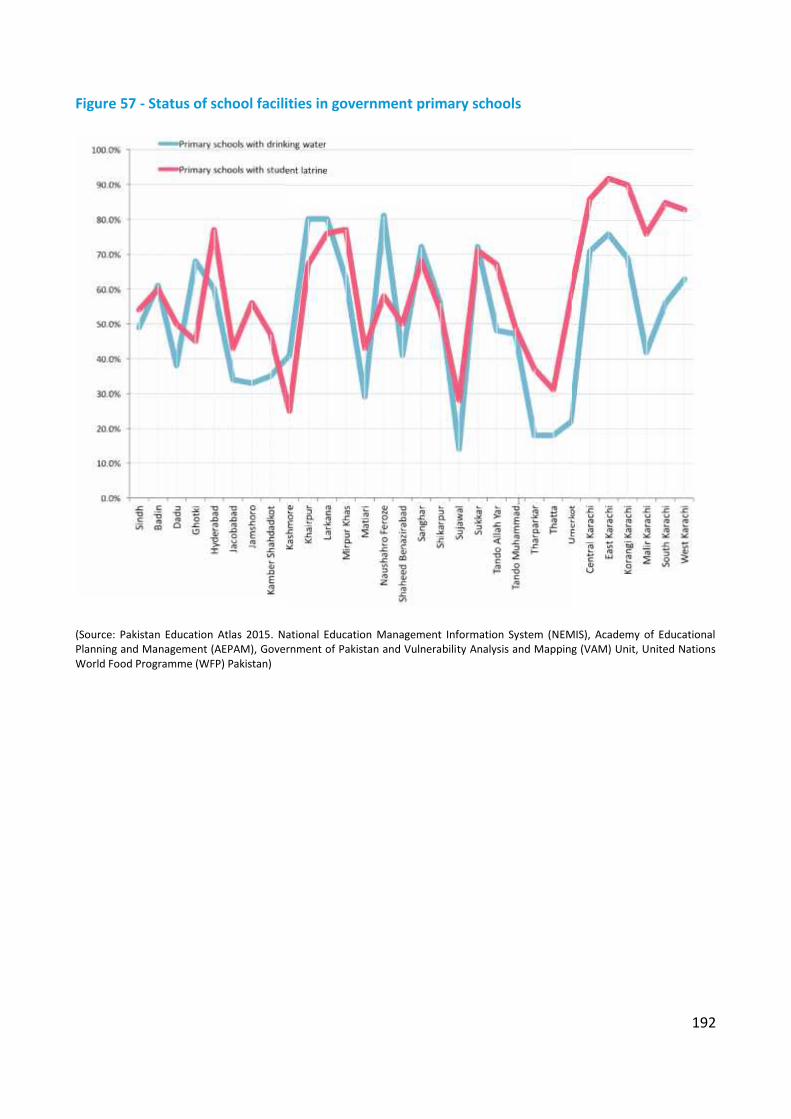
192
Figure 57 - Status of school facilities in government primary schools
(Source: Pakistan Education Atlas 2015. National Education Management Information System (NEMIS), Academy of EducationalPlanning and Management (AEPAM), Government of Pakistan and Vulnerability Analysis and Mapping (VAM) Unit, United NationsWorld Food Programme (WFP) Pakistan)

193
Figure 58 - Status of school facilities in government middle and secondary schools
(Source: Pakistan Education Atlas 2015. National Education Management Information System (NEMIS), Academy of EducationalPlanning and Management (AEPAM), Government of Pakistan and Vulnerability Analysis and Mapping (VAM) Unit, United NationsWorld Food Programme (WFP) Pakistan)
Synopsis of missing facilities for WASH in schoolsCurrently, the situation of water facilities in schools is worrisome and is summarised below146:
Out of 41,724 primary schools, 19,599 have water facilities and 21,438 have latrines Out of 2,316 middle schools, 1,397 have water facilities and 1,612 have latrines Out of 1,706 high schools, 1,455 have water facilities and 1,607 have latrines Out of 283 higher secondary schools, 273 have water facilities and 280 have latrines
This implies that of 46,039 educational institutions, only 22,724 (just under 50%) have waterfacilities and 24,937 (just under 55%) have latrines.
146 Pakistan Education Statistics 2014-15. National Education Management Information System Academy of Educational Planningand Management, Ministry of Federal Education and Professional Training, Government of Pakistan, February 2016

194
Figure 59 - Primary schools with drinking water by tehsil
(Source: Pakistan Education Atlas 2015. National Education Management Information System (NEMIS), Academy of EducationalPlanning and Management (AEPAM), Government of Pakistan and Vulnerability Analysis and Mapping (VAM) Unit, United NationsWorld Food Programme (WFP) Pakistan)
Figure 59 illustrates the status of availability of drinking water in primary schools by tehsil.

195
Figure 60 - Middle and secondary schools with drinking water by tehsil
(Source: Pakistan Education Atlas 2015. National Education Management Information System (NEMIS), Academy of EducationalPlanning and Management (AEPAM), Government of Pakistan and Vulnerability Analysis and Mapping (VAM) Unit, United NationsWorld Food Programme (WFP) Pakistan)
Figure 60 illustrates the status of availability of drinking water in middle and secondary schools bytehsil.

196
Figure 61 - Primary schools with student latrines by tehsil
(Source: Pakistan Education Atlas 2015. National Education Management Information System (NEMIS), Academy of EducationalPlanning and Management (AEPAM), Government of Pakistan and Vulnerability Analysis and Mapping (VAM) Unit, United NationsWorld Food Programme (WFP) Pakistan)
Figure 61 illustrates the status of availability of student latrines in primary schools by tehsil.
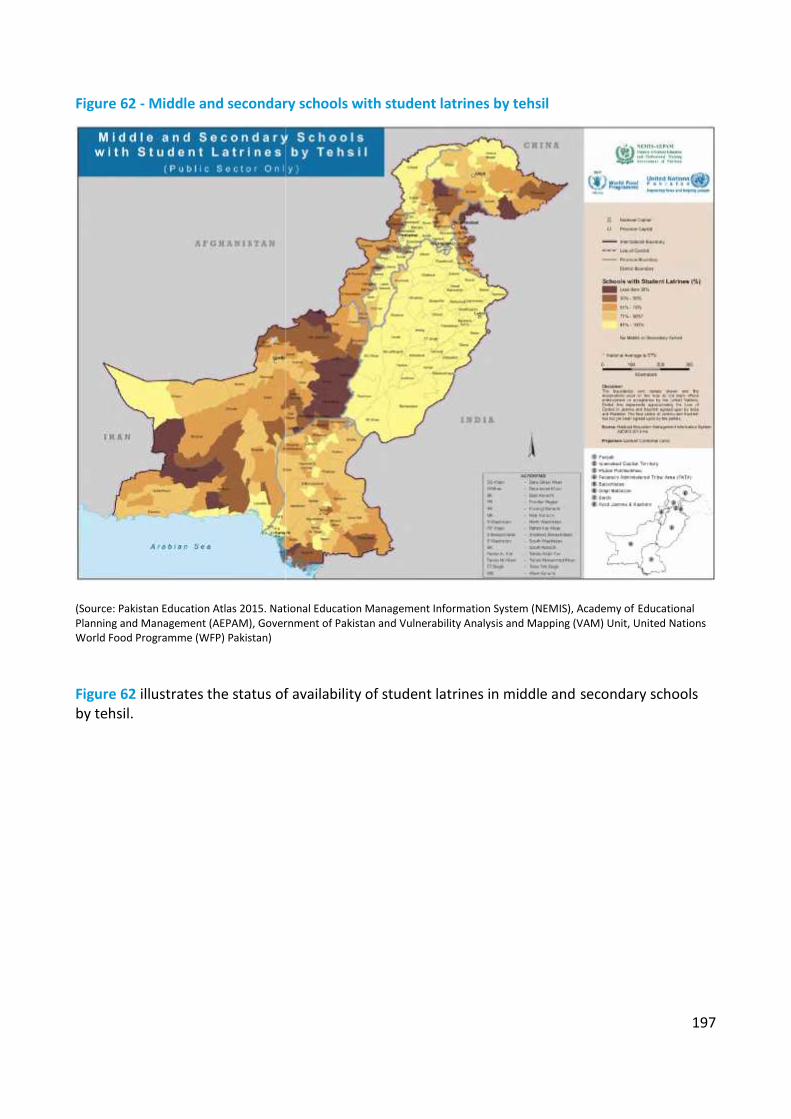
197
Figure 62 - Middle and secondary schools with student latrines by tehsil
(Source: Pakistan Education Atlas 2015. National Education Management Information System (NEMIS), Academy of EducationalPlanning and Management (AEPAM), Government of Pakistan and Vulnerability Analysis and Mapping (VAM) Unit, United NationsWorld Food Programme (WFP) Pakistan)
Figure 62 illustrates the status of availability of student latrines in middle and secondary schoolsby tehsil.
198
Health and Hygiene Education
The Sindh Education Sector Plan 2014-18 states that ‘Utilities management is not given dueattention. Drinking water standpoints are rarely available or are either not functional or of lowquality; toilets are not built as per quotas (25:1 for girls and 40:1 for boys) and design standards;awareness campaign drives to motivate children for proper use of facilities are very limited; andthe promotion of good health and hygiene practices is almost negligible’. The sector plan hastherefore identified health and hygiene as vital components under its strategic objective to‘Develop a contextually relevant and broad-based curriculum’.
One of the areas that can have a sustained impact on long term sustainability of improved hygieneand sanitation practices is by institutionalising and integrating teacher training in nutrition-sensitive WASH as part of Sindh Teacher Education Development.
There is no health screening of school children at present.
Presently, there is no module on WASH in either pre-service or in-service teacher trainingprogrammes. There is need for a curriculum review to incorporate a separate section/module onnutrition-sensitive WASH.
The Bureau of Curriculum and Extension Wing prepares and reviews the schools’ curriculum.There is currently very little on WASH. There is need for a curriculum review to incorporate aseparate section/module on nutrition-sensitive WASH.

199
Menstrual Hygiene Management
A study147 conducted at the national level showed WASH facilities in schools are not supportive tomenstrual hygiene management (MHM); majority of the girls rely on mothers and sisters for MHMrelated information; and little information is provided or discussed at school level. Most girlsreported using reusable torn cloth during menstruation, but reported difficulties in washing anddrying the cloth due to lack of privacy.
Trends of MHM in Azad Jammu Kashmir148 showed the following:
About 50% of schoolgirls dropped out of school during menstruation About 43% of schoolgirls said that there was no availability of protective material during their
monthly periods About 72% of schoolgirls did not use any pads during their monthly periods About 70% of schoolgirls had some knowledge about menstrual periods About 50% responded that they had financial problems in buying protective material
In the earthquake affected areas, there was limited but good availability of low cost sanitary padsproduction. In addition, there was limited but good MHM Information Education andCommunication (IEC) material available.
The study in Azad Jammu Kashmir found the following problems associated with Menstruation,which further resulted in limited coping strategies:
1) Shame during menses2) Information on menstruation is provided by close family members, if at all3) Teachers’ unwillingness to discuss menstrual hygiene4) Staying out of school for 3 -4 days: ridicule by boys, lack of facilities = poor school performance5) Lack of designated washrooms with water and disposal facilities in schools6) Changing, cleaning and drying of re-useable menstrual clothes7) Unable to afford conventional sanitary pads
The menstrual hygiene management study and action research conducted in 2013 helped girls inPunjab and Khyber Pakhtunkhwa to access improved and customised WASH services. Through thispilot project, UNICEF developed monitoring tools to assist duty bearers to enforce theconstruction and maintenance of appropriate menstrual hygiene management facilities in schools.UNICEF has prepared a booklet on Menstrual Hygiene Management for Adolescent Girls149.
The Integrated Rural Support Programme (IRSP) Pakistan in collaboration with Fresh Water ActionNetwork South Asia (FANSA) conducted a situation analysis150 on MHM in several districts in the
147 Menstrual Hygiene Management for Adolescent School Girls in KP and PAK, Pakistan, May 2013, UNICEF Pakistan148 Muhammad Masud Aslam. Menstrual Hygiene Management for Schoolgirls in Pakistan. Thematic Session: MHM DuringEmergencies, UNICEF Pakistan 2011149 UNICEF Annual Report 2013 - Pakistan150 Menstrual Hygiene Management – a neglected right of Pakistani women. IRSP-Pakistan, 2013

200
country, which included Haripur, Swabi, Charsadda and Mardan in Khyber Pakhtunkhwa;Faisalabad, Sargodha, Lahore and Multan in Punjab; and Khairpur, Mirpur Khas and Sukkur inSindh. Some of the key findings from this study were as follows:
About two-thirds (65.6%) of the girls/women used a cotton cloth during menses, and only16.8% used a sanitary pad
About a third (30%) did not wash their hands after changing the cloth About half (49.3%) reused the cloth About a fifth (19.3%) reused the cloth for 2 months, while a fourth (25%) reused it for 3
months or more Just under a third (28.7%) burnt the cloth after washing, while about half (47.5%) threw it in
the rubbish after washing it
The School of Nursing and Community Development Department of The Aga Khan Universityconducted a community-based study151 in Hyderabad also conducted by the School of Nursing andCommunity Development Department of The Aga Khan University, the findings showed thatmajority of women used some kind of material to absorb menses (98.5%). Most used a washedplain cloth (70.4%). However, unsanitary practices (e.g. unclean cloth) were used by 16.3%, and ofthose who washed the cloth, a large proportion (19.3%) did not dry the cloth in the sun, as is thebest practice. The frequency of change of the menstrual material averaged 2.5 changes on the firstday of menstruation to 0.6 change of material per day on the last days. Despite availability ofbathing facilities for nearly all women, only 64% reported bathing during menstruation.
The School of Nursing and Community Development Department of The Aga Khan Universityconducted a cross-sectional study152 to explore the menstrual practices among 1275 femaleadolescents of urban Karachi. Findings from the study showed that 50% of the girls lacked anunderstanding of the origin of menstrual blood and those with a prior knowledge of menarche hadgained it primarily through conversations with their mothers. Many reported having fear at thefirst experience of bleeding. Nearly 50% of the participants reported that they did not take bathsduring menstruation. Further analysis showed that factors of using unhygienic material, usingwashcloths, and not drying under sun were found to be statistically significant among those goingand not going to schools. The study concluded that there are unhygienic practices andmisconceptions among girls that require action by health care professionals.
The Government of Pakistan initiated a dialogue related to Menstrual Hygiene Management(MHM) in selected schools, primarily to understand the scope of education impacts and challengesacross cultural backgrounds.
While the issue of MHM relates more to reproductive health, it is an important hygiene and solidwaste issue especially at schools and in communities. MHM needs to be integrated in healtheducation and reproductive health programmes and communities sensitised about sanitary wastedisposal of pads and cloths used during the menstrual periods. Furthermore, dissemination of
151 Ali TS, Karmaliani R. Hygiene practices during menstruation and its relationship with income and education of women inHyderabad, Pakistan. Pakistan Journal of Women’s Studies. Alam-e-Niswan. Vol 13, No. 2, 2006, pp 185-199152 Ali TS, Rizvi SN. Menstrual knowledge and practices of female adolescents in urban Karachi, Pakistan. J Adolesc. 2010Aug;33(4):531-41
201
information about preparation of low cost home-made sanitary pads needs to be disseminatedthrough hygiene education for girls.
At present, there is no menstrual hygiene education for girls in middle and high schools in Sindh.
Sindh WASH in Schools (WinS) Strategic Plan 2017-2022
In view of the serious issue of missing facilities that not only had an impact on children’s healthbut also on enrolment and retention in schools, Department of Education, Sindh, Ministry ofFederal Education and Professional Training (MoFEPT) Islamabad and UNICEF collaborated todevelop a strategic plan to address WASH in schools.
The objectives and targets of the strategic plan include creating awareness, providing latrineswhere not already available and provision of drinking water by 2022.
The strategies to achieve the objectives and targets are (I) preparation of WASH policy andplanning guidelines (II) creating awareness amongst children and teachers and community abouthealth, hygiene and sanitation (III) construction of latrines (IV) provision of drinking water inschools where not already available (V) ensure operation and maintenance (VI) address crosscutting issues, such as latrines for persons with disabilities and Menstrual Hygiene Management(MHM) facilities.
The estimated cost for the strategic plan comes out to be around PKR 24.6 billion. The major costis on construction of latrines i.e. PKR 16.94 billion followed by drinking water i.e. PKR 7 billion andcrosscutting issues i.e. PKR 700 million.
The plan includes an effective system and mechanism, supervision and evaluation. The strategiesfor M&E include on site supervision and monitoring by Joint monitoring teams; generation andsharing of periodic progress reports; and district, provincial and national level implementationreview workshop. The proposed evaluation includes the baseline, interim and summativeevaluation. Besides it has also been proposed to develop and integrate wash indicators in SEMIS.

202
Strategy
EducationStrategicObjectives/Outcomes
Short Term Actions1 - 3 years
Medium Term Actions4 - 6 years
Long Term Actions7 - 10 years
Nutrition-sensitive WASHintegrated in teachertraining programme
Collaborate with SindhTeacher EducationDevelopment Authority,Board of Curriculum &Extension Wing, ProvincialInstitute of TeacherEducation, Sindh TextbookBoard and incorporatenutrition-sensitive WASHhygiene promotion in pre-service and in-serviceteacher trainingprogramme and CPDtraining of teachereducators
Nutrition-sensitive WASHhygiene promotioncascaded through TeacherEducators as part of on-going educationprogramme
Nutrition-sensitive WASHhygiene promotioncascaded through TeacherEducators as part of on-going educationprogramme
Nutrition-sensitive WASHhygiene promotioncascaded through TeacherEducators as part of on-going educationprogramme
Nutrition-sensitive WASHintegrated in schools’curriculum
Collaborate with SindhTeacher EducationDevelopment Authority,Board of Curriculum &Extension Wing, ProvincialInstitute of TeacherEducation, Sindh TextbookBoard for inclusion oftopics on nutrition-sensitive water, sanitationand hygiene in curriculumfor classes 1 to 12
WASH in Schools policyguidelines developed toensure operation andmaintenance of WASHinfrastructure in schools
Implement WASH inSchools policy guidelines in30% schools
Implement WASH inSchools policy guidelines inadditional 30% schools
Implement WASH inSchools policy guidelines in100% schools
Menstrual hygienemanagement integrated inhealth and hygiene for girls
Nutrition-sensitive WASHhygiene promotion moduleincorporates menstrualhygiene management forgirls
Impart menstrual hygiene
Impart menstrual hygienemanagement education innutrition-sensitive WASHhygiene promotion to atleast 50% of girls middleand high schools as part ofon-going school health
Impart menstrual hygienemanagement education innutrition-sensitive WASHhygiene promotion to atleast 75% of girls middleand high schools as part ofon-going school health

203
management education innutrition-sensitive WASHhygiene promotion to atleast 25% of girls middleand high schools as part ofon-going school healtheducation and WinS
education and WinS education and WinS
100% of schools withmissing facilities havesafely managed drinkingwater and latrines (30% inshort term, 30% in mediumterm, 40% in long term)(extension of waterdistribution pipe fromwater supply scheme,water tank and 2 latrinesper school) in line withSESP and Sindh WinSstrategic plan 2017-2022
Water SupplyMore than 68% of primary,76% of middle and 91% ofhigh schools with missingfacilities have safelymanaged drinking water inline with SESP and SindhWinS strategic plan 2017-2022
Create linkages withPCRWR and PHE&RDD forwater quality testing andreporting in at least 10%schools
SanitationMore than 71% of primary,82% of middle and 97% ofhigh schools with missingfacilities have safelymanaged latrines andinclude proper design ofwastewater in schools inline with SESP and SindhWinS strategic plan 2017-2022
Water SupplyMore than 89% of primary,92% of middle and 97% ofhigh schools with missingfacilities have safelymanaged drinking water inline with SESP and SindhWinS strategic plan 2017-2022
Create linkages withPCRWR and PHE&RDD forwater quality testing andreporting in 10% ongoingand 20% additional schools
SanitationMore than 90% of primary,94% of middle and 99% ofhigh schools with missingfacilities have safelymanaged latrines andinclude proper design ofwastewater in schools inline with SESP and SindhWinS strategic plan 2017-2022
Water Supply100% of primary, 100% ofmiddle and 100% of highschools with missingfacilities have safelymanaged drinking water inline with SESP and SindhWinS strategic plan 2017-2022
Create linkages withPCRWR and PHE&RDD forwater quality testing andreporting in 30% ongoingand 30% additional schools
Sanitation100% of primary, 100% ofmiddle and 100% of highschools with missingfacilities have safelymanaged latrines andinclude proper design ofwastewater in schools inline with SESP and SindhWinS strategic plan 2017-2022

204
SECTOR EFFICIENCY AND CAPACITY
Service Efficiency
Over the last decade, the per capita total sectoral expenditure has increased marginally from PKR149 in 2005-06 to PKR 164 in 2014-15, but when considered in the context of inflation, it isnegligible (Fig 63). Further, the per capita sectoral development spend has actually decreasedfrom PKR 137 in 2005-06 to PKR 117. This indicates diminishing prioritisation of public spending inthe sector. On average, the proportion of per capita development spend to overall per capitasectoral spend between 2010-2015 is just under three-fourths (73%).
In 2014-15, the total per capita sectoral expenditure was PKR 867 in Balochistan, compared to PKR260 in Punjab, PKR 313 in Khyber Pakhtunkhwa, and PKR 164 in Sindh. This indicates that Sindhhas the lowest per capita sectoral spend of the provinces. Figure 64 illustrates the wide differencein per capita sectoral spending in water and sanitation compared to other provinces in 2014-15.
Figure 63 - Decadal Per Capita Sectoral Trends
(Source: Computation based on population projections for 2015 and PRSP expenditures - Annual PRSP Budgetary Expenditures forFY 2005-06 to 2014-15, Ministry of Finance, Government of Pakistan. Population estimates obtained from Development Statisticsof Sindh 2013)

205
Figure 64 - Per Capita Sectoral Spend Trends 2014-15
(Source: Computation based on population projections for 2015 and PRSP expenditures - Annual PRSP Budgetary Expenditures forFY 2014-15 (Provisional), Ministry of Finance, Government of Pakistan)
There are provincial differences in the access to and quality of improved drinking water supplysources, sanitation systems and garbage collection systems. The provincial trends are illustrated asfollows:
Fig 65 for sources of drinking water supply in which Sindh and Punjab are progressing at thesame pace with 90% or more with access to improved water supply
Fig 66 and Fig 67 for distance to source of drinking water supply in which Sindh is second toPunjab with 79% inside the house
Fig 68 shows who installed the water supply – it is important to note that 72% of hand pumpsand 79% of motor pumps have been installed by the households themselves, while 96% ofopen wells were installed by NGOs. This raises serious concerns about the quality ofinstallation and risk of using unsafe water supply
Fig 69 for type of toilet used which shows that Sindh still has about 7% population with notoilet
Fig 70 for type of sanitation system used which shows that in Sindh, 58% of the populationuses unsafe sanitation systems (17% use open drains and 41% have no system)
Fig 71 for type of garbage collection system from household which shows that 69% ofhouseholds do not have any garbage collection system
Fig 72 for type of urban garbage collection system from household which shows that 56% ofhouseholds have a garbage collection system while 44% do not

206
Figure 65 - Provincial trends of source of drinking water supply
(Source: PSLM 2014-15)
Figure 66 - Distance to source of drinking water supply by province
(Source: PSLM 2013-14)
206
Figure 65 - Provincial trends of source of drinking water supply
(Source: PSLM 2014-15)
Figure 66 - Distance to source of drinking water supply by province
(Source: PSLM 2013-14)
206
Figure 65 - Provincial trends of source of drinking water supply
(Source: PSLM 2014-15)
Figure 66 - Distance to source of drinking water supply by province
(Source: PSLM 2013-14)

207
Figure 67 - Distance to source of drinking water supply in Sindh
(Source: PSLM 2013-14)
Figure 68 - Who installed water supply
(Source: PSLM 2013-14)
207
Figure 67 - Distance to source of drinking water supply in Sindh
(Source: PSLM 2013-14)
Figure 68 - Who installed water supply
(Source: PSLM 2013-14)
207
Figure 67 - Distance to source of drinking water supply in Sindh
(Source: PSLM 2013-14)
Figure 68 - Who installed water supply
(Source: PSLM 2013-14)

208
Figure 69 - Type of toilet used by province
(Source: PSLM 2014-15)
Figure 70 - Type of sanitation system used by province
(Source: PSLM 2013-14)
208
Figure 69 - Type of toilet used by province
(Source: PSLM 2014-15)
Figure 70 - Type of sanitation system used by province
(Source: PSLM 2013-14)
208
Figure 69 - Type of toilet used by province
(Source: PSLM 2014-15)
Figure 70 - Type of sanitation system used by province
(Source: PSLM 2013-14)

209
Figure 71 - Type of overall garbage collection system from household by province
(Source: PSLM 2013-14)
Figure 72 - Type of urban garbage collection system from household by province
(Source: PSLM 2013-14)
209
Figure 71 - Type of overall garbage collection system from household by province
(Source: PSLM 2013-14)
Figure 72 - Type of urban garbage collection system from household by province
(Source: PSLM 2013-14)
209
Figure 71 - Type of overall garbage collection system from household by province
(Source: PSLM 2013-14)
Figure 72 - Type of urban garbage collection system from household by province
(Source: PSLM 2013-14)

210
Table 14 highlights the service efficiency of different water and sanitation agencies. It shows thatKW&SB underperforms in most of the indicators only second to WASA Quetta. It has low billingand collection ratios, a high staffing ratio, and no fee for new sewerage connection. NSUSC has thelowest average unit production cost and staffing ratio. Table 15 provides further insights to serviceefficiency.
Table 14 - Comparison of service efficiency in water and sanitation agencies
KhyberPakhtunkhwa
WASAPeshawar
PunjabWASA Lahore
SindhKarachi Waterand Sewerage
Board
North SindhUrban Services
CorporationSukkur
BalochistanWASA Quetta
SERVICEWater coverage 100% 89% 90% 40% 70%
Sewerage coverage 100% 88% 80% 85% 12.5%Water availability 9 hr/d per
consumer14-18 hr/d per
consumer5 hr/d perconsumer
8 hr/d perconsumer
1 hr/d perconsumer
Per capitaconsumption
312 litres perday
327 litres perday
135 litres perday
77 litres per day 59 litres per day
EFFICIENCYAverage unit
production costPKR 7.90/m3 PKR 6.73/m3 PKR 7.69/m3 PKR 0.08/m3 PKR 0.75/m3
Billing efficiency 100% 98% 70% 80% 60%Collection efficiency 93% 80% 43% 60% 21%
Staffing ratio(staff/1000 water and
sewerage connections)
7 4 7 3 24
ANNUAL O&M COSTSalary N/A 33% 65% 41% 47%Power N/A 46% 7% 30% 39%Others N/A 21% 28% 29% 14%
CONSUMER SERVICEAverage waterbill/month per
connection
PKR 219 PKR 287 PKR 449 PKR 30 PKR 125
New connection feewater supply
residential
PKR 2,300 –5,750
PKR 6,400 PKR 3,207(average)
PKR 365 PKR 1,000
New connection feesewerage residential
PKR 1,500 –4,600
PKR 400 NIL NIL Nil
(Source: Pakistan Water and Sanitation Operators Directory, 2012. Pakistan Water Operators Network)
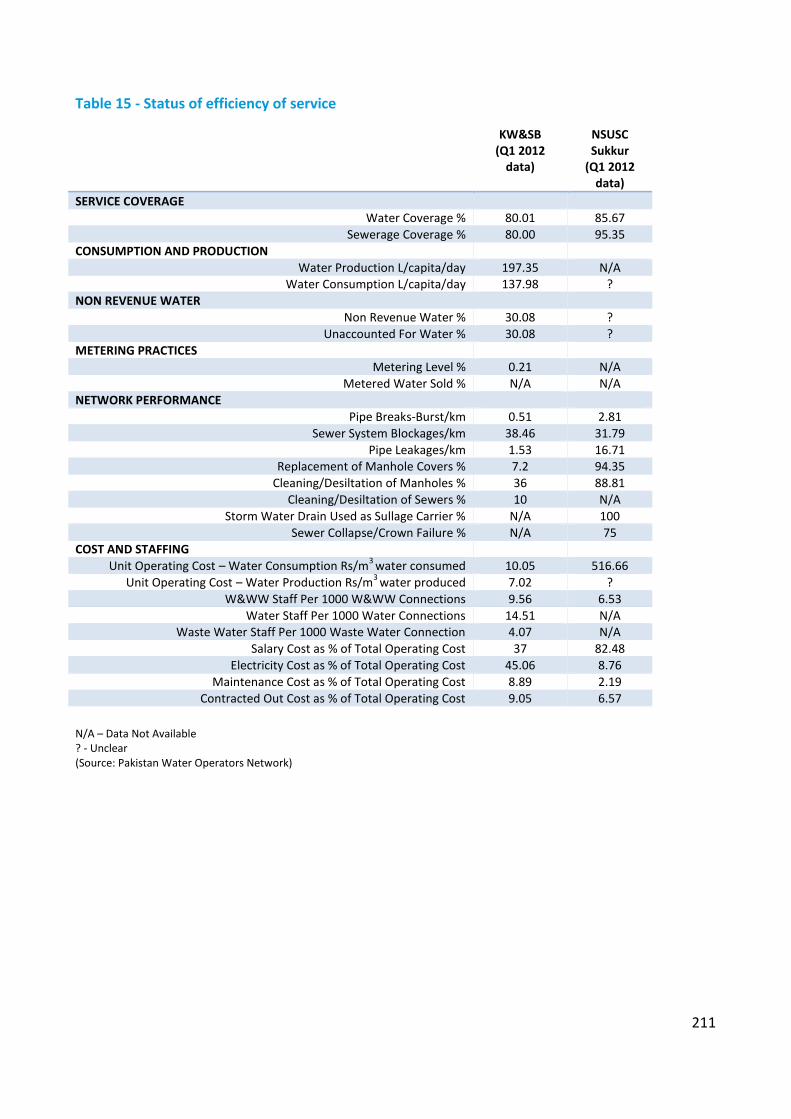
211
Table 15 - Status of efficiency of service
KW&SB(Q1 2012
data)
NSUSCSukkur
(Q1 2012data)
SERVICE COVERAGEWater Coverage % 80.01 85.67
Sewerage Coverage % 80.00 95.35CONSUMPTION AND PRODUCTION
Water Production L/capita/day 197.35 N/AWater Consumption L/capita/day 137.98 ?
NON REVENUE WATERNon Revenue Water % 30.08 ?
Unaccounted For Water % 30.08 ?METERING PRACTICES
Metering Level % 0.21 N/AMetered Water Sold % N/A N/A
NETWORK PERFORMANCEPipe Breaks-Burst/km 0.51 2.81
Sewer System Blockages/km 38.46 31.79Pipe Leakages/km 1.53 16.71
Replacement of Manhole Covers % 7.2 94.35Cleaning/Desiltation of Manholes % 36 88.81
Cleaning/Desiltation of Sewers % 10 N/AStorm Water Drain Used as Sullage Carrier % N/A 100
Sewer Collapse/Crown Failure % N/A 75COST AND STAFFING
Unit Operating Cost – Water Consumption Rs/m3 water consumed 10.05 516.66Unit Operating Cost – Water Production Rs/m3 water produced 7.02 ?
W&WW Staff Per 1000 W&WW Connections 9.56 6.53Water Staff Per 1000 Water Connections 14.51 N/A
Waste Water Staff Per 1000 Waste Water Connection 4.07 N/ASalary Cost as % of Total Operating Cost 37 82.48
Electricity Cost as % of Total Operating Cost 45.06 8.76Maintenance Cost as % of Total Operating Cost 8.89 2.19
Contracted Out Cost as % of Total Operating Cost 9.05 6.57
N/A – Data Not Available? - Unclear(Source: Pakistan Water Operators Network)

212
Table 15 continued.KW&SB
(Q1 2012data)
NSUSC(Q1 2012
data)QUALITY OF SERVICE
Continuity of Service per day 5 9Chemical Unfit Source(s) % 1.15 100
Biologically Unfit Source(s) % 2.07 100Chemically Unfit at Taps % 2 100Biologically Unfit at Taps % 2.53 100
Water Quality – % of Required Residual Chlorine Test 100 100Water Quality – Samples Passing On Residual Chlorine % 78.75 100
Complaints About W&WW Services % of total connections 17.29 1.77Waste Water Treatment – Primary Level % 61.1 0
Waste Water Treatment – Secondary Level % 0 0BILLING AND COLLECTION
Average Revenue Water and Waste Water Rs/m3 water sold 6.16 176.21Collection Period days 1910.39 N/A
Billing Efficiency % 94.88 ?Collection Efficiency (Physical) % 26.42 86.41
Collection Efficiency (Financial) % 61.5 400FINANCIAL PERFORMANCE
Operational Cost Coverage (ratio) 0.61 0.34Working Ratio 1.63 2.93
Debt Servicing % N/A N/A
N/A – Data Not Available? - Unclear(Source: Pakistan Water Operators Network)
Table 15 presents the status of efficiency of KW&SB and NSUSC Sukkur in 2012. Some of thehighlights are indicated below.
Service CoverageBoth show good coverage of 80% and above.
Consumption and ProductionThe production in KW&SB is 197.35 L/capita/day, while the consumption is 137 L/capita/day.There is an apparent good correlation between production and capacity with 70% consumptionbeing matched by production.
Water consumption rates in litres per person per day are shown below for selected countries 153:
Germany – 193 L/capita/day Brazil – 187 L/capita/day Philippines – 164 L/capita/day United Kingdom – 149 L/capita/day
153 http://www.data360.org/dsg.aspx?Data_Set_Group_Id=757 accessed on 22 May 2016

213
India – 135 L/capita/day China – 86 L/capita/day
This shows that the median consumption rate is about 156 L/capita/day, and when about 20% isadded for NRW/UAW, the figure comes to about 187 L/capita/day. This is equivalent to about 40gallons per person per day.
The water needs per person per day are estimated to be about 120 L/capita/day154 as shownbelow:
Drinking – 5 litres Food preparation – 10 litres Bathing – 25 litres Sanitation – 45 litres Laundry – 35 litres
This is about 26 gallons per person day.
From the available data, the production and consumption rates at KW&SB seems to be at optimallevel.
Non Revenue WaterNon Revenue Water and Unaccounted for Water is still high at 30% and KW&SB should strive tobring these close to 10% or lower.
Metering PracticesMetering practices are dismal with KW&SB at less than 1%.
Network PerformanceCleaning and de-silting of drains and sewers varies from KW&SB and NSUSC. Higher cleaning ratesof about 88.81% are noted in NSUSC compared to 36% at KW&SB for cleaning/desilting ofmanholes. However, factors like gravity, pumping house functionality, and overall O&M probablydetermine need and frequency for cleaning. Both KW&SB and NSUSC show high rates of sewersystem blockages/km of over 30%.
Cost and StaffingThe Water and Waste Water staff per 1000 connections ranges from 9.56 at KW&SB to 6.53 atNSUSC. The desired rate should be closer to 2-3 staff per 1000 connections. A higher rate indicateslesser efficiency. Further, KW&SB has a much higher proportion of electricity to total operatingcosts (45%) compared to 8.76% at NSUSC. Most of the operating cost at NSUSC is salary cost(82.48%).
154 Adapted from Arlene B. Inocencio, Jose E. Padilla and Esmyra P. Javier. Determination of Basic Household Water Requirements.February 1999. Philippine Institute for Development Studies

214
Quality of ServiceThe quality of water shows that ‘chemically unfit at source’ and ‘biologically unfit at source’ atKW&SB is generally 1.15% and 2.07% respectively. However, ‘chemically unfit at taps’ and‘biologically unfit at taps’ at KW&SB is 2% and 2.53% respectively. The data for NSUSC is unclear.
Billing and CollectionThe collection period at KW&SB is a staggering 1910.3 days. On the positive side, it has a highbilling efficiency at 94.88%, but falls short again in its collection efficiency (physical) of 26.42%.NSUSC has a high collection efficiency (physical) of 86.41% and also a high collection efficiency(financial) of over 400%.
Financial PerformanceThe operating cost coverage ratio is better at KW&SB with 0.63, and also a better working ratio of1.63. Optimal financial performance requires for the operating cost coverage ratio to be morethan 1.0 and working ratio to be less than 1.0.
Specific recommendations of the Reform Led Investment Plan of KW&SB
Tackle inefficiency by promoting institutional reforms:
Enhance governance and insulate the utility from political interference while maintainingpublic accountability: i.e. Corporatize KW&SB
Strengthen KW&SB Board of Directors Institutional restructuring of KW&SB Amend KW&SB Act to revisit board composition and role and responsibilities of the utility
management Enhance civil society and citizen engagement with specific focus on gender and marginalised
segments Introduce a new KW&SB Brand responding to customers Reaching out to Urban Poor
Improve the Financial with careful attention to poor households.
Develop and implement WSS financial viability plan for revenue mobilization, recoveringarrears (incrementally) and collecting current bill (100%), introducing domestic metering inpilot areas with volumetric tariff and rationalizing tariff (Target: recovering 100% OpEx)
Outsourcing of billing and collection to private sector on pilot basis in selected towns/districts. Improve water availability by reducing losses Develop and implement a performance improvement plan for KW&SB (Target: Universal
access, Reliability: 8 hours/day) Establish pro-poor service unit in KW&SB for improving service delivery in low income and
informal settlement

215
Social Audit of Local Governance and Delivery of Public Services
A Social Audit of Local Governance and Delivery of Public Services155 conducted by United NationsDevelopment Programme (UNDP) in 2011 – 2012 indicated the following findings in the differentprovinces:
Drinking Water Supply A higher proportion of respondents in Punjab (39%) indicated that they do not have access to
government drinking water compared to any other province. Punjab is followed byBalochistan, where 30% of households do not have access to government water services. Thesituation is far better in Sindh and Khyber Pakhtunkhwa, where 89% and 85% of respondentsrespectively indicated that they do have access to government water services. The bettersituation in Sindh may be due to high urbanisation in the province with a large population ofthe province residing in Hyderabad and Karachi. However, the rural marginalised communityof Sindh reported clean drinking water as a major problem of their area
Residents in Sindh are most satisfied with government water services, with three-fifths (60.4%)of respondents indicating that they are satisfied. This is only slightly higher than thesatisfaction in Punjab (55.2%), which is in turn significantly higher than the satisfaction inKhyber Pakhtunkhwa where only 44.8% of respondents indicated they were satisfied withwater supply. The situation in Balochistan with respect to this question is by far the worst, withless than one-third (31.6%) of respondents indicating they were satisfied with governmentwater supply. There is, therefore, a clear ranking in the satisfaction with water amongprovinces, with Sindh displaying the highest satisfaction followed by Punjab, KhyberPakhtunkhwa and Balochistan. The high percentage of dissatisfied households in Balochistan,with government water services, is corroborated by the findings of focus group discussionsconducted with different groups in Balochistan. According to the rural marginalisedcommunity of Balochistan, there has not been any change for the better in the present system,rather the situation has grown from bad to worse – “Drinking water is the biggest issue of ourarea but nothing has been done in this regard”
Sewerage and Sanitation Availability of adequate sewerage and sanitation in the country, particularly in urban and peri-
urban areas, is a key indicator of development and affects living standards of citizens. InPakistan, sewerage and sanitation has been on the agenda of local governments since 1960’swith this service being implemented at the tehsil and/or union council levels through variouslocal government systems. Indeed, its importance in maintaining hygiene standards ofsettlements, preventing outbreaks of epidemics and its impact in the health of communitiesmake this public service an essential element of measuring the state-citizen relationship
Punjab and Khyber Pakhtunkhwa have similarly high levels of sanitation service availability at85.5% and 82.1%. Sindh has lower access to sanitation than Khyber Pakhtunkhwa and Punjab,at 73.5%. Access in Sindh is still higher than Balochistan, however, which lags behind all theother three provinces with only 54.5% of respondents indicating that they have access tosanitation services
155 Adapted from Social Audit of Local Governance and Delivery of Public Services 2011 – 2012. National Report, 2012. UNDP

216
Households in Sindh (31.3%) and Punjab (30.6%) are more likely to be satisfied with sanitationcompared to those in Khyber Pakhtunkhwa and Balochistan. Among Khyber Pakhtunkhwa andBalochistan, there is also a significant difference in satisfaction with only 11.4% of householdsin Balochistan expressing satisfaction with sanitation compared to 21.6% in KhyberPakhtunkhwa. This suggests that the government is failing to satisfy citizen’s demand forsanitation in all four provinces, but more so in Khyber Pakhtunkhwa and Balochistan, andespecially so in Balochistan where only 1 out of 9 households are satisfied with sanitationcompared to 2 out of 9 for Khyber Pakhtunkhwa and almost 3 out of 9 for Sindh and Punjab
Garbage Disposal Khyber Pakhtunkhwa (30.7%) and Punjab (33.1%) have similarly low levels of access to garbage
disposal services, with one-third or less of respondents indicating that they do not have access.Surprisingly, Balochistan has higher levels of access to garbage disposal services with 44.4% ofrespondents indicating so. Sindh has higher access compared to all three other provinces, witha majority (61.3%) of respondents indicating that they have access to garbage disposalservices. Hence the garbage disposal service is much more likely to be available in Sindh thanother provinces
Residents in Balochistan are least satisfied with garbage disposal with only 13% of respondentswho have access to garbage disposal indicating they were satisfied. Satisfaction levels werealso low, but higher than Balochistan, in Khyber Pakhtunkhwa where a little more than a fifth(21.1%) of respondents indicated they were satisfied. The situation is comparatively better inPunjab (40.1%) and Sindh (37.0%) compared with Khyber Pakhtunkhwa and Balochistan
217
Public Opinion on Quality of Governance in Sindh
A survey on Public Opinion on Quality of Governance in Pakistan156 was undertaken by thePakistan Institute of Legislative Development And Transparency (PILDAT) in 2014-15. The keyfindings with regards to water and sanitation in Sindh included the following:
Provincial Government performance with regards to access to safe drinking water supply – 1%indicated very good, 17% good, 38% bad, and 39% very bad
Provincial Government performance with regards to Sanitation (Sewerage, Solid WasteCollection and Disposal) – 2% indicated very good, 21% good, 33% bad, and 38% very bad
These findings suggest that 82% of the population is not satisfied with drinking water services,while 77% are dissatisfied with sanitation services.
A survey on Assessment of the Quality of Governance in Sindh157 was undertaken by the PakistanInstitute of Legislative Development And Transparency (PILDAT) in 2014-15. There was extremedissatisfaction of the public with the Government's performance. Public approval fell from 28% in2013-2014 to 18% in 2014-2015. This is reflective of the acute water shortage problem that peopleof Karachi have been facing this year. According to statistical reports at KW&SB's official website,the present supply of water to Karachi from Indus and Hub sources is approximately 650 milliongallons per day (MGD) and the demand for 20 million population is estimated to be 1080 MGD (54gallons per capita per day). The current shortfall is calculated to be 430 MGD. By the end of theyear 2020, the population of Karachi is expected to be around 23 million and the demand of 49water would be 1242 MGD (54 GPCD). And the short fall of water will be of 600 MGD (2700ml/day.
According to PILDAT's Public Opinion Poll on Quality of Governance, the Approval Rating for theprovision of sewerage and solid waste collection in Sindh was 24% in 2013-2014. In 2014-2015,this figure further declined to 23%, suggesting an increasing dissatisfaction of the public regardingthe Government's performance in improving sanitation in the Province.
Citizen Report Card
A project designed to test the feasibility of using a Citizens Report Card was undertaken incollaboration with KW&SB and supported by WSP to gain insights about perceptions and attitudesof citizens towards services, and identify local issues pertaining to water and sanitation in Karachi.A quantitative survey of 4500 households was conducted in 9 towns of Karachi covering the north,south, central, north east, and south west areas of the city representing low, middle and highincome groups.
156 Public Opinion on Quality of Governance in Pakistan. Second Year of the Federal and Provincial Governments June 2014 – May2015. Pakistan Institute of Legislative Development And Transparency (PILDAT), October 2015157 Assessment of the Quality of Governance in Sindh. Second Year of the Provincial Government May 2014 – May 2015. PakistanInstitute of Legislative Development And Transparency (PILDAT), March 2016

218
Eight themes were analysed:
Availability, access and use of services Reliability of services Perceptions on water quality Costs incurred by customers Interactions with KW&SB Transparency in service provision Satisfaction with services Priority areas for improvement
Key findings revealed that KW&SB’s services were found satisfactory and above average by 6.5%of users, and that both users and utility staff want improvement in systems and services. Theproject has built in a strong demand side advocacy component and a supply side willingness toreform.
Tube wells in Sindh
Figure 73 illustrates the exponential increase of tube wells in Sindh from 2011-12 to 2013-14.While over 90% of tube wells are for agricultural purposes, it indicates an increasing trend ofgroundwater mining and thereby reducing valuable freshwater resources. There is need toenhance efficient use of surface water and reduce groundwater abstraction.
Figure 73 - Tube wells in Sindh
(Source: Agricultural Statistics of Pakistan 2013-14. Government of Pakistan)

219
Sector Capacity
Municipal Training and Research Institute (MTRI)Municipal Training and Research Institute (MTRI)158 was an attached department of Ministry ofLocal Government and Rural Development to impart training and orientation facilities to electedrepresentatives i.e. Nazims/Naib Nazims, Members/ Councillors, Officers and staff of LocalGovernment Institutions viz District Governments, TMAs and Union Councils as well as therepresentatives of NGOs. MTRI was established in the year 1986. However, it became functionalduring the year 1988-89. The Mission Statement of MTRI is to strengthen a sound LocalGovernment System consisting of trained professionals in the country who are responsive topublic needs at the grassroots.
Municipal Training and Research Institute (MTRI), Karachi being a local Government Institute atthe apex level provides a comprehensive training forum to the participants from all over Pakistanand other regional countries to exchange views and share their experiences and knowledge on theproblems and constraints being faced by them in the field of Local Government, Management ofLocal Affairs and Sustainable Local Development. The training also aims to raise their knowledgeand skill and to equip them with modern techniques for making positive contribution to thedevelopment process carried out in their respective localities.
Sindh Local Government and Rural Development AcademySindh Local Government and Rural Development Academy159 was originally established as villageaid training institute in 1953 at Sakrand. In 1956, it was shifted to Tandojam in the presentcampus. In the first phase, the institute was confined to the level of imparting pre-service and in-service trainings to the newly recruited male and female village workers under the Village-AidProgramme in the subjects of agriculture, animal husbandry, horticulture, poultry, carpeting,smiting, home economics, community development, first aid and child card. During the aboveperiod, eight long term courses, each of one year duration, were conducted at the institute and522 male and female workers were trained in 1960. The second phase started after the wind up ofthe Village Aid Programme and introduction of Basic Democracies system in the country in July1960.
The institute was renamed Basic Democracies Training Institute Southern Zone. The institutecatered for the training needs of offices/officials and the elected representatives of various tiers ofBasic Democracies in Karachi, Hyderabad, Khairpur, Multan, Bahalwalpur, Quetta and Kalatdivision of the then province of West Pakistan. In all, 93 courses of two or three weeks and threeto six months duration were conducted and 3188 participants were trained in the subjects ofPublic Administration, Office Procedure, Basic Democracies Order 1959, Municipal AdministrationOrdinance 1960 and rules framed thereunder, Accounts, Budget, Taxation, Conciliation CourtsOrdinance, etc. 1970. Subsequent to Basic Democracies system, the nomenclature of the institutewas changed as Sindh Local Government Training Institute, with the object of catering the training
158 A Study on the Civil Service Structure, Civil Servants Training and an Overview of National Commission of Government Reformsin Pakistan, 2013. Government of Khyber Pakhtunkhwa, German Federal Ministry of Economic Cooperation and Development(BMZ) and Deutsche Gesellscha für Interna onale Zusammenarbeit (GIZ) GmbH159 A Study on the Civil Service Structure, Civil Servants Training and an Overview of National Commission of Government Reformsin Pakistan, 2013. Government of Khyber Pakhtunkhwa, German Federal Ministry of Economic Cooperation and Development(BMZ) and Deutsche Gesellscha für Interna onale Zusammenarbeit (GIZ) GmbH

220
needs of the officers/officials of local councils, constituted under Sindh Peoples Local GovernmentOrdinance 1979. During this phase, 74 training courses were conducted and 4858 participantswere trained.
In July 1983, the institute was raised to the status of academy and renamed as the Sindh LocalGovernment and Rural Development Academy. In 2006, the Academy was renamed and upgradedas Sindh Civil Services and Local Government Academy Tandojam. Presently, the Academy has anenhanced scope in its activities and a well-articulated methodology of training in the field of ruraldevelopment to the functionaries of various departments at Taluka, district and division level andelected representatives of local councils and village leaders are being sponsored to acquaint themwith the nature and scope of the problem of rural development. The functionaries are being keptabreast of the latest knowledge and skills to improve their efficiency. The Academy is alsoconducting different training programmes in the disciplines of local government system, financialmanagement and public administration for the employees and elected representatives of localcouncils.
The Academy has four facilities namely, Local Government, Rural Development. FinancialManagement and Public Administration and each faculty is headed by one post of Chief Instructor(BS-18) and three posts of posts of Senior Instructors BS-17160.
The main objective of these courses is to acquaint local council employees at various level andelected representatives about the working of local government system and to create in themprofessional skills and to enhance their capability and aptitudes for better management of localcouncils.
Achievements The Academy has imparted trainings to trained 13,096 participants through 317 courses from
1982 to September-2015, conducted and organised different in-campus and off-campusTrainings / Workshops / Seminars and Conferences
Apart from above according to NRB instructions, 426 notified trainers were trained by theMaster Trainers at this Academy from 15th April to 6th July- 2001
Through these trainers, 21,637 Councillors including Nazims and Naib Nazims of entire Sindhwere also trained before taking their oath i.e. 14th August- 2001
844 Chief Municipal Officers of Municipal Committees, Town Officers of Town Committees andSecretaries, Union Councils were trained in collaboration with UNDP, on “Water Sanitation andHygienic” and “Local Government Budgeting for WASH” in this Academy in 2015
4,000 Elected Members of Local Government were trained through a one day Seminar /Workshop in 2005, under the directives of the Chief Minister at 14 District Headquarters
300 Mukhtiarkars, Supervising Tapedars and Tapedars of five districts i.e. Thatta, Umerkot,Sanghar, Mirpurkhas and Badin were trained in-collaboration with the Board of Revenue Sindh
Provided managerial support to WPSS for imparting trainings to 3635 Women Councilors ofSindh at Taluka level
1,289 Nazims/Naib Nazims/Women Councilors/ Potential Local Women Leaders andSecretaries of Union Councils were trained in eight district of Sindh in collaboration withGender Based Governance System Project
160 Update information provided by the Sindh Civil Services and Local Government Academy Tandojam

221
Staffing Capacity for Solid Waste Management
Table 16 indicates the staffing capacity for solid waste management in selected secondary cities inSindh. This needs to be viewed together with Table 12 in the Chapter on Solid Waste.
Table 16 - Staffing Capacity for solid waste management in selected secondary cities
Mirpur Khas Umerkot Johi Larkana Shikarpur SukkurChief Officer 1 1 1 1 1 1Chief SanitaryInspector
1 1 1 1
SanitaryInspectors
8 3 1 11 2 7
Supervisors 4 5Drivers 6 4 13 5 14SanitaryJamadars
8 23 8 17
Collectors 18 12 3 40 18 28SanitaryWorkers
305 120 21 290 118 364
(Source: Capacity Building for Environmental Management in Sindh, 2006. Asian Development Bank TA 4432-PAK)
There is insufficient data regarding other cities at present and warrants further study.
Staffing Capacities in Local Government and Public Health Engineering
A comparison of the basic structure in Local Government and Public Health Engineering is shownin Table 17. It illustrates that the technical capacity for water supply and sewerage and drainagelies in public health engineering, while administrative capacity lies with Local Government. Thispresents a major challenge to Local Government for providing O&M services as per currentregulations. This anomaly needs to be corrected so that both installation and O&M of watersupply and sewerage and drainage schemes rest with Public Health Engineering, while solid wastemanagement and general sanitation services rest solely with Local Government.
The Government of Sindh has recently issued a notification directing O&M functions to beexecuted by PHE&RDD and financing for this is being provided.

222
Table 17 - Comparative structure in Local Government and Public Health Engineering
Local Government Public Health EngineeringLG&HTPD Secretariat - Karachi PHED Secretariat – KarachiSindh Civil Services and Local Government Academy -TandojamMTRI - KarachiProvincial Local Government Commission (IM&EC) -Karachi
Chief Engineer – Hyderabad. The Chief Engineer issupported by a Director (Technical), 2 SuperintendingEngineers, 1 Research Officer, 2 Design Officers, 1Executive Engineer, 1 Senior Geophysicist, 1 JuniorGeophysicist, 1 Chief Head Draughtsman and 1 Hydro-geologist
Rural Development Department Secretariat - Karachi Chief Engineer – Sukkur. The Chief Engineer is supportedby a Director (Technical), 2 Superintending Engineers, 2Design Officers, 1 Executive Engineer, 1 SeniorGeophysicist, 1 Junior Geophysicist, 1 Chief HeadDraughtsman and 1 Hydro-geologist
Director General Rural Development Department -Hyderabad
Research Laboratory - Hyderabad
Field Office Local Government – one each in 23 districts.A Field Office is staffed by a Local Government SupportOfficer assisted by 3-9 Development Officers
Superintending Engineer – one each in 4 divisions
Field Office (SAP) – one each in 15 districts. A Field Office(SAP) usually has 3-9 District Officers
Executive Engineer – one each in 25 districts. OneExecutive Engineer is supported by 3-4 AssistantEngineers and 1 Sub-Engineer
Directorates of Local Government – one each in 5divisionsDivisional Office of Director RDDField Office (SAP) of Executive Engineer
Administration cadres BPS 16-20 – 238 nos Administration cadres BPS 16-20 – 24 nosTechnical cadres BPS 16-20 – 12 nos Technical cadres BPS 16-20 – 187 nosOther cadres BPS 14 and below – 1090 nos Other cadres BPS 14 and below – 3075 nos(Source: Government of Sindh, Annual Budget 2015-16)

223
Strategy
Sector Efficiency and CapacityStrategicObjectives/Outcomes
Short Term Actions1 - 3 years
Medium Term Actions4 - 6 years
Long Term Actions7 - 10 years
Reduced systems leakagesof Non Revenue Water andUnaccounted for Water
Map out points of systemleakages area by area andtake remedial measures forDistribution NetworkImprovements (DNI)
Reduce NRW losses from60% to 30% in Karachi
Reduce NRW and UAW to20% or less
Outsource at least 25% ofrevenue collection
Reduce NRW and UAW to20% or less in Karachi andother cities of Sindh
Reduce NRW and UAW to10% or less in Karachi andother cities of Sindh
Increased household watermetering
Introduce water meteringin phases
All new connections to bemetered
At least 100% of highincome areas havemetering in place
All commercial andbusiness premises havewater metering
At least 10% of mediumincome areas havemetering in place
At least 20% of mediumincome areas havemetering in place
Efficient Billing andCollection
Collection period reducedto less than 30 days
Billing efficiency increasedto 50%
Financial collectionefficiency increased to 50%
Outsource billing andcollection
Collection period reducedto less than 15 days
Billing efficiency increasedto 75%
Financial collectionefficiency increased to 75%
Collection periodmaintained at less than 15days
Billing efficiency increasedto 90% and above
Financial collectionefficiency increased to 90%and above
A functional Biometrictracking system in all citiesand towns
All mega cities have aninstalled and functionalbiometric tracking systemfor staff,equipment/vehicles
At least 50% ofintermediate cities have aninstalled and functionalbiometric tracking systemfor staff,equipment/vehicles
At least 75% ofintermediate cities have aninstalled and functionalbiometric tracking systemfor staff,equipment/vehicles
At least 60% of towns havean installed and functionalbiometric tracking systemfor staff,equipment/vehicles
At least 90% of towns havean installed and functionalbiometric tracking systemfor staff,equipment/vehicles

224
At least 30% of towns havean installed and functionalbiometric tracking systemfor staff,equipment/vehicles
Human ResourceDevelopment for the sub-sectors
Conduct a human resourcecapacity, infrastructure andtraining capacity, andtraining needs assessmentin the sub-sectors anddevelop a human resourcedevelopment plan
Strengthen infrastructureand training capacities atLocal Government TrainingInstitutes
Technical training /workshops conducted fortown level LocalGovernment staff
Conduct 238 technicaltraining / workshops peryear for Local Governmenton SWM, DRR, RecordKeeping, Management andCommunity Mobilisation –2 training workshops pertown per year
Conduct 238 technicaltraining / workshops peryear for Local Governmenton SWM, DRR, RecordKeeping, Management andCommunity Mobilisation –2 training workshops pertown per year
Conduct 238 technicaltraining / workshops peryear for Local Governmenton SWM, DRR, RecordKeeping, Management andCommunity Mobilisation –2 training workshops pertown per year
Capacities developed ofCBOs and civil society insolid waste management(LG&HTPD)
Conduct 238 capacitydevelopment workshopsper year of CBOs and civilsociety in solid wastemanagement (LG&HTPD)(2 workshops per town peryear)
Conduct 238 capacitydevelopment workshopsper year of CBOs and civilsociety in solid wastemanagement (LG&HTPD)(2 workshops per town peryear)
Conduct 238 capacitydevelopment workshopsper year of CBOs and civilsociety in solid wastemanagement (LG&HTPD)(2 workshops per town peryear)
Technical training /workshops conducted fordistrict PHED staff
Conduct 145 technicaltraining / workshops peryear for district PHED staffon O&M, DRR, Record – 5training workshops perdistrict per year
Conduct 145 technicaltraining / workshops peryear for district PHED staffon O&M, DRR, Record – 5training workshops perdistrict per year
Conduct 145 technicaltraining / workshops peryear for district PHED staffon O&M, DRR, Record – 5training workshops perdistrict per year
Capacities developed ofCBOs and civil society inO&M of water supplyschemes (PHE&RDD) (5workshops per district peryear)
Conduct 145 capacitydevelopment workshopsper year of CBOs and civilsociety in O&M of watersupply and drainageschemes (PHE&RDD) (5workshops per district peryear)
Conduct 145 capacitydevelopment workshopsper year of CBOs and civilsociety in O&M of watersupply and drainageschemes (PHE&RDD) (5workshops per district peryear)
Conduct 145 capacitydevelopment workshopsper year of CBOs and civilsociety in O&M of watersupply and drainageschemes (PHE&RDD) (5workshops per district peryear)

225
SECTOR FINANCING
Sectoral Expenditure Review
The Government of Sindh has had vacillating investments in water supply and sanitation in the lastfive financial year periods. There was a spike in sectoral spend in 2011-12 following the 2010floods. Figure 74 illustrates the sectoral investment trends from PKR 4.6 billion in 2010-11 to PKR7.5 billion in 2014-15. Pro-poor sectoral current expenditure has also increased over three-foldduring this period from PKR 921 million to 2.1 billion, a significant proportion of which is due tosalaries and utilities.
Overall, the increase in pro-poor sectoral development expenditure has been modest from PKR3.6 billion in 2010-11 to PKR 5.3 in 2014-15.
Figure 74 - Current, Development and Total Pro-Poor Expenditure in Water and Sanitation
(Source: PRSP Annual Progress Reports, Ministry of Finance, Government of Pakistan – 2010-11, 2011-12, 2012-13, 2013-14 and2014-15)

226
Sectoral Development Expenditure Trends
The overall pro-poor sectoral expenditure in water supply and sanitation averages around 1.9% oftotal pro-poor expenditure between 2010-11 to 2014-15 (Fig 75). Current expenditure during thisperiod averages at about 0.7% of total pro-poor current expenditure, while developmentexpenditure averages at 4.4% total pro-poor development expenditure. There has been a gradualbut definite reduction in development expenditure in proportion to overall total pro-poorexpenditure from 6.5% in 2010-11 to 3.7% in 2014-15.
Figure 75 - Sectoral expenditure as percentage of total pro-poor expenditure
(Source: PRSP Annual Progress Reports, Ministry of Finance, Government of Pakistan – 2010-11, 2011-12, 2012-13, 2013-14 and2014-15)
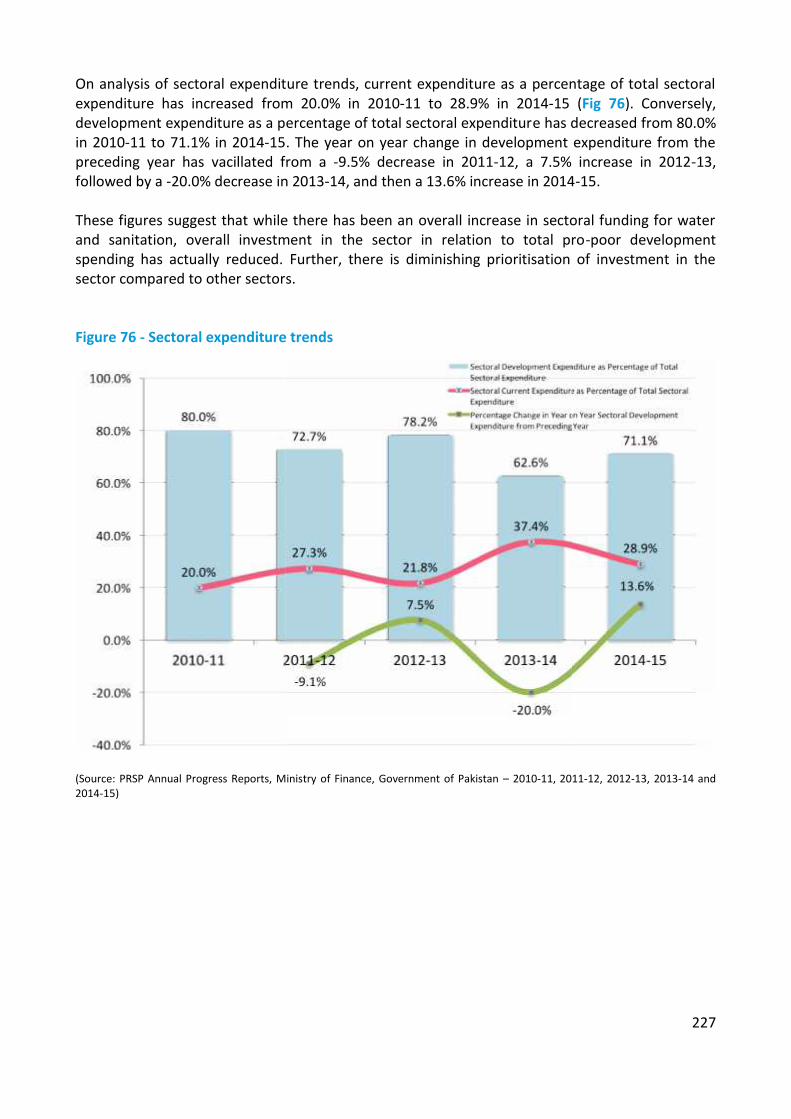
227
On analysis of sectoral expenditure trends, current expenditure as a percentage of total sectoralexpenditure has increased from 20.0% in 2010-11 to 28.9% in 2014-15 (Fig 76). Conversely,development expenditure as a percentage of total sectoral expenditure has decreased from 80.0%in 2010-11 to 71.1% in 2014-15. The year on year change in development expenditure from thepreceding year has vacillated from a -9.5% decrease in 2011-12, a 7.5% increase in 2012-13,followed by a -20.0% decrease in 2013-14, and then a 13.6% increase in 2014-15.
These figures suggest that while there has been an overall increase in sectoral funding for waterand sanitation, overall investment in the sector in relation to total pro-poor developmentspending has actually reduced. Further, there is diminishing prioritisation of investment in thesector compared to other sectors.
Figure 76 - Sectoral expenditure trends
(Source: PRSP Annual Progress Reports, Ministry of Finance, Government of Pakistan – 2010-11, 2011-12, 2012-13, 2013-14 and2014-15)
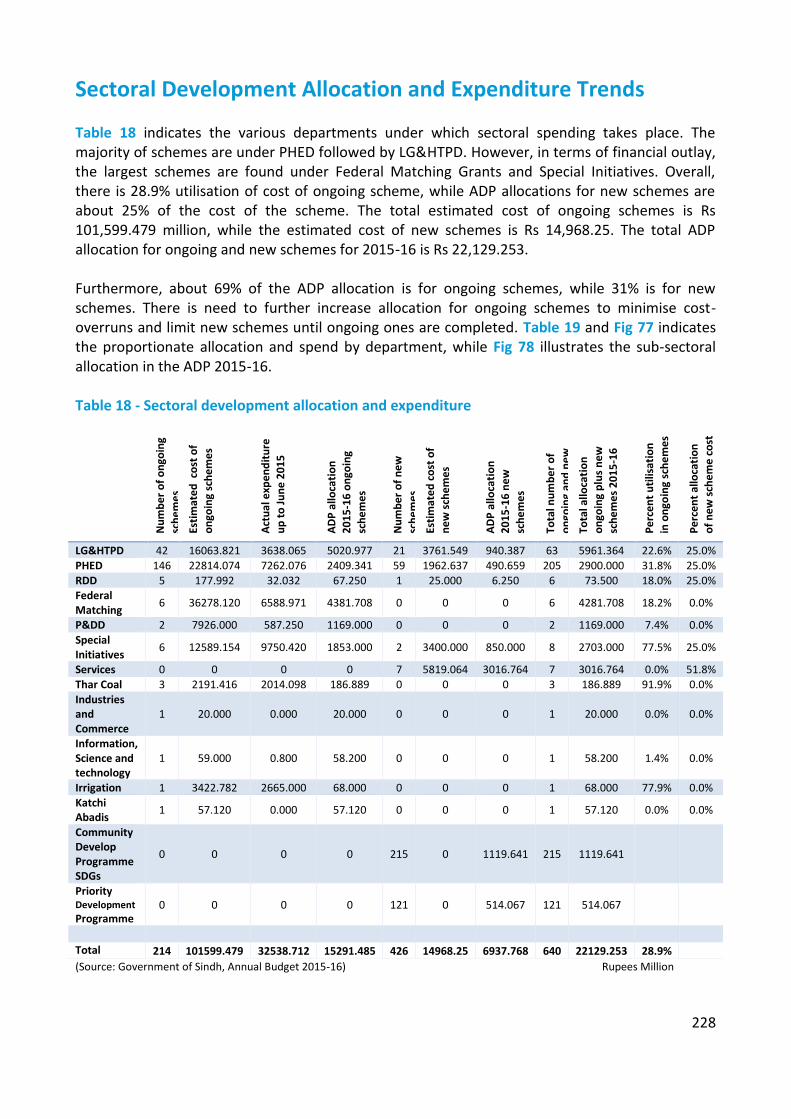
228
Sectoral Development Allocation and Expenditure Trends
Table 18 indicates the various departments under which sectoral spending takes place. Themajority of schemes are under PHED followed by LG&HTPD. However, in terms of financial outlay,the largest schemes are found under Federal Matching Grants and Special Initiatives. Overall,there is 28.9% utilisation of cost of ongoing scheme, while ADP allocations for new schemes areabout 25% of the cost of the scheme. The total estimated cost of ongoing schemes is Rs101,599.479 million, while the estimated cost of new schemes is Rs 14,968.25. The total ADPallocation for ongoing and new schemes for 2015-16 is Rs 22,129.253.
Furthermore, about 69% of the ADP allocation is for ongoing schemes, while 31% is for newschemes. There is need to further increase allocation for ongoing schemes to minimise cost-overruns and limit new schemes until ongoing ones are completed. Table 19 and Fig 77 indicatesthe proportionate allocation and spend by department, while Fig 78 illustrates the sub-sectoralallocation in the ADP 2015-16.
Table 18 - Sectoral development allocation and expenditure
Num
ber o
f ong
oing
sche
mes
Estim
ated
cost
of
ongo
ing
sche
mes
Actu
al e
xpen
ditu
reup
to Ju
ne 2
015
ADP
allo
catio
n20
15-1
6 on
goin
gsc
hem
es
Num
ber o
f new
sche
mes
Estim
ated
cost
of
new
sche
mes
ADP
allo
catio
n20
15-1
6 ne
wsc
hem
es
Tota
l num
ber o
fon
goin
gan
d ne
wsc
hem
es20
15-1
6To
tala
lloca
tion
ongo
ing
plus
new
sche
mes
201
5-16
Perc
ent u
tilis
atio
nin
ong
oing
sche
mes
Perc
ent a
lloca
tion
of n
ew sc
hem
e co
st
LG&HTPD 42 16063.821 3638.065 5020.977 21 3761.549 940.387 63 5961.364 22.6% 25.0%PHED 146 22814.074 7262.076 2409.341 59 1962.637 490.659 205 2900.000 31.8% 25.0%RDD 5 177.992 32.032 67.250 1 25.000 6.250 6 73.500 18.0% 25.0%FederalMatching 6 36278.120 6588.971 4381.708 0 0 0 6 4281.708 18.2% 0.0%
P&DD 2 7926.000 587.250 1169.000 0 0 0 2 1169.000 7.4% 0.0%SpecialInitiatives 6 12589.154 9750.420 1853.000 2 3400.000 850.000 8 2703.000 77.5% 25.0%
Services 0 0 0 0 7 5819.064 3016.764 7 3016.764 0.0% 51.8%Thar Coal 3 2191.416 2014.098 186.889 0 0 0 3 186.889 91.9% 0.0%IndustriesandCommerce
1 20.000 0.000 20.000 0 0 0 1 20.000 0.0% 0.0%
Information,Science andtechnology
1 59.000 0.800 58.200 0 0 0 1 58.200 1.4% 0.0%
Irrigation 1 3422.782 2665.000 68.000 0 0 0 1 68.000 77.9% 0.0%KatchiAbadis 1 57.120 0.000 57.120 0 0 0 1 57.120 0.0% 0.0%
CommunityDevelopProgrammeSDGs
0 0 0 0 215 0 1119.641 215 1119.641
PriorityDevelopmentProgramme
0 0 0 0 121 0 514.067 121 514.067
Total 214 101599.479 32538.712 15291.485 426 14968.25 6937.768 640 22129.253 28.9%(Source: Government of Sindh, Annual Budget 2015-16) Rupees Million
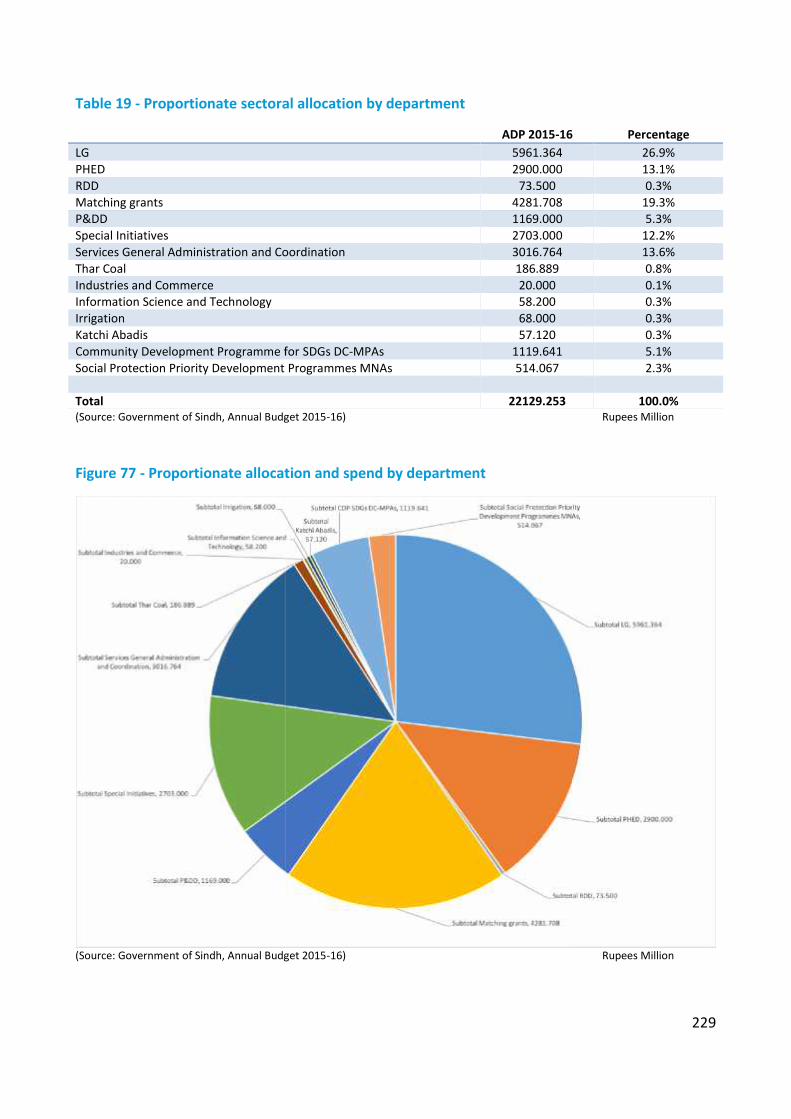
229
Table 19 - Proportionate sectoral allocation by department
ADP 2015-16 PercentageLG 5961.364 26.9%PHED 2900.000 13.1%RDD 73.500 0.3%Matching grants 4281.708 19.3%P&DD 1169.000 5.3%Special Initiatives 2703.000 12.2%Services General Administration and Coordination 3016.764 13.6%Thar Coal 186.889 0.8%Industries and Commerce 20.000 0.1%Information Science and Technology 58.200 0.3%Irrigation 68.000 0.3%Katchi Abadis 57.120 0.3%Community Development Programme for SDGs DC-MPAs 1119.641 5.1%Social Protection Priority Development Programmes MNAs 514.067 2.3%
Total 22129.253 100.0%(Source: Government of Sindh, Annual Budget 2015-16) Rupees Million
Figure 77 - Proportionate allocation and spend by department
(Source: Government of Sindh, Annual Budget 2015-16) Rupees Million

230
Figure 78 - Sub-sector allocation and percentage of sectoral allocation
(Source: Government of Sindh, Annual Budget 2015-16) Rupees Million
230
Figure 78 - Sub-sector allocation and percentage of sectoral allocation
(Source: Government of Sindh, Annual Budget 2015-16) Rupees Million
230
Figure 78 - Sub-sector allocation and percentage of sectoral allocation
(Source: Government of Sindh, Annual Budget 2015-16) Rupees Million

231
Estimating Cost for Sectoral Investment
Medium Term Budgetary Framework
Medium Implementation of Medium Term Budgetary Framework (MTBF) is at the heart of PublicFinancial Management Reform initiatives in Balochistan. One of the aims of MTBF is to establish alink between outcomes, outputs and costs. Contrary to annual budgeting, MTBF is a multi-yearapproach to budgeting which links the spending plans of the government to its policy objectivesset out in a fiscal framework. Multi- year horizon provides the line departments the requisitespace and flexibility to formulate, plan and implement the policies focusing solely on servicedelivery and outputs. Given the fact that public policy decisions normally take more than one yearfor their implementation, it is important to keep the multi-year horizon in determining theresource allocation amongst the different functions of the Government.
The aim of this sector development plan is to align with MTBF processes and:
ensure systematic use of rolling multi-year perspective to formulate annual budgets link resources with Medium Term Fiscal Framework and fiscal/policy indicators facilitate strategic prioritisation of expenditures which synchronise with the departmental
priorities
Sustainable Development Goals
The Sustainable Development Goal (SDG) for water and sanitation (Goal 6) is “Ensure availabilityand sustainable management of water and sanitation for all”. This shall serve as the overarchingguide for setting targets for the Balochistan WASH sector development plan.
The SDG targets are as follows:
6.1 by 2030, achieve universal and equitable access to safe and affordable drinking water forall
6.2 by 2030, achieve access to adequate and equitable sanitation and hygiene for all, and endopen defecation, paying special attention to the needs of women and girls and those invulnerable situations
6.3 by 2030, improve water quality by reducing pollution, eliminating dumping and minimizingrelease of hazardous chemicals and materials, halving the proportion of untreatedwastewater, and increasing recycling and safe reuse by x% globally
6.4 by 2030, substantially increase water-use efficiency across all sectors and ensuresustainable withdrawals and supply of freshwater to address water scarcity, and substantiallyreduce the number of people suffering from water scarcity
6.5 by 2030 implement integrated water resources management at all levels, includingthrough transboundary cooperation as appropriate
232
6.6 by 2020 protect and restore water-related ecosystems, including mountains, forests,wetlands, rivers, aquifers and lakes
6.a by 2030, expand international cooperation and capacity-building support to developingcountries in water and sanitation related activities and programmes, including waterharvesting, desalination, water efficiency, wastewater treatment, recycling and reusetechnologies
6.b support and strengthen the participation of local communities for improving water andsanitation management
Developing a Costing Framework
The policy targets for drinking water supply and sanitation are aligned with the proposed SDGtargets for drinking water and sanitation and are as follows:
provision of safely managed drinking water to the entire population by 2026 entire population has universal access to sustainable and safely managed sanitation by 2026
For the purposes of estimating sectoral investment, the following assumptions have been used
Align with Sustainable Development Goal 6 of achieving 100% population coverage Use a target of 100% coverage for drinking water supply – with improved water supply source Use a target of 100% for sanitation system Population projections used for 2026 Status of access to water supply is obtained from PSLM 2014-15161
Status of sewerage system is derived from PSLM 2014-15162
Unit rates for water supply schemes are obtained from PHE&RDD Unit rates for sewerage and drainage schemes are obtained from LG&HTPD and PHE&RDD Latrine construction is presumed to be the responsibility of the citizens, and therefore
sanitation costs refer to sewerage and drainage.
Table 20 presents a detailed sub-sector financial analysis of the ADP 2015-16. It indicates that52.3% of the ADP allocation is for drinking water supply, 34.1% for sanitation and 13.6% for solidwaste management.
Table 21 presents costing for safely managed overall drinking water supply by district with unitcosting per UC (excluding indirect costs), per household and per capita at current rates and at 8%inflation. Improved water here includes piped, hand pump and motorised pump.
Table 22 presents costing for safely managed urban drinking water supply by district at currentrates and at 8% inflation. Improved water here includes piped, hand pump and motorised pump.
161 Pakistan Social and Living Standards Measurement Survey 2014-15. Pakistan Bureau of Statistics162 Pakistan Social and Living Standards Measurement Survey 2014-15. Pakistan Bureau of Statistics

233
Table 23 presents costing for safely managed rural drinking water supply by district at currentrates and at 8% inflation. Improved water here includes piped, hand pump and motorised pump.
Table 24 presents costing for safely managed overall sewerage and drainage by district with unitcosting per UC (excluding indirect costs), per household and per capita at current rates and at 8%inflation. Improved sanitation (sewerage and drainage) here includes flush to sewer and flush toseptic tank. It does not include flush to open sewer.
Table 25 presents costing for safely managed urban sewerage and drainage by district at currentrates and at 8% inflation. Improved sanitation (sewerage and drainage) here includes flush tosewer and flush to septic tank. It does not include flush to open sewer.
Table 26 presents costing for safely managed rural sewerage and drainage by district at currentrates and at 8% inflation. Improved sanitation (sewerage and drainage) here includes flush tosewer and flush to septic tank. It does not include flush to open sewer.
Table 27 presents costing for improved overall drinking water supply by district with unit costingper UC (excluding indirect costs), per household and per capita at current rates and at 8%inflation. Improved water here includes piped, hand pump and motorised pump.
Table 28 presents costing for improved urban drinking water supply by district at current rates andat 8% inflation. Improved water here includes piped, hand pump and motorised pump.
Table 29 presents costing for improved rural drinking water supply by district at current rates andat 8% inflation. Improved water here includes piped, hand pump and motorised pump.
Table 30 presents costing for improved overall sewerage and drainage by district with unit costingper UC (excluding indirect costs), per household and per capita at current rates and at 8%inflation. Improved sanitation (sewerage and drainage) here includes flush to sewer and flush toseptic tank. It does not include flush to open sewer.
Table 31 presents costing for improved urban sewerage and drainage by district at current ratesand at 8% inflation. Improved sanitation (sewerage and drainage) here includes flush to sewer andflush to septic tank. It does not include flush to open sewer.
Table 32 presents costing for improved rural sewerage and drainage by district at current ratesand at 8% inflation. Improved sanitation (sewerage and drainage) here includes flush to sewer andflush to septic tank. It does not include flush to open sewer.
Tables 33-36 present costing of missing facilities (drinking water and latrines) in public sectorprimary and middle/secondary schools.
Table 37 presents the costing requirement for water and sanitation at Basic Health Units.
Tables 38-49 present the indirect costs for the sector, while Tables 50 and 51 present notionalcosts per district for safely managed and improved water supply and sanitation optionsrespectively. However, Tables 50 and 51 should not be taken as ‘all encompassing’ as severalactivities which have been costed at provincial level would need to be further costed at district
234
level at the time of operationalization. It does however, provide a useful guideline for programmeplanning.
Table 52 presents a summary of indirect costs.
Table 53 presents the investment overview for the sector development plan at current rates andat 8% inflation for the safely managed water supply and sanitation option, while Table 54 presentsthe investment overview for the sector development plan at current rates and 8% inflation for theimproved water supply and sanitation option.
Figure 79 illustrates the additional investment required over and above current investment trendsboth at current rates and at 8% inflation for the safely managed water supply and sanitationoption, while Fig 80 illustrates the sub-sector investment requirements for the safely managedwater supply and sanitation option. Figure 81 illustrates the additional investment required overand above current investment trends both at current rates and at 8% inflation for the improvedwater supply and sanitation option, while Fig 82 illustrates the sub-sector investmentrequirements for the improved water supply and sanitation option.
The investment plan proposes an additional PKR 214 billion in the short term, PKR 343 billion inthe medium term, and PKR 587 billion in the long term, over current investment trends under thesafely managed water supply and sanitation option; while an additional PKR 24 billion would berequired in the short term, PKR 58 billion in the medium term, and PKR 111 billion in the longterm, over current investment trends under the improved water supply and sanitation option.

Table 20 – Detailed sub-sectoral financial analysis of sectoral financing in ADP 2015-16
Numberofongoingschemes
EstimatedCost ongoingschemes
ActualExpenditureup to June2015
ADPallocation2015-16ongoingschemes
Numberof newschemes
Estimatedcost newschemes
ADPallocation2015-16newschemes
Totalnumberofongoingplus newschemes2015-16
Totalallocationongong plusnewschemes2015-16
Percentutilisationongoing
Percentallocationof newschemecost
Local Government
LG Water Supply Water Supply 15 11143.815 1077.164 3343.336 5 1077.913 269.479 20 3612.815 9.7% 25.0%LG Sanitation Drainage 27 4920.006 2560.901 1677.641 16 2683.636 670.908 43 2348.549 52.1% 25.0%Subtotal LG 42 16063.821 3638.065 5020.977 21 3761.549 940.387 63 5961.364 22.6% 25.0%
PHED
PHED WaterSupply Water Supply 66 9286.084 3715.124 963.652 27 1154.694 288.673 93 1252.325 40.0% 25.0%
PHED Drainage Drainage 73 8884.863 3306.966 1029.931 32 807.943 201.986 105 1231.917 37.2% 25.0%Rehab non-functional schemes Water Supply 4590.000 202.617 400.000 0 0 0 0 400.000 4.4% 0.0%
Additionalschemes from2014-15
Water Supply 7 53.127 37.369 15.758 0 0 0 7 15.758 70.3% 0.0%
Subtotal PHED 146 22814.074 7262.076 2409.341 59 1962.637 490.659 205 2900.000 31.8% 25.0%
RDD
RDD Water Supply Water Supply 4 162.992 32.032 63.500 0 0.000 0.000 4 63.500 19.7% 0.0%RDD Drainage Drainage 1 15.000 0.000 3.750 1 25.000 6.250 2 10.000 0.0% 25.0%Subtotal RDD 5 177.992 32.032 67.250 1 25.000 6.250 6 73.500 18.0% 25.0%
Matching Grants

236
S-III GoS Drainage 1 3991.000 1970.000 1000.000 1 1000.000 49.4%S-III GoP ECNEC Drainage 3991.000 829.000 100.000 0 100.000 0.0%STPs HyderabadPackage GoPECNEC
Drainage 1 915.300 496.150 124.955 1 124.955 54.2%
K-IV GoS Water supply 1 12775.500 0.000 2500.000 1 2500.000 0.0%K-IV GoP ECNEC Water supply 12755.000 2080.000 500.000 0 500.000 16.3%Water filtrationplant HyderabadPackage GoPCDWP
Water supply 1 935.000 665.044 100.000 1 100.000 71.1%
Urban watersupply BenazirabadGoP ECNEC
Water supply 1 783.500 463.710 10.000 1 10.000 59.2%
Water supply anddrainage TandoJam HyderabadPackage GoPCDWP
Water supply 1 131.820 85.067 46.753 1 46.753 64.5%
Subtotal Matchinggrants 6 36278.120 6588.971 4381.708 0 0 0 6 4381.708 18.2% 0.0%
P&DD
SCIP FPA3876.790 1 7000.000 525.000 969.000 1 969.000 7.5%
SMSDP FPA2250.000 1 926.000 62.250 200.000 1 200.000 6.7%
Subtotal P&DD 2 7926.000 587.250 1169.000 0 0 0 2 1169.000 7.4% 0.0%
Special Initiatives
Sindh DW hubsphase II for 750units
Water supply 1 4000.000 3841.650 158.350 1 158.350 96.0% 0.0%

237
Sindh solar powergeneration waterfiltration plantsPhase I and II
Water supply 1 2135.000 1560.000 575.000 1 575.000 73.1% 0.0%
CDWA O&M Water supply 1 971.540 276.487 12.000 1 12.000 28.5% 0.0%PPIU CDWA Water supply 1 36.614 22.283 8.331 1 8.331 60.9% 0.0%Tharparkar DWhubs Phase III 750units
Water supply 1 5254.000 4040.000 1000.000 1 1000.000 76.9% 0.0%
New drainagesystem Thatta City Drainage 1 192.000 10.000 99.319 1 99.319 5.2% 0.0%
Sindh DW hubsPhase IV 500 units Water supply 1 3000.000 750.000 1 750.000 25.0%
PMU DW hubs Water supply 1 400.000 100.000 1 100.000 25.0%Subtotal SpecialInitiatives 6 12589.154 9750.420 1853.000 2 3400.000 850.000 8 2703.000 77.5% 25.0%
Services GeneralAdministrationand Coordination
Karachi Solid waste 3 3940.000 2327.500 3 2327.500 59.1%ShaheedBenazirabad Solid waste 2 692.664 392.664 2 392.664 56.7%
Larkana Solid waste 2 1186.400 296.600 2 296.600 25.0%Subtotal ServicesGeneralAdministrationand Coordination
0 0 0 7 5819.064 3016.764 7 3016.764 0.0% 51.8%
Energy - Thar Coal
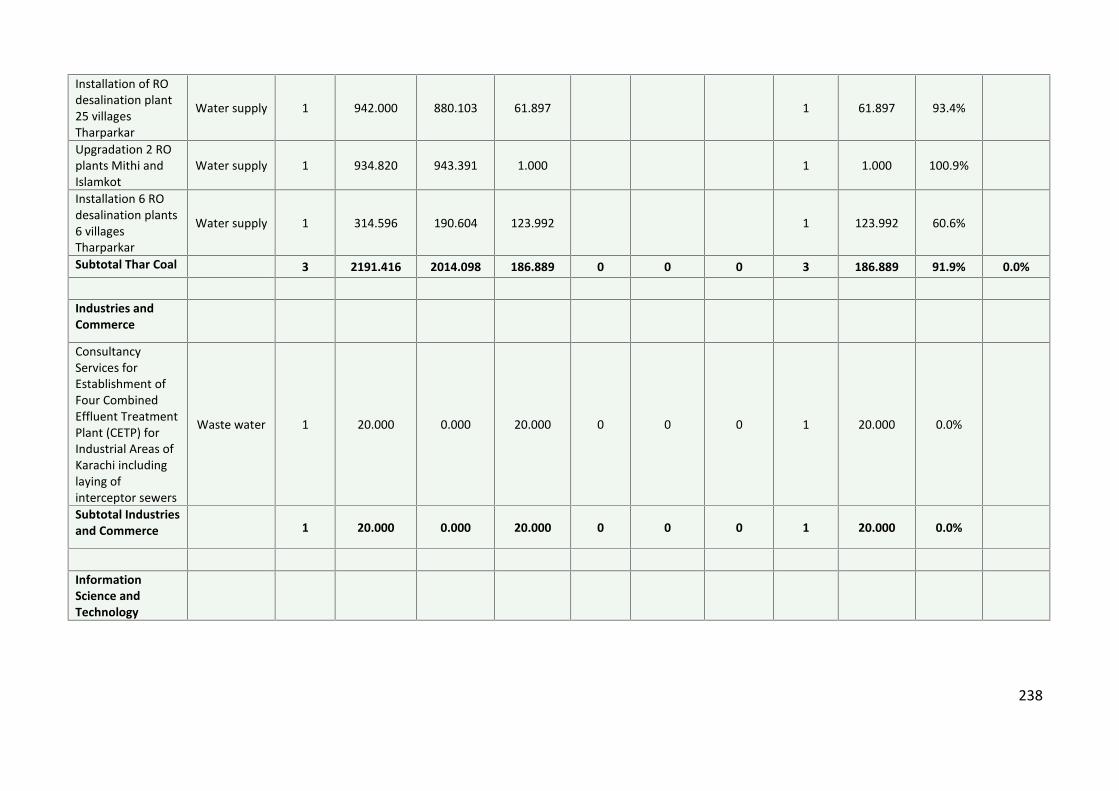
238
Installation of ROdesalination plant25 villagesTharparkar
Water supply 1 942.000 880.103 61.897 1 61.897 93.4%
Upgradation 2 ROplants Mithi andIslamkot
Water supply 1 934.820 943.391 1.000 1 1.000 100.9%
Installation 6 ROdesalination plants6 villagesTharparkar
Water supply 1 314.596 190.604 123.992 1 123.992 60.6%
Subtotal Thar Coal 3 2191.416 2014.098 186.889 0 0 0 3 186.889 91.9% 0.0%
Industries andCommerce
ConsultancyServices forEstablishment ofFour CombinedEffluent TreatmentPlant (CETP) forIndustrial Areas ofKarachi includinglaying ofinterceptor sewers
Waste water 1 20.000 0.000 20.000 0 0 0 1 20.000 0.0%
Subtotal Industriesand Commerce 1 20.000 0.000 20.000 0 0 0 1 20.000 0.0%
InformationScience andTechnology

239
Barani area wateravailability studypilot water supplyproject Malir
Water supply 1 59.000 0.800 58.200 1 58.200 1.4%
SubtotalInformationScience andTechnology
1 59.000 0.800 58.200 1 58.200 1.4%
Irrigation
Water supplyKarachi upgradingKinjhar Lakesystem
Water supply 1 3422.782 2665.000 68.000 0 0 0 1 68.000 77.9%
Subtotal Irrigation 1 3422.782 2665.000 68.000 0 0 0 1 68.000 77.9% 0.0%
Katchi Abadis
Water supply,sewerage anddrainage indifferent KatchiAbadies in SBA,Khairpur, Larkana,Sukkur,Hyderababd,Mirpurkhas, Thatta& Karachi
1 57.120 0.000 57.120 1 57.120 0.0%
Subtotal KatchiAbadis 1 57.120 0.000 57.120 1 57.120 0.0% 0.0%
CommunityDevelopmentProgramme for

240
SDGs
CDP SDGs DC-MPAs Watersupply
Water Supply 30 177.444 30 177.444
CDP SDGs DC-MPAs Drainage Drainage 185 942.197 185 942.197
Subtotal CDP SDGsDC-MPAs 215 1119.641 215 1119.641
Social ProtectionPriorityDevelopmentProgrammesSocial ProtectionPriorityDevelopmentProgrammes MNAs
Water supply 6 28.890 6 28.890
Social ProtectionPriorityDevelopmentProgrammes MNAs
Drainage 115 485.177 115 485.177
Subtotal SocialProtection PriorityDevelopmentProgrammesMNAs
121 514.067 121 514.067
214 101599.479 32538.712 15291.485 426 14968.250 6937.768 640.000 22229.253

241
Table 21 - Detailed costing for safely managed overall drinking water supply by district
District % pipedwatersupplyonpremises
Numberof HH1998
No UCs Total est pop allUCs 2026
Total est No ofHH all UCs 2026
Mean pop per UC2026
Mean No of HHper UC 2026
Population withaccess to PipedWater SupplyPSLM 2014-15
Accesspopulation gap tomeet by 2026
a A B C D E F G H[C/A] [C/B] [D/B] [C*a] [C-G]
Badin 0.115 214,348 49 2,075,398 391,584 42,355 7,992 238,671 1,836,727
Sujawal 0.100 109,852 29 996,762 207,117 34,371 7,142 100,075 896,687
Thatta 0.229 110,612 34 1,102,581 208,696 32,429 6,138 252,712 849,869
Dadu 0.156 203,217 55 2,317,005 421,274 42,127 7,660 361,684 1,955,321
Hyderabad 0.603 425,512 116 2,623,925 437,321 22,620 3,770 1,581,964 1,041,961
Jamshoro 0.456 101,402 30 1,218,663 221,575 40,622 7,386 555,954 662,709
Matiari 0.047 74,362 25 902,260 150,377 36,090 6,015 42,587 859,673
Tando Allah Yar 0.046 99,120 30 819,938 136,656 27,331 4,555 37,553 782,385
Tando M Khan 0.058 91,733 31 772,086 128,681 24,906 4,151 44,858 727,228
Karachi Central 0.819 337,122 42 6,119,496 905,653 145,702 21,563 5,011,867 1,107,629
Karachi East 0.819 215,339 26 3,702,357 578,493 142,398 22,250 3,032,230 670,127
Karachi South 0.819 237,165 30 4,218,944 637,126 140,631 21,238 3,455,315 763,629
Karachi West 0.819 225,872 30 4,208,477 608,132 140,283 20,271 3,446,743 761,734
Korangi 0.819 213,437 28 4,122,657 573,384 147,238 20,478 3,376,456 746,201
Malir 0.819 116,573 25 2,054,672 313,165 82,187 12,527 1,682,776 371,896
Jacobabad 0.014 121,127 42 1,305,942 233,204 31,094 5,552 18,414 1,287,528
Kashmore 0.018 131,473 44 1,203,411 214,895 27,350 4,884 21,541 1,181,870
Larkana 0.009 166,450 43 2,383,207 403,933 55,423 9,394 20,496 2,362,711
Q Shahdadkot 0.093 162,483 43 2,196,695 372,321 51,086 8,659 203,634 1,993,061
Shikarpur 0.009 150,108 52 1,686,491 285,846 32,433 5,497 15,853 1,670,638
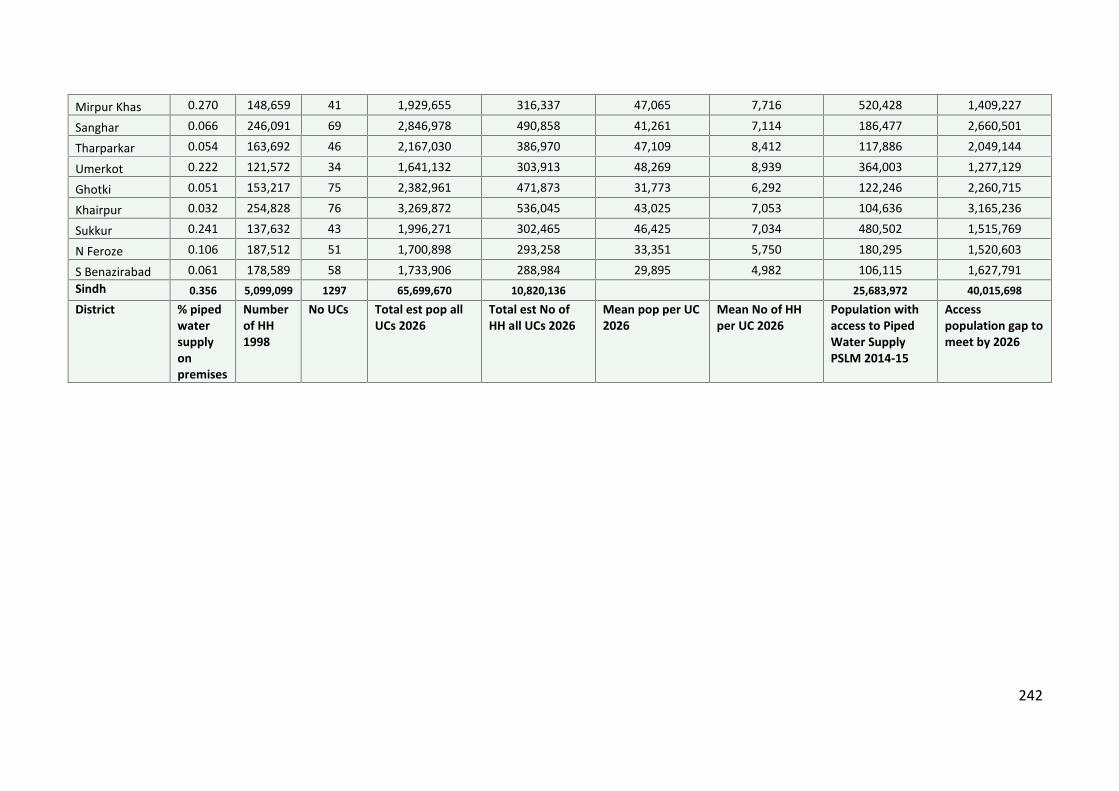
242
Mirpur Khas 0.270 148,659 41 1,929,655 316,337 47,065 7,716 520,428 1,409,227
Sanghar 0.066 246,091 69 2,846,978 490,858 41,261 7,114 186,477 2,660,501
Tharparkar 0.054 163,692 46 2,167,030 386,970 47,109 8,412 117,886 2,049,144
Umerkot 0.222 121,572 34 1,641,132 303,913 48,269 8,939 364,003 1,277,129
Ghotki 0.051 153,217 75 2,382,961 471,873 31,773 6,292 122,246 2,260,715
Khairpur 0.032 254,828 76 3,269,872 536,045 43,025 7,053 104,636 3,165,236
Sukkur 0.241 137,632 43 1,996,271 302,465 46,425 7,034 480,502 1,515,769
N Feroze 0.106 187,512 51 1,700,898 293,258 33,351 5,750 180,295 1,520,603
S Benazirabad 0.061 178,589 58 1,733,906 288,984 29,895 4,982 106,115 1,627,791Sindh 0.356 5,099,099 1297 65,699,670 10,820,136 25,683,972 40,015,698
District % pipedwatersupplyonpremises
Numberof HH1998
No UCs Total est pop allUCs 2026
Total est No ofHH all UCs 2026
Mean pop per UC2026
Mean No of HHper UC 2026
Population withaccess to PipedWater SupplyPSLM 2014-15
Accesspopulation gap tomeet by 2026

243
Table 21 continued
District Unit costof WSS per1000 popat presentrates
Total Cost tomeet gap atcurrent rates
Mean costper UC atcurrentrates
Mean costper HH atcurrent rates
Meancost percapita atcurrentrates
Mean AnnualCost to meetgap at currentrates
Total Cost tomeet gap with8% inflation
Mean costper UC at 8%inflation
Mean cost perHH at 8%inflation
Meancost percapita at8%inflation
Mean AnnualCost to meetgap at 8%inflation
I J K L M N O P Q R S
15,000,000 [(H/1000)*I] [J/B] [J/(H/A)] [J/H] [J/10] [J*1.08^10] [O/B] [O/(H/A)] [O/H] [O/10]
Badin 15,000,000 27,550,908,450 562,263,438 3,215,220,000 15,000 2,755,090,845 59,480,344,950 1,213,884,591 6,941,418,830 32,384 5,948,034,495
Sujawal 15,000,000 13,450,306,428 463,803,670 1,647,780,000 15,000 1,345,030,643 29,038,202,768 1,001,317,337 3,557,433,432 32,384 2,903,820,277
Thatta 15,000,000 12,748,041,522 374,942,398 1,659,180,000 15,000 1,274,804,152 27,522,065,508 809,472,515 3,582,045,177 32,384 2,752,206,551
Dadu 15,000,000 29,329,807,793 533,269,233 3,048,255,000 15,000 2,932,980,779 63,320,855,208 1,151,288,277 6,580,953,918 32,384 6,332,085,521
Hyderabad 15,000,000 15,629,409,263 134,736,287 6,382,680,000 15,000 1,562,940,926 33,742,722,349 290,885,537 13,779,727,402 32,384 3,374,272,235
Jamshoro 15,000,000 9,940,634,091 331,354,470 1,521,030,000 15,000 994,063,409 21,461,083,428 715,369,448 3,283,789,689 32,384 2,146,108,343
Matiari 15,000,000 12,895,099,920 515,803,997 1,115,430,000 15,000 1,289,509,992 27,839,553,560 1,113,582,142 2,408,129,710 32,384 2,783,955,356
Tando A Yar 15,000,000 11,735,772,594 391,192,420 1,486,800,000 15,000 1,173,577,259 25,336,652,815 844,555,094 3,209,889,686 32,384 2,533,665,282
Tando M Khan 15,000,000 10,908,417,051 351,884,421 1,375,995,000 15,000 1,090,841,705 23,550,454,252 759,692,073 2,970,670,002 32,384 2,355,045,425
Karachi Central 15,000,000 16,614,431,640 395,581,706 5,056,830,000 15,000 1,661,443,164 35,869,311,783 854,031,233 10,917,316,694 32,384 3,586,931,178
Karachi East 15,000,000 10,051,899,255 386,611,510 3,230,085,000 15,000 1,005,189,926 21,701,296,572 834,665,253 6,973,511,250 32,384 2,170,129,657
Karachi South 15,000,000 11,454,432,960 381,814,432 3,557,475,000 15,000 1,145,443,296 24,729,261,647 824,308,722 7,680,321,705 32,384 2,472,926,165
Karachi West 15,000,000 11,426,015,055 380,867,169 3,388,080,000 15,000 1,142,601,506 24,667,909,521 822,263,651 7,314,610,605 32,384 2,466,790,952
Korangi 15,000,000 11,193,013,755 399,750,491 3,201,555,000 15,000 1,119,301,376 24,164,877,190 863,031,328 6,911,917,120 32,384 2,416,487,719
Malir 15,000,000 5,578,434,480 223,137,379 1,748,595,000 15,000 557,843,448 12,043,421,645 481,736,866 3,775,085,456 32,384 1,204,342,164
Jacobabad 15,000,000 19,312,923,267 459,831,506 1,816,905,000 15,000 1,931,292,327 41,695,152,812 992,741,734 3,922,561,622 32,384 4,169,515,281
Kashmore 15,000,000 17,728,049,147 402,910,208 1,972,095,000 15,000 1,772,804,915 38,273,528,455 869,852,919 4,257,605,192 32,384 3,827,352,846
Larkana 15,000,000 35,440,671,297 824,201,658 2,496,750,000 15,000 3,544,067,130 76,513,751,183 1,779,389,562 5,390,295,987 32,384 7,651,375,118
Q Shahdadkot 15,000,000 29,895,920,603 695,253,968 2,437,245,000 15,000 2,989,592,060 64,543,050,305 1,501,001,170 5,261,829,155 32,384 6,454,305,031
Shikarpur 15,000,000 25,059,569,769 481,914,803 2,251,620,000 15,000 2,505,956,977 54,101,731,595 1,040,417,915 4,861,078,702 32,384 5,410,173,160
Mirpur Khas 15,000,000 21,138,405,698 515,570,871 2,229,885,000 15,000 2,113,840,570 45,636,232,463 1,113,078,841 4,814,154,468 32,384 4,563,623,246

244
Sanghar 15,000,000 39,907,514,115 578,369,770 3,691,365,000 15,000 3,990,751,412 86,157,329,802 1,248,656,954 7,969,380,173 32,384 8,615,732,980
Tharparkar 15,000,000 30,737,153,520 668,198,990 2,455,380,000 15,000 3,073,715,352 66,359,209,079 1,442,591,502 5,300,981,260 32,384 6,635,920,908
Umerkot 15,000,000 19,156,933,836 563,439,230 1,823,580,000 15,000 1,915,693,384 41,358,383,330 1,216,423,039 3,936,972,447 32,384 4,135,838,333
Ghotki 15,000,000 33,910,726,511 452,143,020 2,298,255,000 15,000 3,391,072,651 73,210,715,139 976,142,869 4,961,760,170 32,384 7,321,071,514
Khairpur 15,000,000 47,478,541,440 624,717,651 3,822,420,000 15,000 4,747,854,144 102,502,609,949 1,348,718,552 8,252,318,088 32,384 10,250,260,995
Sukkur 15,000,000 22,736,528,555 528,756,478 2,064,480,000 15,000 2,273,652,855 49,086,459,848 1,141,545,578 4,457,057,478 32,384 4,908,645,985
N Feroze 15,000,000 22,809,042,180 447,236,121 2,812,680,000 15,000 2,280,904,218 49,243,011,326 965,549,242 6,072,365,161 32,384 4,924,301,133
S Benazirabad 15,000,000 24,416,864,292 420,980,419 2,678,835,000 15,000 2,441,686,429 52,714,178,675 908,865,150 5,783,403,845 32,384 5,271,417,868
Sindh 15,000,000 600,235,468,484 465,190,956 2,637,465,000 15,000 60,023,546,848 1,295,863,357,159 1,004,312,382 5,694,089,118 32,384 129,586,335,716
District Unit costof WSS per1000 popat presentrates
Total Cost tomeet gap atcurrent rates
Mean costper UC atcurrentrates
Mean costper HH atcurrent rates
Meancost percapita atcurrentrates
Mean AnnualCost to meetgap at currentrates
Total Cost tomeet gap with8% inflation
Mean costper UC at 8%inflation
Mean cost perHH at 8%inflation
Meancost percapita at8%inflation
Mean AnnualCost to meetgap at 8%inflation

245
Table 22 - Detailed costing for safely managed urban drinking water supply by district
District % pipedwatersupplyurban(fraction)
Total estpop all UCs2026
% Urbanpopulation(fraction)
Total estpop urban
Access topipedWaterSupplyPSLM2014-15
Pop gap tomeetaccess by2026
Unit cost ofWSS per1000 popat presentrates
Total Cost tomeet gap atcurrent rates
Meancostpercapitaatcurrentrates
Mean AnnualCost to meetgap at currentrates
Total Cost tomeet gap with8% inflation
Meancost percapita at8%inflation
Mean AnnualCost to meetgap at 8%inflation
a A B C D E F G H I J K L
[A*B] [C*a] [C-D] 15,000,000 [(E/1000)*F] [G/E] [G/10] [G*1.08^10] [J/E] [J/10]
Badin 0.325 2,075,398 0.164 339,810 110,506 229,304 15,000,000 3,439,555,644 15,000 343,955,564 7,425,742,659 32,384 742,574,266
Sujawal 0.621 996,762 0.112 111,945 69,496 42,450 15,000,000 636,745,536 15,000 63,674,554 1,374,685,855 32,384 137,468,586
Thatta 0.710 1,102,581 0.112 123,830 87,919 35,911 15,000,000 538,659,855 15,000 53,865,986 1,162,926,226 32,384 116,292,623
Dadu 0.484 2,317,005 0.214 495,227 239,442 255,785 15,000,000 3,836,773,026 15,000 383,677,303 8,283,305,196 32,384 828,330,520
Hyderabad 0.707 2,623,925 0.508 1,332,831 941,645 391,186 15,000,000 5,867,786,305 15,000 586,778,631 12,668,110,533 32,384 1,266,811,053
Jamshoro 0.666 1,218,663 0.508 619,023 412,022 207,001 15,000,000 3,105,021,850 15,000 310,502,185 6,703,509,289 32,384 670,350,929
Matiari 0.141 902,260 0.508 458,306 64,529 393,776 15,000,000 5,906,643,218 15,000 590,664,322 12,751,999,694 32,384 1,275,199,969
Tando A Yar 0.139 819,938 0.508 416,490 57,892 358,598 15,000,000 5,378,967,644 15,000 537,896,764 11,612,787,707 32,384 1,161,278,771Tando M Khan 0.324 772,086 0.508 392,183 126,989 265,194 15,000,000 3,977,916,020 15,000 397,791,602 8,588,022,333 32,384 858,802,233
Karachi Central 0.835 6,119,496 1.000 6,119,496 5,109,167 1,010,329 15,000,000 15,154,931,844 15,000 1,515,493,184 32,718,361,190 32,384 3,271,836,119
Karachi East 0.835 3,702,357 1.000 3,702,357 3,091,098 611,259 15,000,000 9,168,887,111 15,000 916,888,711 19,794,939,580 32,384 1,979,493,958
Karachi South 0.835 4,218,944 1.000 4,218,944 3,522,396 696,548 15,000,000 10,448,214,816 15,000 1,044,821,482 22,556,912,143 32,384 2,255,691,214
Karachi West 0.835 4,208,477 0.907 3,817,089 3,186,887 630,201 15,000,000 9,453,020,014 15,000 945,302,001 20,408,361,209 32,384 2,040,836,121
Korangi 0.835 4,122,657 1.000 4,122,657 3,442,006 680,651 15,000,000 10,209,760,061 15,000 1,020,976,006 22,042,106,211 32,384 2,204,210,621
Malir 0.835 2,054,672 0.907 1,863,588 1,555,909 307,678 15,000,000 4,615,174,454 15,000 461,517,445 9,963,815,495 32,384 996,381,549
Jacobabad 0.033 1,305,942 0.243 317,785 10,487 307,298 15,000,000 4,609,476,145 15,000 460,947,614 9,951,513,273 32,384 995,151,327
Kashmore 0.058 1,203,411 0.243 292,836 16,984 275,851 15,000,000 4,137,767,537 15,000 413,776,754 8,933,129,769 32,384 893,312,977
Larkana 0.014 2,383,207 0.289 688,867 9,437 679,429 15,000,000 10,191,439,684 15,000 1,019,143,968 22,002,553,891 32,384 2,200,255,389Q Shahdadkot 0.249 2,196,695 0.289 634,955 157,850 477,106 15,000,000 7,156,582,660 15,000 715,658,266 15,450,525,199 32,384 1,545,052,520

246
Shikarpur 0.023 1,686,491 0.241 406,291 9,345 396,946 15,000,000 5,954,194,805 15,000 595,419,480 12,854,660,003 32,384 1,285,466,000
Mirpur Khas 0.793 1,929,655 0.331 638,959 506,822 132,137 15,000,000 1,982,049,606 15,000 198,204,961 4,279,096,440 32,384 427,909,644
Sanghar 0.149 2,846,978 0.228 648,555 96,894 551,660 15,000,000 8,274,907,125 15,000 827,490,712 17,864,903,841 32,384 1,786,490,384
Tharparkar 0.647 2,167,030 0.044 94,837 61,341 33,496 15,000,000 502,447,481 15,000 50,244,748 1,084,746,426 32,384 108,474,643
Umerkot 0.547 1,641,132 0.169 277,235 151,537 125,698 15,000,000 1,885,475,020 15,000 188,547,502 4,070,599,152 32,384 407,059,915
Ghotki 0.064 2,382,961 0.163 388,152 24,725 363,427 15,000,000 5,451,406,527 15,000 545,140,653 11,769,177,821 32,384 1,176,917,782
Khairpur 0.104 3,269,872 0.236 771,495 80,158 691,337 15,000,000 10,370,054,517 15,000 1,037,005,452 22,388,169,920 32,384 2,238,816,992
Sukkur 0.397 1,996,271 0.509 1,015,724 403,141 612,583 15,000,000 9,188,745,273 15,000 918,874,527 19,837,811,863 32,384 1,983,781,186
N Feroze 0.000 1,700,898 0.177 301,722 - 301,722 15,000,000 4,525,826,939 15,000 452,582,694 9,770,920,913 32,384 977,092,091
S Benazirabad 0.205 1,733,906 0.264 457,738 93,791 363,948 15,000,000 5,459,215,172 15,000 545,921,517 11,786,036,100 32,384 1,178,603,610
Sindh 0.635 65,699,670 0.427 35,068,927 23,640,417 11,428,510 15,000,000 171,427,645,888 15,000 17,142,764,589 370,099,429,931 32,384 37,009,942,993
District % pipedwatersupplyurban(fraction)
Total estpop all UCs2026
% Urbanpopulation(fraction)
Total estpop urban
Access topipedWaterSupplyPSLM2014-15
Pop gap tomeetaccess by2026
Unit cost ofWSS per1000 popat presentrates
Total Cost tomeet gap atcurrent rates
Meancostpercapitaatcurrentrates
Mean AnnualCost to meetgap at currentrates
Total Cost tomeet gap with8% inflation
Meancost percapita at8%inflation
Mean AnnualCost to meetgap at 8%inflation

247
Table 23 - Detailed costing for safely managed rural drinking water supply by district
District % pipedwatersupplyrural onpremises(fraction)
Total estpop all UCs2026
% Ruralpopulation(fraction)
Total estpop rural
Access topipedWaterSupplyPSLM2014-15
Pop gap tomeetaccess by2026
Unit cost ofWSS per1000 popat presentrates
Total Cost tomeet gap atcurrent rates
Meancost percapitaatcurrentrates
Mean AnnualCost to meetgap at currentrates
Total Cost tomeet gap with8% inflation
Meancost percapita at8%inflation
Mean AnnualCost to meetgap at 8%inflation
a A B C D E F G H I J K L
[A*B] [C*a] [C-D] 15,000,000 [(E/1000)*F] [G/E] [G/10] [G*1.08^10] [J/E] [J/10]
Badin 0.055 2,075,398 0.836 1,735,588 94,937 1,640,651 15,000,000 24,609,771,694 15,000 2,460,977,169 53,130,651,287 32,384 5,313,065,129
Sujawal 0.013 996,762 0.888 884,817 11,591 873,225 15,000,000 13,098,382,275 15,000 1,309,838,227 28,278,424,917 32,384 2,827,842,492
Thatta 0.158 1,102,581 0.888 978,751 154,447 824,304 15,000,000 12,364,563,256 15,000 1,236,456,326 26,694,164,693 32,384 2,669,416,469
Dadu 0.088 2,317,005 0.786 1,821,778 159,952 1,661,826 15,000,000 24,927,385,117 15,000 2,492,738,512 53,816,354,846 32,384 5,381,635,485
Hyderabad 0.106 2,623,925 0.492 1,291,094 136,727 1,154,368 15,000,000 17,315,513,799 15,000 1,731,551,380 37,382,895,581 32,384 3,738,289,558
Jamshoro 0.388 1,218,663 0.492 599,640 232,420 367,219 15,000,000 5,508,288,495 15,000 550,828,849 11,891,981,723 32,384 1,189,198,172
Matiari 0.015 902,260 0.492 443,954 6,793 437,162 15,000,000 6,557,427,726 15,000 655,742,773 14,156,994,635 32,384 1,415,699,463
Tando Allah Yar 0.019 819,938 0.492 403,448 7,666 395,783 15,000,000 5,936,738,124 15,000 593,673,812 12,816,972,338 32,384 1,281,697,234
Tando M Khan 0.005 772,086 0.492 379,903 1,975 377,927 15,000,000 5,668,906,901 15,000 566,890,690 12,238,744,815 32,384 1,223,874,481
Karachi Central 0.000 6,119,496 0.000 - - - 15,000,000 - #DIV/0! - - #DIV/0! -
Karachi East 0.000 3,702,357 0.000 - - - 15,000,000 - #DIV/0! - - #DIV/0! -
Karachi South 0.000 4,218,944 0.000 - - - 15,000,000 - #DIV/0! - - #DIV/0! -
Karachi West 0.575 4,208,477 0.093 391,388 225,048 166,340 15,000,000 2,495,100,801 15,000 249,510,080 5,386,735,491 32,384 538,673,549
Korangi 0.000 4,122,657 0.000 - - - 15,000,000 - #DIV/0! - - #DIV/0! -
Malir 0.575 2,054,672 0.093 191,084 109,874 81,211 15,000,000 1,218,163,662 15,000 121,816,366 2,629,923,981 32,384 262,992,398
Jacobabad 0.008 1,305,942 0.757 988,157 7,510 980,647 15,000,000 14,709,700,258 15,000 1,470,970,026 31,757,139,590 32,384 3,175,713,959
Kashmore 0.000 1,203,411 0.757 910,575 - 910,575 15,000,000 13,658,630,459 15,000 1,365,863,046 29,487,958,727 32,384 2,948,795,873
Larkana 0.005 2,383,207 0.711 1,694,340 7,794 1,686,546 15,000,000 25,298,193,717 15,000 2,529,819,372 54,616,902,801 32,384 5,461,690,280
Q Shahdadkot 0.047 2,196,695 0.711 1,561,740 72,933 1,488,806 15,000,000 22,332,094,971 15,000 2,233,209,497 48,213,318,074 32,384 4,821,331,807

248
Shikarpur 0.004 1,686,491 0.759 1,280,200 5,633 1,274,567 15,000,000 19,118,506,596 15,000 1,911,850,660 41,275,421,801 32,384 4,127,542,180
Mirpur Khas 0.057 1,929,655 0.669 1,290,696 73,441 1,217,256 15,000,000 18,258,836,491 15,000 1,825,883,649 39,419,458,522 32,384 3,941,945,852
Sanghar 0.038 2,846,978 0.772 2,198,423 84,419 2,114,004 15,000,000 31,710,060,271 15,000 3,171,006,027 68,459,641,784 32,384 6,845,964,178
Tharparkar 0.012 2,167,030 0.956 2,072,193 24,866 2,047,326 15,000,000 30,709,897,309 15,000 3,070,989,731 66,300,364,964 32,384 6,630,036,496
Umerkot 0.134 1,641,132 0.831 1,363,897 182,217 1,181,680 15,000,000 17,725,205,824 15,000 1,772,520,582 38,267,389,934 32,384 3,826,738,993
Ghotki 0.048 2,382,961 0.837 1,994,809 96,150 1,898,659 15,000,000 28,479,882,235 15,000 2,847,988,224 61,485,929,677 32,384 6,148,592,968
Khairpur 0.001 3,269,872 0.764 2,498,377 3,248 2,495,129 15,000,000 37,426,931,661 15,000 3,742,693,166 80,801,938,335 32,384 8,080,193,834
Sukkur 0.025 1,996,271 0.491 980,547 24,514 956,034 15,000,000 14,340,502,935 15,000 1,434,050,294 30,960,070,260 32,384 3,096,007,026N Feroze 0.134 1,700,898 0.823 1,399,176 186,790 1,212,386 15,000,000 18,185,792,712 15,000 1,818,579,271 39,261,762,481 32,384 3,926,176,248S Benazirabad 0.006 1,733,906 0.736 1,276,168 7,402 1,268,766 15,000,000 19,031,489,739 15,000 1,903,148,974 41,087,558,933 32,384 4,108,755,893
Sindh 0.073 65,699,670 0.573 30,630,743 1,918,346 28,712,398 15,000,000 430,685,967,028 15,000 43,068,596,703 929,818,700,192 32,384 92,981,870,019
District % pipedwatersupplyrural onpremises(fraction)
Total estpop all UCs2026
% Ruralpopulation(fraction)
Total estpop rural
Access topipedWaterSupplyPSLM2014-15
Pop gap tomeetaccess by2026
Unit cost ofWSS per1000 popat presentrates
Total Cost tomeet gap atcurrent rates
Meancost percapitaatcurrentrates
Mean AnnualCost to meetgap at currentrates
Total Cost tomeet gap with8% inflation
Meancost percapita at8%inflation
Mean AnnualCost to meetgap at 8%inflation

249
Table 24 - Detailed costing of safely managed overall sewerage and drainage system by district
District % popconnected tosewerage anddrainage*system (fraction)
HH size1998
No UCs Total est popall UCs 2026
Total est No ofHH all UCs2026
Mean pop perUC 2026
Mean No ofHH per UC2026
Access tosewerage anddrainage systemPSLM 2014-15
Access popgap to meet by2026
a A B C D E F G H[C/A] [C/B] [D/B] [C*a] [C-G]
Badin 0.058 214,348 49 2,075,398 391,584 42,355 7,992 119,335 1,956,063
Sujawal 0.013 109,852 29 996,762 207,117 34,371 7,142 12,759 984,003
Thatta 0.080 110,612 34 1,102,581 208,696 32,429 6,138 88,537 1,014,044
Dadu 0.010 203,217 55 2,317,005 421,274 42,127 7,660 22,012 2,294,993
Hyderabad 0.213 425,512 116 2,623,925 437,321 22,620 3,770 557,584 2,066,341
Jamshoro 0.072 101,402 30 1,218,663 221,575 40,622 7,386 88,231 1,130,432
Matiari 0.024 74,362 25 902,260 150,377 36,090 6,015 21,474 880,786
Tando Allah Yar 0.045 99,120 30 819,938 136,656 27,331 4,555 36,815 783,123
Tando M Khan 0.130 91,733 31 772,086 128,681 24,906 4,151 100,062 672,024
Karachi Central 0.967 337,122 42 6,119,496 905,653 145,702 21,563 5,918,777 200,719
Karachi East 0.967 215,339 26 3,702,357 578,493 142,398 22,250 3,580,920 121,437
Karachi South 0.967 237,165 30 4,218,944 637,126 140,631 21,238 4,080,563 138,381
Karachi West 0.967 225,872 30 4,208,477 608,132 140,283 20,271 4,070,439 138,038
Korangi 0.967 213,437 28 4,122,657 573,384 147,238 20,478 3,987,434 135,223
Malir 0.967 116,573 25 2,054,672 313,165 82,187 12,527 1,987,279 67,393
Jacobabad 0.063 121,127 42 1,305,942 233,204 31,094 5,552 82,405 1,223,537
Kashmore 0.172 131,473 44 1,203,411 214,895 27,350 4,884 206,626 996,785
Larkana 0.018 166,450 43 2,383,207 403,933 55,423 9,394 43,851 2,339,356
Q Shahdadkot 0.110 162,483 43 2,196,695 372,321 51,086 8,659 242,515 1,954,180
Shikarpur 0.028 150,108 52 1,686,491 285,846 32,433 5,497 47,222 1,639,269
Mirpur Khas 0.292 148,659 41 1,929,655 316,337 47,065 7,716 562,494 1,367,161

250
Sanghar 0.100 246,091 69 2,846,978 490,858 41,261 7,114 285,267 2,561,711
Tharparkar 0.016 163,692 46 2,167,030 386,970 47,109 8,412 34,672 2,132,358
Umerkot 0.051 121,572 34 1,641,132 303,913 48,269 8,939 83,205 1,557,927
Ghotki 0.160 153,217 75 2,382,961 471,873 31,773 6,292 380,797 2,002,164
Khairpur 0.090 254,828 76 3,269,872 536,045 43,025 7,053 294,942 2,974,930
Sukkur 0.112 137,632 43 1,996,271 302,465 46,425 7,034 222,784 1,773,487
N Feroze 0.010 187,512 51 1,700,898 293,258 33,351 5,750 16,669 1,684,229
S Benazirabad 0.074 178,589 58 1,733,906 288,984 29,895 4,982 128,136 1,605,770Sindh 0.367 5,099,099 1297 65,699,670 10,820,136 27,303,806 38,395,864District % pop
connected tosewerage anddrainage*system (fraction)
HH size1998
No UCs Total est popall UCs 2026
Total est No ofHH all UCs2026
Mean pop perUC 2026
Mean No ofHH per UC2026
Access tosewerage anddrainage systemPSLM 2014-15
Access popgap to meet by2026
*Sewerage and Drainage – includes flush to sewer and flush to septic tank (does not include flush to open drain)

251
Table 24 continued
District Unit costofsanitationschemeper 1000pop atpresentrates
Total Cost tomeet gap atcurrent rates
Meancost perUC atcurrentrates
Mean costper HH atcurrentrates
Meancost percapitaatcurrentrates
MeanAnnual Costto meet gapat currentrates
Total Cost tomeet gap with8% inflation
Mean costper UC at8%inflation
Mean costper HH at8% inflation
Meancost percapita at8%inflation
Mean AnnualCost to meetgap at 8%inflation
I J K L M N O P Q R S15,000,000 [(H/1000)*I] [J/B] [J/(H/A)] [J/H] [J/10] [J*1.08^10] [O/B] [O/(H/A)] [O/H] [O/10]
Badin 15,000,000 29,340,939,225 598,794,678 3,215,220,000 15,000 2,934,093,923 63,344,887,136 1,292,752,799 6,941,418,830 32,384 6,334,488,714
Sujawal 15,000,000 14,760,051,696 508,967,300 1,647,780,000 15,000 1,476,005,170 31,865,844,568 1,098,822,226 3,557,433,432 32,384 3,186,584,457
Thatta 15,000,000 15,210,656,186 447,372,241 1,659,180,000 15,000 1,521,065,619 32,838,665,864 965,843,114 3,582,045,177 32,384 3,283,866,586
Dadu 15,000,000 34,424,901,788 625,907,305 3,048,255,000 15,000 3,442,490,179 74,320,780,998 1,351,286,927 6,580,953,918 32,384 7,432,078,100
Hyderabad 15,000,000 30,995,114,063 267,199,259 6,382,680,000 15,000 3,099,511,406 66,916,126,543 576,863,160 13,779,727,402 32,384 6,691,612,654
Jamshoro 15,000,000 16,956,476,982 565,215,899 1,521,030,000 15,000 1,695,647,698 36,607,762,022 1,220,258,734 3,283,789,689 32,384 3,660,776,202
Matiari 15,000,000 13,211,793,180 528,471,727 1,115,430,000 15,000 1,321,179,318 28,523,270,555 1,140,930,822 2,408,129,710 32,384 2,852,327,056
Tando Allah Yar 15,000,000 11,746,841,757 391,561,392 1,486,800,000 15,000 1,174,684,176 25,360,550,308 845,351,677 3,209,889,686 32,384 2,536,055,031
Tando M Khan 15,000,000 10,080,354,816 325,172,736 1,375,995,000 15,000 1,008,035,482 21,762,729,994 702,023,548 2,970,670,002 32,384 2,176,272,999
Karachi Central 15,000,000 3,010,792,032 71,685,525 5,056,830,000 15,000 301,079,203 6,500,074,179 154,763,671 10,917,316,694 32,384 650,007,418
Karachi East 15,000,000 1,821,559,644 70,059,986 3,230,085,000 15,000 182,155,964 3,932,610,649 151,254,256 6,973,511,250 32,384 393,261,065
Karachi South 15,000,000 2,075,720,448 69,190,682 3,557,475,000 15,000 207,572,045 4,481,324,763 149,377,492 7,680,321,705 32,384 448,132,476
Karachi West 15,000,000 2,070,570,684 69,019,023 3,388,080,000 15,000 207,057,068 4,470,206,808 149,006,894 7,314,610,605 32,384 447,020,681
Korangi 15,000,000 2,028,347,244 72,440,973 3,201,555,000 15,000 202,834,724 4,379,049,568 156,394,627 6,911,917,120 32,384 437,904,957
Malir 15,000,000 1,010,898,624 40,435,945 1,748,595,000 15,000 101,089,862 2,182,454,309 87,298,172 3,775,085,456 32,384 218,245,431
Jacobabad 15,000,000 18,353,055,897 436,977,521 1,816,905,000 15,000 1,835,305,590 39,622,871,152 943,401,694 3,922,561,622 32,384 3,962,287,115
Kashmore 15,000,000 14,951,779,970 339,813,181 1,972,095,000 15,000 1,495,177,997 32,279,771,530 733,631,171 4,257,605,192 32,384 3,227,977,153
Larkana 15,000,000 35,090,339,868 816,054,416 2,496,750,000 15,000 3,509,033,987 75,757,411,904 1,761,800,277 5,390,295,987 32,384 7,575,741,190
Q Shahdadkot 15,000,000 29,312,698,080 681,690,653 2,437,245,000 15,000 2,931,269,808 63,283,916,622 1,471,718,991 5,261,829,155 32,384 6,328,391,662

252
Shikarpur 15,000,000 24,589,038,780 472,866,130 2,251,620,000 15,000 2,458,903,878 53,085,890,481 1,020,882,509 4,861,078,702 32,384 5,308,589,048
Mirpur Khas 15,000,000 20,507,408,513 500,180,695 2,229,885,000 15,000 2,050,740,851 44,273,956,867 1,079,852,607 4,814,154,468 32,384 4,427,395,687
Sanghar 15,000,000 38,425,662,066 556,893,653 3,691,365,000 15,000 3,842,566,207 82,958,122,371 1,202,291,629 7,969,380,173 32,384 8,295,812,237
Tharparkar 15,000,000 31,985,362,800 695,333,974 2,455,380,000 15,000 3,198,536,280 69,053,999,296 1,501,173,898 5,300,981,260 32,384 6,905,399,930
Umerkot 15,000,000 23,368,899,114 687,320,562 1,823,580,000 15,000 2,336,889,911 50,451,700,456 1,483,873,543 3,936,972,447 32,384 5,045,170,046
Ghotki 15,000,000 30,032,457,483 400,432,766 2,298,255,000 15,000 3,003,245,748 64,837,823,190 864,504,309 4,961,760,170 32,384 6,483,782,319
Khairpur 15,000,000 44,623,943,184 587,157,147 3,822,420,000 15,000 4,462,394,318 96,339,746,417 1,267,628,242 8,252,318,088 32,384 9,633,974,642
Sukkur 15,000,000 26,602,307,346 618,658,310 2,064,480,000 15,000 2,660,230,735 57,432,386,314 1,335,636,891 4,457,057,478 32,384 5,743,238,631
N Feroze 15,000,000 25,263,437,994 495,361,529 2,812,680,000 15,000 2,526,343,799 54,541,867,802 1,069,448,388 6,072,365,161 32,384 5,454,186,780
S Benazirabad 15,000,000 24,086,555,199 415,285,434 2,678,835,000 15,000 2,408,655,520 52,001,066,117 896,570,105 5,783,403,845 32,384 5,200,106,612
Sindh 15,000,000 575,937,964,661 426,052,436 2,637,465,000 15,000 57,593,796,466 1,243,406,868,784 919,815,254 5,694,089,118 32,384 124,340,686,878
District Unit costofsanitationschemeper 1000pop atpresentrates
Total Cost tomeet gap atcurrent rates
Meancost perUC atcurrentrates
Mean costper HH atcurrentrates
Meancost percapitaatcurrentrates
MeanAnnual Costto meet gapat currentrates
Total Cost tomeet gap with8% inflation
Mean costper UC at8%inflation
Mean costper HH at8% inflation
Meancost percapita at8%inflation
Mean AnnualCost to meetgap at 8%inflation
*Sewerage and Drainage – includes flush to sewer and flush to septic tank (does not include flush to open drain)
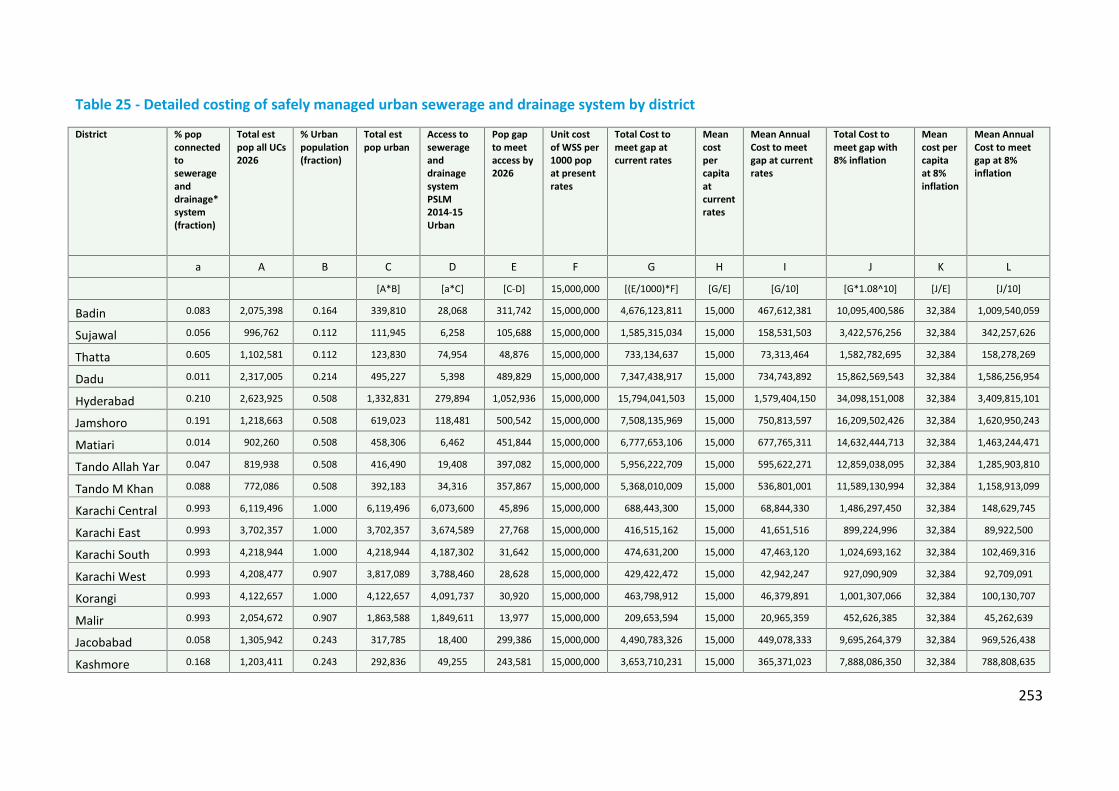
253
Table 25 - Detailed costing of safely managed urban sewerage and drainage system by district
District % popconnectedtosewerageanddrainage*system(fraction)
Total estpop all UCs2026
% Urbanpopulation(fraction)
Total estpop urban
Access tosewerageanddrainagesystemPSLM2014-15Urban
Pop gapto meetaccess by2026
Unit costof WSS per1000 popat presentrates
Total Cost tomeet gap atcurrent rates
Meancostpercapitaatcurrentrates
Mean AnnualCost to meetgap at currentrates
Total Cost tomeet gap with8% inflation
Meancost percapitaat 8%inflation
Mean AnnualCost to meetgap at 8%inflation
a A B C D E F G H I J K L
[A*B] [a*C] [C-D] 15,000,000 [(E/1000)*F] [G/E] [G/10] [G*1.08^10] [J/E] [J/10]
Badin 0.083 2,075,398 0.164 339,810 28,068 311,742 15,000,000 4,676,123,811 15,000 467,612,381 10,095,400,586 32,384 1,009,540,059
Sujawal 0.056 996,762 0.112 111,945 6,258 105,688 15,000,000 1,585,315,034 15,000 158,531,503 3,422,576,256 32,384 342,257,626
Thatta 0.605 1,102,581 0.112 123,830 74,954 48,876 15,000,000 733,134,637 15,000 73,313,464 1,582,782,695 32,384 158,278,269
Dadu 0.011 2,317,005 0.214 495,227 5,398 489,829 15,000,000 7,347,438,917 15,000 734,743,892 15,862,569,543 32,384 1,586,256,954
Hyderabad 0.210 2,623,925 0.508 1,332,831 279,894 1,052,936 15,000,000 15,794,041,503 15,000 1,579,404,150 34,098,151,008 32,384 3,409,815,101
Jamshoro 0.191 1,218,663 0.508 619,023 118,481 500,542 15,000,000 7,508,135,969 15,000 750,813,597 16,209,502,426 32,384 1,620,950,243
Matiari 0.014 902,260 0.508 458,306 6,462 451,844 15,000,000 6,777,653,106 15,000 677,765,311 14,632,444,713 32,384 1,463,244,471
Tando Allah Yar 0.047 819,938 0.508 416,490 19,408 397,082 15,000,000 5,956,222,709 15,000 595,622,271 12,859,038,095 32,384 1,285,903,810
Tando M Khan 0.088 772,086 0.508 392,183 34,316 357,867 15,000,000 5,368,010,009 15,000 536,801,001 11,589,130,994 32,384 1,158,913,099
Karachi Central 0.993 6,119,496 1.000 6,119,496 6,073,600 45,896 15,000,000 688,443,300 15,000 68,844,330 1,486,297,450 32,384 148,629,745
Karachi East 0.993 3,702,357 1.000 3,702,357 3,674,589 27,768 15,000,000 416,515,162 15,000 41,651,516 899,224,996 32,384 89,922,500
Karachi South 0.993 4,218,944 1.000 4,218,944 4,187,302 31,642 15,000,000 474,631,200 15,000 47,463,120 1,024,693,162 32,384 102,469,316
Karachi West 0.993 4,208,477 0.907 3,817,089 3,788,460 28,628 15,000,000 429,422,472 15,000 42,942,247 927,090,909 32,384 92,709,091
Korangi 0.993 4,122,657 1.000 4,122,657 4,091,737 30,920 15,000,000 463,798,912 15,000 46,379,891 1,001,307,066 32,384 100,130,707
Malir 0.993 2,054,672 0.907 1,863,588 1,849,611 13,977 15,000,000 209,653,594 15,000 20,965,359 452,626,385 32,384 45,262,639
Jacobabad 0.058 1,305,942 0.243 317,785 18,400 299,386 15,000,000 4,490,783,326 15,000 449,078,333 9,695,264,379 32,384 969,526,438
Kashmore 0.168 1,203,411 0.243 292,836 49,255 243,581 15,000,000 3,653,710,231 15,000 365,371,023 7,888,086,350 32,384 788,808,635

254
Larkana 0.024 2,383,207 0.289 688,867 16,533 672,334 15,000,000 10,085,009,765 15,000 1,008,500,977 21,772,779,680 32,384 2,177,277,968
Q Shahdadkot 0.038 2,196,695 0.289 634,955 24,382 610,573 15,000,000 9,158,597,133 15,000 915,859,713 19,772,724,290 32,384 1,977,272,429
Shikarpur 0.062 1,686,491 0.241 406,291 25,190 381,101 15,000,000 5,716,514,562 15,000 571,651,456 12,341,526,185 32,384 1,234,152,618
Mirpur Khas 0.445 1,929,655 0.331 638,959 284,400 354,558 15,000,000 5,318,371,984 15,000 531,837,198 11,481,966,222 32,384 1,148,196,622
Sanghar 0.125 2,846,978 0.228 648,555 81,004 567,550 15,000,000 8,513,250,911 15,000 851,325,091 18,379,470,199 32,384 1,837,947,020
Tharparkar 0.053 2,167,030 0.044 94,837 5,017 89,820 15,000,000 1,347,304,669 15,000 134,730,467 2,908,729,730 32,384 290,872,973
Umerkot 0.101 1,641,132 0.169 277,235 28,112 249,123 15,000,000 3,736,850,138 15,000 373,685,014 8,067,579,174 32,384 806,757,917
Ghotki 0.103 2,382,961 0.163 388,152 40,019 348,134 15,000,000 5,222,008,452 15,000 522,200,845 11,273,924,583 32,384 1,127,392,458
Khairpur 0.081 3,269,872 0.236 771,495 62,105 709,390 15,000,000 10,640,849,379 15,000 1,064,084,938 22,972,795,717 32,384 2,297,279,572
Sukkur 0.066 1,996,271 0.509 1,015,724 67,342 948,381 15,000,000 14,225,719,551 15,000 1,422,571,955 30,712,261,544 32,384 3,071,226,154
N Feroze 0.047 1,700,898 0.177 301,722 14,302 287,420 15,000,000 4,311,302,742 15,000 431,130,274 9,307,779,261 32,384 930,777,926
S Benazirabad 0.254 1,733,906 0.264 457,738 116,266 341,473 15,000,000 5,122,090,955 15,000 512,209,095 11,058,210,201 32,384 1,105,821,020
Sindh 0.637 65,699,670 0.427 35,068,927 25,070,866 9,998,060 15,000,000 149,970,904,134 15,000 14,997,090,413 323,775,933,799 32,384 32,377,593,380
District % popconnectedtosewerageanddrainage*system(fraction)
Total estpop all UCs2026
% Urbanpopulation(fraction)
Total estpop urban
Access tosewerageanddrainagesystemPSLM2014-15Urban
Pop gapto meetaccess by2026
Unit costof WSS per1000 popat presentrates
Total Cost tomeet gap atcurrent rates
Meancostpercapitaatcurrentrates
Mean AnnualCost to meetgap at currentrates
Total Cost tomeet gap with8% inflation
Meancost percapitaat 8%inflation
Mean AnnualCost to meetgap at 8%inflation
*Sewerage and Drainage – includes flush to sewer and flush to septic tank (does not include flush to open drain)

255
Table 26 - Detailed costing of safely managed rural sewerage and drainage system by district
District % popconnectedtosewerageanddrainage*system(fraction)
Total estpop allUCs 2026
% Ruralpopulation(fraction)
Total estpop rural
Access tosewerageanddrainagesystemPSLM2014-15Rural
Pop gap tomeetaccess by2026
Unit costof WSS per1000 popat presentrates
Total Cost tomeet gap atcurrent rates
Meancostpercapitaatcurrentrates
Mean AnnualCost to meetgap at currentrates
Total Cost tomeet gap with8% inflation
Meancost percapitaat 8%inflation
Mean AnnualCost to meetgap at 8%inflation
a A B C D E F G H I J K L
[A*B] [a*C] [C-D] 15,000,000 [(E/1000)*F] [G/E] [G/10] [G*1.08^10] [J/E] [J/10]
Badin 0.050 2,075,398 0.836 1,735,588 87,474 1,648,114 15,000,000 24,721,717,127 15,000 2,472,171,713 53,372,333,081 32,384 5,337,233,308
Sujawal 0.006 996,762 0.888 884,817 4,955 879,862 15,000,000 13,197,924,140 15,000 1,319,792,414 28,493,328,338 32,384 2,849,332,834
Thatta 0.002 1,102,581 0.888 978,751 2,349 976,402 15,000,000 14,646,032,182 15,000 1,464,603,218 31,619,684,989 32,384 3,161,968,499
Dadu 0.009 2,317,005 0.786 1,821,778 16,760 1,805,017 15,000,000 27,075,261,099 15,000 2,707,526,110 58,453,457,994 32,384 5,845,345,799
Hyderabad 0.224 2,623,925 0.492 1,291,094 289,076 1,002,018 15,000,000 15,030,276,545 15,000 1,503,027,655 32,449,239,750 32,384 3,244,923,975
Jamshoro 0.033 1,218,663 0.492 599,640 20,028 579,612 15,000,000 8,694,173,186 15,000 869,417,319 18,770,067,821 32,384 1,877,006,782
Matiari 0.027 902,260 0.492 443,954 12,031 431,923 15,000,000 6,478,847,806 15,000 647,884,781 13,987,346,481 32,384 1,398,734,648
Tando Allah Yar 0.044 819,938 0.492 403,448 17,913 385,535 15,000,000 5,783,024,415 15,000 578,302,442 12,485,115,970 32,384 1,248,511,597
Tando M Khan 0.138 772,086 0.492 379,903 52,427 327,476 15,000,000 4,912,140,881 15,000 491,214,088 10,604,943,738 32,384 1,060,494,374
Karachi Central 0.000 6,119,496 0.000 - - - 15,000,000 - #DIV/0! - - #DIV/0! -
Karachi East 0.000 3,702,357 0.000 - - - 15,000,000 - #DIV/0! - - #DIV/0! -
Karachi South 0.000 4,218,944 0.000 - - - 15,000,000 - #DIV/0! - - #DIV/0! -
Karachi West 0.581 4,208,477 0.093 391,388 227,475 163,913 15,000,000 2,458,701,684 15,000 245,870,168 5,308,152,526 32,384 530,815,253
Korangi 0.000 4,122,657 0.000 - - - 15,000,000 - #DIV/0! - - #DIV/0! -
Malir 0.581 2,054,672 0.093 191,084 111,058 80,026 15,000,000 1,200,392,804 15,000 120,039,280 2,591,558,031 32,384 259,155,803
Jacobabad 0.065 1,305,942 0.757 988,157 64,033 924,124 15,000,000 13,861,861,831 15,000 1,386,186,183 29,926,720,017 32,384 2,992,672,002
Kashmore 0.173 1,203,411 0.757 910,575 157,803 752,773 15,000,000 11,291,589,801 15,000 1,129,158,980 24,377,695,480 32,384 2,437,769,548

256
Larkana 0.014 2,383,207 0.711 1,694,340 23,721 1,670,619 15,000,000 25,059,291,747 15,000 2,505,929,175 54,101,131,366 32,384 5,410,113,137
Q Shahdadkot 0.132 2,196,695 0.711 1,561,740 205,525 1,356,215 15,000,000 20,343,219,629 15,000 2,034,321,963 43,919,485,383 32,384 4,391,948,538
Shikarpur 0.015 1,686,491 0.759 1,280,200 19,715 1,260,485 15,000,000 18,907,273,599 15,000 1,890,727,360 40,819,385,602 32,384 4,081,938,560
Mirpur Khas 0.229 1,929,655 0.669 1,290,696 295,569 995,127 15,000,000 14,926,903,759 15,000 1,492,690,376 32,226,065,657 32,384 3,222,606,566
Sanghar 0.092 2,846,978 0.772 2,198,423 202,914 1,995,509 15,000,000 29,932,634,888 15,000 2,993,263,489 64,622,313,694 32,384 6,462,231,369
Tharparkar 0.013 2,167,030 0.956 2,072,193 27,767 2,044,425 15,000,000 30,666,381,260 15,000 3,066,638,126 66,206,417,078 32,384 6,620,641,708
Umerkot 0.037 1,641,132 0.831 1,363,897 50,328 1,313,569 15,000,000 19,703,538,468 15,000 1,970,353,847 42,538,461,733 32,384 4,253,846,173
Ghotki 0.174 2,382,961 0.837 1,994,809 347,296 1,647,512 15,000,000 24,712,686,213 15,000 2,471,268,621 53,352,836,016 32,384 5,335,283,602
Khairpur 0.094 3,269,872 0.764 2,498,377 235,847 2,262,530 15,000,000 33,937,948,646 15,000 3,393,794,865 73,269,485,688 32,384 7,326,948,569
Sukkur 0.174 1,996,271 0.491 980,547 170,615 809,932 15,000,000 12,148,979,923 15,000 1,214,897,992 26,228,736,446 32,384 2,622,873,645
N Feroze 0.000 1,700,898 0.823 1,399,176 - 1,399,176 15,000,000 20,987,643,061 15,000 2,098,764,306 45,310,747,238 32,384 4,531,074,724
S Benazirabad 0.004 1,733,906 0.736 1,276,168 5,615 1,270,553 15,000,000 19,058,289,262 15,000 1,905,828,926 41,145,417,093 32,384 4,114,541,709
Sindh 0.094 65,699,670 0.573 30,630,743 2,648,294 27,982,449 15,000,000 419,736,733,955 15,000 41,973,673,396 906,180,127,210 32,384 90,618,012,721
District % popconnectedtosewerageanddrainage*system(fraction)
Total estpop allUCs 2026
% Ruralpopulation(fraction)
Total estpop rural
Access tosewerageanddrainagesystemPSLM2014-15Rural
Pop gap tomeetaccess by2026
Unit costof WSS per1000 popat presentrates
Total Cost tomeet gap atcurrent rates
Meancostpercapitaatcurrentrates
Mean AnnualCost to meetgap at currentrates
Total Cost tomeet gap with8% inflation
Meancost percapitaat 8%inflation
Mean AnnualCost to meetgap at 8%inflation
*Sewerage and Drainage – includes flush to sewer and flush to septic tank (does not include flush to open drain)

257
Table 27 - Detailed costing for improved overall drinking water supply by district
District %improvedwatersupply
Numberof HH1998
No UCs Total est pop allUCs 2026
Total est No ofHH all UCs 2026
Mean pop per UC2026
Mean No of HHper UC 2026
Population withaccess toImproved WaterSupply PSLM2014-15
Accesspopulation gap tomeet by 2026
a A B C D E F G H[C/A] [C/B] [D/B] [C*a] [C-G]
Badin 0.913 214,348 49 2,075,398 391,584 42,355 7,992 1,895,669 179,729
Sujawal 0.640 109,852 29 996,762 207,117 34,371 7,142 638,027 358,735
Thatta 0.650 110,612 34 1,102,581 208,696 32,429 6,138 717,008 385,573
Dadu 0.921 203,217 55 2,317,005 421,274 42,127 7,660 2,132,803 184,202
Hyderabad 0.906 425,512 116 2,623,925 437,321 22,620 3,770 2,376,226 247,699
Jamshoro 0.782 101,402 30 1,218,663 221,575 40,622 7,386 952,507 266,156
Matiari 0.988 74,362 25 902,260 150,377 36,090 6,015 891,433 10,827
Tando Allah Yar 0.985 99,120 30 819,938 136,656 27,331 4,555 807,885 12,053
Tando M Khan 0.965 91,733 31 772,086 128,681 24,906 4,151 745,063 27,023
Karachi Central 0.856 337,122 42 6,119,496 905,653 145,702 21,563 5,235,229 884,267
Karachi East 0.856 215,339 26 3,702,357 578,493 142,398 22,250 3,167,366 534,991
Karachi South 0.856 237,165 30 4,218,944 637,126 140,631 21,238 3,609,307 609,637
Karachi West 0.856 225,872 30 4,208,477 608,132 140,283 20,271 3,600,352 608,125
Korangi 0.856 213,437 28 4,122,657 573,384 147,238 20,478 3,526,933 595,724
Malir 0.856 116,573 25 2,054,672 313,165 82,187 12,527 1,757,772 296,900
Jacobabad 0.740 121,127 42 1,305,942 233,204 31,094 5,552 966,658 339,284
Kashmore 0.980 131,473 44 1,203,411 214,895 27,350 4,884 1,179,583 23,828
Larkana 0.996 166,450 43 2,383,207 403,933 55,423 9,394 2,373,912 9,295
Q Shahdadkot 0.835 162,483 43 2,196,695 372,321 51,086 8,659 1,833,142 363,553
Shikarpur 1.000 150,108 52 1,686,491 285,846 32,433 5,497 1,686,491 -

258
Mirpur Khas 0.772 148,659 41 1,929,655 316,337 47,065 7,716 1,489,501 440,154
Sanghar 0.958 246,091 69 2,846,978 490,858 41,261 7,114 2,728,544 118,434
Tharparkar 0.172 163,692 46 2,167,030 386,970 47,109 8,412 372,946 1,794,084
Umerkot 0.628 121,572 34 1,641,132 303,913 48,269 8,939 1,030,467 610,665
Ghotki 0.995 153,217 75 2,382,961 471,873 31,773 6,292 2,371,523 11,438
Khairpur 0.974 254,828 76 3,269,872 536,045 43,025 7,053 3,184,855 85,017
Sukkur 0.931 137,632 43 1,996,271 302,465 46,425 7,034 1,858,528 137,743
N Feroze 0.986 187,512 51 1,700,898 293,258 33,351 5,750 1,676,745 24,153
S Benazirabad 0.976 178,589 58 1,733,906 288,984 29,895 4,982 1,692,292 41,614Sindh 0.866 5,099,099 1297 65,699,670 10,820,136 56,498,769 9,200,901District %
improvedwatersupply
Numberof HH1998
No UCs Total est pop allUCs 2026
Total est No ofHH all UCs 2026
Mean pop per UC2026
Mean No of HHper UC 2026
Population withaccess toImproved WaterSupply PSLM2014-15
Accesspopulation gap tomeet by 2026

259
Table 27 continued
District Unit cost ofWSS per1000 pop atpresentrates
Total Cost tomeet gap atcurrent rates
Mean costper UC atcurrentrates
Mean costper HH atcurrent rates
Meancost percapita atcurrentrates
Mean AnnualCost to meetgap at currentrates
Total Cost tomeet gap with8% inflation
Mean costper UC at8% inflation
Mean costper HH at 8%inflation
Meancost percapita at8%inflation
Mean AnnualCost to meetgap at 8%inflation
I J K L M N O P Q R S
10,000,000 [(H/1000)*I] [J/B] [J/(H/A)] [J/H] [J/10] [J*1.08^10] [O/B] [O/(H/A)] [O/H] [O/10]
Badin 10,000,000 1,797,294,668 36,679,483 2,143,480,000 10,000 179,729,467 3,880,224,386 79,188,253 4,627,612,553 21,589 388,022,439
Sujawal 10,000,000 3,587,346,438 123,701,601 1,098,520,000 10,000 358,734,644 7,744,811,899 267,062,479 2,371,622,288 21,589 774,481,190
Thatta 10,000,000 3,855,725,757 113,403,699 1,106,120,000 10,000 385,572,576 8,324,222,719 244,830,080 2,388,030,118 21,589 832,422,272
Dadu 10,000,000 1,842,018,975 33,491,254 2,032,170,000 10,000 184,201,898 3,976,780,811 72,305,106 4,387,302,612 21,589 397,678,081
Hyderabad 10,000,000 2,476,985,200 21,353,321 4,255,120,000 10,000 247,698,520 5,347,625,266 46,100,218 9,186,484,934 21,589 534,762,527
Jamshoro 10,000,000 2,661,559,992 88,718,666 1,014,020,000 10,000 266,155,999 5,746,108,398 191,536,947 2,189,193,126 21,589 574,610,840
Matiari 10,000,000 108,271,200 4,330,848 743,620,000 10,000 10,827,120 233,749,400 9,349,976 1,605,419,806 21,589 23,374,940
Tando A Yar 10,000,000 120,530,886 4,017,696 991,200,000 10,000 12,053,089 260,217,143 8,673,905 2,139,926,457 21,589 26,021,714
Tando M Khan 10,000,000 270,230,100 8,717,100 917,330,000 10,000 27,023,010 583,406,518 18,819,565 1,980,446,668 21,589 58,340,652
Karachi Central 10,000,000 8,842,671,720 210,539,803 3,371,220,000 10,000 884,267,172 19,090,665,019 454,539,643 7,278,211,129 21,589 1,909,066,502
Karachi East 10,000,000 5,349,905,865 205,765,610 2,153,390,000 10,000 534,990,587 11,550,045,505 444,232,519 4,649,007,500 21,589 1,155,004,551
Karachi South 10,000,000 6,096,374,080 203,212,469 2,371,650,000 10,000 609,637,408 13,161,614,394 438,720,480 5,120,214,470 21,589 1,316,161,439
Karachi West 10,000,000 6,081,249,265 202,708,309 2,258,720,000 10,000 608,124,927 13,128,961,053 437,632,035 4,876,407,070 21,589 1,312,896,105
Korangi 10,000,000 5,957,239,365 212,758,549 2,134,370,000 10,000 595,723,937 12,861,232,980 459,329,749 4,607,944,746 21,589 1,286,123,298
Malir 10,000,000 2,969,001,040 118,760,042 1,165,730,000 10,000 296,900,104 6,409,850,562 256,394,022 2,516,723,637 21,589 640,985,056
Jacobabad 10,000,000 3,392,837,316 80,781,841 1,211,270,000 10,000 339,283,732 7,324,881,293 174,401,936 2,615,041,081 21,589 732,488,129
Kashmore 10,000,000 238,275,378 5,415,349 1,314,730,000 10,000 23,827,538 514,418,670 11,691,333 2,838,403,462 21,589 51,441,867
Larkana 10,000,000 92,945,073 2,161,513 1,664,500,000 10,000 9,294,507 200,661,441 4,666,545 3,593,530,658 21,589 20,066,144
Q Shahdadkot 10,000,000 3,635,530,225 84,547,215 1,624,830,000 10,000 363,553,023 7,848,837,081 182,531,095 3,507,886,103 21,589 784,883,708
Shikarpur 10,000,000 - - #DIV/0! #DIV/0! - - - #DIV/0! #DIV/0! -
Mirpur Khas 10,000,000 4,401,543,055 107,354,709 1,486,590,000 10,000 440,154,306 9,502,601,328 231,770,764 3,209,436,312 21,589 950,260,133
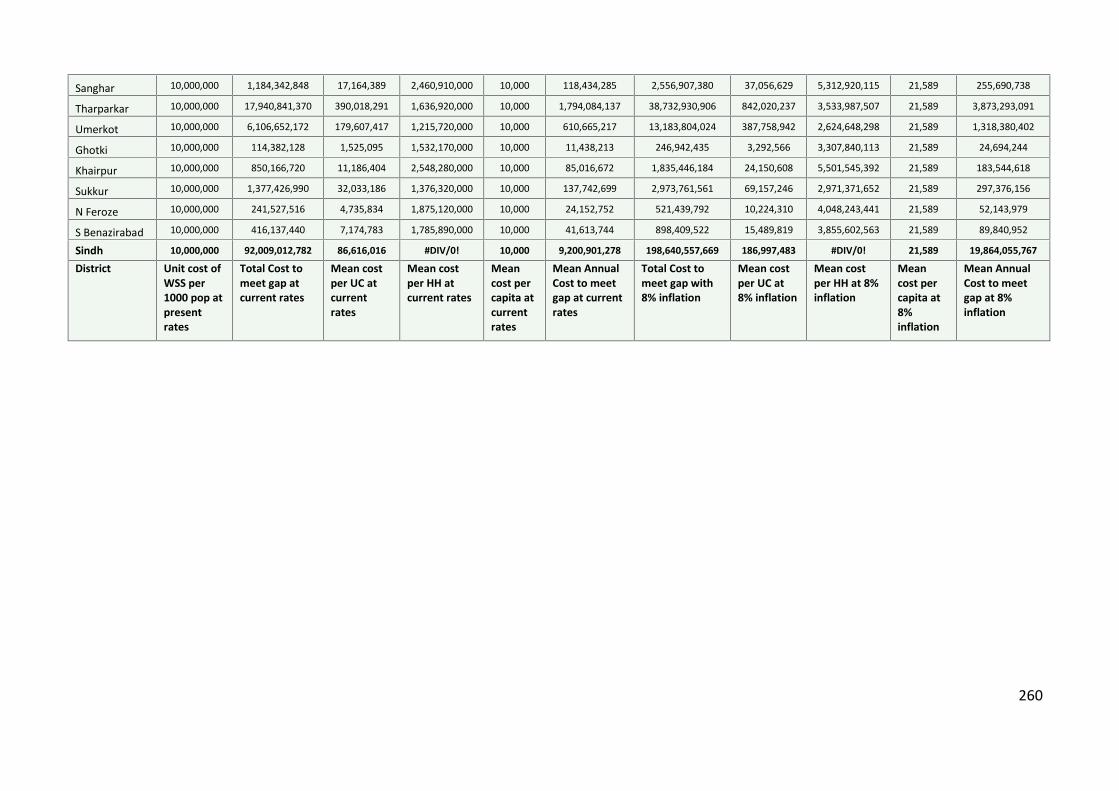
260
Sanghar 10,000,000 1,184,342,848 17,164,389 2,460,910,000 10,000 118,434,285 2,556,907,380 37,056,629 5,312,920,115 21,589 255,690,738
Tharparkar 10,000,000 17,940,841,370 390,018,291 1,636,920,000 10,000 1,794,084,137 38,732,930,906 842,020,237 3,533,987,507 21,589 3,873,293,091
Umerkot 10,000,000 6,106,652,172 179,607,417 1,215,720,000 10,000 610,665,217 13,183,804,024 387,758,942 2,624,648,298 21,589 1,318,380,402
Ghotki 10,000,000 114,382,128 1,525,095 1,532,170,000 10,000 11,438,213 246,942,435 3,292,566 3,307,840,113 21,589 24,694,244
Khairpur 10,000,000 850,166,720 11,186,404 2,548,280,000 10,000 85,016,672 1,835,446,184 24,150,608 5,501,545,392 21,589 183,544,618
Sukkur 10,000,000 1,377,426,990 32,033,186 1,376,320,000 10,000 137,742,699 2,973,761,561 69,157,246 2,971,371,652 21,589 297,376,156
N Feroze 10,000,000 241,527,516 4,735,834 1,875,120,000 10,000 24,152,752 521,439,792 10,224,310 4,048,243,441 21,589 52,143,979
S Benazirabad 10,000,000 416,137,440 7,174,783 1,785,890,000 10,000 41,613,744 898,409,522 15,489,819 3,855,602,563 21,589 89,840,952
Sindh 10,000,000 92,009,012,782 86,616,016 #DIV/0! 10,000 9,200,901,278 198,640,557,669 186,997,483 #DIV/0! 21,589 19,864,055,767
District Unit cost ofWSS per1000 pop atpresentrates
Total Cost tomeet gap atcurrent rates
Mean costper UC atcurrentrates
Mean costper HH atcurrent rates
Meancost percapita atcurrentrates
Mean AnnualCost to meetgap at currentrates
Total Cost tomeet gap with8% inflation
Mean costper UC at8% inflation
Mean costper HH at 8%inflation
Meancost percapita at8%inflation
Mean AnnualCost to meetgap at 8%inflation

261
Table 28 - Detailed costing for improved urban drinking water supply by district
District %improvedwatersupplyurban(fraction)
Total estpop all UCs2026
% Urbanpopulation(fraction)
Total estpop urban
Access toimprovedWaterSupplyPSLM 2014-15
Pop gapto meetaccess by2026
Unit cost ofWSS per1000 pop atpresentrates
Total Cost tomeet gap atcurrent rates
Meancost percapitaatcurrentrates
Mean AnnualCost to meetgap at currentrates
Total Cost tomeet gap with8% inflation
Meancost percapita at8%inflation
Mean AnnualCost to meetgap at 8%inflation
a A B C D E F G H I J K L
[A*B] [C*a] [C-D] 10,000,000 [(E/1000)*F] [G/E] [G/10] [G*1.08^10] [J/E] [J/10]
Badin 0.928 2,075,398 0.164 339,810 315,446 24,364 10,000,000 243,643,687 10,000 24,364,369 526,008,446 21,589 52,600,845
Sujawal 0.738 996,762 0.112 111,945 82,582 29,363 10,000,000 293,632,831 10,000 29,363,283 633,931,259 21,589 63,393,126
Thatta 0.847 1,102,581 0.112 123,830 104,822 19,008 10,000,000 190,078,822 10,000 19,007,882 410,365,921 21,589 41,036,592
Dadu 1.000 2,317,005 0.214 495,227 495,227 - 10,000,000 - #DIV/0! - - #DIV/0! -
Hyderabad 0.901 2,623,925 0.508 1,332,831 1,200,480 132,350 10,000,000 1,323,500,693 10,000 132,350,069 2,857,338,730 21,589 285,733,873
Jamshoro 0.911 1,218,663 0.508 619,023 563,683 55,341 10,000,000 553,407,004 10,000 55,340,700 1,194,764,215 21,589 119,476,422
Matiari 0.989 902,260 0.508 458,306 453,127 5,179 10,000,000 51,788,538 10,000 5,178,854 111,807,570 21,589 11,180,757
Tando A Yar 0.975 819,938 0.508 416,490 406,119 10,371 10,000,000 103,705,996 10,000 10,370,600 223,893,468 21,589 22,389,347Tando M Khan 0.934 772,086 0.508 392,183 366,456 25,727 10,000,000 257,272,297 10,000 25,727,230 555,431,593 21,589 55,543,159
Karachi Central 0.863 6,119,496 1.000 6,119,496 5,278,677 840,819 10,000,000 8,408,187,504 10,000 840,818,750 18,152,646,184 21,589 1,815,264,618
Karachi East 0.863 3,702,357 1.000 3,702,357 3,193,653 508,704 10,000,000 5,087,038,518 10,000 508,703,852 10,982,534,619 21,589 1,098,253,462
Karachi South 0.863 4,218,944 1.000 4,218,944 3,639,261 579,683 10,000,000 5,796,829,056 10,000 579,682,906 12,514,919,154 21,589 1,251,491,915
Karachi West 0.863 4,208,477 0.907 3,817,089 3,292,621 524,468 10,000,000 5,244,679,790 10,000 524,467,979 11,322,870,301 21,589 1,132,287,030
Korangi 0.863 4,122,657 1.000 4,122,657 3,556,204 566,453 10,000,000 5,664,530,718 10,000 566,453,072 12,229,296,965 21,589 1,222,929,696
Malir 0.863 2,054,672 0.907 1,863,588 1,607,531 256,057 10,000,000 2,560,569,230 10,000 256,056,923 5,528,076,919 21,589 552,807,692
Jacobabad 0.119 1,305,942 0.243 317,785 37,785 280,001 10,000,000 2,800,006,502 10,000 280,000,650 6,045,004,030 21,589 604,500,403
Kashmore 0.952 1,203,411 0.243 292,836 278,780 14,056 10,000,000 140,561,105 10,000 14,056,111 303,460,884 21,589 30,346,088
Larkana 0.991 2,383,207 0.289 688,867 682,805 6,062 10,000,000 60,620,277 10,000 6,062,028 130,874,632 21,589 13,087,463Q Shahdadkot 0.719 2,196,695 0.289 634,955 456,215 178,740 10,000,000 1,787,399,537 10,000 178,739,954 3,858,861,542 21,589 385,886,154

262
Shikarpur 1.000 1,686,491 0.241 406,291 406,332 -41 10,000,000 -406,291 10,000 -40,629 -877,152 21,589 -87,715
Mirpur Khas 0.966 1,929,655 0.331 638,959 617,234 21,725 10,000,000 217,245,927 10,000 21,724,593 469,017,663 21,589 46,901,766
Sanghar 0.971 2,846,978 0.228 648,555 629,617 18,938 10,000,000 189,377,920 10,000 18,937,792 408,852,725 21,589 40,885,273
Tharparkar 0.790 2,167,030 0.044 94,837 74,893 19,944 10,000,000 199,442,630 10,000 19,944,263 430,581,679 21,589 43,058,168
Umerkot 0.989 1,641,132 0.169 277,235 274,102 3,133 10,000,000 31,327,551 10,000 3,132,755 67,633,834 21,589 6,763,383
Ghotki 0.976 2,382,961 0.163 388,152 378,837 9,316 10,000,000 93,156,578 10,000 9,315,658 201,118,066 21,589 20,111,807
Khairpur 1.000 3,269,872 0.236 771,495 771,495 - 10,000,000 - #DIV/0! - - #DIV/0! -
Sukkur 0.925 1,996,271 0.509 1,015,724 939,240 76,484 10,000,000 764,840,014 10,000 76,484,001 1,651,232,226 21,589 165,123,223
N Feroze 0.931 1,700,898 0.177 301,722 280,903 20,819 10,000,000 208,188,039 10,000 20,818,804 449,462,362 21,589 44,946,236
S Benazirabad 0.942 1,733,906 0.264 457,738 431,006 26,732 10,000,000 267,319,135 10,000 26,731,913 577,121,962 21,589 57,712,196
Sindh 0.883 65,699,670 0.427 35,068,927 30,815,132 4,253,794 10,000,000 42,537,943,612 10,000 4,253,794,361 91,836,229,796 21,589 9,183,622,980
District %improvedwatersupplyurban(fraction)
Total estpop all UCs2026
% Urbanpopulation(fraction)
Total estpop urban
Access toimprovedWaterSupplyPSLM 2014-15
Pop gapto meetaccess by2026
Unit cost ofWSS per1000 pop atpresentrates
Total Cost tomeet gap atcurrent rates
Meancost percapitaatcurrentrates
Mean AnnualCost to meetgap at currentrates
Total Cost tomeet gap with8% inflation
Meancost percapita at8%inflation
Mean AnnualCost to meetgap at 8%inflation
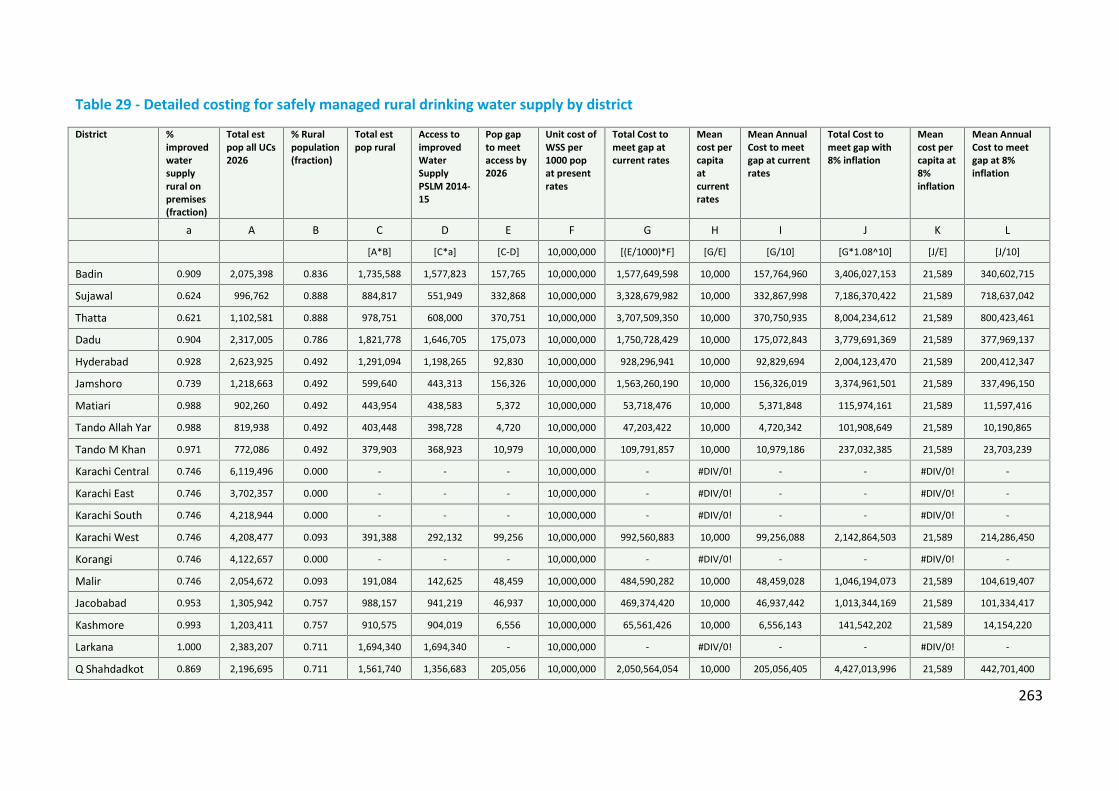
263
Table 29 - Detailed costing for safely managed rural drinking water supply by district
District %improvedwatersupplyrural onpremises(fraction)
Total estpop all UCs2026
% Ruralpopulation(fraction)
Total estpop rural
Access toimprovedWaterSupplyPSLM 2014-15
Pop gapto meetaccess by2026
Unit cost ofWSS per1000 popat presentrates
Total Cost tomeet gap atcurrent rates
Meancost percapitaatcurrentrates
Mean AnnualCost to meetgap at currentrates
Total Cost tomeet gap with8% inflation
Meancost percapita at8%inflation
Mean AnnualCost to meetgap at 8%inflation
a A B C D E F G H I J K L
[A*B] [C*a] [C-D] 10,000,000 [(E/1000)*F] [G/E] [G/10] [G*1.08^10] [J/E] [J/10]
Badin 0.909 2,075,398 0.836 1,735,588 1,577,823 157,765 10,000,000 1,577,649,598 10,000 157,764,960 3,406,027,153 21,589 340,602,715
Sujawal 0.624 996,762 0.888 884,817 551,949 332,868 10,000,000 3,328,679,982 10,000 332,867,998 7,186,370,422 21,589 718,637,042
Thatta 0.621 1,102,581 0.888 978,751 608,000 370,751 10,000,000 3,707,509,350 10,000 370,750,935 8,004,234,612 21,589 800,423,461
Dadu 0.904 2,317,005 0.786 1,821,778 1,646,705 175,073 10,000,000 1,750,728,429 10,000 175,072,843 3,779,691,369 21,589 377,969,137
Hyderabad 0.928 2,623,925 0.492 1,291,094 1,198,265 92,830 10,000,000 928,296,941 10,000 92,829,694 2,004,123,470 21,589 200,412,347
Jamshoro 0.739 1,218,663 0.492 599,640 443,313 156,326 10,000,000 1,563,260,190 10,000 156,326,019 3,374,961,501 21,589 337,496,150
Matiari 0.988 902,260 0.492 443,954 438,583 5,372 10,000,000 53,718,476 10,000 5,371,848 115,974,161 21,589 11,597,416
Tando Allah Yar 0.988 819,938 0.492 403,448 398,728 4,720 10,000,000 47,203,422 10,000 4,720,342 101,908,649 21,589 10,190,865
Tando M Khan 0.971 772,086 0.492 379,903 368,923 10,979 10,000,000 109,791,857 10,000 10,979,186 237,032,385 21,589 23,703,239
Karachi Central 0.746 6,119,496 0.000 - - - 10,000,000 - #DIV/0! - - #DIV/0! -
Karachi East 0.746 3,702,357 0.000 - - - 10,000,000 - #DIV/0! - - #DIV/0! -
Karachi South 0.746 4,218,944 0.000 - - - 10,000,000 - #DIV/0! - - #DIV/0! -
Karachi West 0.746 4,208,477 0.093 391,388 292,132 99,256 10,000,000 992,560,883 10,000 99,256,088 2,142,864,503 21,589 214,286,450
Korangi 0.746 4,122,657 0.000 - - - 10,000,000 - #DIV/0! - - #DIV/0! -
Malir 0.746 2,054,672 0.093 191,084 142,625 48,459 10,000,000 484,590,282 10,000 48,459,028 1,046,194,073 21,589 104,619,407
Jacobabad 0.953 1,305,942 0.757 988,157 941,219 46,937 10,000,000 469,374,420 10,000 46,937,442 1,013,344,169 21,589 101,334,417
Kashmore 0.993 1,203,411 0.757 910,575 904,019 6,556 10,000,000 65,561,426 10,000 6,556,143 141,542,202 21,589 14,154,220
Larkana 1.000 2,383,207 0.711 1,694,340 1,694,340 - 10,000,000 - #DIV/0! - - #DIV/0! -
Q Shahdadkot 0.869 2,196,695 0.711 1,561,740 1,356,683 205,056 10,000,000 2,050,564,054 10,000 205,056,405 4,427,013,996 21,589 442,701,400
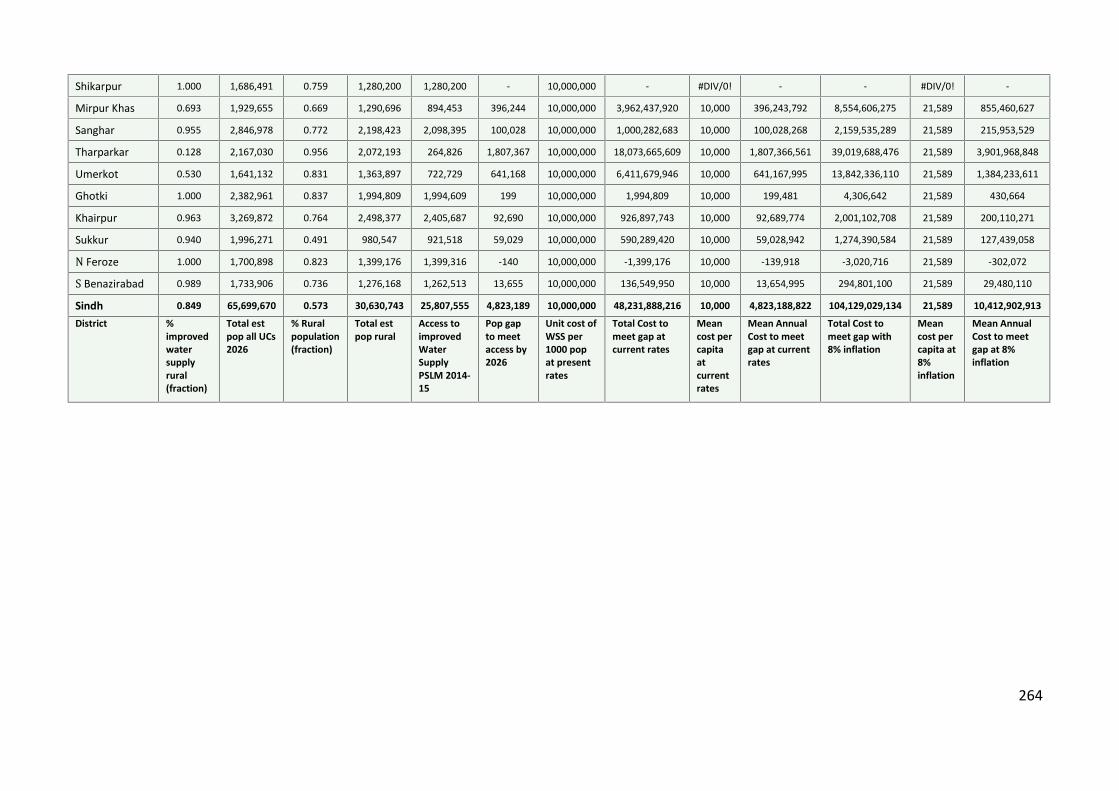
264
Shikarpur 1.000 1,686,491 0.759 1,280,200 1,280,200 - 10,000,000 - #DIV/0! - - #DIV/0! -
Mirpur Khas 0.693 1,929,655 0.669 1,290,696 894,453 396,244 10,000,000 3,962,437,920 10,000 396,243,792 8,554,606,275 21,589 855,460,627
Sanghar 0.955 2,846,978 0.772 2,198,423 2,098,395 100,028 10,000,000 1,000,282,683 10,000 100,028,268 2,159,535,289 21,589 215,953,529
Tharparkar 0.128 2,167,030 0.956 2,072,193 264,826 1,807,367 10,000,000 18,073,665,609 10,000 1,807,366,561 39,019,688,476 21,589 3,901,968,848
Umerkot 0.530 1,641,132 0.831 1,363,897 722,729 641,168 10,000,000 6,411,679,946 10,000 641,167,995 13,842,336,110 21,589 1,384,233,611
Ghotki 1.000 2,382,961 0.837 1,994,809 1,994,609 199 10,000,000 1,994,809 10,000 199,481 4,306,642 21,589 430,664
Khairpur 0.963 3,269,872 0.764 2,498,377 2,405,687 92,690 10,000,000 926,897,743 10,000 92,689,774 2,001,102,708 21,589 200,110,271
Sukkur 0.940 1,996,271 0.491 980,547 921,518 59,029 10,000,000 590,289,420 10,000 59,028,942 1,274,390,584 21,589 127,439,058N Feroze 1.000 1,700,898 0.823 1,399,176 1,399,316 -140 10,000,000 -1,399,176 10,000 -139,918 -3,020,716 21,589 -302,072S Benazirabad 0.989 1,733,906 0.736 1,276,168 1,262,513 13,655 10,000,000 136,549,950 10,000 13,654,995 294,801,100 21,589 29,480,110
Sindh 0.849 65,699,670 0.573 30,630,743 25,807,555 4,823,189 10,000,000 48,231,888,216 10,000 4,823,188,822 104,129,029,134 21,589 10,412,902,913
District %improvedwatersupplyrural(fraction)
Total estpop all UCs2026
% Ruralpopulation(fraction)
Total estpop rural
Access toimprovedWaterSupplyPSLM 2014-15
Pop gapto meetaccess by2026
Unit cost ofWSS per1000 popat presentrates
Total Cost tomeet gap atcurrent rates
Meancost percapitaatcurrentrates
Mean AnnualCost to meetgap at currentrates
Total Cost tomeet gap with8% inflation
Meancost percapita at8%inflation
Mean AnnualCost to meetgap at 8%inflation

265
Table 30 - Detailed costing of improved overall sanitation system by district
District % popconnected toimprovedsanitation*system (fraction)
HH size1998
No UCs Total est popall UCs 2026
Total est No ofHH all UCs2026
Mean pop perUC 2026
Mean No ofHH per UC2026
Access toimprovedsanitation systemPSLM 2014-15
Access popgap to meet by2026
a A B C D E F G H[C/A] [C/B] [D/B] [C*a] [C-G]
Badin 0.245 214,348 49 2,075,398 391,584 42,355 7,992 507,435 1,567,963Sujawal 0.166 109,852 29 996,762 207,117 34,371 7,142 164,964 831,798Thatta 0.223 110,612 34 1,102,581 208,696 32,429 6,138 245,986 856,595Dadu 0.480 203,217 55 2,317,005 421,274 42,127 7,660 1,111,004 1,206,001Hyderabad 0.823 425,512 116 2,623,925 437,321 22,620 3,770 2,159,753 464,172Jamshoro 0.494 101,402 30 1,218,663 221,575 40,622 7,386 601,654 617,009Matiari 0.333 74,362 25 902,260 150,377 36,090 6,015 300,813 601,447Tando Allah Yar 0.355 99,120 30 819,938 136,656 27,331 4,555 290,832 529,106Tando M Khan 0.370 91,733 31 772,086 128,681 24,906 4,151 285,517 486,569Karachi Central 0.971 337,122 42 6,119,496 905,653 145,702 21,563 5,938,971 180,525Karachi East 0.971 215,339 26 3,702,357 578,493 142,398 22,250 3,593,137 109,220Karachi South 0.971 237,165 30 4,218,944 637,126 140,631 21,238 4,094,485 124,459Karachi West 0.971 225,872 30 4,208,477 608,132 140,283 20,271 4,084,327 124,150Korangi 0.971 213,437 28 4,122,657 573,384 147,238 20,478 4,001,039 121,618Malir 0.971 116,573 25 2,054,672 313,165 82,187 12,527 1,994,059 60,613Jacobabad 0.426 121,127 42 1,305,942 233,204 31,094 5,552 555,809 750,133Kashmore 0.474 131,473 44 1,203,411 214,895 27,350 4,884 570,778 632,633Larkana 0.796 166,450 43 2,383,207 403,933 55,423 9,394 1,897,986 485,221Q Shahdadkot 0.584 162,483 43 2,196,695 372,321 51,086 8,659 1,283,749 912,946Shikarpur 0.583 150,108 52 1,686,491 285,846 32,433 5,497 982,887 703,604Mirpur Khas 0.508 148,659 41 1,929,655 316,337 47,065 7,716 980,651 949,004

266
Sanghar 0.487 246,091 69 2,846,978 490,858 41,261 7,114 1,387,048 1,459,930Tharparkar 0.111 163,692 46 2,167,030 386,970 47,109 8,412 240,324 1,926,706Umerkot 0.267 121,572 34 1,641,132 303,913 48,269 8,939 437,690 1,203,442Ghotki 0.610 153,217 75 2,382,961 471,873 31,773 6,292 1,453,368 929,593Khairpur 0.470 254,828 76 3,269,872 536,045 43,025 7,053 1,535,859 1,734,013Sukkur 0.713 137,632 43 1,996,271 302,465 46,425 7,034 1,422,942 573,329N Feroze 0.618 187,512 51 1,700,898 293,258 33,351 5,750 1,050,645 650,253S Benazirabad 0.485 178,589 58 1,733,906 288,984 29,895 4,982 840,771 893,135Sindh 0.648 5,099,099 1297 65,699,670 10,820,136 44,014,481 21,685,189District % pop
connected toimprovedsanitation*system (fraction)
HH size1998
No UCs Total est popall UCs 2026
Total est No ofHH all UCs2026
Mean pop perUC 2026
Mean No ofHH per UC2026
Access toimprovedsanitation systemPSLM 2014-15
Access popgap to meet by2026
*Improved sanitation – includes flush to sewer, flush to septic tank and flush to open drain

267
Table 30 continued
District Unit cost ofsanitationscheme per1000 pop atpresentrates
Total Cost tomeet gap atcurrent rates
Mean costper UC atcurrentrates
Mean costper HH atcurrentrates
Meancost percapitaatcurrentrates
Mean AnnualCost to meetgap atcurrent rates
Total Cost tomeet gapwith 8%inflation
Mean costper UC at8%inflation
Mean costper HH at8% inflation
Meancost percapita at8%inflation
Mean AnnualCost to meetgap at 8%inflation
I J K L M N O P Q R S10,000,000 [(H/1000)*I] [J/B] [J/(H/A)] [J/H] [J/10] [J*1.08^10] [O/B] [O/(H/A)] [O/H] [O/10]
Badin 10,000,000 15,679,631,890 319,992,488 2,143,480,000 10,000 1,567,963,189 33,851,149,235 690,839,780 4,627,612,553 21,589 3,385,114,924
Sujawal 10,000,000 8,317,978,890 286,826,858 1,098,520,000 10,000 831,797,889 17,957,892,552 619,237,674 2,371,622,288 21,589 1,795,789,255
Thatta 10,000,000 8,565,951,789 251,939,759 1,106,120,000 10,000 856,595,179 18,493,247,443 543,919,042 2,388,030,118 21,589 1,849,324,744
Dadu 10,000,000 12,060,011,025 219,272,928 2,032,170,000 10,000 1,206,001,103 26,036,659,269 473,393,805 4,387,302,612 21,589 2,603,665,927
Hyderabad 10,000,000 4,641,723,325 40,014,856 4,255,120,000 10,000 464,172,333 10,021,132,517 86,389,073 9,186,484,934 21,589 1,002,113,252
Jamshoro 10,000,000 6,170,090,769 205,669,692 1,014,020,000 10,000 617,009,077 13,320,763,197 444,025,440 2,189,193,126 21,589 1,332,076,320
Matiari 10,000,000 6,014,465,160 240,578,606 743,620,000 10,000 601,446,516 12,984,779,179 519,391,167 1,605,419,806 21,589 1,298,477,918
Tando Allah Yar 10,000,000 5,291,059,914 176,368,664 991,200,000 10,000 529,105,991 11,423,001,510 380,766,717 2,139,926,457 21,589 1,142,300,151
Tando M Khan 10,000,000 4,865,685,972 156,957,612 917,330,000 10,000 486,568,597 10,504,651,074 338,859,712 1,980,446,668 21,589 1,050,465,107
Karachi Central 10,000,000 1,805,251,320 42,982,174 3,371,220,000 10,000 180,525,132 3,897,402,201 92,795,291 7,278,211,129 21,589 389,740,220
Karachi East 10,000,000 1,092,195,315 42,007,512 2,153,390,000 10,000 109,219,532 2,357,967,767 90,691,068 4,649,007,500 21,589 235,796,777
Karachi South 10,000,000 1,244,588,480 41,486,283 2,371,650,000 10,000 124,458,848 2,686,973,181 89,565,773 5,120,214,470 21,589 268,697,318
Karachi West 10,000,000 1,241,500,715 41,383,357 2,258,720,000 10,000 124,150,072 2,680,306,928 89,343,564 4,876,407,070 21,589 268,030,693
Korangi 10,000,000 1,216,183,815 43,435,136 2,134,370,000 10,000 121,618,382 2,625,649,639 93,773,201 4,607,944,746 21,589 262,564,964
Malir 10,000,000 606,128,240 24,245,130 1,165,730,000 10,000 60,612,824 1,308,585,409 52,343,416 2,516,723,637 21,589 130,858,541
Jacobabad 10,000,000 7,501,330,848 178,603,115 1,211,270,000 10,000 750,133,085 16,194,810,681 385,590,730 2,615,041,081 21,589 1,619,481,068
Kashmore 10,000,000 6,326,331,627 143,780,264 1,314,730,000 10,000 632,633,163 13,658,075,491 310,410,807 2,838,403,462 21,589 1,365,807,549
Larkana 10,000,000 4,852,209,452 112,842,080 1,664,500,000 10,000 485,220,945 10,475,556,278 243,617,588 3,593,530,658 21,589 1,047,555,628
Q Shahdadkot 10,000,000 9,129,464,420 212,313,126 1,624,830,000 10,000 912,946,442 19,709,828,948 458,368,115 3,507,886,103 21,589 1,970,982,895
Shikarpur 10,000,000 7,036,040,452 135,308,470 1,501,080,000 10,000 703,604,045 15,190,283,614 292,120,839 3,240,719,135 21,589 1,519,028,361

268
Mirpur Khas 10,000,000 9,490,043,290 231,464,470 1,486,590,000 10,000 949,004,329 20,488,291,684 499,714,431 3,209,436,312 21,589 2,048,829,168
Sanghar 10,000,000 14,599,303,184 211,584,104 2,460,910,000 10,000 1,459,930,318 31,518,800,587 456,794,211 5,312,920,115 21,589 3,151,880,059
Tharparkar 10,000,000 19,267,063,730 418,849,212 1,636,920,000 10,000 1,926,706,373 41,596,145,511 904,264,033 3,533,987,507 21,589 4,159,614,551
Umerkot 10,000,000 12,034,420,956 353,953,558 1,215,720,000 10,000 1,203,442,096 25,981,412,230 764,159,183 2,624,648,298 21,589 2,598,141,223
Ghotki 10,000,000 9,295,930,861 123,945,745 1,532,170,000 10,000 929,593,086 20,069,217,509 267,589,567 3,307,840,113 21,589 2,006,921,751
Khairpur 10,000,000 17,340,131,216 228,159,621 2,548,280,000 10,000 1,734,013,122 37,436,042,738 492,579,510 5,501,545,392 21,589 3,743,604,274
Sukkur 10,000,000 5,733,290,312 133,332,333 1,376,320,000 10,000 573,329,031 12,377,743,771 287,854,506 2,971,371,652 21,589 1,237,774,377
N Feroze 10,000,000 6,502,533,054 127,500,648 1,875,120,000 10,000 650,253,305 14,038,481,156 275,264,336 4,048,243,441 21,589 1,403,848,116
S Benazirabad 10,000,000 8,931,349,806 153,988,790 1,785,890,000 10,000 893,134,981 19,282,114,356 332,450,248 3,855,602,563 21,589 1,928,211,436
Sindh 10,000,000 216,851,889,827 168,923,676 1,758,310,000 10,000 21,685,188,983 468,166,965,653 364,693,546 3,796,059,412 21,589 46,816,696,565
District Unit cost ofsanitationscheme per1000 pop atpresentrates
Total Cost tomeet gap atcurrent rates
Mean costper UC atcurrentrates
Mean costper HH atcurrentrates
Meancost percapitaatcurrentrates
Mean AnnualCost to meetgap atcurrent rates
Total Cost tomeet gapwith 8%inflation
Mean costper UC at8%inflation
Mean costper HH at8% inflation
Meancost percapita at8%inflation
Mean AnnualCost to meetgap at 8%inflation
*Improved sanitation – includes flush to sewer, flush to septic tank and flush to drain covered with slab

269
Table 31 - Detailed costing of improved urban sanitation system by district
District % popconnectedtoimprovedsanitation*system(fraction)
Total estpop all UCs2026
% Urbanpopulation(fraction)
Total estpop urban
Access toimprovedsanitationsystemPSLM 2014-15 Urban
Pop gapto meetaccess by2026
Unit cost ofWSS per1000 popat presentrates
Total Cost tomeet gap atcurrent rates
Meancost percapitaatcurrentrates
Mean AnnualCost to meetgap at currentrates
Total Cost tomeet gap with8% inflation
Meancost percapita at8%inflation
Mean AnnualCost to meetgap at 8%inflation
a A B C D E F G H I J K L
[A*B] [a*C] [C-D] 10,000,000 [(E/1000)*F] [G/E] [G/10] [G*1.08^10] [J/E] [J/10]
Badin 0.765 2,075,398 0.164 339,810 259,853 79,957 10,000,000 799,572,657 10,000 79,957,266 1,726,217,395 21,589 172,621,740
Sujawal 1.000 996,762 0.112 111,945 111,945 - 10,000,000 - #DIV/0! - - #DIV/0! -
Thatta 0.877 1,102,581 0.112 123,830 108,599 15,231 10,000,000 152,310,718 10,000 15,231,072 328,827,416 21,589 32,882,742
Dadu 0.990 2,317,005 0.214 495,227 490,374 4,853 10,000,000 48,532,269 10,000 4,853,227 104,777,529 21,589 10,477,753
Hyderabad 0.915 2,623,925 0.508 1,332,831 1,218,873 113,957 10,000,000 1,139,570,083 10,000 113,957,008 2,460,246,339 21,589 246,024,634
Jamshoro 0.994 1,218,663 0.508 619,023 615,557 3,467 10,000,000 34,665,316 10,000 3,466,532 74,839,817 21,589 7,483,982
Matiari 0.780 902,260 0.508 458,306 357,570 100,736 10,000,000 1,007,355,819 10,000 100,735,582 2,174,805,658 21,589 217,480,566
Tando Allah Yar 0.903 819,938 0.508 416,490 376,174 40,316 10,000,000 403,162,267 10,000 40,316,227 870,397,096 21,589 87,039,710
Tando M Khan 0.971 772,086 0.508 392,183 380,810 11,373 10,000,000 113,733,180 10,000 11,373,318 245,541,406 21,589 24,554,141
Karachi Central 0.993 6,119,496 1.000 6,119,496 6,073,600 45,896 10,000,000 458,962,200 10,000 45,896,220 990,864,966 21,589 99,086,497
Karachi East 0.993 3,702,357 1.000 3,702,357 3,674,589 27,768 10,000,000 277,676,775 10,000 27,767,677 599,483,331 21,589 59,948,333
Karachi South 0.993 4,218,944 1.000 4,218,944 4,187,302 31,642 10,000,000 316,420,800 10,000 31,642,080 683,128,775 21,589 68,312,877
Karachi West 0.993 4,208,477 0.907 3,817,089 3,788,460 28,628 10,000,000 286,281,648 10,000 28,628,165 618,060,606 21,589 61,806,061
Korangi 0.993 4,122,657 1.000 4,122,657 4,091,737 30,920 10,000,000 309,199,275 10,000 30,919,927 667,538,044 21,589 66,753,804
Malir 0.993 2,054,672 0.907 1,863,588 1,849,611 13,977 10,000,000 139,769,063 10,000 13,976,906 301,750,924 21,589 30,175,092
Jacobabad 0.956 1,305,942 0.243 317,785 303,898 13,887 10,000,000 138,872,187 10,000 13,887,219 299,814,636 21,589 29,981,464
Kashmore 0.883 1,203,411 0.243 292,836 258,486 34,350 10,000,000 343,496,201 10,000 34,349,620 741,582,535 21,589 74,158,253
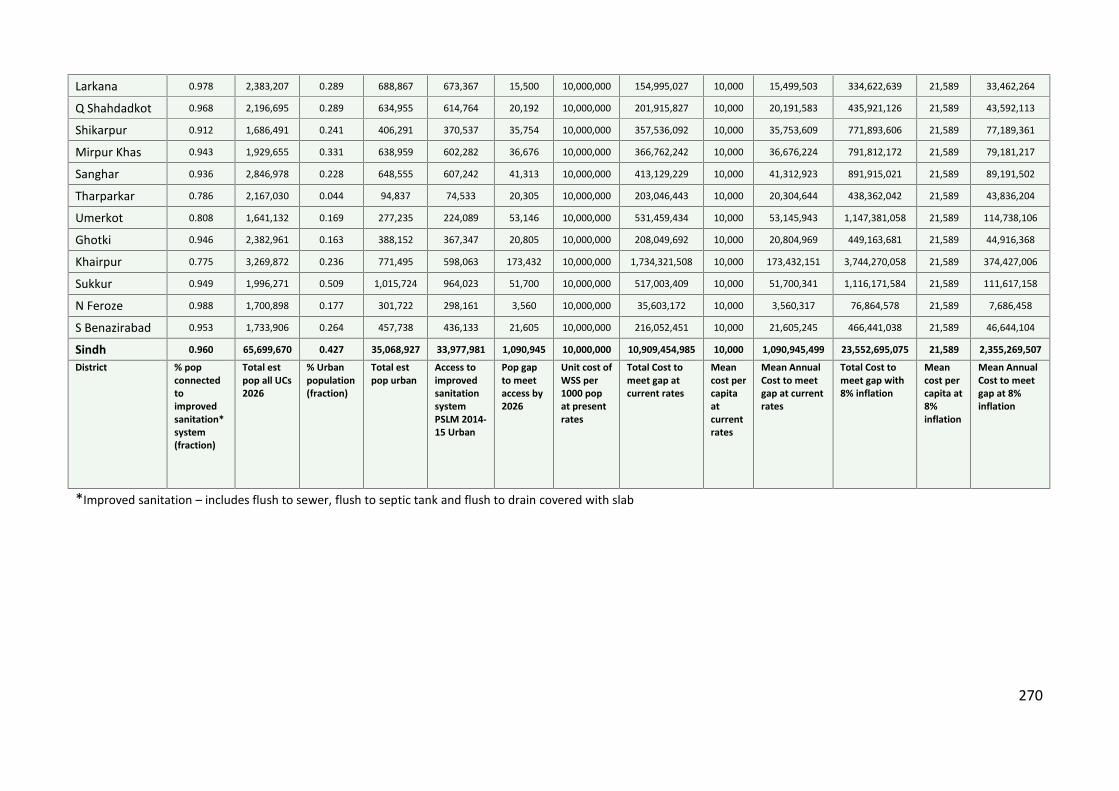
270
Larkana 0.978 2,383,207 0.289 688,867 673,367 15,500 10,000,000 154,995,027 10,000 15,499,503 334,622,639 21,589 33,462,264
Q Shahdadkot 0.968 2,196,695 0.289 634,955 614,764 20,192 10,000,000 201,915,827 10,000 20,191,583 435,921,126 21,589 43,592,113
Shikarpur 0.912 1,686,491 0.241 406,291 370,537 35,754 10,000,000 357,536,092 10,000 35,753,609 771,893,606 21,589 77,189,361
Mirpur Khas 0.943 1,929,655 0.331 638,959 602,282 36,676 10,000,000 366,762,242 10,000 36,676,224 791,812,172 21,589 79,181,217
Sanghar 0.936 2,846,978 0.228 648,555 607,242 41,313 10,000,000 413,129,229 10,000 41,312,923 891,915,021 21,589 89,191,502
Tharparkar 0.786 2,167,030 0.044 94,837 74,533 20,305 10,000,000 203,046,443 10,000 20,304,644 438,362,042 21,589 43,836,204
Umerkot 0.808 1,641,132 0.169 277,235 224,089 53,146 10,000,000 531,459,434 10,000 53,145,943 1,147,381,058 21,589 114,738,106
Ghotki 0.946 2,382,961 0.163 388,152 367,347 20,805 10,000,000 208,049,692 10,000 20,804,969 449,163,681 21,589 44,916,368
Khairpur 0.775 3,269,872 0.236 771,495 598,063 173,432 10,000,000 1,734,321,508 10,000 173,432,151 3,744,270,058 21,589 374,427,006
Sukkur 0.949 1,996,271 0.509 1,015,724 964,023 51,700 10,000,000 517,003,409 10,000 51,700,341 1,116,171,584 21,589 111,617,158
N Feroze 0.988 1,700,898 0.177 301,722 298,161 3,560 10,000,000 35,603,172 10,000 3,560,317 76,864,578 21,589 7,686,458
S Benazirabad 0.953 1,733,906 0.264 457,738 436,133 21,605 10,000,000 216,052,451 10,000 21,605,245 466,441,038 21,589 46,644,104
Sindh 0.960 65,699,670 0.427 35,068,927 33,977,981 1,090,945 10,000,000 10,909,454,985 10,000 1,090,945,499 23,552,695,075 21,589 2,355,269,507
District % popconnectedtoimprovedsanitation*system(fraction)
Total estpop all UCs2026
% Urbanpopulation(fraction)
Total estpop urban
Access toimprovedsanitationsystemPSLM 2014-15 Urban
Pop gapto meetaccess by2026
Unit cost ofWSS per1000 popat presentrates
Total Cost tomeet gap atcurrent rates
Meancost percapitaatcurrentrates
Mean AnnualCost to meetgap at currentrates
Total Cost tomeet gap with8% inflation
Meancost percapita at8%inflation
Mean AnnualCost to meetgap at 8%inflation
*Improved sanitation – includes flush to sewer, flush to septic tank and flush to drain covered with slab

271
Table 32 - Detailed costing of improved rural sanitation system by district
District % popconnectedtoimprovedsanitation*system(fraction)
Total estpop allUCs 2026
% Ruralpopulation(fraction)
Total estpop rural
Access toimprovedsanitationsystemPSLM2014-15Rural
Pop gap tomeetaccess by2026
Unit costof WSS per1000 popat presentrates
Total Cost tomeet gap atcurrent rates
Meancostpercapitaatcurrentrates
Mean AnnualCost to meetgap at currentrates
Total Cost tomeet gap with8% inflation
Meancost percapitaat 8%inflation
Mean AnnualCost to meetgap at 8%inflation
a A B C D E F G H I J K L
[A*B] [a*C] [C-D] 10,000,000 [(E/1000)*F] [G/E] [G/10] [G*1.08^10] [J/E] [J/10]
Badin 0.096 2,075,398 0.836 1,735,588 165,922 1,569,666 10,000,000 15,696,658,923 10,000 1,569,665,892 33,887,909,322 21,589 3,388,790,932
Sujawal 0.026 996,762 0.888 884,817 22,651 862,165 10,000,000 8,621,652,777 10,000 862,165,278 18,613,501,698 21,589 1,861,350,170
Thatta 0.126 1,102,581 0.888 978,751 123,323 855,429 10,000,000 8,554,285,036 10,000 855,428,504 18,468,059,797 21,589 1,846,805,980
Dadu 0.373 2,317,005 0.786 1,821,778 679,341 1,142,437 10,000,000 11,424,368,345 10,000 1,142,436,835 24,664,354,399 21,589 2,466,435,440
Hyderabad 0.384 2,623,925 0.492 1,291,094 495,780 795,314 10,000,000 7,953,142,080 10,000 795,314,208 17,170,237,242 21,589 1,717,023,724
Jamshoro 0.330 1,218,663 0.492 599,640 197,701 401,938 10,000,000 4,019,383,603 10,000 401,938,360 8,677,547,735 21,589 867,754,773
Matiari 0.181 902,260 0.492 443,954 80,400 363,554 10,000,000 3,635,542,172 10,000 363,554,217 7,848,862,873 21,589 784,886,287
Tando Allah Yar 0.196 819,938 0.492 403,448 79,197 324,251 10,000,000 3,242,512,015 10,000 324,251,202 7,000,340,243 21,589 700,034,024
Tando M Khan 0.250 772,086 0.492 379,903 94,938 284,965 10,000,000 2,849,649,555 10,000 284,964,956 6,152,179,658 21,589 615,217,966
Karachi Central 0.634 6,119,496 0.000 - - - 10,000,000 - #DIV/0! - - #DIV/0! -
Karachi East 0.634 3,702,357 0.000 - - - 10,000,000 - #DIV/0! - - #DIV/0! -
Karachi South 0.634 4,218,944 0.000 - - - 10,000,000 - #DIV/0! - - #DIV/0! -
Karachi West 0.634 4,208,477 0.093 391,388 248,140 143,248 10,000,000 1,432,481,401 10,000 143,248,140 3,092,619,905 21,589 309,261,991
Korangi 0.634 4,122,657 0.000 - - - 10,000,000 - #DIV/0! - - #DIV/0! -
Malir 0.634 2,054,672 0.093 191,084 121,148 69,937 10,000,000 699,369,255 10,000 69,936,926 1,509,885,768 21,589 150,988,577
Jacobabad 0.244 1,305,942 0.757 988,157 241,209 746,948 10,000,000 7,469,476,303 10,000 746,947,630 16,126,039,108 21,589 1,612,603,911
Kashmore 0.291 1,203,411 0.757 910,575 265,160 645,416 10,000,000 6,454,158,180 10,000 645,415,818 13,934,043,431 21,589 1,393,404,343
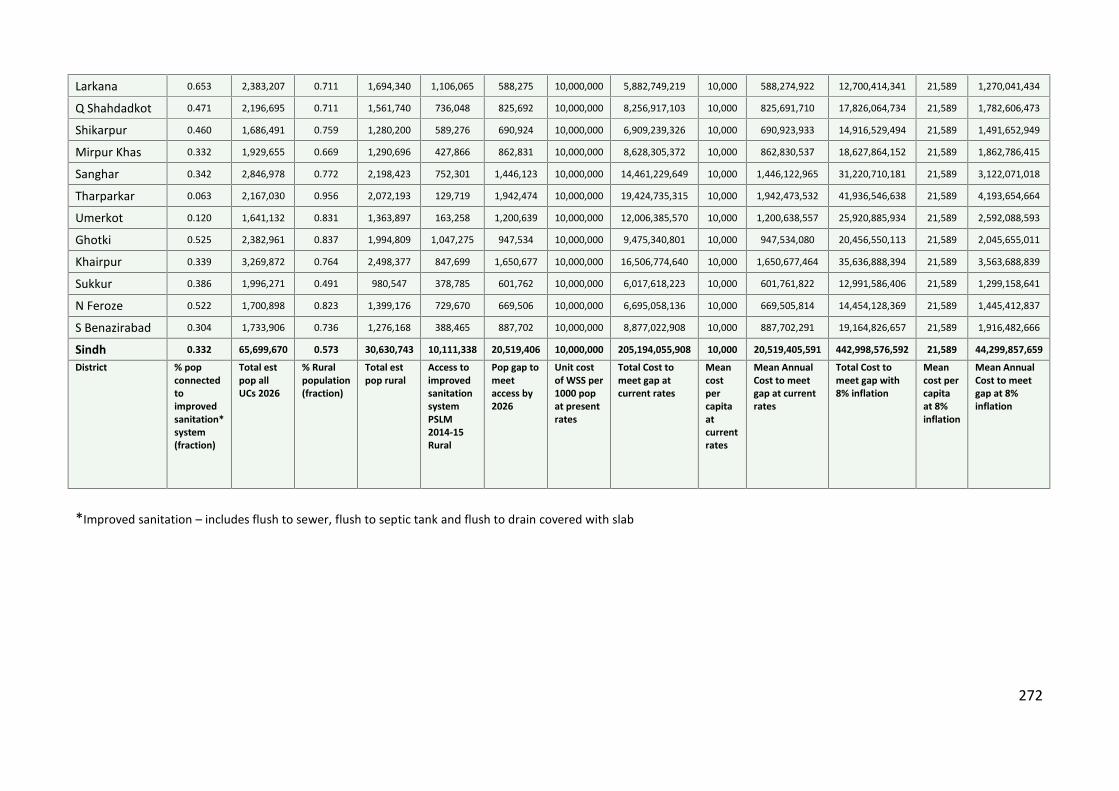
272
Larkana 0.653 2,383,207 0.711 1,694,340 1,106,065 588,275 10,000,000 5,882,749,219 10,000 588,274,922 12,700,414,341 21,589 1,270,041,434
Q Shahdadkot 0.471 2,196,695 0.711 1,561,740 736,048 825,692 10,000,000 8,256,917,103 10,000 825,691,710 17,826,064,734 21,589 1,782,606,473
Shikarpur 0.460 1,686,491 0.759 1,280,200 589,276 690,924 10,000,000 6,909,239,326 10,000 690,923,933 14,916,529,494 21,589 1,491,652,949
Mirpur Khas 0.332 1,929,655 0.669 1,290,696 427,866 862,831 10,000,000 8,628,305,372 10,000 862,830,537 18,627,864,152 21,589 1,862,786,415
Sanghar 0.342 2,846,978 0.772 2,198,423 752,301 1,446,123 10,000,000 14,461,229,649 10,000 1,446,122,965 31,220,710,181 21,589 3,122,071,018
Tharparkar 0.063 2,167,030 0.956 2,072,193 129,719 1,942,474 10,000,000 19,424,735,315 10,000 1,942,473,532 41,936,546,638 21,589 4,193,654,664
Umerkot 0.120 1,641,132 0.831 1,363,897 163,258 1,200,639 10,000,000 12,006,385,570 10,000 1,200,638,557 25,920,885,934 21,589 2,592,088,593
Ghotki 0.525 2,382,961 0.837 1,994,809 1,047,275 947,534 10,000,000 9,475,340,801 10,000 947,534,080 20,456,550,113 21,589 2,045,655,011
Khairpur 0.339 3,269,872 0.764 2,498,377 847,699 1,650,677 10,000,000 16,506,774,640 10,000 1,650,677,464 35,636,888,394 21,589 3,563,688,839
Sukkur 0.386 1,996,271 0.491 980,547 378,785 601,762 10,000,000 6,017,618,223 10,000 601,761,822 12,991,586,406 21,589 1,299,158,641
N Feroze 0.522 1,700,898 0.823 1,399,176 729,670 669,506 10,000,000 6,695,058,136 10,000 669,505,814 14,454,128,369 21,589 1,445,412,837
S Benazirabad 0.304 1,733,906 0.736 1,276,168 388,465 887,702 10,000,000 8,877,022,908 10,000 887,702,291 19,164,826,657 21,589 1,916,482,666
Sindh 0.332 65,699,670 0.573 30,630,743 10,111,338 20,519,406 10,000,000 205,194,055,908 10,000 20,519,405,591 442,998,576,592 21,589 44,299,857,659
District % popconnectedtoimprovedsanitation*system(fraction)
Total estpop allUCs 2026
% Ruralpopulation(fraction)
Total estpop rural
Access toimprovedsanitationsystemPSLM2014-15Rural
Pop gap tomeetaccess by2026
Unit costof WSS per1000 popat presentrates
Total Cost tomeet gap atcurrent rates
Meancostpercapitaatcurrentrates
Mean AnnualCost to meetgap at currentrates
Total Cost tomeet gap with8% inflation
Meancost percapitaat 8%inflation
Mean AnnualCost to meetgap at 8%inflation
*Improved sanitation – includes flush to sewer, flush to septic tank and flush to drain covered with slab

273
Table 33 - Missing facilities (drinking water) in public sector primary schools
District Total schools Schools with DW % Gap Cost @ 150,000 per school
Badin 2886 1762 61% 1124 168,600,000Sujawal 1610 225 14% 1385 207,750,000Thatta 1441 259 18% 1182 177,300,000Dadu 1965 751 38% 1214 182,100,000Hyderabad 779 464 60% 315 47,250,000Jamshoro 745 249 33% 496 74,400,000Matiari 1976 572 29% 1404 210,600,000Tando A Yar 747 357 48% 390 58,500,000Tando M Khan 976 454 47% 522 78,300,000Karachi Central 390 275 71% 115 17,250,000Karachi East 219 166 76% 53 7,950,000Karachi South 393 222 56% 171 25,650,000Karachi West 324 204 63% 120 18,000,000Korangi 470 322 69% 148 22,200,000Malir 512 216 42% 296 44,400,000Jacobabad 1368 466 34% 902 135,300,000Kashmore 1393 568 41% 825 123,750,000Larkana 1048 840 80% 208 31,200,000Q Shahdadkot 1519 529 35% 990 148,500,000Shikarpur 1199 675 56% 524 78,600,000Mirpur Khas 857 538 63% 319 47,850,000Sanghar 2471 1776 72% 695 104,250,000Tharparkar 3751 663 18% 3088 463,200,000

274
Umerkot 2150 476 22% 1674 251,100,000Ghotki 1875 1284 68% 591 88,650,000Khairpur 3140 2497 80% 643 96,450,000Sukkur 1123 813 72% 310 46,500,000N Feroze 2178 1765 81% 413 61,950,000S Benazirabad 2837 1172 41% 1665 249,750,000Sindh 42342 20560 49% 21782 3,267,300,000District Total schools Schools with DW % Gap Cost @ 150,000 per school
Computed from the following source: Pakistan Education Atlas 2015. National Education Management Information System (NEMIS), Academy of Educational Planning and Management (AEPAM), Government of Pakistan and
Vulnerability Analysis and Mapping (VAM) Unit, United Nations World Food Programme (WFP) Pakistan

275
Table 34 - Missing facilities (latrines) in public sector primary schools
District Totalschools Schools with Latrines % Gap Cost @ 150,000 per school
Badin 2886 1743 60% 1143 171,450,000Sujawal 1610 444 28% 1166 174,900,000Thatta 1441 451 31% 990 148,500,000Dadu 1965 979 50% 986 147,900,000Hyderabad 779 603 77% 176 26,400,000Jamshoro 745 418 56% 327 49,050,000Matiari 1976 856 43% 1120 168,000,000Tando A Yar 747 500 67% 247 37,050,000Tando M Khan 976 475 49% 501 75,150,000Karachi Central 390 335 86% 55 8,250,000Karachi East 219 202 92% 17 2,550,000Karachi South 393 333 85% 60 9,000,000Karachi West 324 269 83% 55 8,250,000Korangi 470 423 90% 47 7,050,000Malir 512 390 76% 122 18,300,000Jacobabad 1368 582 43% 786 117,900,000Kashmore 1393 345 25% 1048 157,200,000Larkana 1048 797 76% 251 37,650,000Q Shahdadkot 1519 709 47% 810 121,500,000Shikarpur 1199 652 54% 547 82,050,000Mirpur Khas 857 658 77% 199 29,850,000Sanghar 2471 1680 68% 791 118,650,000

276
Tharparkar 3751 1386 37% 2365 354,750,000Umerkot 2150 1276 59% 874 131,100,000Ghotki 1875 843 45% 1032 154,800,000Khairpur 3140 2113 67% 1027 154,050,000Sukkur 1123 793 71% 330 49,500,000N Feroze 2178 1257 58% 921 138,150,000S Benazirabad 2837 1421 50% 1416 212,400,000Sindh 42342 22933 54% 19409 2,911,350,000
District Totalschools Schools with Latrines % Gap Cost @ 150,000 per school
Computed from the following source: Pakistan Education Atlas 2015. National Education Management Information System (NEMIS), Academy of Educational Planning and Management (AEPAM), Government of Pakistan and
Vulnerability Analysis and Mapping (VAM) Unit, United Nations World Food Programme (WFP) Pakistan

277
Table 35 - Missing facilities (drinking water) in public sector middle and secondary schools
District Total schools Schools with DW % Gap Cost @ 150,000 per school
Badin 178 141 79% 37 5,550,000Sujawal 56 18 32% 38 5,700,000Thatta 97 43 44% 54 8,100,000Dadu 140 96 69% 44 6,600,000Hyderabad 164 146 89% 18 2,700,000Jamshoro 74 47 64% 27 4,050,000Matiari 191 119 62% 72 10,800,000Tando A Yar 89 53 60% 36 5,400,000Tando M Khan 67 44 66% 23 3,450,000Karachi Central 254 209 82% 45 6,750,000Karachi East 119 100 84% 19 2,850,000Karachi South 180 138 77% 42 6,300,000Karachi West 98 77 79% 21 3,150,000Korangi 207 145 70% 62 9,300,000Malir 135 91 67% 44 6,600,000Jacobabad 101 41 41% 60 9,000,000Kashmore 102 70 69% 32 4,800,000Larkana 142 125 88% 17 2,550,000Q Shahdadkot 112 61 54% 51 7,650,000Shikarpur 128 96 75% 32 4,800,000Mirpur Khas 69 59 86% 10 1,500,000Sanghar 206 177 86% 29 4,350,000Tharparkar 294 81 28% 213 31,950,000

278
Umerkot 150 70 47% 80 12,000,000Ghotki 123 104 85% 19 2,850,000Khairpur 330 305 92% 25 3,750,000Sukkur 153 141 92% 12 1,800,000N Feroze 238 202 85% 36 5,400,000S Benazirabad 185 118 64% 67 10,050,000Sindh 4382 3117 71% 1265 189,750,000District Total schools Schools with DW % Gap Cost @ 150,000 per school
Computed from the following source: Pakistan Education Atlas 2015. National Education Management Information System (NEMIS), Academy of Educational Planning and Management (AEPAM), Government of Pakistan and
Vulnerability Analysis and Mapping (VAM) Unit, United Nations World Food Programme (WFP) Pakistan

279
Table 36 - Missing facilities (latrines) in public sector middle and secondary schools
District Totalschools Schools with Latrines % Gap Cost @ 150,000 per school
Badin 178 161 90% 17 2,550,000Sujawal 56 35 63% 21 3,150,000Thatta 97 58 60% 39 5,850,000Dadu 140 112 80% 28 4,200,000Hyderabad 164 154 94% 10 1,500,000Jamshoro 74 59 80% 15 2,250,000Matiari 191 136 71% 55 8,250,000Tando A Yar 89 69 78% 20 3,000,000Tando M Khan 67 54 81% 13 1,950,000Karachi Central 254 235 93% 19 2,850,000Karachi East 119 115 97% 4 600,000Karachi South 180 171 95% 9 1,350,000Karachi West 98 95 97% 3 450,000Korangi 207 198 96% 9 1,350,000Malir 135 131 97% 4 600,000Jacobabad 101 56 55% 45 6,750,000Kashmore 102 64 63% 38 5,700,000Larkana 142 122 86% 20 3,000,000Q Shahdadkot 112 78 70% 34 5,100,000Shikarpur 128 91 71% 37 5,550,000Mirpur Khas 69 61 88% 8 1,200,000Sanghar 206 186 90% 20 3,000,000

280
Tharparkar 294 158 54% 136 20,400,000Umerkot 150 120 80% 30 4,500,000Ghotki 123 93 76% 30 4,500,000Khairpur 330 294 89% 36 5,400,000Sukkur 153 144 94% 9 1,350,000N Feroze 238 184 77% 54 8,100,000S Benazirabad 185 145 78% 40 6,000,000Sindh 4382 3579 82% 803 120,450,000
District Totalschools Schools with Latrines % Gap Cost @ 150,000 per school
Computed from the following source: Pakistan Education Atlas 2015. National Education Management Information System (NEMIS), Academy of Educational Planning and Management (AEPAM), Government of Pakistan and
Vulnerability Analysis and Mapping (VAM) Unit, United Nations World Food Programme (WFP) Pakistan

281
Table 37 - Missing facilities (water and sanitation) at Basic Health Units
Number of BHUsrequiring Water Supplyand Tank (20% of BHUs)
Cost @ PKR 150,000 perBHU for Water Supply and
Tank
Number of BHUs requiringSanitation Facilities (20%
of BHUs)
Cost @ PKR 150,000 perBHU for Sanitation
FacilitiesTotal cost
Badin 7 1,050,000 7 1,050,000 2,100,000Sujawal 6 900,000 6 900,000 1,800,000Thatta 4 600,000 4 600,000 1,200,000Dadu 9 1,350,000 9 1,350,000 2,700,000Hyderabad 4 600,000 4 600,000 1,200,000Jamshoro 4 600,000 4 600,000 1,200,000Matiari 4 600,000 4 600,000 1,200,000Tando A Yar 3 450,000 3 450,000 900,000Tando M Khan 3 450,000 3 450,000 900,000Karachi 7 1,050,000 7 1,050,000 2,100,000Jacobabad 5 750,000 5 750,000 1,500,000Kashmore 4 600,000 4 600,000 1,200,000Larkana 6 900,000 6 900,000 1,800,000Q Shahdadkot 6 900,000 6 900,000 1,800,000Shikarpur 7 1,050,000 7 1,050,000 2,100,000Mirpur Khas 8 1,200,000 8 1,200,000 2,400,000Sanghar 12 1,800,000 12 1,800,000 3,600,000Tharparkar 7 1,050,000 7 1,050,000 2,100,000Umerkot 6 900,000 6 900,000 1,800,000Ghotki 7 1,050,000 7 1,050,000 2,100,000Khairpur 16 2,400,000 16 2,400,000 4,800,000Sukkur 5 750,000 5 750,000 1,500,000
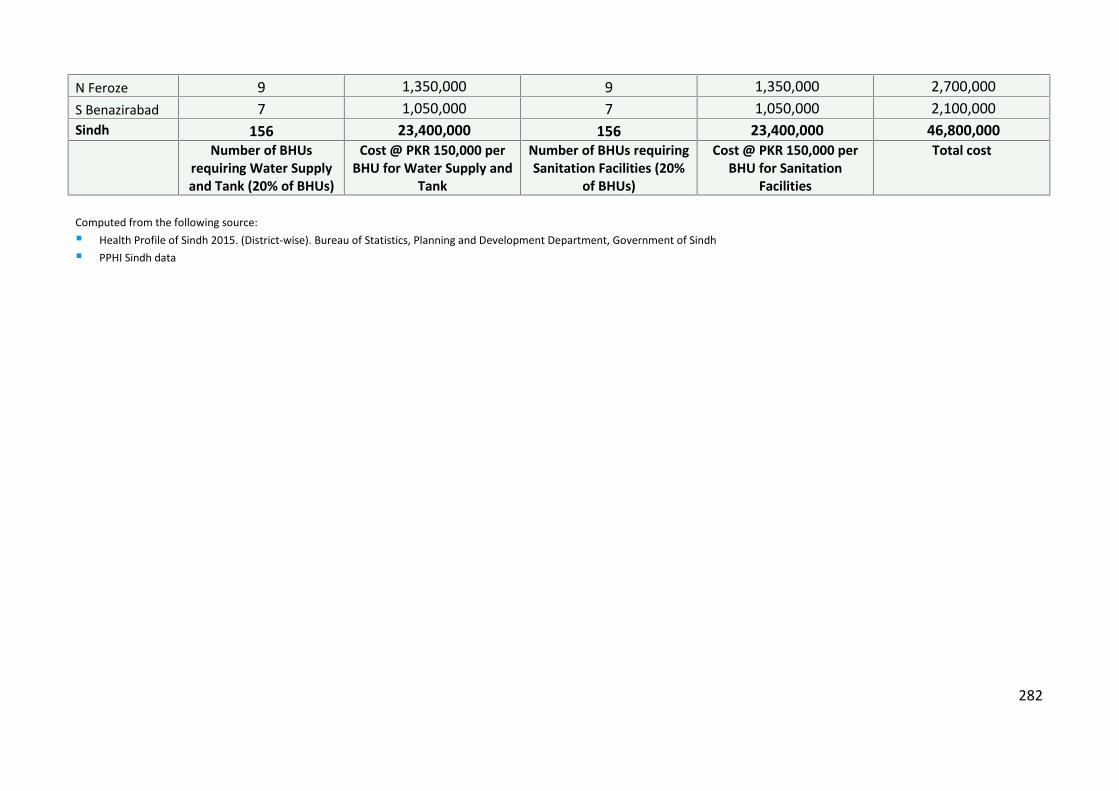
282
N Feroze 9 1,350,000 9 1,350,000 2,700,000S Benazirabad 7 1,050,000 7 1,050,000 2,100,000Sindh 156 23,400,000 156 23,400,000 46,800,000
Number of BHUsrequiring Water Supplyand Tank (20% of BHUs)
Cost @ PKR 150,000 perBHU for Water Supply and
Tank
Number of BHUs requiringSanitation Facilities (20%
of BHUs)
Cost @ PKR 150,000 perBHU for Sanitation
Facilities
Total cost
Computed from the following source: Health Profile of Sindh 2015. (District-wise). Bureau of Statistics, Planning and Development Department, Government of Sindh PPHI Sindh data

283
Table 38 - Indirect Cost Legislation and Policies
ThematicArea
Strategic Actions Unit cost Units Short Term Medium Term Long Term Total2016-19 2019-22 2022-26
Legislationand Policies
Conduct a review of the SLGA and developRules of Business for LG&HTPD andPHE&RDD
5,000,000 5,000,000 5,000,000
Legislative review of drinking water acts,policies, regulations and development ofharmonised new acts, regulations andguidelines
10,000,000 10,000,000 10,000,000
Legislative review of sanitation, sewerageand drainage acts, policies, regulationsand development of harmonised new acts,regulations and guidelines
10,000,000 10,000,000 10,000,000
Development Standard OperatingProcedures for water planning,management and O&M for PHE&RDD
5,000,000 5,000,000 5,000,000
Development of Standard OperatingProcedures for wastewater and solidwaste planning, management and O&Mfor LG&HTPD
5,000,000 5,000,000 5,000,000
Development of guidelines for CBOs forproject management and O&M of watersupply schemes
1,000,000 1,000,000 1,000,000
Development of guidelines for CBOs forproject management and O&M for 1,000,000 1,000,000 1,000,000

284
sanitation, sewerage and drainageschemesOrientation and capacity buildingprogramme of 2 big cities, 119 town and1297 union council officials on applicationof regulations, policies and strategies inplanning, development and delivery ofmunicipal services that are integrated,safely managed and nutrition-sensitive
20,000,000 5,000,000 5,000,000 10,000,000 20,000,000
SubtotalLegislationand Policies
42,000,000 5,000,000 10,000,000 57,000,000

285
Table 39 - Indirect Costs Water Resources
ThematicArea
Strategic Actions Unit cost Units Short Term Medium Term Long Term Total2016-19 2019-22 2022-26
WaterResources
Conduct a study on water resourcemanagement and development in eachdistrict (5 districts in short term, 10districts in medium term, and 14 districtsin long term)
5,000,000 29 25,000,000 50,000,000 70000000 145,000,000
Water safety planning at district levelincluding disaster risk reduction (5 districtsin short term, 10 districts in medium term,and 14 districts in long term)
2,000,000 29 10,000,000 20,000,000 26000000 56,000,000
Sub-sector climate change adaptation andmitigation strategies developed withpiloting in selected districts
10,000,000 15,000,000 25000000 50,000,000
Need assessment and capacity buildingprogramme of city, town and unioncouncil officials in pilot areas on climatechange mitigation strategies
20,000,000 5,000,000 5,000,000 10,000,000 20,000,000
Pilot rainwater harvesting To bedetermined
SubtotalWaterResources
50,000,000 90,000,000 131,000,000 271,000,000

286
Table 40 - Indirect Costs Water Supply
ThematicArea
Strategic Actions Unit cost Units Short Term Medium Term Long Term Total2016-19 2019-22 2022-26
WaterSupply
Rehabilitate 74 non-functional watersupply schemes per year (total 538schemes plus additional 200 schemes inlong term)
1,000,000 740 222,000,000 222,000,000 296,000,000 740,000,000
Replace ageing water supply schemes (50schemes per year) 5,000,000 500 750,000,000 750,000,000 1,000,000,000 2,500,000,000
Upgrade 119 township schemes (12 peryear) 100,000,000 119 3,600,000,000 3,600,000,000 4,800,000,000 12,000,000,000
Water supply schemes converted to solarenergy (60 units per year) 5,000,000 600 900,000,000 900,000,000 1,200,000,000 3,000,000,000
Community awareness, leaflets, billboardsfor water use 1,000,000 29 87,000,000 87,000,000 116,000,000 290,000,000
Recruitment of 2594 Social Mobilisers – 2per UC 600,000 2594 4,669,200,000 4,669,200,000 6,225,600,000 15,564,000,000
Travel cost of Social Mobilisers 120,000 2594 933,840,000 933,840,000 1,245,120,000 3,112,800,000
SubtotalWaterSupply
11,162,040,000 11,162,040,000 14,882,720,000 37,206,800,000
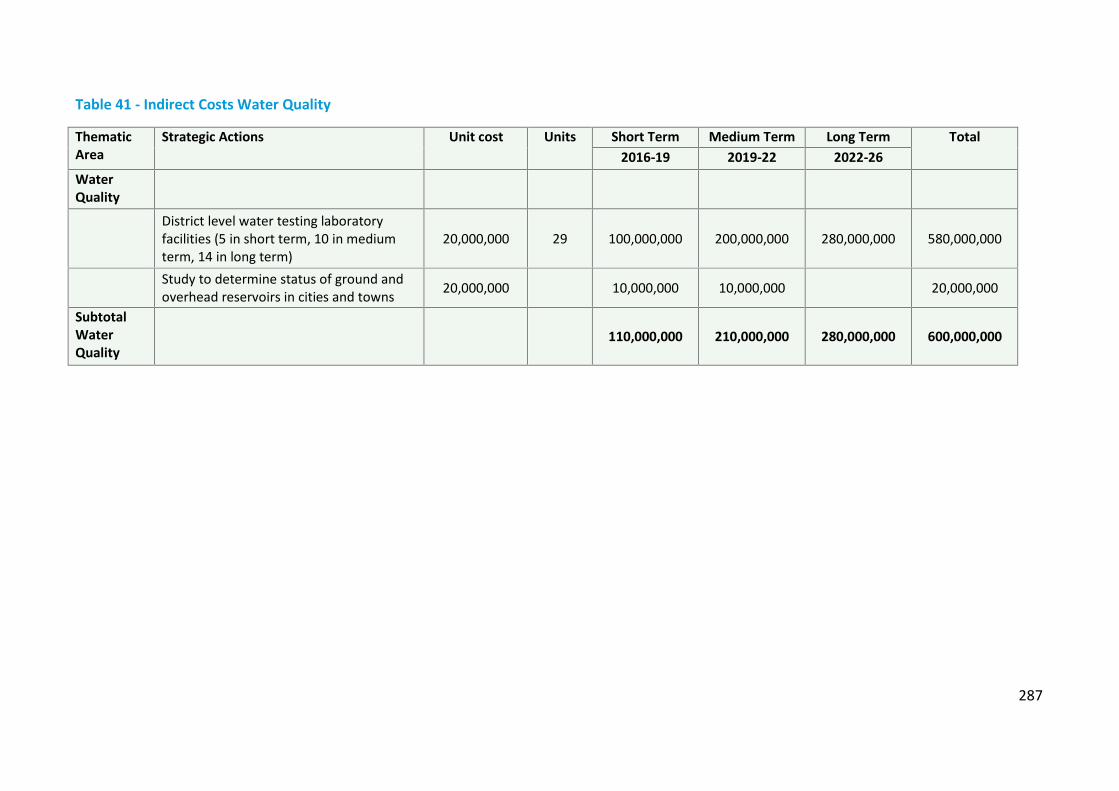
287
Table 41 - Indirect Costs Water Quality
ThematicArea
Strategic Actions Unit cost Units Short Term Medium Term Long Term Total2016-19 2019-22 2022-26
WaterQuality
District level water testing laboratoryfacilities (5 in short term, 10 in mediumterm, 14 in long term)
20,000,000 29 100,000,000 200,000,000 280,000,000 580,000,000
Study to determine status of ground andoverhead reservoirs in cities and towns 20,000,000 10,000,000 10,000,000 20,000,000
SubtotalWaterQuality
110,000,000 210,000,000 280,000,000 600,000,000

288
Table 42 - Indirect Costs Sanitation
ThematicArea
Strategic Actions Unit cost Units Short Term Medium Term Long Term Total2016-19 2019-22 2022-26
SanitationEstablish wastewater treatment plants in119 towns (12 per year) 15,000,000 119 540,000,000 540,000,000 705,000,000 1,785,000,000
Community awareness, leaflets, billboardsfor safe sanitation and hygiene (1297 Ucsin 29 districts)
1,000,000 29 87,000,000 87,000,000 116,000,000 290,000,000
Recruitment of 2594 Social Mobilisers – 2per UC 600,000 2594 4,669,200,000 4,669,200,000 6,225,600,000 15,564,000,000
Travel cost of Social Mobilisers 120,000 2594 933,840,000 933,840,000 1,245,120,000 3,112,800,000
SubtotalSanitation 6,230,040,000 6,230,040,000 8,291,720,000 20,751,800,000
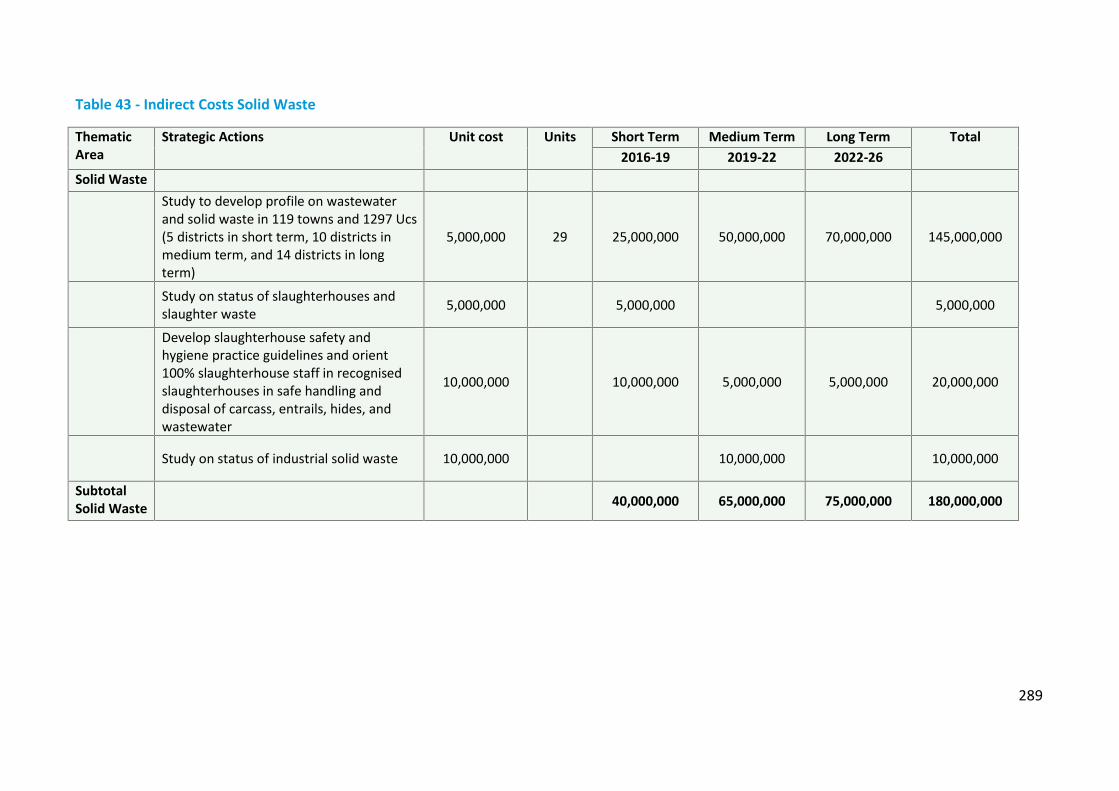
289
Table 43 - Indirect Costs Solid Waste
ThematicArea
Strategic Actions Unit cost Units Short Term Medium Term Long Term Total2016-19 2019-22 2022-26
Solid WasteStudy to develop profile on wastewaterand solid waste in 119 towns and 1297 Ucs(5 districts in short term, 10 districts inmedium term, and 14 districts in longterm)
5,000,000 29 25,000,000 50,000,000 70,000,000 145,000,000
Study on status of slaughterhouses andslaughter waste 5,000,000 5,000,000 5,000,000
Develop slaughterhouse safety andhygiene practice guidelines and orient100% slaughterhouse staff in recognisedslaughterhouses in safe handling anddisposal of carcass, entrails, hides, andwastewater
10,000,000 10,000,000 5,000,000 5,000,000 20,000,000
Study on status of industrial solid waste 10,000,000 10,000,000 10,000,000
SubtotalSolid Waste 40,000,000 65,000,000 75,000,000 180,000,000

290
Table 44 - Indirect Costs Health and Hygiene
ThematicArea
Strategic Actions Unit cost Units Short Term Medium Term Long Term Total2016-19 2019-22 2022-26
Health andHygiene
Conduct a situation analysis of WASHservices in all health facilities 10,000,000 10,000,000 10,000,000
Address missing facilities for water supplyin Basic Health Units (extension of waterdistribution pipe from water supplyscheme, water tank per BHU) - missingWASH facilities in other health facilities tobe costed after situation analysis anddevelopment of JAP
150,000 156 23,400,000 23,400,000
Address missing facilities for sanitation inBasic Health Units (2 latrines per BHU) -missing WASH facilities in other healthfacilities to be costed after situationanalysis and development of JAP
150,000 156 23,400,000 23,400,000
Implement Hospital Waste ManagementRules in 88 hospitals (9 hospitals per year) 20,000,000 88 540,000,000 540,000,000 680,000,000 1,760,000,000
Develop WASH health education moduleand add to curriculum ofLHWs/CMWs/LHVs with supportingtraining material
2,000,000 2,000,000 2,000,000
Develop WASH IEC and health promotionand hygiene education material for healthfacilities, health campaigns, advocacy andBCC campaigns, and media
5,000,000 5,000,000 1,000,000 1,000,000 7,000,000

291
SubtotalHealth andHygiene
603,800,000 541,000,000 681,000,000 1,825,800,000

292
Table 45 - Indirect Costs Education
ThematicArea
Strategic Actions Unit cost Units Short Term Medium Term Long Term Total
2016-19 2019-22 2022-26EducationSupplementto WinSstrategicplan 2017-2022
Address missing facilities for water supplyin primary schools (30% in short term, 30%in medium term, 40% in long term)extension of water distribution pipe fromwater supply scheme, water tank)
150,000 21,782 980,190,000 980,190,000 1,306,920,000 3,267,300,000
Supplementto WinSstrategicplan 2017-2022
Address missing facilities for water supplyin middle and high schools (30% in shortterm, 30% in medium term, 40% in longterm) extension of water distribution pipefrom water supply scheme, water tank)
150,000 1,265 56,925,000 56,925,000 75,900,000 189,750,000
Supplementto WinSstrategicplan 2017-2022
Address missing facilities for sanitation inprimary schools (30% in short term, 30% inmedium term, 40% in long term) (2latrines per school)
150,000 19,409 873,405,000 873,405,000 1,164,540,000 2,911,350,000
Supplementto WinSstrategicplan 2017-2022
Address missing facilities for sanitation inmiddle and high schools (30% in shortterm, 30% in medium term, 40% in longterm) (2 latrines per school)
150,000 843 37,935,000 37,935,000 50,580,000 126,450,000
SubtotalEducation 1,948,455,000 1,948,455,000 2,597,940,000 6,494,850,000

293
Table 46 - Indirect Costs Sector Efficiency and Capacity
ThematicArea
Strategic Actions Unit cost Units Short Term Medium Term Long Term Total2016-19 2019-22 2022-26
SectorEfficiencyandCapacity
Conduct a human resource capacity,infrastructure and training capacity, andtraining needs assessment in the sub-sectors and develop a human resourcedevelopment plan
10,000,000 10,000,000
Local Government Technical training/workshops for each LG staff - O&M, DRR,Record Keeping, Management andCommunity Mobilisation – 2 trainingworkshops per town per year (29 districts)
5,000,000 29 435,000,000 435,000,000 580,000,000 1,450,000,000
Capacity development of CBOs and civilsociety in O&M of sanitation schemes (LG)2 workshops per town per year (29districts)
5,000,000 29 435,000,000 435,000,000 580,000,000 1,450,000,000
PHED Technical training /workshops foreach district PHED staff - O&M, DRR,Record – 5 training workshops per districtper year
5,000,000 29 435,000,000 435,000,000 580,000,000 1,450,000,000
Capacity development of CBOs and civilsociety in O&M of water supply schemes(PHED) (5 workshops per district per year)
5,000,000 29 435,000,000 435,000,000 580,000,000 1,450,000,000
294
SubtotalSectorEfficiencyandCapacity
1,750,000,000 1,740,000,000 2,320,000,000 5,810,000,000
Table 47 - Indirect Costs Sector Financing
ThematicArea
Strategic Actions Unit cost Units Short Term Medium Term Long Term Total2016-19 2019-22 2022-26
SectorFinancing
Conduct a financial budgeting andexpenditure review of sectoral budgetsand expenditures
10,000,000 10,000,000 10,000,000
SubtotalSectorFinancing
10,000,000 10,000,000

295
Table 48 - Indirect Costs Sector Coordination
ThematicArea
Strategic Actions Unit cost Units Short Term Medium Term Long Term Total2016-19 2019-22 2022-26
SectorCoordination
Establish a Programme Management Unit 116,000,000 114,000,000 157,000,000 387,000,000SubtotalSectorCoordination 116,000,000 114,000,000 157,000,000 387,000,000

296
Table 49 - Indirect Costs Sector Monitoring
ThematicArea
Strategic Actions Unit cost Units Short Term Medium Term Long Term Total2016-19 2019-22 2022-26
SectorMonitoring
Establish district monitoring unit - officecosts - 1 office per district based at DCOffice
2,400,000 29 208,800,000 208,800,000 278,400,000 696,000,000
Procure computers and accessories forMIS – 5 sets per district for water supplyschemes
375,000 29 10,875,000 10,875,000
Computerised MIS for water supplyschemes – 29 districts 250,000 29 7,250,000 7,250,000
Procure computers and accessories forMIS – 5 sets per district for sanitation,sewerage and drainage schemes
375,000 29 10,875,000 10,875,000
Computerised MIS for sanitation,sewerage and drainage schemes – 29districts
250,000 29 7,250,000 7,250,000
District M&E Manager 1,200,000 29 104,400,000 104,400,000 139,200,000 348,000,000
Water and Sanitation Reporting Officers –2 per district 1,440,000 29 125,280,000 125,280,000 167,040,000 417,600,000

297
Drivers - 1 per district 240,000 29 20,880,000 20,880,000 27,840,000 69,600,000
Travel and maintenance of vehicles forWater and Sanitation Reporting Officers 600,000 29 52,200,000 52,200,000 69,600,000 174,000,000
Vehicles for Water and SanitationReporting Officers (1 per district) 2,500,000 29 72,500,000 72,500,000
SubtotalSectorMonitoring 620,310,000 511,560,000 682,080,000 1,813,950,000

298
Table 50 - District notional estimates (safely managed water supply and sanitation)
District Urban Water and Sanitation CostsO&M Costs
Urban Waterand Sanitation
Rural Water and Sanitation CostsO&M Costs
Rural Water andSanitation
Primary Schools Water andSanitation Costs
Numberof UCs
Urban safelymanaged Water
Urban safelymanagedSanitation
O&M 10%Urban
Rural safelymanaged Water
Rural safelymanagedSanitation
O&M 10% RuralPrimarySchoolsWater
PrimarySchools
Sanitation
Badin 49 3,439,555,644 4,676,123,811 811,567,945 24,609,771,694 24,721,717,127 4,933,148,882 168,600,000 171,450,000
Sujawal 29 636,745,536 1,585,315,034 222,206,057 13,098,382,275 13,197,924,140 2,629,630,641 207,750,000 174,900,000
Thatta 34 538,659,855 733,134,637 127,179,449 12,364,563,256 14,646,032,182 2,701,059,544 177,300,000 148,500,000
Dadu 55 3,836,773,026 7,347,438,917 1,118,421,194 24,927,385,117 27,075,261,099 5,200,264,622 182,100,000 147,900,000
Hyderabad 116 5,867,786,305 15,794,041,503 2,166,182,781 17,315,513,799 15,030,276,545 3,234,579,034 47,250,000 26,400,000
Jamshoro 30 3,105,021,850 7,508,135,969 1,061,315,782 5,508,288,495 8,694,173,186 1,420,246,168 74,400,000 49,050,000
Matiari 25 5,906,643,218 6,777,653,106 1,268,429,632 6,557,427,726 6,478,847,806 1,303,627,553 210,600,000 168,000,000
Tando Allah Yar 30 5,378,967,644 5,956,222,709 1,133,519,035 5,936,738,124 5,783,024,415 1,171,976,254 58,500,000 37,050,000
Tando M Khan 31 3,977,916,020 5,368,010,009 934,592,603 5,668,906,901 4,912,140,881 1,058,104,778 78,300,000 75,150,000
Karachi Central 42 15,154,931,844 688,443,300 1,584,337,514 - - - 17,250,000 8,250,000
Karachi East 26 9,168,887,111 416,515,162 958,540,227 - - - 7,950,000 2,550,000
Karachi South 30 10,448,214,816 474,631,200 1,092,284,602 - - - 25,650,000 9,000,000
Karachi West 30 9,453,020,014 429,422,472 988,244,249 2,495,100,801 2,458,701,684 495,380,249 18,000,000 8,250,000
Korangi 28 10,209,760,061 463,798,912 1,067,355,897 - - - 22,200,000 7,050,000
Malir 25 4,615,174,454 209,653,594 482,482,805 1,218,163,662 1,200,392,804 241,855,647 44,400,000 18,300,000
Jacobabad 42 4,609,476,145 4,490,783,326 910,025,947 14,709,700,258 13,861,861,831 2,857,156,209 135,300,000 117,900,000
Kashmore 44 4,137,767,537 3,653,710,231 779,147,777 13,658,630,459 11,291,589,801 2,495,022,026 123,750,000 157,200,000
Larkana 43 10,191,439,684 10,085,009,765 2,027,644,945 25,298,193,717 25,059,291,747 5,035,748,546 31,200,000 37,650,000
Q Shahdadkot 43 7,156,582,660 9,158,597,133 1,631,517,979 22,332,094,971 20,343,219,629 4,267,531,460 148,500,000 121,500,000

299
Shikarpur 52 5,954,194,805 5,716,514,562 1,167,070,937 19,118,506,596 18,907,273,599 3,802,578,019 78,600,000 82,050,000
Mirpur Khas 41 1,982,049,606 5,318,371,984 730,042,159 18,258,836,491 14,926,903,759 3,318,574,025 47,850,000 29,850,000
Sanghar 69 8,274,907,125 8,513,250,911 1,678,815,804 31,710,060,271 29,932,634,888 6,164,269,516 104,250,000 118,650,000
Tharparkar 46 502,447,481 1,347,304,669 184,975,215 30,709,897,309 30,666,381,260 6,137,627,857 463,200,000 354,750,000
Umerkot 34 1,885,475,020 3,736,850,138 562,232,516 17,725,205,824 19,703,538,468 3,742,874,429 251,100,000 131,100,000
Ghotki 75 5,451,406,527 5,222,008,452 1,067,341,498 28,479,882,235 24,712,686,213 5,319,256,845 88,650,000 154,800,000
Khairpur 76 10,370,054,517 10,640,849,379 2,101,090,390 37,426,931,661 33,937,948,646 7,136,488,031 96,450,000 154,050,000
Sukkur 43 9,188,745,273 14,225,719,551 2,341,446,482 14,340,502,935 12,148,979,923 2,648,948,286 46,500,000 49,500,000
N Feroze 51 4,525,826,939 4,311,302,742 883,712,968 18,185,792,712 20,987,643,061 3,917,343,577 61,950,000 138,150,000
S Benazirabad 58 5,459,215,172 5,122,090,955 1,058,130,613 19,031,489,739 19,058,289,262 3,808,977,900 249,750,000 212,400,000
Sindh 1297 171,427,645,888 149,970,904,134 32,139,855,002 430,685,967,028 419,736,733,955 85,042,270,098 3,267,300,000 2,911,350,000
Numberof UCs
Urban safelymanaged Water
Urban safelymanagedSanitation
O&M 10%Urban
Rural safelymanaged Water
Rural safelymanagedSanitation
O&M 10% Rural PrimarySchoolsWater
PrimarySchools
Sanitation

300
Table 50 continued
District Middle and High Schools Waterand Sanitation Costs
BHUs Waterand
SanitationCosts
SocialMobilisationCosts Water
Supply
CommunityMobilisation
Costs Sanitation
Communityawareness andcommunication
CBOs CapacityDevelopmentCosts Water
Supply
CBOs CapacityDevelopment
Costs Sanitation
Middle andHigh Schools
Water
Middle andHigh Schools
Sanitation
MissingFacilitiesWASH in
BHUs
SocialMobilisation
Water
CommunityMobilisation
Sanitation
Communityawareness for water
and sanitation
Capacitydevelopment CBOs
in water supply
Capacitydevelopment of
CBOs in sanitation
Badin 5,550,000 2,550,000 2,100,000 705,600,000 705,600,000 20,000,000 50,000,000 50,000,000
Sujawal 5,700,000 3,150,000 1,800,000 417,600,000 417,600,000 20,000,000 50,000,000 50,000,000
Thatta 8,100,000 5,850,000 1,200,000 489,600,000 489,600,000 20,000,000 50,000,000 50,000,000
Dadu 6,600,000 4,200,000 2,700,000 792,000,000 792,000,000 20,000,000 50,000,000 50,000,000
Hyderabad 2,700,000 1,500,000 1,200,000 1,670,400,000 1,670,400,000 20,000,000 50,000,000 50,000,000
Jamshoro 4,050,000 2,250,000 1,200,000 432,000,000 432,000,000 20,000,000 50,000,000 50,000,000
Matiari 10,800,000 8,250,000 1,200,000 360,000,000 360,000,000 20,000,000 50,000,000 50,000,000
Tando Allah Yar 5,400,000 3,000,000 900,000 432,000,000 432,000,000 20,000,000 50,000,000 50,000,000
Tando M Khan 3,450,000 1,950,000 900,000 446,400,000 446,400,000 20,000,000 50,000,000 50,000,000
Karachi Central 6,750,000 2,850,000 2,100,000 604,800,000 604,800,000 20,000,000 50,000,000 50,000,000
Karachi East 2,850,000 600,000 374,400,000 374,400,000 20,000,000 50,000,000 50,000,000
Karachi South 6,300,000 1,350,000 432,000,000 432,000,000 20,000,000 50,000,000 50,000,000
Karachi West 3,150,000 450,000 432,000,000 432,000,000 20,000,000 50,000,000 50,000,000
Korangi 9,300,000 1,350,000 403,200,000 403,200,000 20,000,000 50,000,000 50,000,000
Malir 6,600,000 600,000 360,000,000 360,000,000 20,000,000 50,000,000 50,000,000
Jacobabad 9,000,000 6,750,000 1,500,000 604,800,000 604,800,000 20,000,000 50,000,000 50,000,000
Kashmore 4,800,000 5,700,000 1,200,000 633,600,000 633,600,000 20,000,000 50,000,000 50,000,000

301
Larkana 2,550,000 3,000,000 1,800,000 619,200,000 619,200,000 20,000,000 50,000,000 50,000,000
Q Shahdadkot 7,650,000 5,100,000 1,800,000 619,200,000 619,200,000 20,000,000 50,000,000 50,000,000
Shikarpur 4,800,000 5,550,000 2,100,000 748,800,000 748,800,000 20,000,000 50,000,000 50,000,000
Mirpur Khas 1,500,000 1,200,000 2,400,000 590,400,000 590,400,000 20,000,000 50,000,000 50,000,000
Sanghar 4,350,000 3,000,000 3,600,000 993,600,000 993,600,000 20,000,000 50,000,000 50,000,000
Tharparkar 31,950,000 20,400,000 2,100,000 662,400,000 662,400,000 20,000,000 50,000,000 50,000,000
Umerkot 12,000,000 4,500,000 1,800,000 489,600,000 489,600,000 20,000,000 50,000,000 50,000,000
Ghotki 2,850,000 4,500,000 2,100,000 1,080,000,000 1,080,000,000 20,000,000 50,000,000 50,000,000
Khairpur 3,750,000 5,400,000 4,800,000 1,094,400,000 1,094,400,000 20,000,000 50,000,000 50,000,000
Sukkur 1,800,000 1,350,000 1,500,000 619,200,000 619,200,000 20,000,000 50,000,000 50,000,000
N Feroze 5,400,000 8,100,000 2,700,000 734,400,000 734,400,000 20,000,000 50,000,000 50,000,000
S Benazirabad 10,050,000 6,000,000 2,100,000 835,200,000 835,200,000 20,000,000 50,000,000 50,000,000
Sindh 189,750,000 120,450,000 46,800,000 18,676,800,000 18,676,800,000 580,000,000 1,450,000,000 1,450,000,000
Middle andHigh Schools
Water
Middle andHigh Schools
Sanitation
MissingFacilitiesWASH in
BHUs
SocialMobilisation
Water
CommunityMobilisation
Sanitation
Communityawareness for water
and sanitation
Capacitydevelopment CBOs
in water supply
Capacitydevelopment of
CBOs in sanitation

302
Table 50 continued
District
LG staffcapacitybuilding
PHED staffcapacitybuilding
Waterand
sanitationMIS
Monitoring and Evaluation Costs TotalNotionalCosts forDistrict
Estimated ShortTerm Costs
EstimatedMedium Term
Costs
Estimated LongTerm Costs
Average TotalCost Per UC
Capacitydevelop LG
staff
Capacitydevelop
PHED staff
MIS DistrictM&E
Manager
DistrictM&E staff,office costsand travel
District levelvehicles
Totalnotionalcosts fordistrict
Estimated ShortTerm Costs
EstimatedMedium Term
Costs
Estimated LongTerm Costs
Average TotalCost Per UC
Badin 50,000,000 50,000,000 625,000 625,000 12,000,000 46,800,000 2,500,000 65,235,885,103 19,570,765,531 19,570,765,531 26,094,354,041
Sujawal 50,000,000 50,000,000 625,000 625,000 12,000,000 46,800,000 2,500,000 32,881,253,684 9,864,376,105 9,864,376,105 13,152,501,474
Thatta 50,000,000 50,000,000 625,000 625,000 12,000,000 46,800,000 2,500,000 32,713,328,924 9,813,998,677 9,813,998,677 13,085,331,569
Dadu 50,000,000 50,000,000 625,000 625,000 12,000,000 46,800,000 2,500,000 71,715,593,975 21,514,678,193 21,514,678,193 28,686,237,590
Hyderabad 50,000,000 50,000,000 625,000 625,000 12,000,000 46,800,000 2,500,000 63,110,779,967 18,933,233,990 18,933,233,990 25,244,311,987
Jamshoro 50,000,000 50,000,000 625,000 625,000 12,000,000 46,800,000 2,500,000 28,574,681,449 8,572,404,435 8,572,404,435 11,429,872,580
Matiari 50,000,000 50,000,000 625,000 625,000 12,000,000 46,800,000 2,500,000 29,694,029,041 8,908,208,712 8,908,208,712 11,877,611,616
Tando Allah Yar 50,000,000 50,000,000 625,000 625,000 12,000,000 46,800,000 2,500,000 26,611,848,181 7,983,554,454 7,983,554,454 10,644,739,273
Tando M Khan 50,000,000 50,000,000 625,000 625,000 12,000,000 46,800,000 2,500,000 23,254,771,192 6,976,431,358 6,976,431,358 9,301,908,477
Karachi Central 50,000,000 50,000,000 625,000 625,000 12,000,000 46,800,000 2,500,000 18,957,062,658 5,687,118,798 5,687,118,798 7,582,825,063
Karachi East 50,000,000 50,000,000 625,000 625,000 12,000,000 46,800,000 2,500,000 11,589,242,500 3,476,772,750 3,476,772,750 4,635,697,000
Karachi South 50,000,000 50,000,000 625,000 625,000 12,000,000 46,800,000 2,500,000 13,203,980,618 3,961,194,185 3,961,194,185 5,281,592,247
Karachi West 50,000,000 50,000,000 625,000 625,000 12,000,000 46,800,000 2,500,000 17,496,269,469 5,248,880,841 5,248,880,841 6,998,507,787
Korangi 50,000,000 50,000,000 625,000 625,000 12,000,000 46,800,000 2,500,000 12,869,764,870 3,860,929,461 3,860,929,461 5,147,905,948
Malir 50,000,000 50,000,000 625,000 625,000 12,000,000 46,800,000 2,500,000 9,040,172,965 2,712,051,890 2,712,051,890 3,616,069,186
Jacobabad 50,000,000 50,000,000 625,000 625,000 12,000,000 46,800,000 2,500,000 43,201,603,716 12,960,481,115 12,960,481,115 17,280,641,486
Kashmore 50,000,000 50,000,000 625,000 625,000 12,000,000 46,800,000 2,500,000 37,858,267,831 11,357,480,349 11,357,480,349 15,143,307,132
Larkana 50,000,000 50,000,000 625,000 625,000 12,000,000 46,800,000 2,500,000 79,294,478,404 23,788,343,521 23,788,343,521 31,717,791,361
Q Shahdadkot 50,000,000 50,000,000 625,000 625,000 12,000,000 46,800,000 2,500,000 66,695,043,832 20,008,513,150 20,008,513,150 26,678,017,533

303
Shikarpur 50,000,000 50,000,000 625,000 625,000 12,000,000 46,800,000 2,500,000 56,619,388,518 16,985,816,555 16,985,816,555 22,647,755,407
Mirpur Khas 50,000,000 50,000,000 625,000 625,000 12,000,000 46,800,000 2,500,000 46,080,928,024 13,824,278,407 13,824,278,407 18,432,371,210
Sanghar 50,000,000 50,000,000 625,000 625,000 12,000,000 46,800,000 2,500,000 88,777,538,514 26,633,261,554 26,633,261,554 35,511,015,405
Tharparkar 50,000,000 50,000,000 625,000 625,000 12,000,000 46,800,000 2,500,000 72,028,383,791 21,608,515,137 21,608,515,137 28,811,353,517
Umerkot 50,000,000 50,000,000 625,000 625,000 12,000,000 46,800,000 2,500,000 49,018,426,394 14,705,527,918 14,705,527,918 19,607,370,558
Ghotki 50,000,000 50,000,000 625,000 625,000 12,000,000 46,800,000 2,500,000 72,948,031,770 21,884,409,531 21,884,409,531 29,179,212,708
Khairpur 50,000,000 50,000,000 625,000 625,000 12,000,000 46,800,000 2,500,000 104,349,162,624 31,304,748,787 31,304,748,787 41,739,665,050
Sukkur 50,000,000 50,000,000 625,000 625,000 12,000,000 46,800,000 2,500,000 56,515,942,450 16,954,782,735 16,954,782,735 22,606,376,980
N Feroze 50,000,000 50,000,000 625,000 625,000 12,000,000 46,800,000 2,500,000 54,779,272,000 16,433,781,600 16,433,781,600 21,911,708,800
S Benazirabad 50,000,000 50,000,000 625,000 625,000 12,000,000 46,800,000 2,500,000 55,971,443,641 16,791,433,092 16,791,433,092 22,388,577,456
Sindh 1,450,000,000 1,450,000,000 18,125,000 18,125,000 348,000,000 1,357,200,000 72,500,000 1,341,086,576,106 402,325,972,832 402,325,972,832 536,434,630,442
Capacitydevelop LG
staff
Capacitydevelop
PHED staff
MIS DistrictM&E
Manager
DistrictM&E staff,office costsand travel
District levelvehicles
Totalnotionalcosts fordistrict
EstimatedShort Term
Costs
EstimatedMedium Term
Costs
EstimatedLong Term
Costs
Average TotalCost Per UC

304
Table 51 - District notional estimates (improved water supply and sanitation)
District Urban Water and SanitationCosts
O&M CostsUrban Water
and SanitationRural Water and Sanitation Costs
O&M Costs RuralWater andSanitation
Primary Schools Water andSanitation Costs
Numberof UCs
UrbanImproved
Water
UrbanImprovedSanitation
O&M 10% UrbanRural
ImprovedWater
Rural ImprovedSanitation O&M 10% Rural
PrimarySchoolsWater
PrimarySchools
Sanitation
Badin 49 243,643,687 799,572,657 104,321,634 1,577,649,598 15,696,658,923 1,727,430,852 168,600,000 171,450,000
Sujawal 29 293,632,831 - 29,363,283 3,328,679,982 8,621,652,777 1,195,033,276 207,750,000 174,900,000
Thatta 34 190,078,822 152,310,718 34,238,954 3,707,509,350 8,554,285,036 1,226,179,439 177,300,000 148,500,000
Dadu 55 - 48,532,269 4,853,227 1,750,728,429 11,424,368,345 1,317,509,677 182,100,000 147,900,000
Hyderabad 116 1,323,500,693 1,139,570,083 246,307,078 928,296,941 7,953,142,080 888,143,902 47,250,000 26,400,000
Jamshoro 30 553,407,004 34,665,316 58,807,232 1,563,260,190 4,019,383,603 558,264,379 74,400,000 49,050,000
Matiari 25 51,788,538 1,007,355,819 105,914,436 53,718,476 3,635,542,172 368,926,065 210,600,000 168,000,000
Tando Allah Yar 30 103,705,996 403,162,267 50,686,826 47,203,422 3,242,512,015 328,971,544 58,500,000 37,050,000
Tando M Khan 31 257,272,297 113,733,180 37,100,548 109,791,857 2,849,649,555 295,944,141 78,300,000 75,150,000
Karachi Central 42 8,408,187,504 458,962,200 886,714,970 - - - 17,250,000 8,250,000
Karachi East 26 5,087,038,518 277,676,775 536,471,529 - - - 7,950,000 2,550,000
Karachi South 30 5,796,829,056 316,420,800 611,324,986 - - - 25,650,000 9,000,000
Karachi West 30 5,244,679,790 286,281,648 553,096,144 992,560,883 1,432,481,401 242,504,228 18,000,000 8,250,000
Korangi 28 5,664,530,718 309,199,275 597,372,999 - - - 22,200,000 7,050,000
Malir 25 2,560,569,230 139,769,063 270,033,829 484,590,282 699,369,255 118,395,954 44,400,000 18,300,000
Jacobabad 42 2,800,006,502 138,872,187 293,887,869 469,374,420 7,469,476,303 793,885,072 135,300,000 117,900,000
Kashmore 44 140,561,105 343,496,201 48,405,731 65,561,426 6,454,158,180 651,971,961 123,750,000 157,200,000
Larkana 43 60,620,277 154,995,027 21,561,530 - 5,882,749,219 588,274,922 31,200,000 37,650,000
Q Shahdadkot 43 1,787,399,537 201,915,827 198,931,536 2,050,564,054 8,256,917,103 1,030,748,116 148,500,000 121,500,000
305
Shikarpur 52 -406,291 357,536,092 35,712,980 - 6,909,239,326 690,923,933 78,600,000 82,050,000
Mirpur Khas 41 217,245,927 366,762,242 58,400,817 3,962,437,920 8,628,305,372 1,259,074,329 47,850,000 29,850,000
Sanghar 69 189,377,920 413,129,229 60,250,715 1,000,282,683 14,461,229,649 1,546,151,233 104,250,000 118,650,000
Tharparkar 46 199,442,630 203,046,443 40,248,907 18,073,665,609 19,424,735,315 3,749,840,092 463,200,000 354,750,000
Umerkot 34 31,327,551 531,459,434 56,278,699 6,411,679,946 12,006,385,570 1,841,806,552 251,100,000 131,100,000
Ghotki 75 93,156,578 208,049,692 30,120,627 1,994,809 9,475,340,801 947,733,561 88,650,000 154,800,000
Khairpur 76 - 1,734,321,508 173,432,151 926,897,743 16,506,774,640 1,743,367,238 96,450,000 154,050,000
Sukkur 43 764,840,014 517,003,409 128,184,342 590,289,420 6,017,618,223 660,790,764 46,500,000 49,500,000
N Feroze 51 208,188,039 35,603,172 24,379,121 -1,399,176 6,695,058,136 669,365,896 61,950,000 138,150,000
S Benazirabad 58 267,319,135 216,052,451 48,337,159 136,549,950 8,877,022,908 901,357,286 249,750,000 212,400,000
Sindh 1297 42,537,943,612 10,909,454,985 5,344,739,860 48,231,888,216 205,194,055,908 25,342,594,412 3,267,300,000 2,911,350,000
Numberof UCs
UrbanImproved
Water
UrbanImprovedSanitation
O&M 10% Urban RuralImproved
Water
Rural ImprovedSanitation
O&M 10% Rural PrimarySchoolsWater
PrimarySchools
Sanitation

306
Table 51 continued
District Middle and High Schools Waterand Sanitation Costs
BHUs Waterand
SanitationCosts
SocialMobilisationCosts Water
Supply
CommunityMobilisation
Costs Sanitation
Communityawareness andcommunication
CBOs CapacityDevelopmentCosts Water
Supply
CBOs CapacityDevelopment
Costs Sanitation
Middle andHigh Schools
Water
Middle andHigh Schools
Sanitation
MissingFacilitiesWASH in
BHUs
SocialMobilisation
Water
CommunityMobilisation
Sanitation
Communityawareness for water
and sanitation
Capacitydevelopment CBOs
in water supply
Capacitydevelopment of
CBOs in sanitation
Badin 5,550,000 2,550,000 2,100,000 705,600,000 705,600,000 20,000,000 50,000,000 50,000,000
Sujawal 5,700,000 3,150,000 1,800,000 417,600,000 417,600,000 20,000,000 50,000,000 50,000,000
Thatta 8,100,000 5,850,000 1,200,000 489,600,000 489,600,000 20,000,000 50,000,000 50,000,000
Dadu 6,600,000 4,200,000 2,700,000 792,000,000 792,000,000 20,000,000 50,000,000 50,000,000
Hyderabad 2,700,000 1,500,000 1,200,000 1,670,400,000 1,670,400,000 20,000,000 50,000,000 50,000,000
Jamshoro 4,050,000 2,250,000 1,200,000 432,000,000 432,000,000 20,000,000 50,000,000 50,000,000
Matiari 10,800,000 8,250,000 1,200,000 360,000,000 360,000,000 20,000,000 50,000,000 50,000,000
Tando Allah Yar 5,400,000 3,000,000 900,000 432,000,000 432,000,000 20,000,000 50,000,000 50,000,000
Tando M Khan 3,450,000 1,950,000 900,000 446,400,000 446,400,000 20,000,000 50,000,000 50,000,000
Karachi Central 6,750,000 2,850,000 2,100,000 604,800,000 604,800,000 20,000,000 50,000,000 50,000,000
Karachi East 2,850,000 600,000 374,400,000 374,400,000 20,000,000 50,000,000 50,000,000
Karachi South 6,300,000 1,350,000 432,000,000 432,000,000 20,000,000 50,000,000 50,000,000
Karachi West 3,150,000 450,000 432,000,000 432,000,000 20,000,000 50,000,000 50,000,000
Korangi 9,300,000 1,350,000 403,200,000 403,200,000 20,000,000 50,000,000 50,000,000
Malir 6,600,000 600,000 360,000,000 360,000,000 20,000,000 50,000,000 50,000,000
Jacobabad 9,000,000 6,750,000 1,500,000 604,800,000 604,800,000 20,000,000 50,000,000 50,000,000
Kashmore 4,800,000 5,700,000 1,200,000 633,600,000 633,600,000 20,000,000 50,000,000 50,000,000

307
Larkana 2,550,000 3,000,000 1,800,000 619,200,000 619,200,000 20,000,000 50,000,000 50,000,000
Q Shahdadkot 7,650,000 5,100,000 1,800,000 619,200,000 619,200,000 20,000,000 50,000,000 50,000,000
Shikarpur 4,800,000 5,550,000 2,100,000 748,800,000 748,800,000 20,000,000 50,000,000 50,000,000
Mirpur Khas 1,500,000 1,200,000 2,400,000 590,400,000 590,400,000 20,000,000 50,000,000 50,000,000
Sanghar 4,350,000 3,000,000 3,600,000 993,600,000 993,600,000 20,000,000 50,000,000 50,000,000
Tharparkar 31,950,000 20,400,000 2,100,000 662,400,000 662,400,000 20,000,000 50,000,000 50,000,000
Umerkot 12,000,000 4,500,000 1,800,000 489,600,000 489,600,000 20,000,000 50,000,000 50,000,000
Ghotki 2,850,000 4,500,000 2,100,000 1,080,000,000 1,080,000,000 20,000,000 50,000,000 50,000,000
Khairpur 3,750,000 5,400,000 4,800,000 1,094,400,000 1,094,400,000 20,000,000 50,000,000 50,000,000
Sukkur 1,800,000 1,350,000 1,500,000 619,200,000 619,200,000 20,000,000 50,000,000 50,000,000
N Feroze 5,400,000 8,100,000 2,700,000 734,400,000 734,400,000 20,000,000 50,000,000 50,000,000
S Benazirabad 10,050,000 6,000,000 2,100,000 835,200,000 835,200,000 20,000,000 50,000,000 50,000,000
Sindh 189,750,000 120,450,000 46,800,000 18,676,800,000 18,676,800,000 580,000,000 1,450,000,000 1,450,000,000
Middle andHigh Schools
Water
Middle andHigh Schools
Sanitation
MissingFacilitiesWASH in
BHUs
SocialMobilisation
Water
CommunityMobilisation
Sanitation
Communityawareness for water
and sanitation
Capacitydevelopment CBOs
in water supply
Capacitydevelopment of
CBOs in sanitation

308
Table 51 continued
District
LG staffcapacitybuilding
PHED staffcapacitybuilding
Water andsanitation
MIS
Monitoring and Evaluation Costs TotalNotionalCosts forDistrict
EstimatedShort Term
Costs
EstimatedMedium Term
Costs
Estimated LongTerm Costs
Average TotalCost Per UC
Capacitydevelop LG
staff
Capacitydevelop
PHED staff
MIS DistrictM&E
Manager
DistrictM&E staff,office costsand travel
District levelvehicles
Totalnotionalcosts fordistrict
EstimatedShort Term
Costs
EstimatedMedium Term
Costs
Estimated LongTerm Costs
Average TotalCost Per UC
Badin 50,000,000 50,000,000 625,000 625,000 12,000,000 46,800,000 2,500,000 22,193,277,350 6,657,983,205 6,657,983,205 8,877,310,940
Sujawal 50,000,000 50,000,000 625,000 625,000 12,000,000 46,800,000 2,500,000 14,979,412,149 4,493,823,645 4,493,823,645 5,991,764,860
Thatta 50,000,000 50,000,000 625,000 625,000 12,000,000 46,800,000 2,500,000 15,467,302,318 4,640,190,695 4,640,190,695 6,186,920,927
Dadu 50,000,000 50,000,000 625,000 625,000 12,000,000 46,800,000 2,500,000 16,756,041,948 5,026,812,585 5,026,812,585 6,702,416,779
Hyderabad 50,000,000 50,000,000 625,000 625,000 12,000,000 46,800,000 2,500,000 16,181,360,776 4,854,408,233 4,854,408,233 6,472,544,310
Jamshoro 50,000,000 50,000,000 625,000 625,000 12,000,000 46,800,000 2,500,000 8,065,287,725 2,419,586,317 2,419,586,317 3,226,115,090
Matiari 50,000,000 50,000,000 625,000 625,000 12,000,000 46,800,000 2,500,000 6,624,645,506 1,987,393,652 1,987,393,652 2,649,858,202
Tando Allah Yar 50,000,000 50,000,000 625,000 625,000 12,000,000 46,800,000 2,500,000 5,427,642,071 1,628,292,621 1,628,292,621 2,171,056,828
Tando M Khan 50,000,000 50,000,000 625,000 625,000 12,000,000 46,800,000 2,500,000 4,998,591,579 1,499,577,474 1,499,577,474 1,999,436,631
Karachi Central 50,000,000 50,000,000 625,000 625,000 12,000,000 46,800,000 2,500,000 11,283,214,674 3,384,964,402 3,384,964,402 4,513,285,870
Karachi East 50,000,000 50,000,000 625,000 625,000 12,000,000 46,800,000 2,500,000 6,946,486,822 2,083,946,047 2,083,946,047 2,778,594,729
Karachi South 50,000,000 50,000,000 625,000 625,000 12,000,000 46,800,000 2,500,000 7,913,424,842 2,374,027,452 2,374,027,452 3,165,369,937
Karachi West 50,000,000 50,000,000 625,000 625,000 12,000,000 46,800,000 2,500,000 9,928,004,095 2,978,401,228 2,978,401,228 3,971,201,638
Korangi 50,000,000 50,000,000 625,000 625,000 12,000,000 46,800,000 2,500,000 7,699,952,992 2,309,985,898 2,309,985,898 3,079,981,197
Malir 50,000,000 50,000,000 625,000 625,000 12,000,000 46,800,000 2,500,000 5,345,177,614 1,603,553,284 1,603,553,284 2,138,071,045
Jacobabad 50,000,000 50,000,000 625,000 625,000 12,000,000 46,800,000 2,500,000 13,728,102,354 4,118,430,706 4,118,430,706 5,491,240,942
Kashmore 50,000,000 50,000,000 625,000 625,000 12,000,000 46,800,000 2,500,000 9,546,554,604 2,863,966,381 2,863,966,381 3,818,621,841
Larkana 50,000,000 50,000,000 625,000 625,000 12,000,000 46,800,000 2,500,000 8,305,350,975 2,491,605,293 2,491,605,293 3,322,140,390
Q Shahdadkot 50,000,000 50,000,000 625,000 625,000 12,000,000 46,800,000 2,500,000 15,331,976,174 4,599,592,852 4,599,592,852 6,132,790,470
309
Shikarpur 50,000,000 50,000,000 625,000 625,000 12,000,000 46,800,000 2,500,000 9,946,256,040 2,983,876,812 2,983,876,812 3,978,502,416
Mirpur Khas 50,000,000 50,000,000 625,000 625,000 12,000,000 46,800,000 2,500,000 16,038,376,606 4,811,512,982 4,811,512,982 6,415,350,643
Sanghar 50,000,000 50,000,000 625,000 625,000 12,000,000 46,800,000 2,500,000 20,174,021,430 6,052,206,429 6,052,206,429 8,069,608,572
Tharparkar 50,000,000 50,000,000 625,000 625,000 12,000,000 46,800,000 2,500,000 44,170,728,997 13,251,218,699 13,251,218,699 17,668,291,599
Umerkot 50,000,000 50,000,000 625,000 625,000 12,000,000 46,800,000 2,500,000 22,541,187,752 6,762,356,325 6,762,356,325 9,016,475,101
Ghotki 50,000,000 50,000,000 625,000 625,000 12,000,000 46,800,000 2,500,000 13,451,846,068 4,035,553,820 4,035,553,820 5,380,738,427
Khairpur 50,000,000 50,000,000 625,000 625,000 12,000,000 46,800,000 2,500,000 23,820,593,281 7,146,177,984 7,146,177,984 9,528,237,312
Sukkur 50,000,000 50,000,000 625,000 625,000 12,000,000 46,800,000 2,500,000 10,300,326,174 3,090,097,852 3,090,097,852 4,120,130,470
N Feroze 50,000,000 50,000,000 625,000 625,000 12,000,000 46,800,000 2,500,000 9,598,845,188 2,879,653,557 2,879,653,557 3,839,538,075
S Benazirabad 50,000,000 50,000,000 625,000 625,000 12,000,000 46,800,000 2,500,000 12,879,888,888 3,863,966,666 3,863,966,666 5,151,955,555
Sindh 1,450,000,000 1,450,000,000 18,125,000 18,125,000 348,000,000 1,357,200,000 72,500,000 389,643,876,993 116,893,163,098 116,893,163,098 155,857,550,797
Capacitydevelop LG
staff
Capacitydevelop
PHED staff
MIS DistrictM&E
Manager
DistrictM&E staff,office costsand travel
District levelvehicles
Totalnotionalcosts fordistrict
EstimatedShort Term
Costs
EstimatedMedium Term
Costs
EstimatedLong Term
Costs
Average TotalCost Per UC

Table 52 - Summary Indirect Costs
Theme Short term Medium Term Long Term TotalLegislation and Policies 42,000,000 5,000,000 10,000,000 57,000,000Water Resources 50,000,000 90,000,000 131,000,000 271,000,000Water Supply 11,162,040,000 11,162,040,000 14,882,720,000 37,206,800,000Water Quality 110,000,000 210,000,000 280,000,000 600,000,000Sanitation 6,230,040,000 6,230,040,000 8,291,720,000 20,751,800,000Solid Waste 40,000,000 65,000,000 75,000,000 180,000,000Health and Hygiene 603,800,000 541,000,000 681,000,000 1,825,800,000Education 1,948,455,000 1,948,455,000 2,597,940,000 6,494,850,000Sector Efficiency andCapacity 1,750,000,000 1,740,000,000 2,320,000,000 5,810,000,000
Sector Financing 10,000,000 0 0 10,000,000Sector Coordination 116,000,000 114,000,000 157,000,000 387,000,000Sector Monitoring 620,310,000 511,560,000 682,080,000 1,813,950,000
Total 22,682,645,000 22,617,095,000 30,108,460,000 75,408,200,000

311
Table 53 - Investment Overview of Sector Plan in Billion Rupees (safely managed water supplyand sanitation)
Theme Short Term MediumTerm
Long Term Total
2016-2019 2019-2022 2022-2026Direct costs safely managedurban water supply 34.286 51.428 85.714 171.428
Direct costs safely managedrural water supply 86.137 129.206 215.343 430.686
Direct costs Water Supply 120.423 180.634 301.057 602.11410% water supply O&M cost 12.042 18.063 30.106 60.211
Direct costs safely managedurban sanitation 29.994 44.991 74.985 149.971
Direct costs safely managedrural sanitation 83.947 125.921 209.868 419.737
Total Direct costs safelymanaged Sanitation 113.942 170.912 284.854 569.708
10% sanitation O&M cost 11.394 17.091 28.485 56.971
Total Direct costs safelymanaged water supply andsanitation
257.801 386.701 644.502 1289.003
Total Indirect costs 22.683 22.617 30.108 75.408
Total Direct and Indirect costsat current rates 280.483 409.318 674.610 1364.412
Total Direct and Indirect costsat 8% Inflation 327.802 412.936 722.028 1462.766

312
Table 54 - Investment Overview of Sector Plan in Billion Rupees (improved water supply andsanitation)
Theme Short Term MediumTerm
Long Term Total
2016-2019 2019-2022 2022-2026Direct costs urban improvedwater supply 8.508 12.761 21.269 42.538
Direct costs rural improved watersupply 9.646 14.470 24.116 48.232
Total Direct costs improved WaterSupply 18.154 27.231 45.385 90.770
10% water supply O&M cost 1.815 2.723 4.538 9.077
Direct costs urban improvedsanitation 2.182 3.273 5.455 10.909
Direct costs rural improvedsanitation 41.039 61.558 102.597 205.194
Total Direct costs improvedSanitation 43.221 64.831 108.052 216.104
10% sanitation O&M cost 4.322 6.483 10.805 21.610
Total Direct costs improvedwater supply and sanitation 67.512 101.268 168.780 337.561
Total Indirect costs 22.683 22.617 30.108 75.408
Total Direct and Indirect costs atcurrent rates 90.195 123.885 198.889 412.969
Total Direct and Indirect costs at8% Inflation 105.411 132.788 232.182 470.380

313
Figure 79 - Sector investment scenario at current rates and with 8% inflation (safely managedwater supply and sanitation)
Figure 80 – Sub-sector investment at current rates (safely managed water supply and sanitation)
313
Figure 79 - Sector investment scenario at current rates and with 8% inflation (safely managedwater supply and sanitation)
Figure 80 – Sub-sector investment at current rates (safely managed water supply and sanitation)
313
Figure 79 - Sector investment scenario at current rates and with 8% inflation (safely managedwater supply and sanitation)
Figure 80 – Sub-sector investment at current rates (safely managed water supply and sanitation)

314
Figure 81 - Sector investment scenario at current rates and with 8% inflation (improved watersupply and sanitation)
Figure 82 – Sub-sector investment at current rates (improved water supply and sanitation)
314
Figure 81 - Sector investment scenario at current rates and with 8% inflation (improved watersupply and sanitation)
Figure 82 – Sub-sector investment at current rates (improved water supply and sanitation)
314
Figure 81 - Sector investment scenario at current rates and with 8% inflation (improved watersupply and sanitation)
Figure 82 – Sub-sector investment at current rates (improved water supply and sanitation)

315
Resource Mobilisation
One of the critical areas for the sector development plan will be to mobilise sufficient resources tofinance the ten year plan.
Various financing options exist and these would need to be explored and developed over time.Some of the potential areas include the following:
Own Source Revenue (OSR)
Under the SLGA, Local Governments can raise revenue through various bye-laws, schedules,taxation and tariffs for water and sanitation services. Presently, there is a very low tariff structurefor services and revenue generated from water and sanitation is not necessarily used for sectorand sub-sector services. This process needs to be streamlined and OSR increased incrementally atrespective local government tiers.
Local Revenue Generation by Consumer Organisations
As part of planning, design and execution of schemes, CBO involvement is paramount. Wherefeasible, a CBO or similar community organisation should be empowered during the schemedevelopment process to generate community resources through a community based system ofbilling and collection, especially to ensure O&M once the scheme is complete and handed over tothe community.
Innovation
One of the major impediments in revenue generation is inefficient billing and collection for sub-sector services. The Government of Sindh may consider outsourcing functions like billing andcollection to private sector companies to improve revenue generation.
Several corporates are already involved in promoting health and hygiene related to WASH throughtheir Corporate Social Responsibility e.g. Reckitt and Coleman Company who advertise their soapbrand ‘Safeguard’ and Unilever with their soap brand ‘Lifebuoy’. These companies can be engagedon a wider scale to health and hygiene promotion in WASH.
Strengthening Local Government
The WASH sector is fortunate that it is already devolved through the SLGA. At present,prioritisation and planning takes place at the provincial level. The SLGA can be used as anopportunity to strengthen local government tiers in prioritisation and planning of WASH servicesby allocating a proportion of development funding at their disposal. It would be mandatory tospecify that this development funding be utilised for sector and sub-sector activities and for thelocal governments to develop their own priorities and plans for these.

316
Sub-National Governance Programme
The Department for International Development (DfID) has initiated a Sub-National Governance(SNG) programme in Punjab and Khyber Pakhtunkhwa. The Government of Sindh may approachDfID to support a similar programme in Sindh with specific emphasis on sector and sub-sectorgovernance development.
USAID and Nutrition Support Initiative
USAID has developed a programme policy for support to nutrition specific programmes. Theseprogrammes may incorporate nutrition-sensitive components like water and sanitation thatcontribute towards improving nutritional status in affected communities. The Government ofSindh may enhance WASH programming as nutrition-sensitive components in nutrition-specificprojects.
World Bank Drought Emergency Programme
For drought stricken areas of Sindh, the Government of Sindh may explore World Bank funding toset up an emergency programme that incorporates accelerated development of WASH services inaffected communities.
Small Dams and Water Reservoirs
Funding from ADB may be explored for development of multiple small dams to act as waterreservoirs with outlets to drinking water supply schemes. Such reservoirs would also benefit theirrigation sector.
Sustainable Development Goal for Water and Sanitation
The launch of the SDGs provides a unique opportunity to seek development financing frominternational partners as the SDG indicators require massive new investment to achieve the SDGtargets. The Government of Sindh may use the sector plan to mobilise new investment frominternational development partners.
Climate change
Climate change is recognised to have a major impact on water and sanitation services, andtherefore provides an opportunity to the Government of Sindh for high level engagement fordeveloping pilot projects to mitigate risks of climate change on sector and sub-sector servicesbefore scaling up.
Achieving Equity and Universal Coverage
Government of Sindh may consider accessing concessional loans or other new resources or byimproving value for money to support equitable and viable service delivery models for closingcoverage gaps, and removing bottlenecks.

317
Sanitation Marketing
Government of Sindh may incentivise the private sector through rebate and subsidies forinvestment in the WASH sector especially provision of sanitation materials. The provincialgovernment may also engage the private sector, international partners and NGOs in developingthe capacities of local entrepreneurs, masons and suppliers in sanitation marketing and supplyside interventions.

318
Strategy
Sector FinancingStrategicObjectives/Outcomes
Short Term Actions1 - 3 years
Medium Term Actions4 - 6 years
Long Term Actions7 - 10 years
Sectoral budgeting andexpenditure reportingstratified separately foreach sub-sector(environment, watersupply, sewerage anddrainage)
Conduct a financialbudgeting and expenditurereview of sectoral budgetsand expenditures andstratify actual sub-sectorspends against sub-sectorbudgets for last five years
Introduce sub-sectorexpenditure reportingseparately forenvironment, watersupply, sewerage anddrainage, and solid waste
At least 70% of districtsand talukas report sub-sectoral spending bystratified reportingprocedure
At least 90% of districtsand talukas report sub-sectoral spending bystratified reportingprocedure
Increased Own SourceRevenue (OSR) in sub-sectors by Town Councils
Incentivise by providingmatching grants to TownCouncils related to sub-sector OSR
At least 30% of TownCouncils increase theirbaseline sub-sector OSR by100% or more
At least 60% of TownCouncils increase theirbaseline sub-sector OSR by200% or more
At least 75% of TownCouncils increase theirbaseline sub-sector OSR by300% or more
Increased regulated privatesector participation in sub-sectors
Incentivise private sectorwith subsidies to providewater supply, filtrationplants, O&M services,rehabilitation ofdysfunctional schemes,solid waste management,wastewater treatment inselected areas and city andtown zones
Determine type of contractarrangement and ensureregulatory mechanism inplace
At least 30% or more ofcoverage of municipalservices in mega citiesprovided by private sector
At least 20% or more ofcoverage of municipalservices in intermediatecities provided by privatesector
At least 10% or more ofcoverage of municipalservices in Towns providedby private sector
At least 50% or more ofcoverage of municipalservices in mega citiesprovided by private sector
At least 30% or more ofcoverage of municipalservices in intermediatecities provided by privatesector
At least 20% or more ofcoverage of municipalservices in Towns providedby private sector
Increased developmentexpenditure allocation toand spending by sub-sectors and prioritised byequity and need
Allocate 8% of ADPallocation to the sector andprioritise by equity andneed
Increase proportionateADP allocation for ongoingschemes from 69% to 75%and correspondinglyreduce ADP allocation to
Allocate 9% of ADPallocation to the sector andprioritise by equity andneed
Increase proportionateADP allocation for ongoingschemes from 75% to 80%and correspondinglyreduce ADP allocation to
Allocate 10% of ADPallocation to the sector andprioritise by equity andneed
Maintain proportionateADP allocation for ongoingschemes at 80% andcorresponding ADPallocation to new schemes
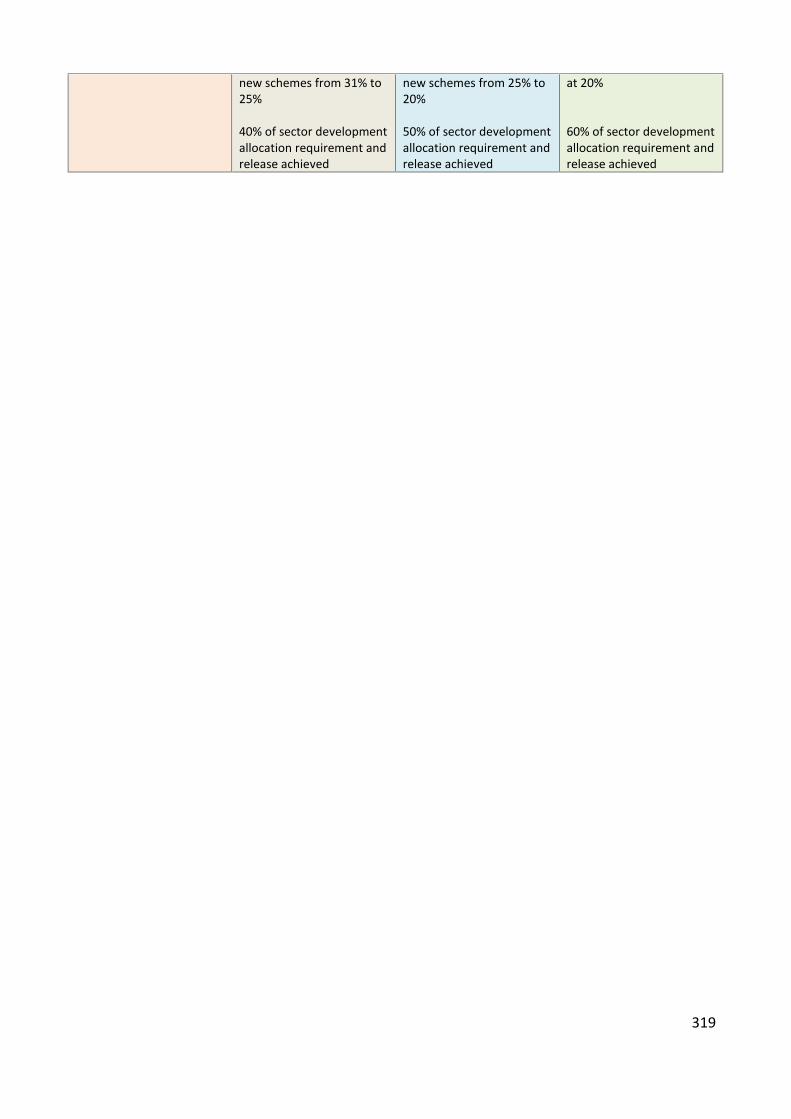
319
new schemes from 31% to25%
40% of sector developmentallocation requirement andrelease achieved
new schemes from 25% to20%
50% of sector developmentallocation requirement andrelease achieved
at 20%
60% of sector developmentallocation requirement andrelease achieved
320
SECTOR COORDINATION AND IMPLEMENTATIONARRANGEMENTS
Coordination
The subjects of drinking water supply, sanitation, and solid waste, rural and urban developmenthave been designated to the provincial government under the Constitution of Pakistan. The LocalGovernment Act 2001 created the structure of Tehsil Municipal Administration (TMA) with theresponsibility of municipal services including water supply, sanitation and solid wastemanagement. The Government of Sindh approved a new Local Government Act in 2014. The SindhLocal Government Act restored the formal mayoral system for towns/cities to serve the urbanpopulation with Chairman led district councils mainly responsible for the rural areas.
In rural areas, the union councils and zila (district) councils will be responsible for services, while inurban areas and the metropolis, Metropolitan Corporation, Municipal Corporation, Municipal andTown Committees will be restored. Presently, TMAs are functional under a transition periodthough local bodies election were held in 2015 at the community level and new mayors andchairmen have been elected in 2015. The new administrative structure is expected to be fullyfunctional in 2016-2017 financial year. Urban water and sanitation authorities called KW&SB forKarachi, H-WASA for Hyderabad, and NSUSC are entrusted to deliver municipal services undersupervision of the local governments. In addition, other agencies like Karachi DevelopmentAuthority, Karachi Metropolitan Corporation, Hyderabad Development Authority, CantonmentBoards, Defence Housing Authorities, private housing companies, etc. are also implementingwater supply and drainage schemes.
In Sindh, the provision of drinking water supply to the rural communities’ rests with PHE&RDDwhile in big and intermediate cities and towns, it rests with LG&HTPD, which is also responsible forsanitation and solid waste. Both provincial departments are responsible for planning, funding,regulation, monitoring and service delivery of water and sanitation respectively at the district andsub district levels. In addition to these two departments, there are other departments who aredirectly and indirectly involved in WASH like Urban Planning and Development, Health, Educationand Planning and Development Departments with some special initiatives. For water supply inschools, PHE&RDD provides technical support in designing and implementing the scheme, thebudget being catered from the Education Department. The Health department is responsible forcreating awareness and sensitisation among the communities about hygiene behaviours and pre-cautions for water borne diseases.
Presently, there are two ways of managing the water supply schemes in Sindh. Generally, in urbanareas, LG&HTPD manages the schemes through its staff but has poor revenue collection from theusers or community based organisations (CBOs). Whereas in rural areas, the schemes are designedand executed by PHE&RDD, but on completion require to be handed over to LG&HTPD orentrusted to the local CBOs that includes operation and maintenance of the schemes. Nearly one-fifth of water supply schemes in the province are non-functional because of either lack of intereston the part of CBOs or poor money collection mechanisms. There is lack of appropriate legislationfor handing over of the schemes to the communities and clarity about the expected role from the
321
stakeholders in O&M of the schemes. PHE&RDD does not have sufficient community mobilisationcapacity, and requires additional capacity development support followed by policy reforms forappropriate well-defined community sharing and mobilisation mechanisms, and for O&M.
The function of sanitation falls under the purview of LG&HTPD, which is also involved inimplementing the large drainage and sanitation schemes. It is also involved in street payment androad construction in the villages. LG&HTPD has just initiated the Saaf Suthro Sindh programmethrough which it shall implement the Pakistan Approaches to Total Sanitation (PATS) in selecteddistricts in association with local community organisations in collaboration with national andinternational partners. It is noted that many initiatives/pilot taken by the civil society partnerorganisations for scaling up of PATS and WASH programmes are not well embedded withinGovernment, LG&HTPD and PHE&RDD programmes and initiatives. Resultantly, these pilotinitiatives are not scaled up, as there are gaps in the understanding of the stakeholders aboutgovernment operational mechanisms.
It is also recognised that government priorities are often driven by the political party manifestos,and advocacy of the international and national partners based on research and evidence. There islack of sufficient research and evidence on the local water and sanitation innovative and costeffective solutions in the province. There is a strong need for identifying a water and sanitationresearch agenda that feeds into the development of new programmes and initiatives of thegovernment of Sindh.
There is lack of coordination mechanism between PHE&RDD and Local Government about handingover of water supply and sanitation schemes in addition to future O&M of WASH projects. Bothdepartments are implementing the schemes on the will of elected representatives but a joined upapproach is missing where resources should be shared from planning, execution and monitoring ofthe project. The new SLGA 2014 shifts the onus of water supply, sanitation and solid waste to thelocal councils. It indicates the formation of guidelines for management of water supply andsanitation schemes but presently these do not exist. A similar challenge of coordination existsamong the multiple departments responsible for WASH directly or indirectly. There is no singlecoordinating focal point that holds different sub sector strands together.
Further, there is lack of clarity about the roles and responsibilities among the stakeholders thathas emerged as a result of SLGA 2014 and 18th Constitutional Amendment. There is need for aformal coordination mechanism for WASH under Assistant Chief Secretary for Development atP&D by creating a Project Planning and Implementation Unit. This unit should be responsible foridentifying the synergies or determine any overlapping.
Improving Sector Coordination
The following are the critical areas for improving sector coordination.
There is need for a regulatory body especially for urban areas – an integrated approach shouldbe adopted for metropolitan areas where the Mayor should provide leadership
Cantonment Board – Station Command should also be involved in the regulatory body as theyprovide service especially for Karachi

322
ACS Development can issue notification to set up a regulatory board – and haverepresentation of Mayor, Operators and Cantonment Board
PHE&RDD and Provincial Water Board will not approve any scheme without consent of theabove body regulating water supply in cities and towns – every scheme would require a NoObjection Certificate from the Mayor
Establish a Project Planning and Implementation Unit for WASH under the governance of theAssistant Chief Secretary for Development at P&DD
Sector coordination with education for missing WASH facilities can be improved at three levels:
Provincial level – quarterly review of data on missing WASH facilities by Directorate ofEducation Schools, Reform Support Unit, SEMIS and PHE&RDD to prioritise community watersupply schemes and ensure these are also linked with local schools
District Authority level – local PHE&RDD and LG&HTPD officials can be part of this to promotecoordination
District Education Group - local PHE&RDD and LG&HTPD officials can be part of this topromote coordination for WASH
Sector coordination with health can be improved at three levels:
Provincial – joint meeting six monthly between PHE&RDD and PPHI and Health to ensurewater supply to health facilities in all new schemes where feasible
District Health – district-wise status of health facilities with regards to water and sanitationand joint planning with PHE&RDD to address the gaps. Health Department and PHE&RDDdevelop a Joint Action Plan (JAP) to address these
District Education – district-wise planning with Education to incorporate health and hygiene inschools and local communities
323
Implementation Mechanism
Implementation Arrangements
This section provides the framework and guidelines for implementing the Sindh SectorDevelopment Plan for WASH – to be implemented by governmental departments and agencies,rural and urban communities throughout province, and supported and facilitated by civil societyorganisations, the private sector and international donors.
The implementation framework is premised on harmonisation and integration and outlines howdelivery of WASH would need to be structured and coordinated, proposes funding arrangements(covered in further detail under ‘Resource Mobilisation’), and provides a structural platform forNGOs to be integrated in planning and execution of the sector plan. It is expected that as theprogramme evolves, the framework would ned to be revised to address issues not apparent at thistime.
A significant component of the proposed framework is a joint commitment by six leadingdepartments (LG&HTPD, PHE&RDD, Health, Education, P&DD and Finance) through aMemorandum of Understanding to support and facilitate an integrated WASH programme in theprovince to address the needs of urban and rural communities more holistically and limitcompartmentalisation that may impede progress towards the sector plan’s objectives.
The framework further seeks to provide coherence to sector and sub-sector planning, design andexecution, and to harmonise donor inputs in terms of programming and financial assistance. Thiswould facilitate donors to support components of the sector plan that contribute a unified wholerather than disparate projects in isolation of each other.
Foundation
The foundation of the new WASH sector development plan is a formal Memorandum ofUnderstanding (MoU) between the following departments:
LG&HTPD PHE&RDD Health Education P&DD Finance
The intent of the MoU would be to establish a harmonious working modality between the sixdepartments, donors and other sector partners active in the implementation of WASH activities torealise the full benefits of the WASH sector plan.

324
Features of the Implementation Framework
Four of the significant features of the new WASH sector plan are:
Integration Harmonisation Alignment Partnership
Integration
The sector plan is designed to integrate:
Water Supply (urban and rural) Hygiene and Sanitation WASH in Schools and Health Facilities
The primary objective is to foster integrated behaviour among community members in which:
safe use of water, healthy hygiene practices regular use of improved sanitation facilities
are naturally and instinctively combined into the pattern of daily living. Further, it seeks to providean institutional arrangement that would achieve greater efficiency and effectiveness.
Integrating Structure
The structural arrangements recommended for WASH, shown in the matrix below, are designed tobuild synergy among the sectors through coordinated and collaborative planning,implementation, monitoring, reporting and evaluation of programme results.
The recommended WASH organisational structures are intended to provide for effective:
Governance Management Implementation Coordination
It is recognised that the recommended structures may not be appropriate in all situations andlocal adaptations may be necessary.

325
The MoU presupposes:
provincial WASH structures for policy guidance, technical overview and approval
a structure for programme coordination to ensure intersectoral convergence
Implementation Matrix
Level Governance andGuidance
Oversight andManagement
ProgrammeImplementation
ProgrammeCoordination
Provincial
Provincial Nutritionand WASHCommittee
Multi-sectoralsteering committeeunder P&DD forpolicy guidance andsectoralcollaboration
Higher level multi-sector planning
Higher level multi-sector coordination
TechnicalCommittee
Departmental leveltechnicalcommittee toreview ongoing andnew schemes forADP
Technical overviewand sector partnerengagement
Coordination andalignment of sectorschemes withdepartment plans
Steering WASHTechnical WorkingGroup
Departmental levelstructure with afocus on the sectorplan
Multi-sectorengagement atplanning andexecution levels
Multi-sectorcoordination forplanning andexecution
Sector Coordinationand Monitoring Unit(SCMU)
Provincialmonitoring andevaluation structureas part of NutritionUnit in P&DD
Monitoringframeworks,reporting toprovincial anddistrict structures
Inter-departmentalliaison andcoordination withdonors for reportingrequirements
District
District WASHCommittee) underthe DC Office
District levelcoordination
Multi-sectorengagement atplanning,coordination andexecution at districtlevel
Multi-sectorcoordination forplanning andexecution at districtlevel
DistrictCoordination andMonitoring Unit(DCMU)
District levelmonitoring andreporting
Monitoringinformationreporting to SCMUand districtstructures
Inter-departmentalliaison andcoordination atdistrict level forreportingrequirements
Union CouncilCommittee
UC WASHCommittee underthe UC SecretaryOffice
UC level WASHprogramming
CBO/VDCengagement atplanning andexecution at UClevel
CBO/VDCcoordination forplanning andexecution at UClevel

326
Harmonisation
The second feature of the sector plan is harmonisation.
Historically, much of the work in WASH in the province has been departmental led on the basis ofdiscrete, time-framed projects that have been largely been financed by the Provincial and Federalgovernments, while some projects have been donor-designed and donor-driven.
While there have been certain advantages in pursuing this approach, it has worked againstcomprehensive and strategic planning and effective programme execution. It has made difficult:
assembly and analysis of essential planning data definition of expected outcomes mobilisation and allocation of resources establishment of management systems coordinated capacity development measurement of progress and of results communication and accountability.
At the provincial and district level, the management of diverse projects has placed an inordinateburden on generally under-capacitated implementing agencies and, at the community level, it hasresulted in segmentation, gaps and overlaps in service delivery.
There is therefore a pressing need to move from a fragmented project approach to a morecoherent and integrated programme approach, so that there is one WASH programme in theprovince to which donors and NGOs can align and contribute to its overall achievement.
Alignment
The third new feature of the WASH sector plan, closely related to harmonisation, is alignment. It isimperative that the sector plan is aligned with
the policies, priorities and strategies of the pertinent departments as outlined in theirrespective Sector Development Plans
the administrative systems, standards and procedures of the Government of Sindh
This means that the goals, objectives and development indicators of WASH are directly linked andcontribute to those of the partner departments. It also means that, to the extent possible, WASHmanagement systems and procedures follow and tie into the established government systems,standards and procedures for:
Planning Financial Management Procurement Reporting Monitoring & Evaluation

327
Other than conformity and efficiency, and internal vertical and horizontal alignment forcomplementarity and mutual reinforcement, the overall purpose is to ensure that WASH isrecognised and affirmed as an integral, ongoing component of the provincial government’sbroader developmental programme. WASH responsibilities are incorporated in the establishedprocess streams and the job descriptions of the four sector agencies’ staff at all levels. This signalsto WASH implementers within the government structures that their WASH activities are not“added on” responsibility in support of donor projects - but a core responsibility in governmentservice.
Partnership
The fourth feature of the sector plan is partnership. Partnership is not a new feature – but it is anevolving feature in terms of scope and level of commitment. The scope has been enlarged toinclude the six departments and the commitment has been increased to engage with Civil SocietyOrganisations and the Private Sector as significant partners. The new sector plan recognizes thateach of these partners has an essential part to play in successfully scaling-up WASH, improvingperformance and ensuring the sustainability of programme results.
Civil Society Organisations/NGOs are major WASH actors throughout the province. Furthermore,they have exceptional motivation, expertise and flexibility that enables them to effectivelyimplement WASH in remote areas where governmental agencies may not have the requiredcapacity. Not least, CSO/NGOs bring additional and alternative experience to WASH and cancontribute substantially to lessons learned and the achievement of best practices.
The role of the CSO’s/NGOs as Partners in the sector plan focuses on common approaches to localcapacity building, empowerment and planning, common standards relating to WASHinfrastructure, the harmonisation of reporting results – not least in relation to the WASHInventory- and ensuring that the financial contributions to the Programme are recognised andrecorded in WASH financial reporting.
Private sector involvement in WASH is essential to the sustainability of the community-led andcommunity-managed development that is promoted by WASH. When communities do not haveongoing access to reliable maintenance and capacity building services, their good initiativesfrequently falter and fail. The new sector plan encourages the private sector to assume this roleand offers opportunity for public-private partnerships in the delivery of goods and services and inthe building of stakeholders’ capacity.

328
The proposed implementation mechanism is presented diagrammatically in Fig 83.
Figure 83 – Implementation Mechanism
Need Identification and Scheme Design
The need identification process would commence at the UC level with community participation.Communities need to be involved at the outset to identify a suitable location, participate in theplanning, design and execution of the scheme, and to ensure that the mobilisation process hasobtained the necessary commitment by the local communities to bear the costs of operation andmaintenance.
Design Cell
A Design cell would be established in LG&HTPD to assist Town Committees (TC), MunicipalCommittees/Municipal Corporations (MC), District Municipal Corporations (DMC) and Field Offices(FO), while the existing Design Cell in PHE&RDD would be strengthened to assist the EXEN Office inthe designing of new schemes and review designs of existing schemes where required, and toensure that all new schemes meet the technical and quality specifications.

329
Multi-Sectoral Nutrition Steering Committee
The P&DD has established a Multi-Sectoral Nutrition Steering Committee represented by mostsectors. It is suggested that this committee incorporate WASH and be renamed Multi-SectoralNutrition and WASH Committee. For projects that require collaboration with other sectors,LG&HTPD and PHE&RDD can utilise the Steering Committee for improved coordination and highlevel planning. The Steering Committee provides policy guidance and coordination to the differentsectors.
Departmental Technical Committees
The Departmental Technical Committees would be operationalised and review ongoing andproposed new schemes for technical and financial oversight and guidance in relation to the ADP.
Strategic WASH Technical Working Group
A Strategic WASH Technical Working Group would monitor overall progress and facilitateimplementation of the Sector Development Plan, provide a forum for inter-departmentalcoordination for the implementation of the plan, promote alignment of sector partner projectswith the Sector Plan, and facilitate donor engagement and reporting.
Sector Coordination and Monitoring Unit (SCMU)
Presently, there is no mechanism that can manage the implementation of sector developmentplan. Therefore, a SCMU would be established under the auspices of P&DD as part of the NutritionUnit to facilitate implementation of the sector development plan. The SCMU shall liaise with theMulti-Sectoral Steering Committee, Departmental Technical Committees, Strategic WASHTechnical Working Group, Monitoring and Evaluation cell in P&DD, and the District Coordinationand Monitoring Unit (DCMU).
AimMonitor the progress and timely implementation of the Sindh Water, Sanitation and HygieneSector Plan 2016-2026
Key Objectives
1. Report on progress and provide periodic updates to the Multi-Sectoral Steering Committee,Departmental Technical Committees, and Strategic WASH Technical Working Group
2. Act as a mechanism for donor, NGOs and private sector coordination and reporting in Water,Sanitation and Hygiene - institutionalize the bottleneck analysis and joint sector reviewmechanism so that partners can see linkages between policy commitments and budgeting/spending at all levels of government
3. Develop and implement sectoral and sub-sectoral implementation and monitoring frameworksfor the sector plan
4. Liaise with the Monitoring and Evaluation Cell, P&DD, Government of Sindh5. Develop and maintain a Sanitation and Water Information System (SWIS) with District
Scorecards

330
6. Produce a Sindh Annual State of Water, Sanitation and Hygiene Report (SAWSH Report)7. Act as a provincial observatory for water, sanitation and hygiene, evidence generation and
collation, and warehouse of sectoral and sub-sectoral information8. Monitor and report sectoral and sub-sectoral financing by state and non-state actors in Water,
Sanitation and Hygiene – and generate Annual WASH budget briefs for better and morerelevant budget and expenditure data information
9. Maintain an updated database for Water, Sanitation and Hygiene for reporting to JMP andGLAAS
District WASH Committees
A District WASH Committee shall be set up and operationalised under the DC Office.
Representation of relevant district staff of LG&HTPD, PHE&RDD, Health and Education on to thiscommittee would be required. Other sector representation can be co-opted as required. TheDistrict WASH Committee shall perform the role of sector coordination, planning, and multi-sectoral collaboration. An important role for the District WASH committee would be to improvebudget transparency and accountability based on communities’ budget monitoring and feedbackat the district level and ensuring that funds reach the intended programmes and beneficiaries.
District Coordination and Monitoring Unit
A District Coordination and Monitoring Unit (DCMU) shall be set up and operationalised under theDC Office. Each DCMU would be staffed by a District M&E Manager and supported by two Waterand Sanitation Reporting Officers. The DCMU shall have reporting arrangements to the SCMU andshall liaise with the EXEN Office and LG tiers for information regarding schemes, and also withother sectors like health and education for issues related to the sector. The DCMU shall compilephysical and financial progress data on ongoing and completed schemes, make monitoring visits toscheme sites, determine the status of O&M of schemes visited, and provide monthly reporting tothe SCMU. DCMU data shall be used to develop district scorecards for water, sanitation andhygiene. The organogram for DCMU is shown in Fig 84.
Figure 84 - Organogram for DCMU
331
Rural Water Supply Schemes
For Rural Water Supply Schemes, the following implementation arrangements shall be adopted:
1. The Drinking Water Policy goals and objectives can only be achieved through strongcommunity mobilisation. It is envisaged that the Communities shall be involved in theplanning, implementation, monitoring and O&M of the water supply schemes (WSS). TheO&M of the schemes especially in the remote areas/villages shall be handed over to theDrinking Water User Associations (DWUAs), which can generate ample revenue bycollection of water charges to maintain the water supply schemes. Local governments shallhold public consultations at the conceptual design of the development plan, schemes andprojects, while PHE&RDD provides technical assistance to DWUAs. PHE&RDD shall not beinvolved in the collection of revenue. Modifications in the designs shall be carried out toaccommodate the concerns of the stakeholders. The PC-1s shall be prepared only aftersuch a process has been carried out. Local Council Monitoring Committees shall overseethe programme/project/scheme.
2. For effective and sustainable rural water supply schemes (RWSS) management in Sindh:
a) PHED shall appoint Social Mobilisation/Community Development Officers with properqualifications to interact with communities
b) Local government (LG) department in coordination with SocialMobilisation/Community Development Officers of PHED shall constitute the LocalCouncil Monitoring Committee (LCMC) and hold public consultations at the conceptualdesign of the RWSS development plan, schemes and projects.
c) The site selection of the RWSS shall require recommendation of the LCMC followingwhich PHED will be responsible for Engineering Design, Procurement of Materials,Construction, Installation and Commissioning.
d) Upon completion of the RWSS, the scheme shall be handed over to the respectiveDrinking Water User Association (DWUA) for operation and maintenance (O&M) of theRWSS. DWUAs shall be able to generate ample revenue by collection of water chargesto maintain the water supply schemes. The water tariff shall be set as perrecommendations of the DWUA in consultation with the community.
e) The minor repair requirement of the RWSS shall be met within the revenue generatedby the DWUA and major repairs of the RWSS shall be met from the budget of O&MWing of the PHED. Moreover, technical support for minor/major repair shall also beprovided by O&M Wing of PHED. O&M and minor repair manual shall be prepared byPHED and handed over to the DWUA for smooth functioning of the RWSS.
f) DWUA shall sign a memorandum of agreement (MoA) with PHED to give their (DWUA)commitment to undertake regular monitoring and reporting to O&M Wing of PHED,and for carrying out O&M by the DWUA from the revenues generated from thescheme. The disbursement of revenues shall be the sole responsibility of the DWUA.
g) Monitoring of RWSS shall be the sole responsibility of PHED and develop/maintain webbased GIS/MIS of all RWSS and report the level of functionality of RWSS.
h) PHED shall be designated as the lead agency for RWSS working in close coordinationwith LG department in Union and District Councils and its Rules of Business (ROB) shallbe revised including design, construction, installation, commissioning, and monitoring(O&M, minor/major repair) of the rural water supply schemes).

332
i) The Annual Development Plan (ADP) of PHED shall reflect the following: New and ongoing rural WSS (RWSS) Rehabilitation of non-functional RWSS Upgrading/extension of existing RWSS Major repair of existing RWSS Behavioural Change Communication Campaigns/activities, IEC production and
dissemination, trainings (PHED staff & DWUAs)

333
Strategy
Sector CoordinationStrategicObjectives/Outcomes
Short Term Actions1 - 3 years
Medium Term Actions4 - 6 years
Long Term Actions7 - 10 years
Provincial levelcoordination andprogramme managementfor WASH streamlined andenhanced
ACS Development P&DDnotifies broadened scopeof Multi-Sectoral NutritionSteering Committee toencompass WASH
ACS Development P&DDnotifies SectorCoordination andMonitoring Unit for WASHas part of Nutrition Unit
Establish a SectorCoordination andMonitoring Unit inNutrition Unit
Equip and furnish theSCMU
Quarterly review meetingsof Multi-Sectoral SteeringCommittee, DepartmentalTechnical Committee andWASH Steering Committee
Establish a Design Cell inLG&HTPD and PHE&RDD
Quarterly review meetingsof Multi-Sectoral SteeringCommittee, DepartmentalTechnical Committee andWASH Steering Committee
Quarterly review meetingsof Multi-Sectoral SteeringCommittee, DepartmentalTechnical Committee andWASH Steering Committee
District level coordinationand programmemanagement for WASHstreamlined and enhanced
DC Offices notify DistrictWASH Committees
Quarterly review of WASHschemes and activities inmeetings of District WASHCommittees
ACS Development P&DDnotifies DistrictCoordination andMonitoring Unit for WASHunder DC Office
Establish andoperationalise DCMU
Quarterly review of WASHschemes and activities inmeetings of District WASHCommittees
Quarterly review of WASHschemes and activities inmeetings of District WASHCommittees
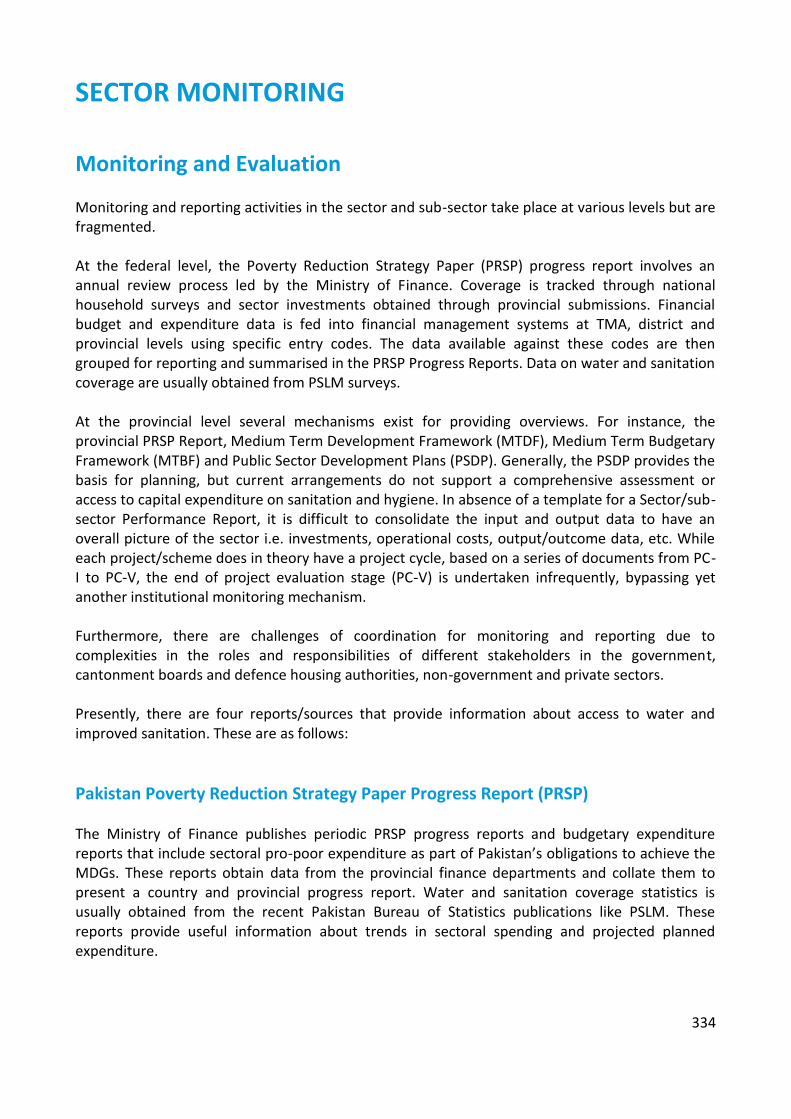
334
SECTOR MONITORING
Monitoring and Evaluation
Monitoring and reporting activities in the sector and sub-sector take place at various levels but arefragmented.
At the federal level, the Poverty Reduction Strategy Paper (PRSP) progress report involves anannual review process led by the Ministry of Finance. Coverage is tracked through nationalhousehold surveys and sector investments obtained through provincial submissions. Financialbudget and expenditure data is fed into financial management systems at TMA, district andprovincial levels using specific entry codes. The data available against these codes are thengrouped for reporting and summarised in the PRSP Progress Reports. Data on water and sanitationcoverage are usually obtained from PSLM surveys.
At the provincial level several mechanisms exist for providing overviews. For instance, theprovincial PRSP Report, Medium Term Development Framework (MTDF), Medium Term BudgetaryFramework (MTBF) and Public Sector Development Plans (PSDP). Generally, the PSDP provides thebasis for planning, but current arrangements do not support a comprehensive assessment oraccess to capital expenditure on sanitation and hygiene. In absence of a template for a Sector/sub-sector Performance Report, it is difficult to consolidate the input and output data to have anoverall picture of the sector i.e. investments, operational costs, output/outcome data, etc. Whileeach project/scheme does in theory have a project cycle, based on a series of documents from PC-I to PC-V, the end of project evaluation stage (PC-V) is undertaken infrequently, bypassing yetanother institutional monitoring mechanism.
Furthermore, there are challenges of coordination for monitoring and reporting due tocomplexities in the roles and responsibilities of different stakeholders in the government,cantonment boards and defence housing authorities, non-government and private sectors.
Presently, there are four reports/sources that provide information about access to water andimproved sanitation. These are as follows:
Pakistan Poverty Reduction Strategy Paper Progress Report (PRSP)
The Ministry of Finance publishes periodic PRSP progress reports and budgetary expenditurereports that include sectoral pro-poor expenditure as part of Pakistan’s obligations to achieve theMDGs. These reports obtain data from the provincial finance departments and collate them topresent a country and provincial progress report. Water and sanitation coverage statistics isusually obtained from the recent Pakistan Bureau of Statistics publications like PSLM. Thesereports provide useful information about trends in sectoral spending and projected plannedexpenditure.

335
Pakistan Social and Living Standards Measurement Survey (PSLM)
The PSLM is conducted annually by the Pakistan Bureau of Statistics. It provides disaggregateddata by province and district, urban and rural, and by quintiles. While essential statistics arecovered every year, additional data is obtained every 3-4 years together with a HouseholdIntegrated and Economic Survey (HIES) that is conducted with the same periodicity. Additionally,PSLM also collects data on sewerage systems and solid waste collection. However, it does notprovide any significant information on hygiene. In addition, PSLM also has statistics on health (e.g.diarrhoea), education, housing etc. The type of WASH related indicators collected in PSLM areshown in Table 55.
Multiple Indicator Cluster Survey (MICS) Balochistan
The MICS is a province specific survey that is usually conducted every 5-6 years and it has a biastowards child, nutritional and reproductive health. It is conducted by the Provincial Bureau ofStatistics in close collaboration with UNICEF. In Sindh, the two recent MICS were done in 2004 and2014. MICS provides useful and more comprehensive data on sources of water and type of toilet.In addition, it is also rich in hygiene indicators. It disaggregates data by district, education profileand by quintiles. It does not collect any data on sewerage systems or solid waste. The type ofWASH related indicators collected in MICS are shown in Table 55.
Pakistan Demographic and Health Survey (PDHS)
The PDHS is also a periodic survey conducted every 7-8 years and its main focus is on health andpopulation. It is supported by USAID with contributions from UN agencies like UNICEF, UNFPA,WHO and UNAIDS. It is conducted by the National Institute of Population Studies in collaborationwith international partners. It has close similarity to MICS. It does not collect any data onsewerage systems or solid waste. The type of WASH related indicators collected in PDHS areshown in Table 55.
Joint Monitoring Programme (JMP) of WHO and UNICEF
The JMP is an official UN mechanism to monitor the progress and achievement of the MillenniumDevelopment Goals on water and sanitation. It is conducted every two years and involves reviewof existing survey data usually about 2-3 years old. The surveys commonly referred to are PSLMand PDHS. JMP utilises regression analysis using population estimates obtained from UnitedNations Population Division (UNPD). This mechanism provides country trends and an overallpicture in water and sanitation for urban and rural. It does not differentiate sub-nationally.

336
Figure 85 - Top 10 countries with the highest numbers of people (in millions) practicing opendefecation
(Source: JMP Report 2014)
Figure 85 shows that Pakistan has the third highest number of people practicing open defecationin the world. Evidence shows that most of these reside in Punjab. This is further evident from Fig86, which shows that 76% of the poorest quintile still lacks access to improved sanitation.
India, 597
Indonesia, 54
Pakistan, 41
Nigeria, 39
Ethiopia, 34
Sudan, 17
Niger, 13
Nepal, 11
China, 10
Mozambique, 10
Rest of the World, 182
Eighty-two per cent of the one billion people practicing open defecation live in 10countries

337
Figure 86 - Disparities in rural improved sanitation coverage
(Source: JMP Report 2014)
Disability
Figure 87 presents an interesting perspective of households that have a person with disability inthe household. About two-thirds (65%) indicated that the population had access to improvedsanitation, while over four-fifths (85%) said that the population had access to improved drinkingwater sources.
These trends are important as all countries that have ratified the UN Convention on Rights ofPersons with Disabilities, of which Pakistan is one of them, are now obliged to ensure that therights of persons with disability for access to improved and safe drinking water and improvedsanitation are implemented in social sector and development initiatives. It also requiresdevelopment of disability sensitive indicators for water and sanitation services.
5%11%2%
4%15% 9%
78% 76%
0%
10%
20%
30%
40%
50%
60%
70%
80%
90%
100%
1995 2010
Open Defecation
Unimproved
Shared
Improved
Poorest
9%
23%2%
4%17%
16%
72%
57%
0%
10%
20%
30%
40%
50%
60%
70%
80%
90%
100%
1995 2010
Open Defecation
Unimproved
Shared
Improved
Poor
12%
35%3%
7%
19%
18%
66%
40%
0%
10%
20%
30%
40%
50%
60%
70%
80%
90%
100%
1995 2010
Open Defecation
Unimproved
Shared
Improved
Middle
20%
63%
2%
7%
17%
17%
61%
13%
0%
10%
20%
30%
40%
50%
60%
70%
80%
90%
100%
1995 2010
Open Defecation
Unimproved
Shared
Improved
Rich
40%
84%3%
7%
16%
9%
41%
0%
0%
10%
20%
30%
40%
50%
60%
70%
80%
90%
100%
1995 2010
Open Defecation
Unimproved
Shared
Improved
Richest
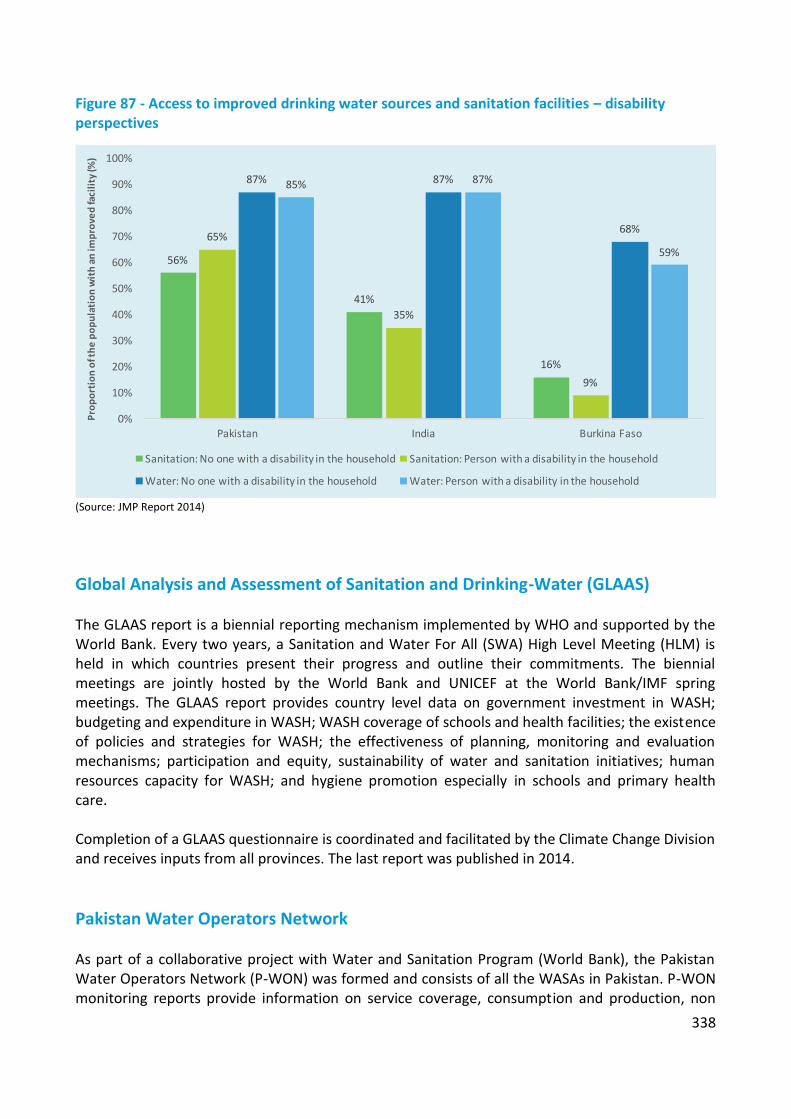
338
Figure 87 - Access to improved drinking water sources and sanitation facilities – disabilityperspectives
(Source: JMP Report 2014)
Global Analysis and Assessment of Sanitation and Drinking-Water (GLAAS)
The GLAAS report is a biennial reporting mechanism implemented by WHO and supported by theWorld Bank. Every two years, a Sanitation and Water For All (SWA) High Level Meeting (HLM) isheld in which countries present their progress and outline their commitments. The biennialmeetings are jointly hosted by the World Bank and UNICEF at the World Bank/IMF springmeetings. The GLAAS report provides country level data on government investment in WASH;budgeting and expenditure in WASH; WASH coverage of schools and health facilities; the existenceof policies and strategies for WASH; the effectiveness of planning, monitoring and evaluationmechanisms; participation and equity, sustainability of water and sanitation initiatives; humanresources capacity for WASH; and hygiene promotion especially in schools and primary healthcare.
Completion of a GLAAS questionnaire is coordinated and facilitated by the Climate Change Divisionand receives inputs from all provinces. The last report was published in 2014.
Pakistan Water Operators Network
As part of a collaborative project with Water and Sanitation Program (World Bank), the PakistanWater Operators Network (P-WON) was formed and consists of all the WASAs in Pakistan. P-WONmonitoring reports provide information on service coverage, consumption and production, non
56%
41%
16%
65%
35%
9%
87% 87%
68%
85% 87%
59%
0%
10%
20%
30%
40%
50%
60%
70%
80%
90%
100%
Pakistan India Burkina Faso
Proportionofthepopulationwithanimprovedfacility(%)
Sanitation: No one with a disability in the household Sanitation: Person with a disability in the household
Water: No one with a disability in the household Water: Person with a disability in the household

339
revenue water, metering practices, network performance, cost and staffing, quality of service,billing and collection, and financial performance. These reports are available online. Some WASAsare particularly efficient and their quarterly reports are up to date, while some may lag behind inthe quarterly reporting. Proposed monitoring indicators for WASA are shown in Table 56.
School Education Management Information System (SEMIS)
The SEMIS collects quarterly information regarding missing facilities (electricity, usable drinkingwater, usable latrine, school cleanliness, boundary wall etc.) in all government schools of Sindh.These are published in periodic progress reports (School Education Profile) of the Reform SupportUnit, Education and Literacy department, Government of Sindh. They provide an invaluableupdate on the status of school WASH.
Annual State of Education Report (ASER)
The ASER report is published annually and is a survey of a representative sample of primary,middle and high schools in the government and private sectors. Apart from enrolment and schoolparticipation data, it also provides information on the status of school drinking water andsanitation facilities.
Pakistan Council of Research in Water Resources (PCRWR)
PCRWR monitor groundwater quality as part of the national water quality monitoring programme(NWQMP). It has surveyed 24 major cities and 23 surface water bodies in Pakistan. Its reports forSindh have been alluded to earlier in the chapter on water quality.
PCRWR monitors the quality of bottled/mineral water regularly and publishes a quarterly report.The reports show that on average, 25%-30% brands are overall unsafe, 20% are chemically unsafe,10% are microbiologically unsafe, 60% brands are consistent, 30%-80% brands disappear from themarket, and 35%-40% new brands appear.
Public Health Engineering Water Testing Laboratories
PHED utilises PCRWR water testing laboratories at district headquarter level in Sindh. It isexpected that these will provide monthly water quality monitoring data.
Monitoring and Evaluation Cell - Planning and Development Department
The P&DD is mandated to monitor identification of schemes, monitoring of schemes duringimplementation, and evaluation after completion of projects. It is mandated to conductevaluations of projects that are completed as indicated in the PC-1. It is the responsibility ofexecuting departments to complete the PC-IV and PC-V and ensure that evaluations are done. The

340
P&DD has established a Monitoring and Evaluation Cell to monitor and evaluate developmentschemes.
Surveys and Evaluations by State and Non State Actors
Project surveys, research and evaluations are also undertaken by other councils (e.g. PakistanCouncil for Scientific and Industrial Research), government departments (e.g. Irrigation,Agriculture, Fisheries etc.), university departments, bilateral and multi-lateral donors, UNagencies, national and international non-governmental organisations.
Collation, Synthesis and Dissemination
Despite the mass of information available from disparate sources, monitoring reports, evaluationstudies, surveys, research studies etc., there is no mechanism to collate and synthesise thisinformation and disseminate to policy, management and operational level stakeholders.
The development of a Management Information System (MIS) for Drinking Water and Sanitationhas been started a few years back and is still in the piloting stage in different parts of the country.The new MIS shall be based on GPS data creating decision-making and analytical scenarios for thegovernment to develop effective sanitation programmes.
Under public sector development programme financed by Government of Pakistan, the ClimateChange Division has started development of a national MIS for WASH from July 2013 and this islikely to be completed over a period of three years.
Furthermore, there are efforts from various actors to set up different monitoring systems andreporting formats. While these may be useful for project specific interventions, they do not bearany semblance to existing institutional monitoring and reporting systems, with the result thatmonitoring and evaluation information flows remain fragmented, uptake by executing agenciesand institutional partners is low, and the sector and sub-sectors remain under-reported. Synergiesbetween government initiatives in the subsectors of water supply, sewerage and solid wastemanagement and those of national and international non-governmental organisations aresometimes hard to achieve.
Presently, there is no systematic approach for the monitoring and evaluation of sanitationprojects. The concept of PC-2 is even missing which provides the basis for need identification.
Sector tracking is mainly based on the data of MICS and PSLM conducted by provincial and federalBureau of Statistics with the support of UN and other international development agencies.
There is need for developing a MIS for water and sanitation with defined capacity development ofLocal Government Units up to Union Council level to provide information on quarterly or sixmonthly basis to update the status about coverage, access and need of the respective areas.

341
During development of PC-1, data collection should also be included so that accurate data is usedinstead of inaccurate or anecdotal estimations. There is need to estimate population served bywater supply pipe for drinking water, and take into consideration the population and resourcesavailable. It should be made mandatory for the Irrigation Department, LG&HTPD and PHE&RDD toupload GPS for every project.
For monitoring of drinking water and sanitation indicators to be institutionalised, it is essentialthat monitoring of the sector is contextualised within the broader monitoring framework of theprovince and that key stakeholders like the Bureau of Statistics, P&DD, and those involved withmanagement information systems facilitate information management for drinking water andsanitation. At district level, the monitoring unit should be placed under the Deputy Commissioner.
Monitoring and Reporting Information Systems
The monitoring and reporting systems appear to cluster into three groups (Fig 88). The first groupis where there are regular annual or more frequent reports. The second group includes those thathave a periodicity of between 2-5 years, provide some mid-term trends, are isolated activities andmay not be performance related. The third group provides a long term perspective and is useful tosee broader societal impact of social sector investments and behaviour change.
Figure 88 - Existing monitoring and reporting systems
PSLM
ProjectEvaluationsand surveys
PCRWR
PDDPDHS
MICS
PCSIR
GLAAS
JMPASER
PMIU
PCRWR
Regular and everyyear or less
Periodic with a 2–5years time span
Long term usually>5-7 years
PHEDLabs
Research
PRSP

342
However, it is interesting to note that several institutional monitoring and reporting systemsalready exist, but the potential to distil information for policy, planning and execution has notbeen adequately harnessed.
Proposed monitoring indicators for district municipal services are shown in Table 57.

343
Performance Measurement Framework
The key performance indicators for the Sindh WASH sector plan are presented below.
ResultStatements
Performance Indicators Targets for2026
CollectionMethods
CollectionFrequency
OutcomeResultsAccess toimproved watersupply
Proportion of Population with Access toImproved Water Sources (%) that is: Accessible Available Safe
% Rural% Urban
MICSPDHS
4 years
Access toimprovedsanitation
Proportion of latrines atHousehold/Population levels connectedwith sewerage and drainage (%)
% Rural% Urban
MICSPDHSPSLM
4 years
Proportion of households using improvedsanitation (latrines) (%) that is: Not shared Disposed safely to a closed sewerage
system
% Rural% Urban
PSLMMICSPDHS
Annually4 years
Reduced ChildMortality
Proportion of Children Under 5 WhoSuffered from Diarrhoea in the last 15days (MICS); last 30 days (PSLM) (%)
% MICSPSLM
4 yearsAnnual
Diarrhoea in those <5 years and >5 years– seen as outpatients at health facilities(%)
% DHIS Annual
Diarrhoea in those <5 years and >5 years– admitted as inpatients at healthfacilities (%)
% DHIS Annual
Children <5 years who are underweight(%) Moderate and severe Severe
% MICS 4 years
Children <5 years who are stunted (%) Moderate and severe Severe
% MICS 4 years
Children <5 years who are wasted (%) Moderate and severe Severe
% MICS 4 years
OutputsImplementationof water supplyschemes
Number of water supply schemesimplemented
PHE&RDDLG&HTPD
Quarterly
Rehabilitation of Dysfunctional schemes PHE&RDDLG&HTPD
Quarterly
Number of households having watersupply connections
KW&SBNSUSC
H-WASAPHE&RDDLG&HTPD
Annually
Water filtrationPlants
Number of filtration plants installed andoperational
PHE&RDD Monthly

344
established Number of beneficiaries getting cleandrinking water
PHE&RDD Quarterly
Water quality Number of water quality testing servicesin operation
PHE&RDDPCRWR
Quarterly
Number of water samples examined PHE&RDD Monthly
Proportion of households practicing homewater treatment (%)
% MICSPCRWR
4 yearsAnnually
Waterresourceseffectivelymanaged
Number of locations with rain waterharvesting schemes initiated
PHE&RDDLG&HTPD
Annually
Implementationof sanitationschemes
Number of sanitation schemesimplemented
LG&HTPD andPHE&RDD
Monthly
Implementationof ODF invillages
Number of villages ODF certified LG&HTPD Monthly
Environmentfriendlydisposal ofsewage water
Number of pilot decentralised sewagewater treatment system constructed
LG&HTPDPHE&RDDH-WASANSUSC
Annually
Public Toiletsfor thecommunities
Number of the public toilets established LG&HTPD Quarterly
Solid WasteManagement inCities
Number and level of coverage of solidwaste in towns/cities
LG&HTPD Six monthly
Enhanced solidwastecollection
Percentage of garbage/waste collectedagainst the estimate/amount of garbageproduced
LG&HTPD Monthly
Number of cities where secondarycollection points established for small andmedium cities
LG&HTPD Monthly
Number of approved/recognisedslaughterhouses practicing hygienicdisposal of slaughter waste as perguidelines
LG&HTPD Monthly
ImprovedHospital wastemanagement
Health facilities whose staff have beentrained in hospital waste management
HealthDepartment
Annually
Health facilities that have adopted andare practising hospital wastemanagement guidelines
HealthDepartment
Annually
Health facilities (hospitals) that have aninfection control committee
HealthDepartment
Annually
School WASH Number of schools with functional watersupply at primary, middle and secondarylevels
EducationDepartment
SEMIS
Quarterly /Annually

345
Number of schools with functionallatrines at primary, middle and secondarylevels
EducationDepartment
SEMIS
Quarterly /Annually
Number of water supply schemes withwater supply extensions to local schools
EducationDepartment
SEMISPHE&RDD
Annually
HealthSurveillance forWater BorneDiseases
Pattern of Water borne diseases ondistrict and sub district basis – No ofhealth alerts issued
HealthDepartment
Quarterly
Health Unitswith WASH
Health facilities with functional watersupply
HealthDepartment
Quarterly
Health facilities with functional latrinefacilities
HealthDepartment
Quarterly
Improvedsectoralgovernance
Multi-sectoral Steering Committeemeetings for policy guidance, andimproved planning and coordination
P&DD Quarterly / Sixmonthly
Coordination Meeting of WASH partnersin Technical Committee at Departmentallevel
LG&HTPDPHE&RDD
Quarterly / Sixmonthly
Quarterly Progress Report of WASHSector Plan
LG&HTPDPHE&RDD
P&DD
Quarterly
Number of cities with Master Plans forwater supply and sewerage and drainageup to 2026
LG&HTPDPHE&RDDUrban Unit
P&DD
Annually
Consumer water meters installed foraccurate billing for small and mediumcities (water supplies) and big cities(through service connection fee/government support)
KW&SBH-WASANSUSC
LG&HTPDPHE&RDD
Annually
Number of cities with Master plans forsolid waste management
LG&HTPD Annually
Joint Sector Reviews LG&HTPDPHE&RDD
Annually
Sector Expenditure Review LG&HTPDPHE&RDD
Annually

Table 55 - Comparative WASH indicators in PSLM, PDHS and MICS
PSLM Indicators PDHS Indicators MICS IndicatorsDRINKING WATER DRINKING WATER DRINKING WATERWater delivery system Urban, rural and overall
Tap WaterHand PumpMotor PumpDug WellOthers
Improved source ofdrinking water
Piped into dwelling/yard/plotPublic tap/standpipeTube well or borehole/handpumpProtected wellProtected spring/rain waterBottled waterFiltration plant
Main source of drinkingwater - improved
Piped into dwellingPiped into compound, yard orplotPipe d to neighbourPublic tap / standpipeTube wellHand pump (tap)Motorised pump (donkey /turbine)Protected wellProtected springBottled water (mineral)
Unimproved source ofdrinking water
Unprotected wellUnprotected springTanker truck/cart with drumSurface water
Other source
Main source of drinkingwater - unimproved
Unprotected wellUnprotected springTanker-truckCart with small tank / drumSurface water (Toba, river,stream, dam, lake, pond,canal)Bottled water (mineral)Other/ Missing
Main source of drinkingwater by income group
1st, 2nd, 3rd, 4th and 5th
quintilesSource of drinking waterProvince, urban, rural andoverall
Water treatment prior todrinking
BoiledBleach/chlorine addedStrained through clothCeramic, sand, or other filterSolar disinfectionOtherNo treatment
Percentage using anappropriate treatmentmethod
Water treatment methodused in the household
BoilAdd bleach/chlorineStrain through a clothUse water filterSolar disinfectionLet it stand and settleOtherNone
Percentage of householdmembers in households usingunimproved drinking watersources and using anappropriate water treatmentmethod using an appropriatetreatment method

347
PSLM Indicators PDHS Indicators MICS IndicatorsDRINKING WATER DRINKING WATER DRINKING WATERPercentage householdspaying for water by regionand water source
Households getting waterfrom sourceHouseholds paying for waterAverage amount paid permonthUrban, rural and overallSource of water – tap water,hand pump, motorised pump,dug well, river/canal/stream,other
Percentage of householdspaying for piped water byregion and quintile
Urban, rural and overall1st, 2nd, 3rd, 4th and 5th
quintiles
Who installed the waterdelivery system byprovince
Water delivery system – pipedwater, hand pump, motorpump, open well, closed wellLocal governmentNon-governmentHousehold itselfDon’t knowTotal
Distance to water sourceby province
Water source – tap water,hand pump, motorised pump,dug well, river/canal/stream,otherInside the house, 0-0.5 Km,0.5-1 Km, 1-2 Km, 2-5 Km,Over 5 Km
Time to obtain drinkingwater (round trip)
Water on premisesLess than 30 minutes30 minutes or longerDon’t know/missing
Time to source of drinkingwater
Users of improved orunimproved drinking watersources
Water on premises< 30 minutes30 + minutesMissing/Don’t know
Percentage of householdswithout drinking water onpremises
Person usually collectingwater
Adult woman (age 15+ years)Adults man (age 15+ years)Female child (under 15 years)Male child (under 15 years)Don’t know or missing

348
PSLM Indicators PDHS Indicators MICS IndicatorsSANITATION SANITATION SANITATIONType of toilet Urban, rural and overall
FlushNon-FlushNo Toilet
Improved, not sharedfacility
Flush/pour flush to pipedsewer systemFlush/pour flush to septic tankFlush/pour flush to pit latrineVentilated improved pit (VIP)latrinePit latrine with slab
Improved sanitation facility Flush to piped sewer systemFlush to septic tankFlush to pit latrineFlush to unknown place/notsure/don’t know whereVentilated improved pit (VIP)latrinePit latrine with slabComposting toilet
Type of toilet used by thehousehold by province
Flush, non-flush and no toiletProvince, urban, rural andoverall
Non-improved facility Flush/pour flush not tosewer/septic tank/pit latrinePit latrine without slab/openpitBucketHanging toilet/hanging latrineNo facility/bush/fieldOtherMissing
Unimproved sanitationfacility
Flush to somewhere elsePit latrine without slab/openpitBucketOtherMissingOpen defecation (no facility,bush, field)
Type of toilet used by thehousehold by quintile
Flush, non-flush and no toiletUrban, rural and overall1st, 2nd, 3rd, 4th and 5th
quintiles
Shared facility Flush/pour flush to pipedsewer systemFlush/pour flush to septic tankFlush/pour flush to pit latrineVentilated improved pit (VIP)latrinePit latrine with slab
Users of improved orunimproved sanitationfacilities
Not sharedPublic facilityShared by 5 households orlessShared by more than 5householdsMissing/don’t knowOpen defecation (no facility,bush, field)
Type of sanitation systemused by province
Underground drainsCovered drainsOpen drainsNo systemUrban, rural and overall
Type of sanitation systemused by quintiles
Underground drainsCovered drainsOpen drainsNo systemUrban, rural and overall1st, 2nd, 3rd, 4th and 5th
quintiles
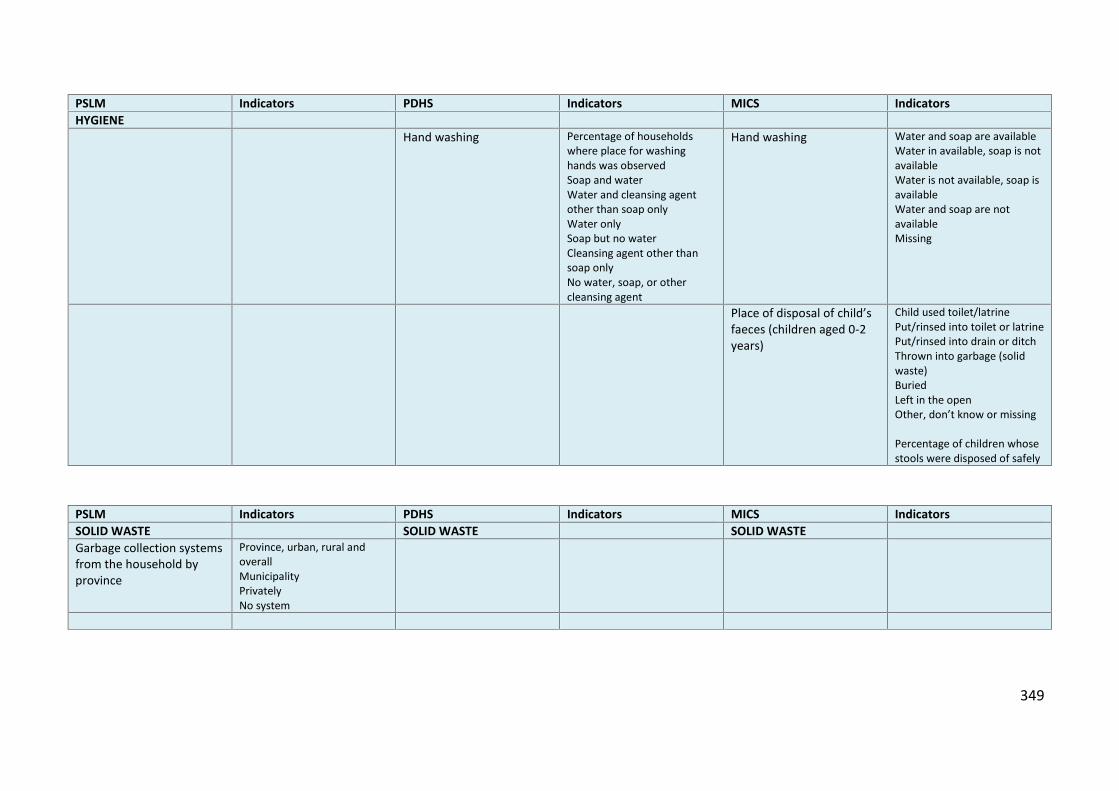
349
PSLM Indicators PDHS Indicators MICS IndicatorsHYGIENE
Hand washing Percentage of householdswhere place for washinghands was observedSoap and waterWater and cleansing agentother than soap onlyWater onlySoap but no waterCleansing agent other thansoap onlyNo water, soap, or othercleansing agent
Hand washing Water and soap are availableWater in available, soap is notavailableWater is not available, soap isavailableWater and soap are notavailableMissing
Place of disposal of child’sfaeces (children aged 0-2years)
Child used toilet/latrinePut/rinsed into toilet or latrinePut/rinsed into drain or ditchThrown into garbage (solidwaste)BuriedLeft in the openOther, don’t know or missing
Percentage of children whosestools were disposed of safely
PSLM Indicators PDHS Indicators MICS IndicatorsSOLID WASTE SOLID WASTE SOLID WASTEGarbage collection systemsfrom the household byprovince
Province, urban, rural andoverallMunicipalityPrivatelyNo system

350
PSLM Indicators PDHS Indicators MICS IndicatorsHEALTH HEALTH HEALTHDiarrhoea in children under5 years in the past 30 days
Children under five (5)suffering from diarrhoea inpast 30 days – by region andprovinceDiarrhoea cases: duration ofepisodeDiarrhoea cases: severity ofillnessDiarrhoea cases in past 30days - by province andquintilesTreatment of diarrhoea inchildren under 5 years– byregion and province
Diarrhoea in children under5 years in the two weekspreceding the survey
All diarrhoeaDiarrhoea with blood
Also related with source ofdrinking water and type oftoilet facility (improved, notimproved etc.)
Percentage of children age0-59 months withdiarrhoea in the last twoweeks, and treatment withoral rehydration solutionsand recommendedhomemade fluids
Had diarrhoea in last twoweeks
Children with diarrhoea whoreceived:
ORS (Fluid from ORS packet orpre-packaged ORS fluid)Any recommendedhomemade fluid (Boil water,Sugar, Salt etc.,)ORS or any recommendedhomemade fluid
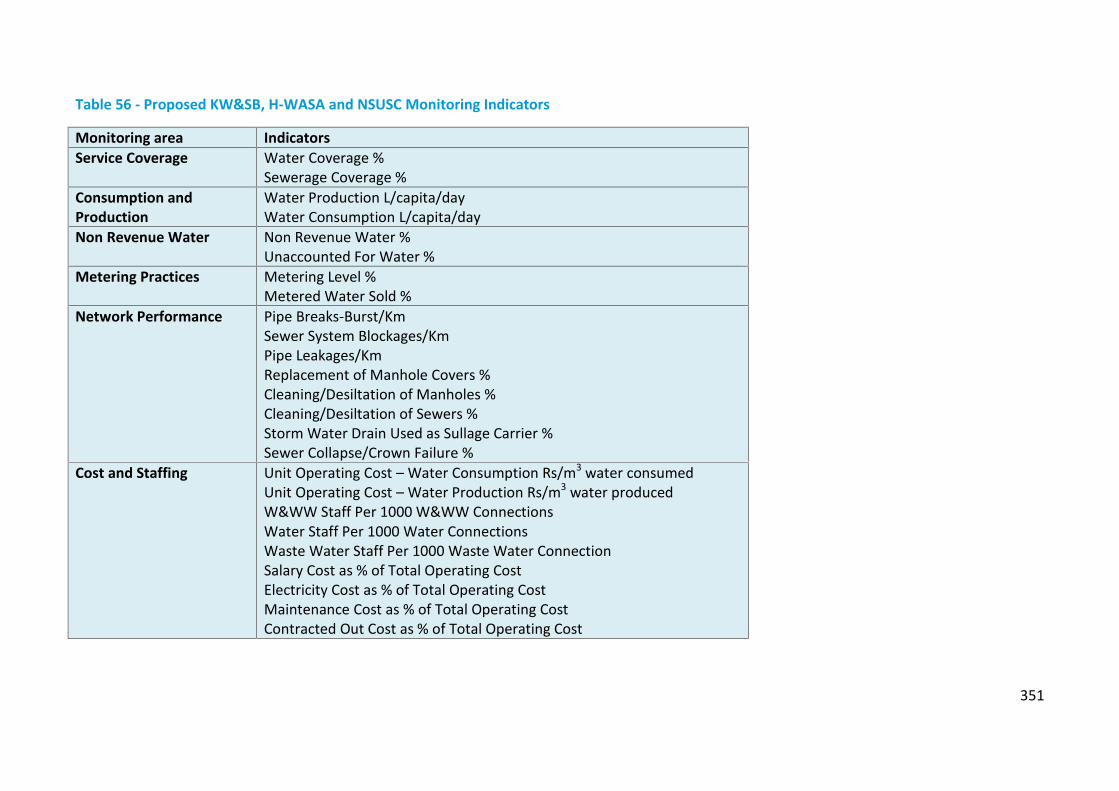
351
Table 56 - Proposed KW&SB, H-WASA and NSUSC Monitoring Indicators
Monitoring area IndicatorsService Coverage Water Coverage %
Sewerage Coverage %Consumption andProduction
Water Production L/capita/dayWater Consumption L/capita/day
Non Revenue Water Non Revenue Water %Unaccounted For Water %
Metering Practices Metering Level %Metered Water Sold %
Network Performance Pipe Breaks-Burst/KmSewer System Blockages/KmPipe Leakages/KmReplacement of Manhole Covers %Cleaning/Desiltation of Manholes %Cleaning/Desiltation of Sewers %Storm Water Drain Used as Sullage Carrier %Sewer Collapse/Crown Failure %
Cost and Staffing Unit Operating Cost – Water Consumption Rs/m3 water consumedUnit Operating Cost – Water Production Rs/m3 water producedW&WW Staff Per 1000 W&WW ConnectionsWater Staff Per 1000 Water ConnectionsWaste Water Staff Per 1000 Waste Water ConnectionSalary Cost as % of Total Operating CostElectricity Cost as % of Total Operating CostMaintenance Cost as % of Total Operating CostContracted Out Cost as % of Total Operating Cost

352
Monitoring area IndicatorsQuality of Service Continuity of Service per day
Chemical Unfit Source(s) %Biologically Unfit Source(s) %Chemically Unfit at Taps %Biologically Unfit at Taps %Water Quality – % of Required Residual Chlorine TestWater Quality – Samples Passing On Residual Chlorine %Complaints About W&WW Services % of total connectionsWaste Water Treatment – Primary Level %Waste Water Treatment – Secondary Level %
Billing and Collection Average Revenue Water and Waste Water Rs/m3 water soldCollection Period daysBilling Efficiency %Collection Efficiency (Physical) %Collection Efficiency (Financial) %
Financial Performance Operational Cost Coverage (ratio)Working RatioDebt Servicing %

353
Table 57 - Proposed Monitoring Indicators for District Municipal Services
Water Supply (six monthly) Sewerage (annual) Solid Waste (daily and monthly) Slaughterhouse (annual)Source of water supplyWater TasteGround water table depth in feetNumber of Tube wellsNumber of Tube Wells with bad statusOverhead reservoirGround storage tanksCoverage %Consumer connectionsServed HouseholdsWater Tariff residentialWater Tariff commercial
Coverage %Disposal stationOpen drains
City coverage %House to House primary collectionNumber of collection pointsDumpingAverage Solid Waste collection %Average Solid Waste collectionTons/day
Number of slaughterhousesDisposal of Slaughterhouse solidwaste
Walled waste dumpsMetaled trayWheel barrowsHand cartsTractorsSteel containers openCovered containersTractor trolleysTractor with bladeTractor with bucket loaderMechanised loaderDumper trucksArm roll truckMechanical SweeperContainer carrierWater tankerRickshawsLitter bins

354
Water Supply Sewerage Solid Waste SlaughterhouseTehsil Officer TO (I&S)Assistant Tehsil Officer ATO (I&S)SupervisorSub-EngineerOperatorsHead tube well operatorPlumbersWater CheckerValve manBeldarChowkidar
Chief Sanitary OfficerSupervisory OfficersSanitation InspectorSanitary InspectorsSupervisorsSanitary WorkersVehicle driversWater carriersSanitary MateSpray manAuto mechanicsAuto electriciansHelpers
Veterinary doctor

Strategy
Sector MonitoringStrategicObjectives/Outcomes
Short Term Actions1 - 3 years
Medium Term Actions4 - 6 years
Long Term Actions7 - 10 years
Monitoring and reportingmechanism developed forwater and sanitationschemes
Reporting templates forwater supply andsanitation schemesdeveloped and tested;Reporting pathwayestablished from UC todistrict to provincial level
District LG&HTPD andPHE&RDD staff trained inits use
Annual WASH progressreports produced
Annual WASH progressreports produced
Improved infrastructure formonitoring and reportingestablished for watersupply schemes
Establish 29 districtmonitoring units based atDC Office – 1 per district
Procure computers andaccessories for MIS – 5 setsper district for watersupply schemes
Develop computerised MISfor water supply schemes –29 districts
Maintain districtmonitoring units
Data collection andreporting of water supplyschemes done on real timethrough web-basedapplication
Maintain districtmonitoring units
Data collection andreporting of water supplyschemes done on real timethrough web-basedapplication
Improved infrastructure formonitoring and reportingestablished for sanitation,sewerage and drainageschemes
Procure computers andaccessories for MIS – 5 setsper district for sanitation,sewerage and drainageschemes
Develop computerised MISfor sanitation, sewerageand drainage schemes – 29districts
Data collection andreporting of sanitation,sewerage and drainageschemes done on real timethrough web-basedapplication
Data collection andreporting of sanitation,sewerage and drainageschemes done on real timethrough web-basedapplication
Monitoring and reportingcapacity enhanced forwater and sanitation
Recruit and deploy a 29District M&E Managersbased at DC Office – 1District M&E Manager perdistrict
Recruit and deploy 58Water and SanitationReporting Officers – 2 perdistrict based at DC Office
Recruit and deploy 29drivers – 1 driver perdistrict based at DC Office
Maintain District M&EManagers, Water andSanitation ReportingOfficers and Drivers
Maintain District M&EManagers, Water andSanitation ReportingOfficers and Drivers
Travel for monitoring andreporting facilitated
Procure 29 vehicles formonitoring and reporting –1 vehicle per district basedat DC Office
Maintain vehicles Maintain vehicles

356
CONSOLIDATED SECTOR DEVELOPMENT PLAN
Vision and Strategic Priorities
VisionA Clean and Healthy Sindh by 2026 whose population enjoys good health as a result of asustainable supply of safely managed clean drinking water, universal access to safe and improvedsanitation, good nutrition and a safe and hygienic environment.
Strategic Priorities
Legislation Introduce legislative measures and regulations to create an enabling framework for nutrition-
sensitive safely managed drinking water supply and sanitation and promote integrated waterresource management
Water Resources Ensure that all drinking water resources and supply systems are safely managed and protected
with community involvement Develop district level drinking water availability plans for urban and rural areas to ensure
improved planning for equitable access
Drinking Water Supply Enhance the coverage of safely managed drinking water supply in the province to achieve the
Sustainable Development Goals (SDGs) targets Develop criteria for installation of new nutrition-sensitive safely managed drinking water
supply schemes and ensure that all new schemes are rationalised and constructed throughneed based criteria so that all areas and communities are served
Develop standardised service delivery models for both nutrition-sensitive safely managedurban and rural drinking water supply schemes to improve efficiency, improve monitoring andsustainability
Develop and promote cost effective and appropriate technological options for nutrition-sensitive safely managed drinking water supply systems
Aim for a minimum per capita requirement of 50 litres (11 gallons) per day in urban and ruralareas for domestic purposes, and 25 litres (5.5 gallons) per day for communal points in ruralareas
Develop mechanisms for reuse, recycle and recharge of wastewater for other municipal andproductive uses
Drinking Water Quality Ensure that all drinking water supply systems are designed and constructed in line with the
national drinking water quality standards Ensure compliance of all municipal discharges with National Environment Quality Standards
(NEQS)
357
Install water treatment plants at existing drinking water supply schemes where required andincorporate water treatment facilities in all new drinking water supply schemes
Ensure development of water safety plans for all drinking water supply systems Develop and sustain regular drinking water quality monitoring and surveillance, and institute
mechanisms for remedial action
Sanitation and Solid Waste Eradicate Open Defecation from Sindh Province Ensure that households in Sindh have access to and use safely managed nutrition-sensitive
sanitation services and facilities Strengthen and implement liquid waste management with sewer lanes and covered/improved
drains Create and develop safe wastewater treatment mechanisms Implement integrated solid waste management
Health and Hygiene Increase public awareness about water borne and water-related diseases and their
implications to health and nutrition, and enhance the role of communities for household watertreatment/storage, water safety and conservation, and safe hygiene and improved nutritionpractices
Institute behaviour change so that households wash hands with soap at critical times
Education Introduce curricular change to incorporate health, hygiene and nutrition-sensitive improved
water and sanitation practices among school children
Sector Efficiency Update the status of non functional drinking water supply schemes and rehabilitate those that
are ‘fit for repair’ and can be operationalised on priority basis Develop an inventory of ageing infrastructure and prioritise replacement of old and
dilapidated drinking water supply systems in a phased manner Institute reforms in the drinking water supply sector to improve governance and
accountability, enhance professional management, introduce performance measurement, andstrengthen monitoring and cost recovery mechanisms
Sector Capacity Enhance capacities of line departments, NGOs and communities at all levels to improve
planning, implementation and monitoring of drinking water supply projects and institutesustainable O&M of drinking water supply systems
Sector Financing Periodically revise the water tariff according to ground realities and ensure its timely collection Introduce mandatory water metering in all new schemes and upgrade water metering in
existing schemes in a phased manner Promote public-private-partnerships to enhance access to safe drinking water and sanitation
and sustainable operation & maintenance of water supply systems Allocate and utilise at least 10% of the ADP towards water and sanitation

358
Sector Coordination Conduct mapping and stakeholder analysis to determine the sector state and non-state actors,
and formulate coordination and reporting mechanisms for drinking water at provincial, district,taluka and village level cognisant of urban and rural implications
Pursue multi/inter-sectoral collaboration to maximise the impacts of drinking water supplyinterventions
Sector Monitoring Develop the modus operandi for monitoring and clarify information pathways for collection,
reporting, synthesis and dissemination of drinking water supply and sanitation data forimproved planning, monitoring and evaluation, and execution
Develop and ensure a viable support mechanism for effective O&M of both urban and ruraldrinking water supply and sanitation schemes
Institutional Arrangements Clarify the roles and responsibilities of various government agencies and other stakeholders in
the drinking water sector and reduce fragmentation of services Ensure involvement of communities in identifying, planning, designing, construction,
monitoring and O&M of drinking water supply and sanitation schemes for sustainability Promote research and development in collaboration with academia to enhance the access,
effectiveness and sustainability of drinking water supply and sanitation interventions
Climate Change and Disaster Risk Reduction Institute adaptation measures and disaster risk reduction and mitigation strategies to minimise
the impact of climatic events and disasters on drinking water supply and sanitation systems

359
Strategic Objectives/Outcomes and Actions
Legislations, Regulations, Policies and StrategiesStrategicObjectives/Outcomes
Short Term Actions1 - 3 years
Medium Term Actions4 - 6 years
Long Term Actions7 - 10 years
Finalisation of draftedpolicies and theirimplementation
Approval of Draft DrinkingWater Policy, Revised DraftSanitation Policy, and DraftBehaviour ChangeCommunication Strategyand their implementation
Sindh Local GovernmentAct 2013 provisions forWASH operationalised
Conduct a review of theSLGA and develop Rules ofBusiness for LG&HTPD andPHE&RDD. Seekamendment in SLGA 2013to clearly indicate role ofPHE&RDD in rural watersupply and sanitation,O&M, and provideadministrative transfer ofstaff and funds
Municipal water governedby a legal framework
Enactment andpromulgation of the SindhMunicipal Water Act (draft)
City and Town masterplans developed andincorporate zone-wisedevelopment of watersupply, sewerage anddrainage, and solid wastemanagement
Industrial wastewatermanagement regulationsput into effect in industrialzones and curbs to stoppollution enforced
Sindh Water Commissionperforms its functions as aregulatory body
Establishment of the SindhWater Commission
Tariff structure revised
Minimum service deliverystandards established formunicipal services (watersupply, sanitation, solidwaste management)
Ensure that each localgovernment has a masterplan on water, sanitationand solid wastemanagement for its area ofjurisdiction
At least 25% localgovernments achieveminimum service deliverystandards for municipalservices (water, sanitation,solid waste management)
At least 50% localgovernments achieveminimum service deliverystandards for municipalservices (water supply,sanitation, solid wastemanagement)
Legislative review toharmonise existinglegislation, policies andrules
Legislative review ofdrinking water acts,policies, regulations anddevelopment ofharmonised new acts,regulations and guidelines,
Periodic review of newlegislations, policies andregulations and theirimplications for WASH
Periodic review of newlegislations, policies andregulations and theirimplications for WASH

360
including O&M
Introduce legislativechange in SLGA 2014 forPHE&RDD to beresponsible for O&M ofwater and sewerage anddrainage schemes, andtransfer resources andmanpower to PHE&RDD fortheir proper maintenance
Legislative review ofsanitation, sewerage anddrainage acts, policies,regulations anddevelopment ofharmonised new acts,regulations and guidelines,including O&M
Sectoral operatingprocedures (designguidelines) for planningand managementdeveloped
Development of StandardOperating Procedures(design guidelines) forwater planning,management and O&M forPHE&RDD
Development of StandardOperating Procedures(design guidelines) forwastewater and solidwaste planning,management and O&M forLG&HTPD
Operational guidelines forCBOs for water andsanitation developed
Development of guidelinesfor CBOs for projectmanagement and O&M ofwater supply schemes
Development of guidelinesfor CBOs for projectmanagement and O&M forsanitation, sewerage anddrainage schemes
Municipal services dutybearers have necessarymanagerial and leadershipskills for an integrated,safely managed andnutrition-sensitive watersupply, sewerage anddrainage, and solid wastemanagement programme
Orientation and capacitybuilding programme of 2big cities, 119 town and1297 union council officialson application ofregulations, policies andstrategies in planning,development and deliveryof municipal services thatare integrated, safelymanaged and nutrition-sensitive
At least 50% of 2 big cities,119 town and 1297 unioncouncil officials haveparticipated in a capacitybuilding programme onplanning for andimplementing watersupply, sewerage anddrainage, and solid wastemanagement that areintegrated, safely managedand nutrition-sensitive
At least 90% of 2 big cities,119 town and 1297 unioncouncil officials haveparticipated in a capacitybuilding programme onplanning for andimplementing watersupply, sewerage anddrainage, and solid wastemanagement that areintegrated, safely managedand nutrition-sensitive

361
Water ResourcesStrategicObjectives/Outcomes
Short Term Actions1 - 3 years
Medium Term Actions4 - 6 years
Long Term Actions7 - 10 years
Improved water resourceutilisation through efficientproject design andexecution
P&DD to issue thefollowingAdvisories/Circulars:
All future reservoirs – basicdesign will have outlets fordrinking water dependingon storage capacity
Gravity flow lines are usedwhere feasible
Every embankment musthave provision for pipeoutlet for drinking water
There must be waterstorage provision in designfor outlet in times ofcalamity – all fieldengineers would need tocomply and ensure that adrinking water supplycomponent was part oftheir projects and ensurethat a share for drinkingwater is allocated
It is mandatory to includeGIS mapping for everydrinking water supplyproject
Every new drinking watersupply scheme must havean outlet for distribution tolocal schools and healthfacilities - All newPHE&RDD Water Supplyschemes must ensure thatthey provide an extensionwater pipe to the nearbyschool with its water tank
District profiles developedfor water resourcemanagement anddevelopment
Conduct a study on waterresource management anddevelopment in eachdistrict and map availablewater resources withpotential for domestic andmunicipal use (5 districts inshort-term) andupgradation
Conduct a study on waterresource management anddevelopment in eachdistrict and map availablewater resources withpotential for domestic andmunicipal use (10 districtsin medium-term) andupgradation
Conduct a study on waterresource management anddevelopment in eachdistrict and map availablewater resources withpotential for domestic andmunicipal use (14 districtsin long-term) andupgradation

362
Manchar Lake should bepreserved
RBOD development shouldbe completed on prioritybasis
Develop an integratedwater resourcesmanagement policy andimplementationframework
District level preparednessfor safety of water andsanitation systems anddisaster risk reductionenhanced
Map out all UCs with riskassociated with disastersand safety of water andsanitation systems (5districts)
Conduct planning for safetyof water and sanitationsystems and disaster riskreduction at district level (5districts in short term) forduty bearers
Ensure water quality focusof embankments
Conduct planning for safetyof water and sanitationsystems and disaster riskreduction at district level(10 districts in mediumterm) for duty bearers
Build capacities at townand UC level for planningfor safety of water andsanitation systems anddisaster risk reduction atdistrict level (60 towns and500 UCs)
Ensure water quality focusof embankments
Conduct planning for safetyof water and sanitationsystems and disaster riskreduction at district level(14 districts in long term)for duty bearers
Build capacities at townand UC level planning forsafety of water andsanitation systems anddisaster risk reduction atdistrict level (59 towns and797 UCs)
Ensure water quality focusof embankments
Sectoral capacity forclimate change adaptationand mitigation developed
Sub-sector climate changeadaptation and mitigationstrategies developed
Mapping of towns at risk ofeffects of climate change
Piloting of climate changeadaptation and mitigationin selected towns (to beidentified)
Climate change mitigationcapacities developed inphased manner in townslocated in zones vulnerableto climatic events (to beidentified)
Municipal services dutybearers fully conversantwith climate change and itsmitigation strategies
Need assessment of sub-sector human resources forclimate change adaptationand mitigation
Capacity buildingprogramme of city, townand union council officialsin pilot areas on climatechange mitigationstrategies
Capacity buildingprogramme of city, townand union council officialson climate changemitigation strategiesextended to other areas
Rainwater harvestingsystems implemented inpilot areas
Rainwater harvesting pilotprojects evaluated andplan to extend to otherfeasible cities developed
In participating pilot areas,rainwater harvestingprovides at least 10% ofwater used for non-domestic municipalservices and horticulture
In participating pilot areas,rainwater harvestingprovides at least 30% ofwater used for non-domestic municipalservices and horticulture

363
Water SupplyStrategicObjectives/Outcomes
Short Term Actions1 - 3 years
Medium Term Actions4 - 6 years
Long Term Actions7 - 10 years
URBAN WATER SUPPLYAll cities, towns and UCshave surveys, strategiesand action plans forintegrated water supply,water safety, sewerage anddrainage, storm waterdrainage and solid wastemanagement
(common to water supply,sanitation and solid waste)
All cities have completedbaseline surveys, GISmapping and strategies,and start implementingaction plans for integratedwater supply, water safety,sewerage and drainage,storm water drainage andsolid waste managementon need basis
Develop integrated watersupply, water safety,sanitation, storm waterdrainage and solid wastemanagement action plansfor all cities
At least 50% of UCs (500)have completed baselinesurveys, GIS mapping andstrategies, and startimplementing action plansfor integrated watersupply, water safety,sewerage and drainage,storm water drainage andsolid waste managementon need basis
Develop integrated watersupply, water safety,sanitation, storm waterdrainage and solid wastemanagement action plansfor 500 UCs
At least 100% UCs (797)have completed baselinesurveys, GIS mapping andstrategies, and startimplementing action plansfor integrated watersupply, water safety,sewerage and drainage,storm water drainage andsolid waste managementon need basis
Develop integrated watersupply, water safety,sanitation, storm waterdrainage and solid wastemanagement action plansfor 797 UCs
Improved and safelymanaged water supplycoverage enhanced tomeet access gap
Develop an SOP for all newand existing water supplyschemes to provideimproved and safelymanaged drinking waterwhich is: Accessible: located on
premises Available: available
when needed Safe: free of faecal and
priority chemicalcontamination
Augmented byimproved transmissionand distributionnetworks andincreased overheadreservoir capacity
Plan and implement safelymanaged water supplyschemes to reduce accessgap By 20% in short term improved availability
from 4 hours to 6hours daily
piped drinking waterthat is ‘fit for drinking;in at least 25% of areas
Execution of schemes on
Plan and implement safelymanaged water supplyschemes to reduce accessgap By 50% in medium
term improved availability
from 6 hours to 8hours daily
piped drinking waterthat is ‘fit for drinking;in at least 50% of areas
Execution of schemes oncost sharing basis i.e.Community invests inmaintenance and internalcomponent, whileGovernment invests forexternal component
Install water flow monitorsat tube wells; alsointroduce flow monitors atvalves
Plan and implement safelymanaged water supplyschemes to reduce accessgap By 100% in long term improved availability
from 8 hours to 12hours daily
piped drinking waterthat is ‘fit for drinking;in at least 75% of areas
Execution of schemes oncost sharing basis i.e.Community invests inmaintenance and internalcomponent, whileGovernment invests forexternal component
Install water flow monitorsat tube wells; alsointroduce flow monitors atvalves
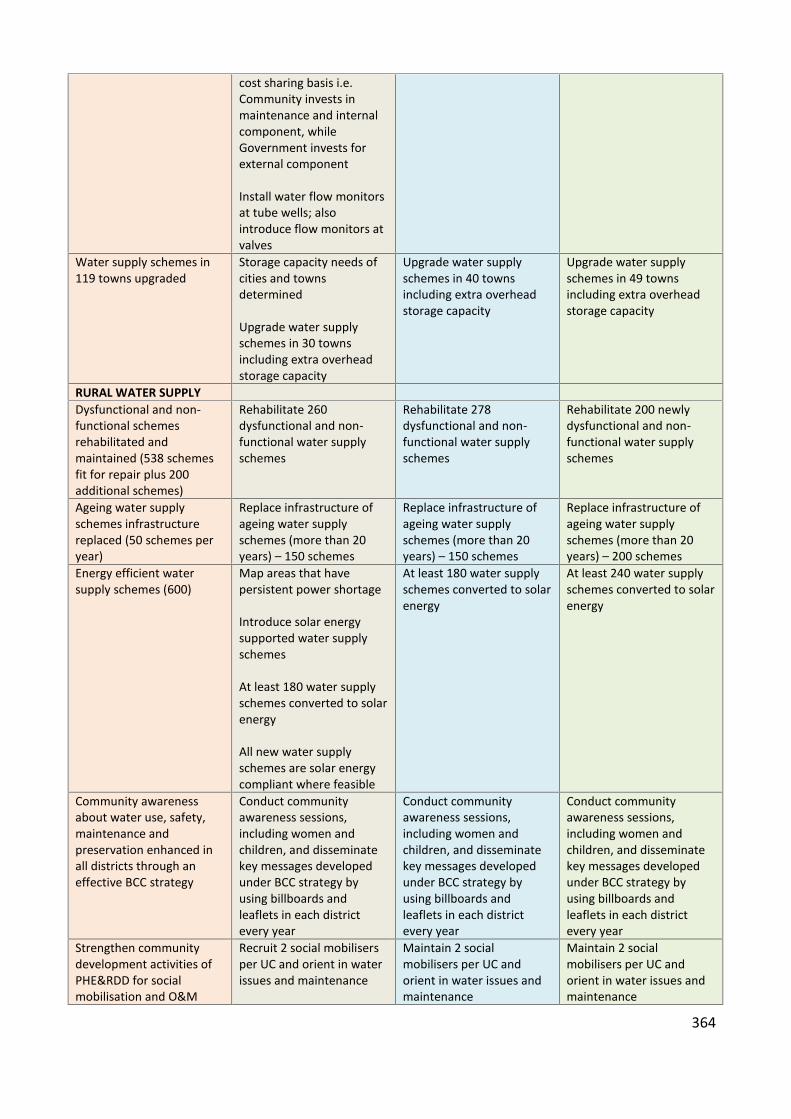
364
cost sharing basis i.e.Community invests inmaintenance and internalcomponent, whileGovernment invests forexternal component
Install water flow monitorsat tube wells; alsointroduce flow monitors atvalves
Water supply schemes in119 towns upgraded
Storage capacity needs ofcities and townsdetermined
Upgrade water supplyschemes in 30 townsincluding extra overheadstorage capacity
Upgrade water supplyschemes in 40 townsincluding extra overheadstorage capacity
Upgrade water supplyschemes in 49 townsincluding extra overheadstorage capacity
RURAL WATER SUPPLYDysfunctional and non-functional schemesrehabilitated andmaintained (538 schemesfit for repair plus 200additional schemes)
Rehabilitate 260dysfunctional and non-functional water supplyschemes
Rehabilitate 278dysfunctional and non-functional water supplyschemes
Rehabilitate 200 newlydysfunctional and non-functional water supplyschemes
Ageing water supplyschemes infrastructurereplaced (50 schemes peryear)
Replace infrastructure ofageing water supplyschemes (more than 20years) – 150 schemes
Replace infrastructure ofageing water supplyschemes (more than 20years) – 150 schemes
Replace infrastructure ofageing water supplyschemes (more than 20years) – 200 schemes
Energy efficient watersupply schemes (600)
Map areas that havepersistent power shortage
Introduce solar energysupported water supplyschemes
At least 180 water supplyschemes converted to solarenergy
All new water supplyschemes are solar energycompliant where feasible
At least 180 water supplyschemes converted to solarenergy
At least 240 water supplyschemes converted to solarenergy
Community awarenessabout water use, safety,maintenance andpreservation enhanced inall districts through aneffective BCC strategy
Conduct communityawareness sessions,including women andchildren, and disseminatekey messages developedunder BCC strategy byusing billboards andleaflets in each districtevery year
Conduct communityawareness sessions,including women andchildren, and disseminatekey messages developedunder BCC strategy byusing billboards andleaflets in each districtevery year
Conduct communityawareness sessions,including women andchildren, and disseminatekey messages developedunder BCC strategy byusing billboards andleaflets in each districtevery year
Strengthen communitydevelopment activities ofPHE&RDD for socialmobilisation and O&M
Recruit 2 social mobilisersper UC and orient in waterissues and maintenance
Maintain 2 socialmobilisers per UC andorient in water issues andmaintenance
Maintain 2 socialmobilisers per UC andorient in water issues andmaintenance

365
(2594 social mobilisers)

366
Water QualityStrategicObjectives/Outcomes
Short Term Actions1 - 3 years
Medium Term Actions4 - 6 years
Long Term Actions7 - 10 years
Quarterly water qualitytesting at water source
PHE&RDD conductsmonthly water quality testsof town water supplies andfiltration plants, andquarterly testing of at least25% of tube wells (250)
PHE&RDD conductsmonthly water quality testsof town water supplies andfiltration plants, andquarterly testing of at least50% of tube wells (500)
PHE&RDD conductsmonthly water quality testsof town water supplies andfiltration plants, andquarterly testing of at least75% of tube wells (750)
Quarterly quality testing ofdistribution network
At least 25% coverage ofdistribution system everyquarter (250 tube wells)
Annual monitoring ofwater quality in rivers andstreams in collaborationwith Irrigation department
At least 50% coverage ofdistribution system everyquarter (500 tube wells)
Annual monitoring ofwater quality in rivers andstreams in collaborationwith Irrigation department
At least 75% coverage ofdistribution system everyquarter (750 tube wells)
Annual monitoring ofwater quality in rivers andstreams in collaborationwith Irrigation department
District level water qualitytesting laboratoriesestablished (29 districts)
Establish water testinglaboratory facilities in 5districts
Establish water testinglaboratory facilities in 10districts
Establish water testinglaboratory facilities in 14districts
All ground and overheadreservoirs supplied withchlorination treatment
Conduct study todetermine the status ofground and overheadreservoirs in cities andtowns
Scheduled six monthlycleaning and maintenanceof all reservoirs
Installation of chlorinatorsin 30% of reservoirs (ortube wells where storagecapacity does not exist)and issue and orient usersin standard operatingprocedure and safety forchlorination
Scheduled six monthlycleaning and maintenanceof all reservoirs
Installation of chlorinatorsin 60% of reservoirs (ortube wells where storagecapacity does not exist)and issue and orient usersin standard operatingprocedure and safety forchlorination
Scheduled six monthlycleaning and maintenanceof all reservoirs
Installation of chlorinatorsin 90% of reservoirs (ortube wells where storagecapacity does not exist)and issue and orient usersin standard operatingprocedure and safety forchlorination
Community awarenessabout water quality(including adoption oftreatment of safe drinkingwater in the household)enhanced in all districtsthrough an effective BCCstrategy
Conduct communityawareness sessions,including women andchildren, and disseminatekey messages developedunder BCC strategy forwater quality by usingbillboards and leaflets ineach UC every year (1297)
Promote use of low costportable water qualitytesting and monitoring atvillage level
Conduct communityawareness sessions,including women andchildren, and disseminatekey messages developedunder BCC strategy forwater quality by usingbillboards and leaflets ineach UC every year (1297)
Promote use of low costportable water qualitytesting and monitoring atvillage level
Conduct communityawareness sessions,including women andchildren, and disseminatekey messages developedunder BCC strategy forwater quality by usingbillboards and leaflets ineach UC every year (1297)
Promote use of low costportable water qualitytesting and monitoring atvillage level

367
Sanitation (Sewerage and Drainage)StrategicObjectives/Outcomes
Short Term Actions1 - 3 years
Medium Term Actions4 - 6 years
Long Term Actions7 - 10 years
URBAN SANITATIONAll cities, towns and UCshave surveys, strategiesand action plans forintegrated water supply,water safety, sewerage anddrainage, storm waterdrainage and solid wastemanagement
(common to water supply,sanitation and solid waste)
All cities have completedsurveys, GIS mapping andstrategies, and startimplementing action plansfor integrated watersupply, water safety,sewerage and drainage,storm water drainage andsolid waste management
Develop integrated watersupply, water safety,sanitation, storm waterdrainage and solid wastemanagement action plansfor all cities
At least 50% of UCs (500)have completed surveys,GIS mapping andstrategies, and startimplementing action plansfor integrated watersupply, water safety,sewerage and drainage,storm water drainage andsolid waste management
Develop integrated watersupply, water safety,sanitation, storm waterdrainage and solid wastemanagement action plansfor 500 UCs
At least 100% UCs (608)have completed surveys,GIS mapping andstrategies, and startimplementing action plansfor integrated watersupply, water safety,sewerage and drainage,storm water drainage andsolid waste management
Develop integrated watersupply, water safety,sanitation, storm waterdrainage and solid wastemanagement action plansfor 608 UCs
Improved and safelymanaged sanitationservices coverageenhanced to reduce accessgap in urban areas andrural areas, especially inthose that are alsonutrition-sensitive
Develop an SOP for all newsanitation schemes tomeet criteria for 'safelymanaged’ which include: not shared with other
households excreta are safely
disposed in situ ortransported andtreated off-site
guidelines forintegration ininterventions innutrition-sensitiveareas
Plan and implement safelymanaged sanitationschemes to reduce accessgap By 20% in short term reduce proportion of
households connectedto open drains from27% to 24%
Execution of schemes oncost sharing basis i.e.Community invests inmaintenance and internalcomponent, whileGovernment invests forexternal component
Plan and implement safelymanaged sanitationschemes to reduce accessgap By 50% in medium
term reduce proportion of
households connectedto open drains from24% to 20%
Execution of schemes oncost sharing basis i.e.Community invests inmaintenance and internalcomponent, whileGovernment invests forexternal component
Plan and implement safelymanaged sanitationschemes to reduce accessgap By 100% in long term reduce proportion of
households connectedto open drains from20% to 15%
Execution of schemes oncost sharing basis i.e.Community invests inmaintenance and internalcomponent, whileGovernment invests forexternal component

368
Wastewater treatmentplants established in 119towns (12 per year)
Establish wastewatertreatment plants in 36towns
Establish wastewatertreatment plants in 36towns
Establish wastewatertreatment plants in 47towns
Water supply andsanitation schemes linkedwith wastewater treatment
At least 25% of newschemes have in-builtwastewater treatmentfacility
Incorporate wastewatertreatment options (likeoxidation ponds, wetlands,sewerage treatment units,community septic tanks) inrural sanitation schemes
At least 50% of newschemes have in-builtwastewater treatmentfacility
Incorporate wastewatertreatment options (likeoxidation ponds, wetlands,sewerage treatment units,community septic tanks) inrural sanitation schemes
At least 75% of newschemes have in-builtwastewater treatmentfacility
Incorporate wastewatertreatment options (likeoxidation ponds, wetlands,sewerage treatment units,community septic tanks) inrural sanitation schemes
Monitor contaminationlevels of industrial effluent
LG&HTPD, PHE&RDD,Irrigation department,PCSIR and SindhEnvironment ProtectionAgency map majorindustrial wastewaterflows and conduct periodicwastewater testing andpublic reporting ofindustrial effluent quality
Environment protectionregulations enforced
Hazard and risk GISmapping of contaminatedrivers and water bodiesdone
Conduct periodicwastewater testing andpublic reporting ofindustrial effluent quality
Environment protectionregulations enforced
Conduct periodicwastewater testing andpublic reporting ofindustrial effluent quality
Environment protectionregulations enforced
Increased proportion oftreated industrialwastewater
Set up Combined EffluentTreatment Plant (CETP) forcluster of industries wherefeasible
Identify industries withhigh volume of untreatedeffluent and prioritise forenforcement of regulations
At least 5% of industrialwastewater treated
At least 10% of industrialwastewater treated
Optimal sewage flowcapacity maintained
Sewage flows determinedfor all cities and towns, andsix monthly de-silting andcleaning of 30% drains andsewers with safe sludgedisposal in towns andzones in cities
Six monthly de-silting andcleaning of 60% drains andsewers with safe sludgedisposal in towns andzones in cities
Six monthly de-silting andcleaning of 90% drains andsewers with safe sludgedisposal in towns andzones in cities
Optimal status of sewermaintenance equipment(sucking machine, jettingmachine, sucking/jettingmachine)
Status of equipmentavailability andfunctionality determinedfor each town and cityzone
At least 30% of towns andcity zones equipped withsewer maintenanceequipment
At least 60% of towns andcity zones equipped withsewer maintenanceequipment
At least 90% of towns andcity zones equipped withsewer maintenanceequipment
Adequate and functionalcollector and branchsewers
Status of collector andbranch sewers in each cityand town determined
Phased replacement of25% non-functionalcollector and branch
Phased replacement of50% non-functionalcollector and branch

369
Phased replacement orlaying of new linesinstituted
sewers or laying of newlines instituted
sewers or laying of newlines instituted
Optimal functionality ofpumping stations
Status of pumping stationsin each city and towndetermined
Phased rehabilitation planinstituted for at least 30%dysfunctional pumpingstations
Phased rehabilitation planinstituted for at least 60%dysfunctional pumpingstations
Phased rehabilitation planinstituted for at least 90%dysfunctional pumpingstations
Systematic management ofOperation andMaintenance of sewerageand drainage systems
Develop O&M manual forsewerage and drainageincluding sewer desiltingsafety measures
Train LG&HTPD andPHE&RDD staff in use ofO&M manual
Refresher training toLG&HTPD and PHE&RDDstaff on use of O&Mmanual
Refresher training toLG&HTPD and PHE&RDDstaff on use of O&Mmanual
RURAL SANITATIONImplement rural sanitationscale-up strategy innutrition and WASHprogrammes
Ensure provision of smallwater supply systems,implement PATS PlusApproach, disseminatehealth and hygiene relatedkey messages onhandwashing with soapduring critical times andproper use of toilet andwater safety practicesthrough educating them onhousehold watertreatment options,establish WASH clubs inschools, promotehandwashing throughprovision of handwashingstations, and establishWASH in Health Facilities(13 priority districts)
Ensure provision of smallwater supply systems,implement PATS PlusApproach, disseminatehealth and hygiene relatedkey messages onhandwashing with soapduring critical times andproper use of toilet andwater safety practicesthrough educating them onhousehold watertreatment options,establish WASH clubs inschools, promotehandwashing throughprovision of handwashingstations, and establishWASH in Health Facilities(13 ongoing + 6 otherdistricts)
Ensure provision of smallwater supply systems,implement PATS PlusApproach, disseminatehealth and hygiene relatedkey messages onhandwashing with soapduring critical times andproper use of toilet andwater safety practicesthrough educating them onhousehold watertreatment options,establish WASH clubs inschools, promotehandwashing throughprovision of handwashingstations, and establishWASH in Health Facilities(19 ongoing + 10 otherdistricts)
Community awareness andsocial mobilisationregarding sanitation,nutrition and hygieneenhanced in all UCsthrough effectiveimplementation of BCCstrategy
Conduct communityawareness sessions,including women andchildren, and disseminatekey messages developedunder BCC strategy byusing billboards andleaflets in each UC everyyear (1297 UCs)
Conduct communityawareness sessions,including women andchildren, and disseminatekey messages developedunder BCC strategy byusing billboards andleaflets in each UC everyyear (1297 UCs)
Conduct communityawareness sessions,including women andchildren, and disseminatekey messages developedunder BCC strategy byusing billboards andleaflets in each UC everyyear (1297 UCs)
2 Community ResourcePersons (preferably onemale and one female)deployed for BCC for eachUC (2594 Community
Deploy and orient 2594Community ResourcePersons in 1297 UCs
Maintain 2594 CommunityResource Persons in 1297UCs
Maintain 2594 CommunityResource Persons in 1297UCs

370
Resource Persons)Safe sanitation practicespromoted in high opendefecation zones,nutrition-sensitive andpolio priority areas
Develop provincial anddistrict level road maps onPATS/ODF for identifiedvillages in 13 prioritydistricts
Incentivising the ODFvillages by laying of watersupply scheme, seweragesystem, waste watertreatment, etc in 13priority districts
Execution of schemes oncost sharing basis i.e.Community invests ininternal component, whileGovernment invests forexternal component in 13priority districts
Collaborate withinternational partners andNGOs for integrating WASHcomponent ininterventions in nutrition-sensitive areas, andstrengthening the supplyside interventionsespecially sanitationmarketing (training ofmasons, entrepreneurs andsmall businesses) in 13priority districts
Develop provincial anddistrict level road maps onPATS/ODF for identifiedvillages in 6 additionaldistricts
Incentivising the ODFvillages by laying of watersupply scheme, seweragesystem, waste watertreatment, etc in 6additional districts
Execution of schemes oncost sharing basis i.e.Community invests ininternal component, whileGovernment invests forexternal component in 6additional districts
Collaborate withinternational partners andNGOs for integrating WASHcomponent ininterventions in nutrition-sensitive areas, andstrengthening the supplyside interventionsespecially sanitationmarketing (training ofmasons, entrepreneurs andsmall businesses) in 6additional districts
Develop provincial anddistrict level road maps onPATS/ODF for identifiedvillages in 10 additionaldistricts
Incentivising the ODFvillages by laying of watersupply scheme, seweragesystem, waste watertreatment, etc in 10additional districts
Execution of schemes oncost sharing basis i.e.Community invests ininternal component, whileGovernment invests forexternal component in 10additional districts
Collaborate withinternational partners andNGOs for integrating WASHcomponent ininterventions in nutrition-sensitive areas, andstrengthening the supplyside interventionsespecially sanitationmarketing (training ofmasons, entrepreneurs andsmall businesses) in 10additional districts

371
Solid WasteStrategicObjectives/Outcomes
Short Term Actions1 - 3 years
Medium Term Actions4 - 6 years
Long Term Actions7 - 10 years
All cities, towns and UCshave surveys, strategiesand action plans forintegrated water supply,water safety, sewerage anddrainage, storm waterdrainage and solid wastemanagement
(common to water supply,sanitation and solid waste)
All cities have completedsurveys, GIS mapping andstrategies, and startimplementing action plansfor integrated watersupply, water safety,sewerage and drainage,storm water drainage andsolid waste management
Develop integrated watersupply, water safety,sanitation, storm waterdrainage and solid wastemanagement action plansfor all cities
Conduct wastecharacterisation studies(including hospital waste)for mega cities
At least 50% of UCs (500)have completed surveys,GIS mapping andstrategies, and startimplementing action plansfor integrated watersupply, water safety,sewerage and drainage,storm water drainage andsolid waste management
Develop integrated watersupply, water safety,sanitation, storm waterdrainage and solid wastemanagement action plansfor 500 UCs
Conduct wastecharacterisation studies(including hospital waste)for intermediate cities
At least 100% UCs (797)have completed surveys,GIS mapping andstrategies, and startimplementing action plansfor integrated watersupply, water safety,sewerage and drainage,storm water drainage andsolid waste management
Develop integrated watersupply, water safety,sanitation, storm waterdrainage and solid wastemanagement action plansfor 797 UCs
Integrated solid wastemanagement implementedin 29 districts (5 in shortterm, 10 in medium term,and 13 in long term)
Develop integrated solidwaste management in 5districts (Karachi,Hyderabad, ShaheedBenazirabad and Larkana)
Develop integrated solidwaste management in 10districts
Develop integrated solidwaste management in 14districts
Town and UC level profilesdeveloped for wastewaterand solid waste in 119towns and 1297 UCs
Conduct a study onwastewater and solidwaste in 119 towns todevelop townlevel profiles (includinginfrastructure, equipmentand staffing)
Conduct a study onwastewater and solidwaste in 1297 UCs todevelop UC level profiles(including infrastructure,equipment and staffing)
Periodic updating of townand UC level profiles
Periodic updating of townand UC level profiles
Solid waste collection anddisposal
At least 70% of solid wastegenerated is collected anddisposed of per day
At least 30 town councilsproviding door to doorcollection service
Village based solid wastemanagement piloted inselected villages
At least 80% of solid wastegenerated is collected anddisposed of per day
At least 60 town councilsproviding door to doorcollection service
Village based solid wastemanagement scaled up to10% villages in Sindh
At least 90% of solid wastegenerated is collected anddisposed of per day
At least 100 town councilsproviding door to doorcollection service
Village based solid wastemanagement scaled up to30% villages in Sindh
Effective solid wastemanagement
Develop a minimumstandards list of staffing,hardware and equipmentfor solid waste
Upgrade the hardware andequipment for solid wastemanagement in 30 towncouncils (10 per year)
Upgrade the hardware andequipment for solid wastemanagement in 40 towncouncils (10 per year)

372
management and upgradein 30 town councils (10 peryear)
Efficient Solid wastedisposal and recycling
At least 30% town councilshave established transferstations to reduce disposaltime
Recycle at least 10% ofsolid waste by systematicseparation
Sanitary landfill optionsidentified for towns wherefeasible
At least 60% town councilshave established transferstations to reduce disposaltime
Recycle at least 15% ofsolid waste by systematicseparation
At least 20 towns served bysanitary landfill sites
At least 90% town councilshave established transferstations to reduce disposaltime
Recycle at least 20% ofsolid waste by systematicseparation
At least 40 towns served bysanitary landfill sites
Waste to Energy Formalise contracts withcompanies for waste toenergy options
At least each mega city hasa WTE option in place
At least each intermediatecity has a WTE in place
Safe hospital high riskwaste disposal
Health departmentestablishes hospital wastemanagement committeesin each hospital in line withthe Environmental andMedical WasteManagement Guidelines
Health department incollaboration withLG&HTPD orients eachhospital wastemanagement committeeon Environmental andMedical WasteManagement Guidelines,municipal solid waste andhigh risk waste and theirseparate disposal
Each mega city andintermediate city has acentralised and functionalhigh risk hospital wastedisposal facility
At least 50% of hospitalhigh risk waste disposed ofsafely
Each town has acentralised and functionalhigh risk hospital wastedisposal facility
At least 60% of hospitalhigh risk waste disposed ofsafely
At least 90% of hospitalhigh risk waste disposed ofsafely
Safe and hygienicSlaughterhouses
Update status of allslaughterhouses(recognised andunrecognised) in eachdistrict and prioritise thosefor rehabilitation, solidwaste and wastewatermanagement
Provide refresher trainingon slaughterhouse safetyand hygiene practiceguidelines to 100%slaughterhouse staff inrecognisedslaughterhouses in safehandling and disposal of
Provide refresher trainingon slaughterhouse safetyand hygiene practiceguidelines to 100%slaughterhouse staff inrecognisedslaughterhouses in safehandling and disposal of

373
Develop slaughterhousesafety and hygiene practiceguidelines and orient 100%slaughterhouse staff inrecognisedslaughterhouses in safehandling and disposal ofcarcass, entrails, hides, andwastewater
At least 30% of municipalservices dispose ofslaughterhouse solid wastesafely
carcass, entrails, hides, andwastewater
At least 60% of municipalservices dispose ofslaughterhouse solid wastesafely
carcass, entrails, hides, andwastewater
At least 90% of municipalservices dispose ofslaughterhouse solid wastesafely
Efficient and effectivemanagement of IndustrialSolid Waste
Determine the currentstatus of industrial solidwaste production anddisposal
Develop strategies andactions for efficient andeffective management ofindustrial solid waste

374
Health, Hygiene and NutritionStrategicObjectives/Outcomes
Short Term Actions1 - 3 years
Medium Term Actions4 - 6 years
Long Term Actions7 - 10 years
Fully functional and safelymanaged water andsanitation services inhealth facilities DHQs,THQs/CHs, RHCs, CDs,MCHs at communal andfacility level
For Basic Health Units withmissing facilities for waterand sanitation (about 20%of BHUs), provideextension of waterdistribution pipe fromwater supply scheme,water tank and 2 latrinesper BHU
Health Department andPHE&RDD to jointlyconduct a situation analysisand update the status ofmissing facilities for safelymanaged water andsanitation in all healthfacilities and develop aJoint Action Plan (JAP) toaddress these
Provision of missing WASHfacilities (latrines, handwashing spots, filter tap fordrinking water purposes,supply of soap and watertreatment technology athealth facility) in targetedhealth facilities based onJoint Action Plan (JAP) in 13priority districts
Provide water distributionpoint to local health facilityin all new water supplyschemes in 13 prioritydistricts
Provide water distributionpoint to local health facilityin all new water supplyschemes
Provision of missing WASHfacilities (latrines, handwashing spots, filter tap fordrinking water purposes,supply of soap and watertreatment technology athealth facility) in targetedhealth facilities based onJoint Action Plan (JAP) in 6additional districts
Provide water distributionpoint to local health facilityin all new water supplyschemes
Provision of missing WASHfacilities (latrines, handwashing spots, filter tap fordrinking water purposes,supply of soap and watertreatment technology athealth facility) in targetedhealth facilities based onJoint Action Plan (JAP) in 10additional districts
Hospital WasteManagement Rulesimplemented in 88hospitals as initial priority.
Implement Hospital WasteManagement Rules in 27hospitals
Implement Hospital WasteManagement Rules inadditional 27 hospitals
Implement Hospital WasteManagement Rules inadditional 34 hospitals
Hospital WasteManagement Rules to beimplemented in all healthfacilities.
Multi-sector nutrition-sensitive WASHprogramme implementedin nutritionally deficientdistricts
Multi-sector nutrition-sensitive WASHprogramme implementedin 3 nutritionally deficientdistricts
Multi-sector nutrition-sensitive WASHprogramme implementedin 10 nutritionally deficientdistricts
Surveillance andconsolidation of multi-sector nutrition-sensitiveWASH programmeimplemented in 13nutritionally deficientdistricts
Nutrition-sensitive WASHintegrated in healthpromotion in primaryhealth care
Nutrition-sensitive WASHhealth education moduleadded to curriculum ofLHWs/CMWs/LHVs withsupporting trainingmaterial as part of multi-sector nutrition-sensitiveWASH interventions
Master trainers, districttrainers and facility trainers
At least 60% ofLHWs/CMWs/LHVs receiverefresher training innutrition-sensitive WASHhealth promotion andhygiene as part of on-goingtraining by healthdepartment
At least 100% ofLHWs/CMWs/LHVs receiverefresher training innutrition-sensitive WASHhealth promotion andhygiene as part of on-goingtraining by healthdepartment

375
oriented in key nutrition-sensitive WASH messagesand LHWs/CMWs/LHVsprovided training onnutrition-sensitive WASHhealth promotion andhygiene as part of on-goingtraining by healthdepartment
At least 100% ofLHWs/CMWs/LHVs trainedin nutrition-sensitive WASHhealth promotion andhygiene as part of on-goingtraining by healthdepartment
Nutrition-sensitive WASHintegrated in healthadvocacy and BCCcampaigns and healthweeks
Nutrition-sensitive WASHcomponent of healthpromotion and hygieneintegrated in mother andchild health weeks as partof on-going campaign byhealth department acrossthe province
Advocacy and BCCcampaign held at healthfacility, district andprovincial levels as part ofon-going health campaigns
Key messages to advertisedin electronic and printmedia as part of on-goinghealth campaigns
Continue Nutrition-sensitive WASHcomponent of healthpromotion and hygienedisseminated in motherand child health weeks aspart of on-going campaignby health departmentacross the province
Advocacy and BCCcampaign held at healthfacility, district andprovincial levels as part ofon-going health campaigns
Key messages to advertisedin electronic and printmedia as part of on-goinghealth campaigns
Continue Nutrition-sensitive WASHcomponent of healthpromotion and hygienedisseminated in motherand child health weeks aspart of on-going campaignby health department
Advocacy and BCCcampaign held at healthfacility, district andprovincial levels as part ofon-going health campaigns
Key messages to advertisedin electronic and printmedia as part of on-goinghealth campaigns
IEC materials with keynutrition-sensitive hygienemessages distributed athealth facility level
Development of nutrition-sensitive IEC materials forprimary, secondary andtertiary health facilities;CBOs and faith basedfacilities
Availability at anddissemination of IECmaterials for 50% primary,secondary and tertiaryhealth facilities; CBOs andfaith based facilities
Availability at anddissemination of nutrition-sensitive IEC materials for75% primary, secondaryand tertiary healthfacilities; CBOs and faithbased facilities
Availability at anddissemination of nutrition-sensitive IEC materials for100% primary, secondaryand tertiary healthfacilities; CBOs and faithbased facilities
WASH services at healthfacilities monitoredregularly by HealthDepartment
Regular monitoring andsupervision conducted byhealth facility in-charges,DHOs and respectivestakeholders
Regular monitoring andsupervision conducted byhealth facility in-charges,DHOs and respectivestakeholders
Regular monitoring andsupervision conducted byhealth facility in-charges,DHOs and respectivestakeholders

376
EducationStrategicObjectives/Outcomes
Short Term Actions1 - 3 years
Medium Term Actions4 - 6 years
Long Term Actions7 - 10 years
Nutrition-sensitive WASHintegrated in teachertraining programme
Collaborate with SindhTeacher EducationDevelopment Authority,Board of Curriculum &Extension Wing, ProvincialInstitute of TeacherEducation, Sindh TextbookBoard and incorporatenutrition-sensitive WASHhygiene promotion in pre-service and in-serviceteacher trainingprogramme and CPDtraining of teachereducators
Nutrition-sensitive WASHhygiene promotioncascaded through TeacherEducators as part of on-going educationprogramme
Nutrition-sensitive WASHhygiene promotioncascaded through TeacherEducators as part of on-going educationprogramme
Nutrition-sensitive WASHhygiene promotioncascaded through TeacherEducators as part of on-going educationprogramme
Nutrition-sensitive WASHintegrated in schools’curriculum
Collaborate with SindhTeacher EducationDevelopment Authority,Board of Curriculum &Extension Wing, ProvincialInstitute of TeacherEducation, Sindh TextbookBoard for inclusion oftopics on nutrition-sensitive water, sanitationand hygiene in curriculumfor classes 1 to 12
WASH in Schools policyguidelines developed toensure operation andmaintenance of WASHinfrastructure in schools
Implement WASH inSchools policy guidelines in30% schools
Implement WASH inSchools policy guidelines inadditional 30% schools
Implement WASH inSchools policy guidelines in100% schools
Menstrual hygienemanagement integrated inhealth and hygiene for girls
Nutrition-sensitive WASHhygiene promotion moduleincorporates menstrualhygiene management forgirls
Impart menstrual hygienemanagement education innutrition-sensitive WASH
Impart menstrual hygienemanagement education innutrition-sensitive WASHhygiene promotion to atleast 50% of girls middleand high schools as part ofon-going school healtheducation and WinS
Impart menstrual hygienemanagement education innutrition-sensitive WASHhygiene promotion to atleast 75% of girls middleand high schools as part ofon-going school healtheducation and WinS
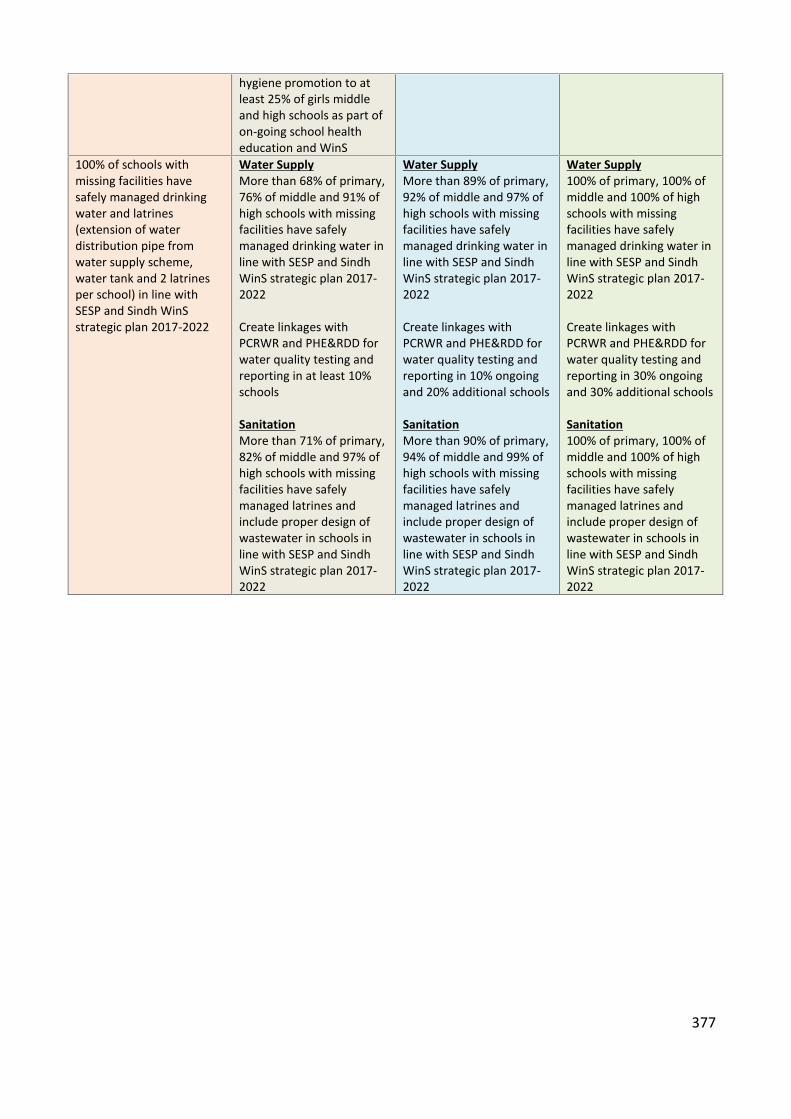
377
hygiene promotion to atleast 25% of girls middleand high schools as part ofon-going school healtheducation and WinS
100% of schools withmissing facilities havesafely managed drinkingwater and latrines(extension of waterdistribution pipe fromwater supply scheme,water tank and 2 latrinesper school) in line withSESP and Sindh WinSstrategic plan 2017-2022
Water SupplyMore than 68% of primary,76% of middle and 91% ofhigh schools with missingfacilities have safelymanaged drinking water inline with SESP and SindhWinS strategic plan 2017-2022
Create linkages withPCRWR and PHE&RDD forwater quality testing andreporting in at least 10%schools
SanitationMore than 71% of primary,82% of middle and 97% ofhigh schools with missingfacilities have safelymanaged latrines andinclude proper design ofwastewater in schools inline with SESP and SindhWinS strategic plan 2017-2022
Water SupplyMore than 89% of primary,92% of middle and 97% ofhigh schools with missingfacilities have safelymanaged drinking water inline with SESP and SindhWinS strategic plan 2017-2022
Create linkages withPCRWR and PHE&RDD forwater quality testing andreporting in 10% ongoingand 20% additional schools
SanitationMore than 90% of primary,94% of middle and 99% ofhigh schools with missingfacilities have safelymanaged latrines andinclude proper design ofwastewater in schools inline with SESP and SindhWinS strategic plan 2017-2022
Water Supply100% of primary, 100% ofmiddle and 100% of highschools with missingfacilities have safelymanaged drinking water inline with SESP and SindhWinS strategic plan 2017-2022
Create linkages withPCRWR and PHE&RDD forwater quality testing andreporting in 30% ongoingand 30% additional schools
Sanitation100% of primary, 100% ofmiddle and 100% of highschools with missingfacilities have safelymanaged latrines andinclude proper design ofwastewater in schools inline with SESP and SindhWinS strategic plan 2017-2022

378
Sector Efficiency and CapacityStrategicObjectives/Outcomes
Short Term Actions1 - 3 years
Medium Term Actions4 - 6 years
Long Term Actions7 - 10 years
Reduced systems leakagesof Non Revenue Water andUnaccounted for Water
Map out points of systemleakages area by area andtake remedial measures forDistribution NetworkImprovements (DNI)
Reduce NRW losses from60% to 30% in Karachi
Reduce NRW and UAW to20% or less
Outsource at least 25% ofrevenue collection
Reduce NRW and UAW to20% or less in Karachi andother cities of Sindh
Reduce NRW and UAW to10% or less in Karachi andother cities of Sindh
Increased household watermetering
Introduce water meteringin phases
All new connections to bemetered
At least 100% of highincome areas havemetering in place
All commercial andbusiness premises havewater metering
At least 10% of mediumincome areas havemetering in place
At least 20% of mediumincome areas havemetering in place
Efficient Billing andCollection
Collection period reducedto less than 30 days
Billing efficiency increasedto 50%
Financial collectionefficiency increased to 50%
Outsource billing andcollection
Collection period reducedto less than 15 days
Billing efficiency increasedto 75%
Financial collectionefficiency increased to 75%
Collection periodmaintained at less than 15days
Billing efficiency increasedto 90% and above
Financial collectionefficiency increased to 90%and above
A functional Biometrictracking system in all citiesand towns
All mega cities have aninstalled and functionalbiometric tracking systemfor staff,equipment/vehicles
At least 50% ofintermediate cities have aninstalled and functionalbiometric tracking systemfor staff,equipment/vehicles
At least 30% of towns have
At least 75% ofintermediate cities have aninstalled and functionalbiometric tracking systemfor staff,equipment/vehicles
At least 60% of towns havean installed and functionalbiometric tracking systemfor staff,equipment/vehicles
At least 90% of towns havean installed and functionalbiometric tracking systemfor staff,equipment/vehicles

379
an installed and functionalbiometric tracking systemfor staff,equipment/vehicles
Human ResourceDevelopment for the sub-sectors
Conduct a human resourcecapacity, infrastructure andtraining capacity, andtraining needs assessmentin the sub-sectors anddevelop a human resourcedevelopment plan
Strengthen infrastructureand training capacities atLocal Government TrainingInstitutes
Technical training /workshops conducted fortown level LocalGovernment staff
Conduct 238 technicaltraining / workshops peryear for Local Governmenton SWM, DRR, RecordKeeping, Management andCommunity Mobilisation –2 training workshops pertown per year
Conduct 238 technicaltraining / workshops peryear for Local Governmenton SWM, DRR, RecordKeeping, Management andCommunity Mobilisation –2 training workshops pertown per year
Conduct 238 technicaltraining / workshops peryear for Local Governmenton SWM, DRR, RecordKeeping, Management andCommunity Mobilisation –2 training workshops pertown per year
Capacities developed ofCBOs and civil society insolid waste management(LG&HTPD)
Conduct 238 capacitydevelopment workshopsper year of CBOs and civilsociety in solid wastemanagement (LG&HTPD)(2 workshops per town peryear)
Conduct 238 capacitydevelopment workshopsper year of CBOs and civilsociety in solid wastemanagement (LG&HTPD)(2 workshops per town peryear)
Conduct 238 capacitydevelopment workshopsper year of CBOs and civilsociety in solid wastemanagement (LG&HTPD)(2 workshops per town peryear)
Technical training /workshops conducted fordistrict PHED staff
Conduct 145 technicaltraining / workshops peryear for district PHED staffon O&M, DRR, Record – 5training workshops perdistrict per year
Conduct 145 technicaltraining / workshops peryear for district PHED staffon O&M, DRR, Record – 5training workshops perdistrict per year
Conduct 145 technicaltraining / workshops peryear for district PHED staffon O&M, DRR, Record – 5training workshops perdistrict per year
Capacities developed ofCBOs and civil society inO&M of water supplyschemes (PHE&RDD) (5workshops per district peryear)
Conduct 145 capacitydevelopment workshopsper year of CBOs and civilsociety in O&M of watersupply and drainageschemes (PHE&RDD) (5workshops per district peryear)
Conduct 145 capacitydevelopment workshopsper year of CBOs and civilsociety in O&M of watersupply and drainageschemes (PHE&RDD) (5workshops per district peryear)
Conduct 145 capacitydevelopment workshopsper year of CBOs and civilsociety in O&M of watersupply and drainageschemes (PHE&RDD) (5workshops per district peryear)

380
Sector FinancingStrategicObjectives/Outcomes
Short Term Actions1 - 3 years
Medium Term Actions4 - 6 years
Long Term Actions7 - 10 years
Sectoral budgeting andexpenditure reportingstratified separately foreach sub-sector(environment, watersupply, sewerage anddrainage)
Conduct a financialbudgeting and expenditurereview of sectoral budgetsand expenditures andstratify actual sub-sectorspends against sub-sectorbudgets for last five years
Introduce sub-sectorexpenditure reportingseparately forenvironment, watersupply, sewerage anddrainage, and solid waste
At least 70% of districtsand talukas report sub-sectoral spending bystratified reportingprocedure
At least 90% of districtsand talukas report sub-sectoral spending bystratified reportingprocedure
Increased Own SourceRevenue (OSR) in sub-sectors by Town Councils
Incentivise by providingmatching grants to TownCouncils related to sub-sector OSR
At least 30% of TownCouncils increase theirbaseline sub-sector OSR by100% or more
At least 60% of TownCouncils increase theirbaseline sub-sector OSR by200% or more
At least 75% of TownCouncils increase theirbaseline sub-sector OSR by300% or more
Increased regulated privatesector participation in sub-sectors
Incentivise private sectorwith subsidies to providewater supply, filtrationplants, O&M services,rehabilitation ofdysfunctional schemes,solid waste management,wastewater treatment inselected areas and city andtown zones
Determine type of contractarrangement and ensureregulatory mechanism inplace
At least 30% or more ofcoverage of municipalservices in mega citiesprovided by private sector
At least 20% or more ofcoverage of municipalservices in intermediatecities provided by privatesector
At least 10% or more ofcoverage of municipalservices in Towns providedby private sector
At least 50% or more ofcoverage of municipalservices in mega citiesprovided by private sector
At least 30% or more ofcoverage of municipalservices in intermediatecities provided by privatesector
At least 20% or more ofcoverage of municipalservices in Towns providedby private sector
Increased developmentexpenditure allocation toand spending by sub-sectors and prioritised byequity and need
Allocate 8% of ADPallocation to the sector andprioritise by equity andneed
Increase proportionateADP allocation for ongoingschemes from 69% to 75%and correspondinglyreduce ADP allocation tonew schemes from 31% to25%
Allocate 9% of ADPallocation to the sector andprioritise by equity andneed
Increase proportionateADP allocation for ongoingschemes from 75% to 80%and correspondinglyreduce ADP allocation tonew schemes from 25% to20%
Allocate 10% of ADPallocation to the sector andprioritise by equity andneed
Maintain proportionateADP allocation for ongoingschemes at 80% andcorresponding ADPallocation to new schemesat 20%

381
40% of sector developmentallocation requirement andrelease achieved
50% of sector developmentallocation requirement andrelease achieved
60% of sector developmentallocation requirement andrelease achieved
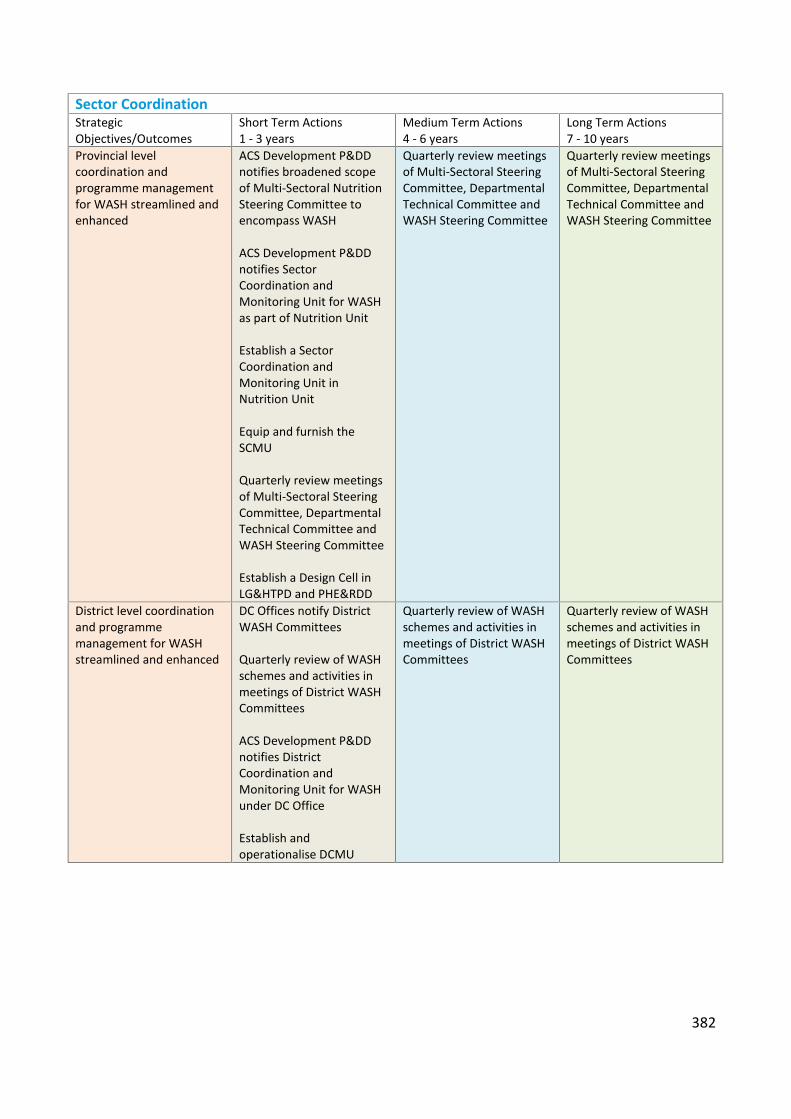
382
Sector CoordinationStrategicObjectives/Outcomes
Short Term Actions1 - 3 years
Medium Term Actions4 - 6 years
Long Term Actions7 - 10 years
Provincial levelcoordination andprogramme managementfor WASH streamlined andenhanced
ACS Development P&DDnotifies broadened scopeof Multi-Sectoral NutritionSteering Committee toencompass WASH
ACS Development P&DDnotifies SectorCoordination andMonitoring Unit for WASHas part of Nutrition Unit
Establish a SectorCoordination andMonitoring Unit inNutrition Unit
Equip and furnish theSCMU
Quarterly review meetingsof Multi-Sectoral SteeringCommittee, DepartmentalTechnical Committee andWASH Steering Committee
Establish a Design Cell inLG&HTPD and PHE&RDD
Quarterly review meetingsof Multi-Sectoral SteeringCommittee, DepartmentalTechnical Committee andWASH Steering Committee
Quarterly review meetingsof Multi-Sectoral SteeringCommittee, DepartmentalTechnical Committee andWASH Steering Committee
District level coordinationand programmemanagement for WASHstreamlined and enhanced
DC Offices notify DistrictWASH Committees
Quarterly review of WASHschemes and activities inmeetings of District WASHCommittees
ACS Development P&DDnotifies DistrictCoordination andMonitoring Unit for WASHunder DC Office
Establish andoperationalise DCMU
Quarterly review of WASHschemes and activities inmeetings of District WASHCommittees
Quarterly review of WASHschemes and activities inmeetings of District WASHCommittees

383
Sector MonitoringStrategicObjectives/Outcomes
Short Term Actions1 - 3 years
Medium Term Actions4 - 6 years
Long Term Actions7 - 10 years
Monitoring and reportingmechanism developed forwater and sanitationschemes
Reporting templates forwater supply andsanitation schemesdeveloped and tested;Reporting pathwayestablished from UC todistrict to provincial level
District LG&HTPD andPHE&RDD staff trained inits use
Annual WASH progressreports produced
Annual WASH progressreports produced
Improved infrastructure formonitoring and reportingestablished for watersupply schemes
Establish 29 districtmonitoring units based atDC Office – 1 per district
Procure computers andaccessories for MIS – 5 setsper district for watersupply schemes. Developcomputerised MIS forwater supply schemes – 29districts
Maintain districtmonitoring units
Data collection andreporting of water supplyschemes done on real timethrough web-basedapplication
Maintain districtmonitoring units
Data collection andreporting of water supplyschemes done on real timethrough web-basedapplication
Improved infrastructure formonitoring and reportingestablished for sanitation,sewerage and drainageschemes
Procure computers andaccessories for MIS – 5 setsper district for sanitation,sewerage and drainageschemes. Developcomputerised MIS forsanitation, sewerage anddrainage schemes – 29districts
Data collection andreporting of sanitation,sewerage and drainageschemes done on real timethrough web-basedapplication
Data collection andreporting of sanitation,sewerage and drainageschemes done on real timethrough web-basedapplication
Monitoring and reportingcapacity enhanced forwater and sanitation
Recruit and deploy a 29District M&E Managersbased at DC Office – 1District M&E Manager perdistrict
Recruit and deploy 58Water and SanitationReporting Officers – 2 perdistrict based at DC Office
Recruit and deploy 29drivers – 1 driver perdistrict based at DC Office
Maintain District M&EManagers, Water andSanitation ReportingOfficers and Drivers
Maintain District M&EManagers, Water andSanitation ReportingOfficers and Drivers
Travel for monitoring andreporting facilitated
Procure 29 vehicles formonitoring and reporting –1 vehicle per district basedat DC Office
Maintain vehicles Maintain vehicles

Implementation Plan
Short and Medium Term Implementation Plan up to 2022
Goal 1: Improved implementation of legislative and policy framework for water and sanitationStrategicOutcome/Objective
Actions Indicative costs – ShortTerm
Indicative costs –Medium Term
Lead Responsibility Collaborating Agencies Time Frame
Finalisation of draftedpolicies and theirimplementation
Approval of DraftDrinking Water Policy,Revised Draft SanitationPolicy
Non Cost Activity LG&HTPDPHE&RDD P&DD 2016-2019
Sindh Local GovernmentAct 2013 provisions forWASH operationalised
Develop Rules ofBusiness for SLGA forLG&HTPD and PHE&RDD
5,000,000 LG&HTPDPHE&RDD P&DD 2016-2019
Municipal watergoverned by a legalframework
Enactment andpromulgation of theSindh Municipal WaterAct
Non Cost Activity LG&HTPD P&DD 2016-2019
Sindh Water Commissionperforms its functions asa regulatory body
Establishment of theSindh Water Commission Non Cost Activity LG&HTPD
PHE&RDD P&DD 2016-2019
Legislative review toharmonise existinglegislation, policies andrules
Legislative review ofdrinking water andsanitation acts, policies,regulations anddevelopment ofharmonised new acts,regulations andguidelines, includingO&M
20,000,000 LG&HTPDPHE&RDD P&DD 2016-2019
Sectoral operatingprocedures (designguidelines) for planningand managementdeveloped
Development of StandardOperating Procedures(design guidelines) forplanning, managementand O&M
10,000,000 LG&HTPDPHE&RDD P&DD 2016-2019
Operational guidelinesfor CBOs for water andsanitation developed
Development ofguidelines for CBOs forproject management andO&M of water supply andsanitation schemes
2,000,000 LG&HTPDPHE&RDD P&DD 2016-2019
Municipal services duty Orientation and capacity 5,000,000 5,000,000 LG&HTPD Development Partners 2016-2026

385
bearers have necessarymanagerial andleadership skills for anintegrated, safelymanaged and nutrition-sensitive water supply,sewerage and drainage,and solid wastemanagementprogramme
building programme of 2big cities, 119 town and1297 union councilofficials on application ofregulations, policies andstrategies in planning,development anddelivery of municipalservices that areintegrated, safelymanaged and nutrition-sensitive
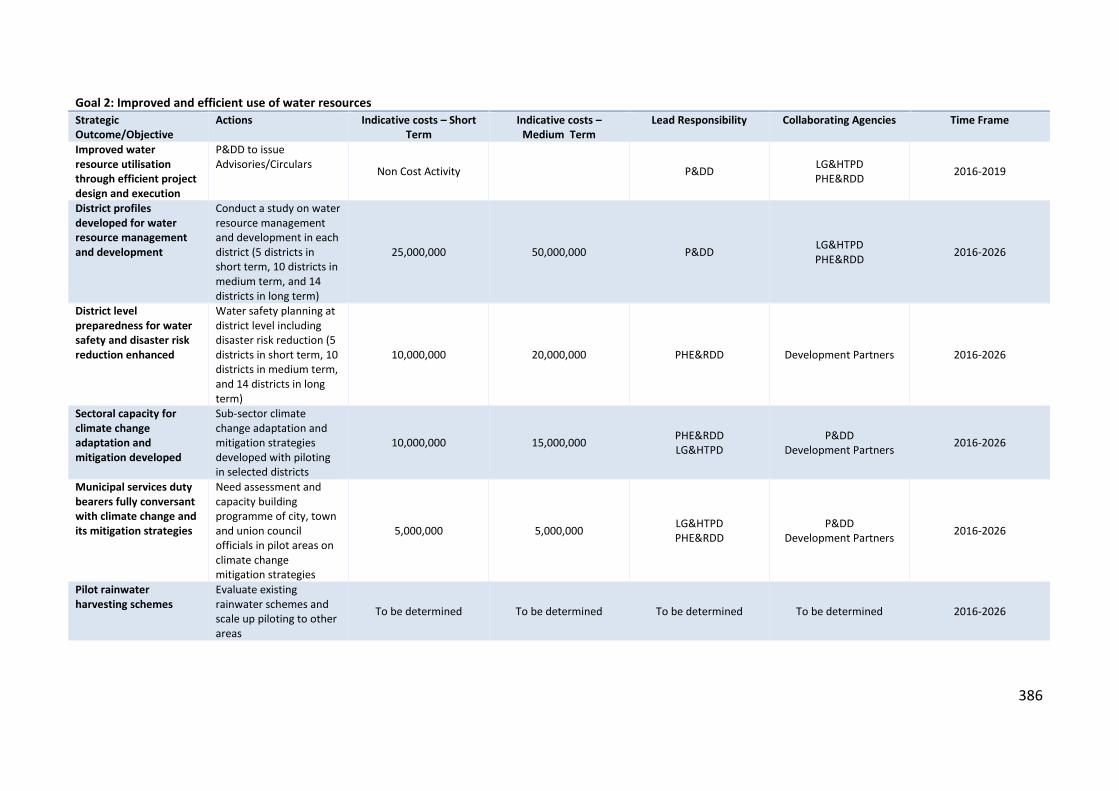
386
Goal 2: Improved and efficient use of water resourcesStrategicOutcome/Objective
Actions Indicative costs – ShortTerm
Indicative costs –Medium Term
Lead Responsibility Collaborating Agencies Time Frame
Improved waterresource utilisationthrough efficient projectdesign and execution
P&DD to issueAdvisories/Circulars Non Cost Activity P&DD LG&HTPD
PHE&RDD 2016-2019
District profilesdeveloped for waterresource managementand development
Conduct a study on waterresource managementand development in eachdistrict (5 districts inshort term, 10 districts inmedium term, and 14districts in long term)
25,000,000 50,000,000 P&DD LG&HTPDPHE&RDD 2016-2026
District levelpreparedness for watersafety and disaster riskreduction enhanced
Water safety planning atdistrict level includingdisaster risk reduction (5districts in short term, 10districts in medium term,and 14 districts in longterm)
10,000,000 20,000,000 PHE&RDD Development Partners 2016-2026
Sectoral capacity forclimate changeadaptation andmitigation developed
Sub-sector climatechange adaptation andmitigation strategiesdeveloped with pilotingin selected districts
10,000,000 15,000,000 PHE&RDDLG&HTPD
P&DDDevelopment Partners 2016-2026
Municipal services dutybearers fully conversantwith climate change andits mitigation strategies
Need assessment andcapacity buildingprogramme of city, townand union councilofficials in pilot areas onclimate changemitigation strategies
5,000,000 5,000,000 LG&HTPDPHE&RDD
P&DDDevelopment Partners 2016-2026
Pilot rainwaterharvesting schemes
Evaluate existingrainwater schemes andscale up piloting to otherareas
To be determined To be determined To be determined To be determined 2016-2026

387
Goal 3: Universal access to improved and safely managed drinking water supplyStrategicOutcome/Objective
Actions Indicative costs – ShortTerm
Indicative costs –Medium Term
Lead Responsibility Collaborating Agencies Time Frame
All cities, towns and UCshave surveys, strategiesand action plans forintegrated water supply,water safety, sewerageand drainage, stormwater drainage and solidwaste management
(common to watersupply, sanitation andsolid waste)
All cities have completedsurveys, GIS mapping andstrategies, and startimplementing actionplans for integratedwater supply, watersafety, sewerage anddrainage, storm waterdrainage and solid wastemanagement
Develop integrated watersupply, water safety,sanitation, storm waterdrainage and solid wastemanagement actionplans for all cities
To be determined To be determinedLG&HTPDPHE&RDD P&DD
Urban Unit 2016-2026
Improved and safelymanaged water supplycoverage enhanced tomeet access gap
Develop an SOP for allnew and existing watersupply schemes toprovide improved andsafely managed drinkingwater
Plan and implementsafely managed watersupply schemes toreduce access gap
132,465,000,000 198,697,000,000 PHE&RDDLG&HTPD Urban Unit 2016-2026
Dysfunctional and non-functional schemesrehabilitated andmaintained (538schemes fit for repairplus 200 additionalschemes)
Rehabilitate 74 non-functional water supplyschemes per year (total538 schemes plusadditional 200 schemesin long term)
222,000,000 222,000,000 PHE&RDDLG&HTPD Development Partners 2016-2026
Ageing water supplyschemes infrastructure
Replace ageing watersupply schemes (50 750,000,000 750,000,000 PHE&RDD
LG&HTPD Urban Unit 2016-2026

388
replaced (50 schemesper year)
schemes per year)
Water supply schemes in119 towns upgraded
Upgrade 119 townshipschemes (12 per year)including extra overheadstorage capacity
3,600,000,000 3,600,000,000 PHE&RDDLG&HTPD Urban Unit 2016-2026
Energy efficient watersupply schemes (600)
Water supply schemesconverted to solar energy(60 units per year)
900,000,000 900,000,000 PHE&RDDLG&HTPD Urban Unit 2016-2026
Community awarenessabout water use, safety,maintenance andpreservation enhancedin all districts through aneffective BCC strategy
Community awareness,leaflets, billboards forwater use 87,000,000 87,000,000 PHE&RDD
LG&HTPD Development Partners 2016-2026
Strengthen communitydevelopment activitiesof PHE&RDD for socialmobilisation and O&M(2594 social mobilisers)
Recruitment anddeployment of 2594Social Mobilisers – 2 perUC
5,603,040,000 5,603,040,000 PHE&RDD Development Partners 2016-2026

389
Goal 4: Availability of water safe for drinkingStrategicOutcome/Objective
Actions Indicative costs – ShortTerm
Indicative costs –Medium Term
Lead Responsibility Collaborating Agencies Time Frame
Periodic water qualitytesting at water source
Conduct monthly waterquality tests of townwater supplies andfiltration plants, andquarterly testing at tubewells
Non Cost Activity Non Cost Activity PHE&RDD PCRWR 2016-2026
Periodic water qualitytesting of distributionnetwork
Periodic monitoring ofwater quality in riversand streams incollaboration withIrrigation department
Non Cost Activity Non Cost Activity PHE&RDD Irrigation Department 2016-2026
District level waterquality testinglaboratories established(29 districts)
Establish water testinglaboratory facilities in 29districts 100,000,000 200,000,000 PHE&RDD PCRWR 2016-2026
All ground and overheadreservoirs supplied withchlorination treatment
Conduct study todetermine the status ofground and overheadreservoirs in cities andtowns
Scheduled six monthlycleaning andmaintenance of allreservoirs
Installation ofchlorinators in 30% ofreservoirs (or tube wellswhere storage capacitydoes not exist) and issueand orient users instandard operatingprocedure and safety forchlorination
10,000,000
Non Cost Activity
As part of O&M andinclude in new schemes
10,000,000
Non Cost Activity
As part of O&M andinclude in new schemes
PHE&RDD
PHE&RDD
PHE&RDD
LG&HTPD 2016-2022
2016-2026
2016-2026
Community awarenessabout water quality
Conduct communityawareness sessions,
As part of overall BCCstrategy
As part of overall BCCstrategy PHE&RDD 2016-2026

390
(including adoption oftreatment of safedrinking water in thehousehold) enhanced inall districts through aneffective BCC strategy
including women andchildren, and disseminatekey messages developedunder BCC strategy forwater quality by usingbillboards and leaflets ineach UC every year(1297)

391
Goal 5: Universal access to safely managed sanitation (sewerage and drainage) servicesStrategicOutcome/Objective
Actions Indicative costs – ShortTerm
Indicative costs –Medium Term
Lead Responsibility Collaborating Agencies Time Frame
All cities, towns and UCshave surveys, strategiesand action plans forintegrated water supply,water safety, sewerageand drainage, stormwater drainage and solidwaste management
(common to watersupply, sanitation andsolid waste)
All cities have completedsurveys, GIS mapping andstrategies, and startimplementing actionplans for integratedwater supply, watersafety, sewerage anddrainage, storm waterdrainage and solid wastemanagement
Develop integrated watersupply, water safety,sanitation, storm waterdrainage and solid wastemanagement actionplans for all cities
To be determined To be determined LG&HTPDPHE&RDD
P&DDUrban Unit 2016-2026
Improved and safelymanaged sanitationservices coverageenhanced to reduceaccess gap in urbanareas and rural areas,especially in those thatare also nutrition-sensitive
Develop an SOP for allnew and existingsanitation (sewerage anddrainage) schemes toensure that they aresafely managed
Plan and implementsafely managedsanitation (sewerage anddrainage) schemes toreduce access gap
125,336,000,000 188,004,000,000 LG&HTPDPHE&RDD Urban Unit 2016-2026
Wastewater treatmentplants established in 119towns (12 per year)
Establish wastewatertreatment plants in 119towns (12 per year)
540,000,000 540,000,000 LG&HTPDPHE&RDD
P&DDUrban Unit 2016-2026
Water supply andsanitation schemeslinked with wastewatertreatment
New schemes have in-built wastewatertreatment facility
Incorporate wastewater
As part of new schemes As part of new schemes LG&HTPDPHE&RDD
P&DDUrban Unit 2016-2026

392
treatment options (likeoxidation ponds,wetlands, seweragetreatment units,community septic tanks)in rural sanitationschemes
Monitor contaminationlevels of industrialeffluent
Map major industrialwastewater flows andconduct periodicwastewater testing andpublic reporting ofindustrial effluent quality
Conduct periodicwastewater testing andpublic reporting ofindustrial effluent quality
Non cost activity Non cost activity
PCRWRPCSIR
Sindh EnvironmentProtection Agency
LG&HTPDPHE&RDD
Irrigation DepartmentIndustries
2016-2026
Increased proportion oftreated industrialwastewater
Set up Combined EffluentTreatment Plant (CETP)for cluster of industrieswhere feasible
To be determined To be determined LG&HTPDPHE&RDD
P&DDUrban UnitIndustries
Sindh EnvironmentProtection Agency
2016-2026
Optimal sewage flowcapacity maintained
Sewage flowsdetermined for all citiesand towns, and sixmonthly de-silting andcleaning of 30% drainsand sewers with safesludge disposal in townsand zones in cities
To be determined To be determined LG&HTPD Sindh EnvironmentProtection Agency 2016-2026
Optimal status of sewermaintenance equipment(sucking machine, jettingmachine, sucking/jettingmachine)
Status of equipmentavailability andfunctionality determinedfor each town and cityzone
Towns and city zonesequipped with sewermaintenance equipment
To be determined To be determined LG&HTPD 2016-2026
Adequate and functional Status of collector and To be determined To be determined LG&HTPD 2016-2026

393
collector and branchsewers
branch sewers in eachcity and towndetermined
Phased replacement orlaying of new linesinstituted
Optimal functionality ofpumping stations
Status of pumpingstations in each city andtown determined
Phased rehabilitationplan instituted fordysfunctional pumpingstations
To be determined To be determined LG&HTPD 2016-2026
Systematic managementof Operation andMaintenance ofsewerage and drainagesystems
Develop O&M manual forsewerage and drainageincluding sewer desiltingsafety measures
Train LG&HTPD andPHE&RDD staff in use ofO&M manual
As part of capacitybuilding
As part of capacitybuilding LG&HTPD Development Partners 2016-2026
Community awarenessand social mobilisationregarding sanitation,nutrition and hygieneenhanced in all UCsthrough effectiveimplementation of BCCstrategy
Community awareness,leaflets, billboards forsafe sanitation andhygiene (1297 UCs in 29districts) 87,000,000 87,000,000 LG&HTPD Development Partners 2016-2026
2 Community ResourcePersons (preferably onemale and one female)deployed for BCC foreach UC (2594Community ResourcePersons)
Recruitment of 2594Social Mobilisers – 2 perUC
5,603,040 5,603,040 LG&HTPD Development Partners 2016-2026
Safe sanitation practicespromoted in high opendefecation zones,
Develop provincial anddistrict level road mapson PATS/ODF for
As part of ongoing andnew schemes and Saaf
Suthro Sindh
As part of ongoing andnew schemes and Saaf
Suthro SindhLG&HTPD Development Partners 2016-2026

394
nutrition-sensitive andpolio priority areas
identified villages in 13priority districts
Incentivising the ODFvillages by laying of watersupply scheme, seweragesystem, waste watertreatment, etc
Execution of schemes oncost sharing basis i.e.Community invests ininternal component,while Governmentinvests for externalcomponent
Collaborate withinternational partnersand NGOs for integratingWASH component ininterventions in nutrition-sensitive areas

395
Goal 6: Improved, efficient and safe management of solid wasteStrategicOutcome/Objective
Actions Indicative costs – ShortTerm
Indicative costs –Medium Term
Lead Responsibility Collaborating Agencies Time Frame
All cities, towns and UCshave surveys, strategiesand action plans forintegrated water supply,water safety, sewerageand drainage, stormwater drainage and solidwaste management
(common to watersupply, sanitation andsolid waste)
All cities have completedsurveys, GIS mapping andstrategies, and startimplementing actionplans for integratedwater supply, watersafety, sewerage anddrainage, storm waterdrainage and solid wastemanagement
Develop integrated watersupply, water safety,sanitation, storm waterdrainage and solid wastemanagement actionplans for all cities
Conduct wastecharacterisation studies(including hospital waste)for mega andintermediate cities
To be determined To be determined LG&HTPDPHE&RDD
P&DDUrban Unit 2016-2026
Integrated solid wastemanagementimplemented in 29districts (5 in short term,10 in medium term, and13 in long term)
Develop integrated solidwaste management in 29districts To be determined To be determined LG&HTPD
PHE&RDDP&DD
Urban Unit 2016-2026
Town and UC levelprofiles developed forwastewater and solidwaste in 119 towns and1297 UCs
Study to develop profileon wastewater and solidwaste in 119 towns and1297 UCs (5 districts inshort term, 10 districts inmedium term, and 14districts in long term)
25,000,000 50,000,000 LG&HTPD Urban Unit 2016-2026
Solid waste collection At least 90% of solid As part of solid waste As part of solid waste LG&HTPD Urban Unit 2016-2026
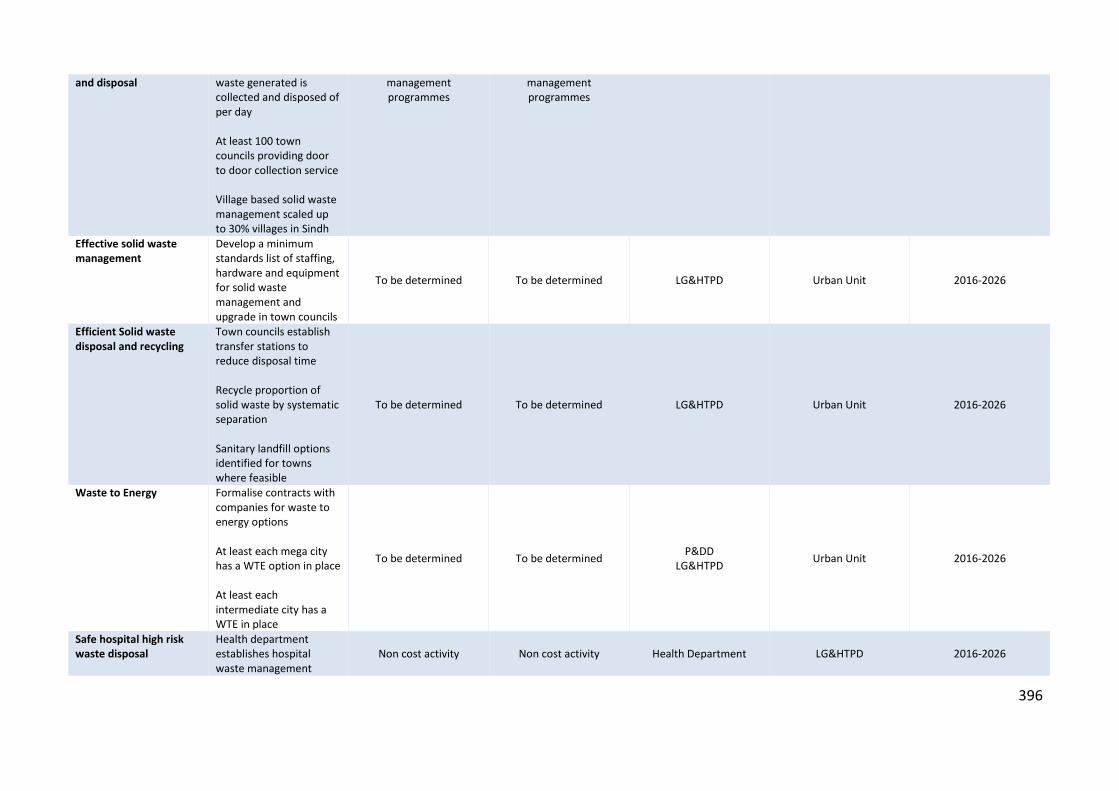
396
and disposal waste generated iscollected and disposed ofper day
At least 100 towncouncils providing doorto door collection service
Village based solid wastemanagement scaled upto 30% villages in Sindh
managementprogrammes
managementprogrammes
Effective solid wastemanagement
Develop a minimumstandards list of staffing,hardware and equipmentfor solid wastemanagement andupgrade in town councils
To be determined To be determined LG&HTPD Urban Unit 2016-2026
Efficient Solid wastedisposal and recycling
Town councils establishtransfer stations toreduce disposal time
Recycle proportion ofsolid waste by systematicseparation
Sanitary landfill optionsidentified for townswhere feasible
To be determined To be determined LG&HTPD Urban Unit 2016-2026
Waste to Energy Formalise contracts withcompanies for waste toenergy options
At least each mega cityhas a WTE option in place
At least eachintermediate city has aWTE in place
To be determined To be determined P&DDLG&HTPD Urban Unit 2016-2026
Safe hospital high riskwaste disposal
Health departmentestablishes hospitalwaste management
Non cost activity Non cost activity Health Department LG&HTPD 2016-2026

397
committees in eachhospital in line with theEnvironmental andMedical WasteManagement Guidelines
Health department incollaboration withLG&HTPD orients eachhospital wastemanagement committeeon Environmental andMedical WasteManagement Guidelines,municipal solid waste andhigh risk waste and theirseparate disposal
Each mega city andintermediate city has acentralised andfunctional high riskhospital waste disposalfacility
Hospital high risk wastedisposed of safely
Each town has acentralised andfunctional high riskhospital waste disposalfacility
Safe and hygienicSlaughterhouses
Update status of allslaughterhouses(recognised andunrecognised) in eachdistrict and prioritisethose for rehabilitation,solid waste andwastewater management
15,000,000 5,000,000 LG&HTPD

398
Develop slaughterhousesafety and hygienepractice guidelines andorient 100%slaughterhouse staff inrecognisedslaughterhouses in safehandling and disposal ofcarcass, entrails, hides,and wastewater
Provide refresher trainingon slaughterhouse safetyand hygiene practiceguidelines to 100%slaughterhouse staff inrecognisedslaughterhouses in safehandling and disposal ofcarcass, entrails, hides,and wastewater
Efficient and effectivemanagement ofIndustrial Solid Waste
Determine the currentstatus of industrial solidwaste production anddisposal
Develop strategies andactions for efficient andeffective management ofindustrial solid waste
10,000,000 LG&HTPD Urban UnitIndustries 2019-2022

399
Goal 7: Improved health, hygiene and nutritionStrategicOutcome/Objective
Actions Indicative costs – ShortTerm
Indicative costs –Medium Term
Lead Responsibility Collaborating Agencies Time Frame
Fully functional waterand sanitation services inhealth facilities DHQs,THQs/CHs, RHCs, CDs,MCHs at communal andfacility level
For Basic Health Unitswith missing facilities forwater and sanitation(about 20% of BHUs),provide extension ofwater distribution pipefrom water supplyscheme, water tank and2 latrines per BHU
Health Department andPHE&RDD to jointlyconduct a situationanalysis and update thestatus of missing facilitiesfor water and sanitationin all health facilities anddevelop a Joint ActionPlan (JAP) to addressthese
Provision of missingWASH facilities (latrines,hand washing spots, filtertap for drinking waterpurposes) in targetedhealth facilities based onJoint Action Plan (JAP)
Provide waterdistribution point to localhealth facility in all newwater supply schemes
57,100,000 PHE&RDDHealth Department LG&HTPD 2016-2019
Hospital WasteManagement Rulesimplemented in 88hospitals as initialpriority.
Implement HospitalWaste ManagementRules in 88 hospitals 540,000,000 540,000,000 LG&HTPD
Health Department 2016-2026
Multi-sector nutrition-sensitive WASHprogrammeimplemented innutritionally deficientdistricts
Multi-sector nutrition-sensitive WASHprogramme implementedin nutritionally deficientdistricts
As part of NutritionSupport Programme and
Saaf Suthro Sindh
As part of NutritionSupport Programme and
Saaf Suthro Sindh
LG&HTPDHealth Department Development Partners 2016-2026
Nutrition-sensitiveWASH integrated inhealth promotion in
Nutrition-sensitive WASHhealth education moduleadded to curriculum of

400
primary health care LHWs/CMWs/LHVs withsupporting trainingmaterial as part of multi-sector nutrition-sensitiveWASH interventions
Master trainers, districttrainers and facilitytrainers oriented in keynutrition-sensitive WASHmessages andLHWs/CMWs/LHVsprovided training onnutrition-sensitive WASHhealth promotion andhygiene as part of on-going training by healthdepartment
At least 100% ofLHWs/CMWs/LHVstrained in nutrition-sensitive WASH healthpromotion and hygieneas part of on-goingtraining by healthdepartment
Nutrition-sensitiveWASH integrated inhealth advocacy and BCCcampaigns and healthweeks
Nutrition-sensitive WASHcomponent of healthpromotion and hygieneintegrated in mother andchild health weeks aspart of on-goingcampaign by healthdepartment
Advocacy and BCCcampaign held at healthfacility, district andprovincial levels as partof on-going health
2,000,000 LG&HTPDHealth Department Development Partners 2016-2019

401
campaigns
Key messages toadvertised in electronicand print media as partof on-going healthcampaigns
IEC materials with keynutrition-sensitivehygiene messagesdistributed at healthfacility level
Development ofnutrition-sensitive IECmaterials for primary,secondary and tertiaryhealth facilities
Availability at anddissemination of IECmaterials for primary,secondary and tertiaryhealth facilities
5,000,000 1,000,000 LG&HTPDHealth Department Development Partners 2016-2026
WASH services at healthfacilities monitoredregularly by HealthDepartment
Regular monitoring andsupervision conducted byhealth facility in-charges,DHOs and respectivestakeholders
Non cost activity Non cost activity Health Department 2016-2026

402
Goal 8: Improved school WASHStrategicOutcome/Objective
Actions Indicative costs – ShortTerm
Indicative costs –Medium Term
Lead Responsibility Collaborating Agencies Time Frame
Nutrition-sensitiveWASH integrated inteacher trainingprogramme
Collaborate with SindhTeacher EducationDevelopment Authority,Board of Curriculum &Extension Wing,Provincial Institute ofTeacher Education, SindhTextbook Board andincorporate nutrition-sensitive WASH hygienepromotion in pre-serviceand in-service teachertraining programme andCPD training of teachereducators
Nutrition-sensitive WASHhygiene promotioncascaded throughTeacher Educators aspart of on-goingeducation programme
Non cost activity Non cost activityLG&HTPD
Education and LiteracyDepartment
PHE&RDDDevelopment Partners 2016-2026
Nutrition-sensitiveWASH integrated inschools curriculum
Collaborate with SindhTeacher EducationDevelopment Authority,Board of Curriculum &Extension Wing,Provincial Institute ofTeacher Education, SindhTextbook Board forinclusion of topics onnutrition-sensitive water,sanitation and hygiene incurriculum for classes 1to 12
Non cost activity Non cost activityLG&HTPD
Education and LiteracyDepartment
PHE&RDDDevelopment Partners 2016-2026
Menstrual hygienemanagement integrated
Nutrition-sensitive WASHhygiene promotion Non cost activity Non cost activity LG&HTPD
Education and LiteracyPHE&RDD
Development Partners 2016-2026

403
in health and hygiene forgirls
module incorporatesmenstrual hygienemanagement for girls
Impart menstrualhygiene managementeducation in nutrition-sensitive WASH hygienepromotion to girls middleand high schools as partof on-going school healtheducation
Department
100% of schools withmissing facilities havesafely managed drinkingwater and latrines (30%in short term, 30% inmedium term, 40% inlong term) (extension ofwater distribution pipefrom water supplyscheme, water tank and2 latrines per school)
Schools with missingfacilities addressed andhave safely manageddrinking water andlatrines
1,948,455,000 1,948,455,000LG&HTPD
Education and LiteracyDepartment
PHE&RDDDevelopment Partners 2016-2026
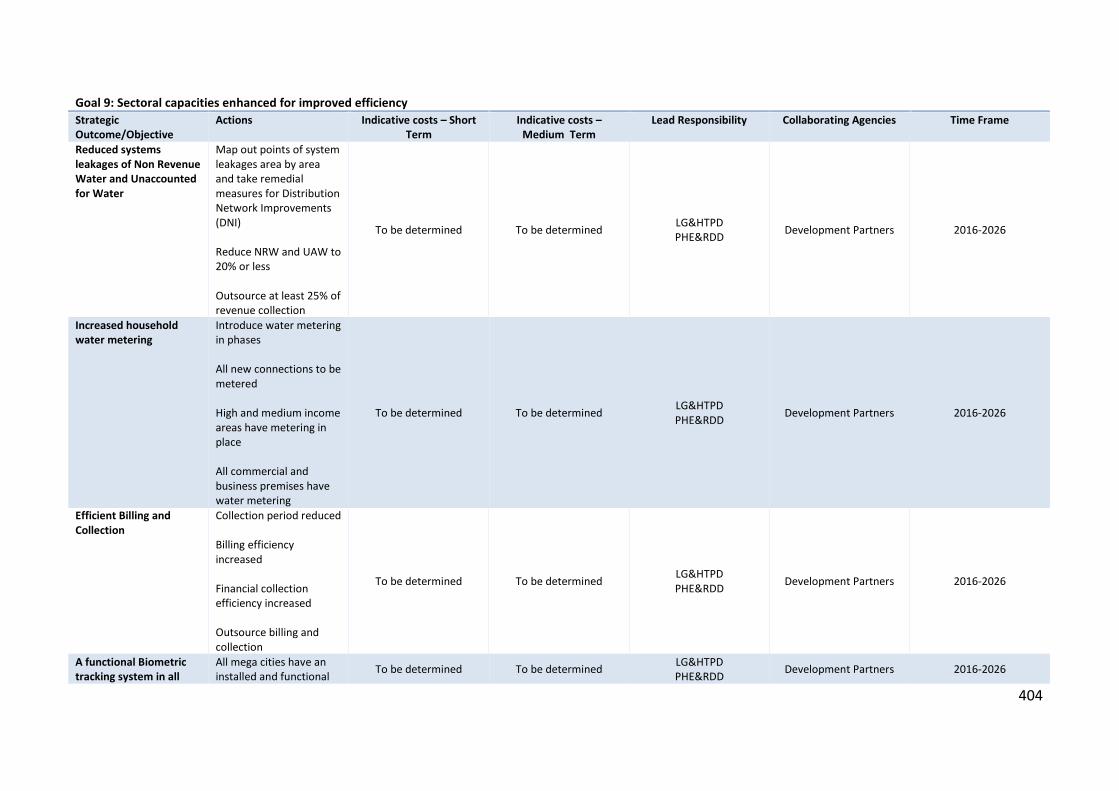
404
Goal 9: Sectoral capacities enhanced for improved efficiencyStrategicOutcome/Objective
Actions Indicative costs – ShortTerm
Indicative costs –Medium Term
Lead Responsibility Collaborating Agencies Time Frame
Reduced systemsleakages of Non RevenueWater and Unaccountedfor Water
Map out points of systemleakages area by areaand take remedialmeasures for DistributionNetwork Improvements(DNI)
Reduce NRW and UAW to20% or less
Outsource at least 25% ofrevenue collection
To be determined To be determined LG&HTPDPHE&RDD Development Partners 2016-2026
Increased householdwater metering
Introduce water meteringin phases
All new connections to bemetered
High and medium incomeareas have metering inplace
All commercial andbusiness premises havewater metering
To be determined To be determined LG&HTPDPHE&RDD Development Partners 2016-2026
Efficient Billing andCollection
Collection period reduced
Billing efficiencyincreased
Financial collectionefficiency increased
Outsource billing andcollection
To be determined To be determined LG&HTPDPHE&RDD Development Partners 2016-2026
A functional Biometrictracking system in all
All mega cities have aninstalled and functional To be determined To be determined LG&HTPD
PHE&RDD Development Partners 2016-2026
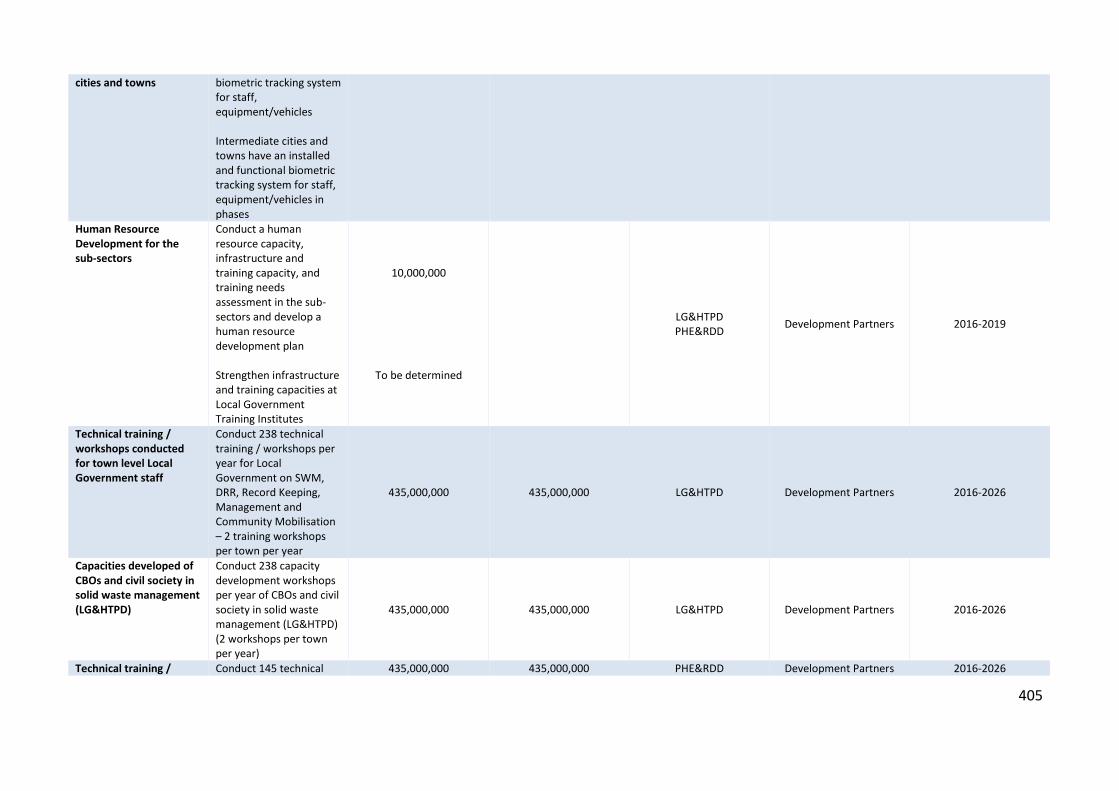
405
cities and towns biometric tracking systemfor staff,equipment/vehicles
Intermediate cities andtowns have an installedand functional biometrictracking system for staff,equipment/vehicles inphases
Human ResourceDevelopment for thesub-sectors
Conduct a humanresource capacity,infrastructure andtraining capacity, andtraining needsassessment in the sub-sectors and develop ahuman resourcedevelopment plan
Strengthen infrastructureand training capacities atLocal GovernmentTraining Institutes
10,000,000
To be determined
LG&HTPDPHE&RDD Development Partners 2016-2019
Technical training /workshops conductedfor town level LocalGovernment staff
Conduct 238 technicaltraining / workshops peryear for LocalGovernment on SWM,DRR, Record Keeping,Management andCommunity Mobilisation– 2 training workshopsper town per year
435,000,000 435,000,000 LG&HTPD Development Partners 2016-2026
Capacities developed ofCBOs and civil society insolid waste management(LG&HTPD)
Conduct 238 capacitydevelopment workshopsper year of CBOs and civilsociety in solid wastemanagement (LG&HTPD)(2 workshops per townper year)
435,000,000 435,000,000 LG&HTPD Development Partners 2016-2026
Technical training / Conduct 145 technical 435,000,000 435,000,000 PHE&RDD Development Partners 2016-2026
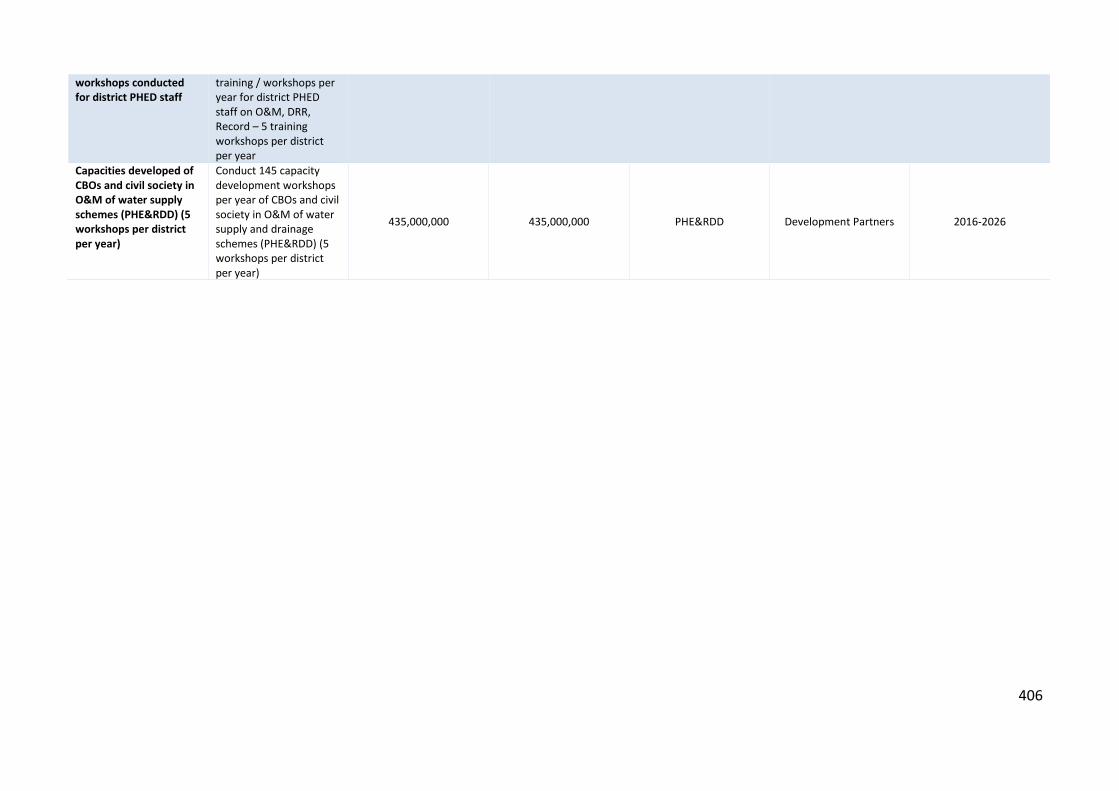
406
workshops conductedfor district PHED staff
training / workshops peryear for district PHEDstaff on O&M, DRR,Record – 5 trainingworkshops per districtper year
Capacities developed ofCBOs and civil society inO&M of water supplyschemes (PHE&RDD) (5workshops per districtper year)
Conduct 145 capacitydevelopment workshopsper year of CBOs and civilsociety in O&M of watersupply and drainageschemes (PHE&RDD) (5workshops per districtper year)
435,000,000 435,000,000 PHE&RDD Development Partners 2016-2026

407
Goal 10: Improved sectoral financingStrategicOutcome/Objective
Actions Indicative costs – ShortTerm
Indicative costs –Medium Term
Lead Responsibility Collaborating Agencies Time Frame
Sectoral budgeting andexpenditure reportingstratified separately foreach sub-sector(environment, watersupply, sewerage anddrainage)
Conduct a financialbudgeting andexpenditure review ofsectoral budgets andexpenditures and stratifyactual sub-sector spendsagainst sub-sectorbudgets for last five years
Introduce sub-sectorexpenditure reportingseparately forenvironment, watersupply, sewerage anddrainage, and solid waste
10,000,000 LG&HTPDPHE&RDD Development Partners 2016-2019
Increased Own SourceRevenue (OSR) in sub-sectors by Town Councils
Incentivise by providingmatching grants to TownCouncils related to sub-sector OSR
At least 30% of TownCouncils increase theirbaseline sub-sector OSRby 100% or more
To be determined To be determined LG&HTPDPHE&RDD Development Partners 2016-2026
Increased regulatedprivate sectorparticipation in sub-sectors
Incentivise private sectorwith subsidies to providewater supply, filtrationplants, O&M services,rehabilitation ofdysfunctional schemes,solid waste management,wastewater treatment inselected areas and cityand town zones
To be determined To be determined LG&HTPDPHE&RDD Development Partners 2016-2026
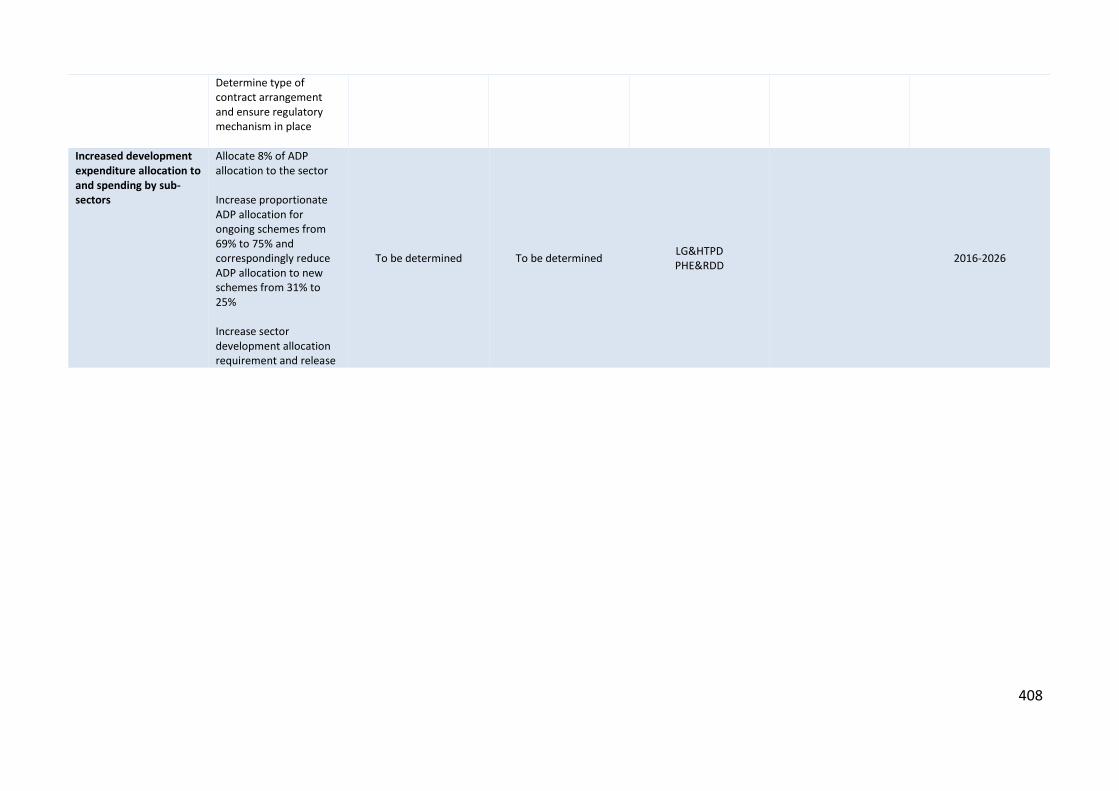
408
Determine type ofcontract arrangementand ensure regulatorymechanism in place
Increased developmentexpenditure allocation toand spending by sub-sectors
Allocate 8% of ADPallocation to the sector
Increase proportionateADP allocation forongoing schemes from69% to 75% andcorrespondingly reduceADP allocation to newschemes from 31% to25%
Increase sectordevelopment allocationrequirement and release
To be determined To be determined LG&HTPDPHE&RDD 2016-2026

409
Goal 11: Improved sectoral coordination and planningStrategicOutcome/Objective
Actions Indicative costs – ShortTerm
Indicative costs –Medium Term
Lead Responsibility Collaborating Agencies Time Frame
Provincial levelcoordination andprogrammemanagement for WASHstreamlined andenhanced
ACS Development P&DDnotifies SectorCoordination andMonitoring Unit forWASH
Establish, equip andmaintain a SectorCoordination andMonitoring Unit in P&DD
Quarterly reviewmeetings of SteeringCommittee andDepartmental TechnicalCommittees
Establish a Design Cell inLG&HTPD and PHE&RDD
Non cost activity
116,000,000
Non cost activity
To be determined
114,000,000
P&DDLG&HTPDPHE&RDD
Development Partners2016-2026
District levelcoordination andprogrammemanagement for WASHstreamlined andenhanced
DC Offices notify districtWASH committees
Quarterly review ofWASH schemes andactivities in meetings ofDistrict WASHCommittees
ACS Development P&DDnotifies DistrictCoordination andMonitoring Unit forWASH
Non cost activity Non cost activity LG&HTPDPHE&RDD Development Partners 2016-2026

410
Goal 12: Improved sectoral monitoringStrategicOutcome/Objective
Actions Indicative costs – ShortTerm
Indicative costs –Medium Term
Lead Responsibility Collaborating Agencies Time Frame
Monitoring andreporting mechanismdeveloped for water andsanitation schemes
Reporting templates forwater supply andsanitation schemesdeveloped and tested;Reporting pathwayestablished from UC todistrict to provincial level
District LG&HTPD andPHE&RDD staff trained inits use
Establish 29 districtcoordination andmonitoring units based atDC Office – 1 per district
208,800,000 208,800,000 P&DDLG&HTPDPHE&RDD
Development Partners2016-2026
Improved infrastructurefor monitoring andreporting established forwater supply schemes
Procure computers andaccessories for MIS – 5sets per district for watersupply schemes. Developcomputerised MIS forwater supply schemes –29 districts
18,125,000 PHE&RDD Development Partners 2016-2019
Improved infrastructurefor monitoring andreporting established forsanitation, sewerage anddrainage schemes
Procure computers andaccessories for MIS – 5sets per district forsanitation, sewerage anddrainage schemes.Develop computerisedMIS for sanitation,sewerage and drainageschemes – 29 districts
18,125,000 LG&HTPD Development Partners 2016-2019
Monitoring andreporting capacityenhanced for water andsanitation
Recruit and deploy a 29District M&E Managersbased at DC Office – 1District M&E Managerper district
250,560,000 250,560,000 P&DDLG&HTPDPHE&RDD
Development Partners2016-2026

411
Recruit and deploy 58Water and SanitationReporting Officers – 2 perdistrict based at DCOffice
Recruit and deploy 29drivers – 1 driver perdistrict based at DCOffice
Travel for monitoringand reporting facilitated
Procure 29 vehicles formonitoring and reporting– 1 vehicle per districtbased at DC Office
124,700,000 52,200,000 P&DDLG&HTPDPHE&RDD
Development Partners2016-2026

412
Plan of Activities
Legislations, Regulations, Policies and Strategies
StrategicObjectives/Outcomes
Short Term Actions1 - 3 years
Medium Term Actions4 - 6 years
Activities Time Frame
Finalisation of draftedpolicies and theirimplementation
Approval of Draft DrinkingWater Policy, Revised DraftSanitation Policy, and DraftBehaviour ChangeCommunication Strategyand their implementation
Submitting the polices/strategy to cabinet
Approval of polices/strategy from cabinet
Implementation of polices/strategy
Feb 2017
June 2017
June 2017 and onward
Sindh Local GovernmentAct 2013 provisions forWASH operationalised
Conduct a review of theSLGA and develop Rules ofBusiness for LG&HTPD andPHE&RDD
Review of SLGA by technical experts
Stakeholder consultation Workshops
Draft Rules of Business for LG&HTPD andPHE&RDD
Final Rules with incorporating feedback ondraft rules
March 2017
April-Sep 2017
Oct 2017
Dec 2017
Municipal water governedby a legal framework
Enactment andpromulgation of the SindhMunicipal Water Act (draft)
City and Town masterplans developed andincorporate zone-wisedevelopment of watersupply, sewerage anddrainage, and solid wastemanagement
Engaging sector partners for preparation ofSindh Municipal Water Act
Drafting Sindh Municipal Water Act byLG&HTPD
Review of draft Act by Law Department
Enactment and promulgation of the SindhMunicipal Water Act
Jan-June 2017
June-Sep 2017
Oct 2017- March 2018
June 2018

413
StrategicObjectives/Outcomes
Short Term Actions1 - 3 years
Medium Term Actions4 - 6 years
Activities Time Frame
Engaging donors and private sector supportfor development of City and Town masterplans
Deploying technical experts
Stakeholder consultation at City and Townlevel
Drafting master plans incorporating zone-wisedevelopment of water supply, sewerage anddrainage, and solid waste management
Review of draft master plans
Final master plans with incorporatingfeedback
Jan-June 2019
July 2019
Aug 2019-March 2020
April-June 2020
July-Sep 2020
Oct-Dec 2020
Sindh Water Commissionperforms its functions as aregulatory body
Establishment of the SindhWater Commission
Tariff structure revised
Minimum service deliverystandards established formunicipal services (watersupply, sanitation, solidwaste management)
Ensure that each localgovernment has a masterplan on water, sanitationand solid wastemanagement for its area ofjurisdiction
At least 25% localgovernments achieve
Notification for establishment of Sindh WaterCommission
Allocation of human and other resources forSWC
Establishment of the Sindh Water Commission(SWC)
Jan-Feb 2017
March-Aug 2017
Sep 2017
Revision of Tariff structure by SWC
Development of minimum service deliverystandards by SWC
Collaborating with city/town governments forensuring development of master plans
Oct-Dec 2017
Jan-June 2018
Jan 2019-Dec 2020

414
StrategicObjectives/Outcomes
Short Term Actions1 - 3 years
Medium Term Actions4 - 6 years
Activities Time Frame
minimum service deliverystandards for municipalservices (water, sanitation,solid waste management)
Monitoring of services of city/towngovernments against minimum servicedelivery standards
Jan 2021 to onward
Legislative review toharmonise existinglegislation, policies andrules
Legislative review ofdrinking water acts,policies, regulations anddevelopment ofharmonised new acts,regulations and guidelines,including O&M
Introduce legislativechange in SLGA 2013 forPHE&RDD to beresponsible for O&M ofwater and sewerage anddrainage schemes
Periodic review of newlegislations, policies andregulations and theirimplications for WASH
Identification of technical experts
Review of drinking water acts, policies,regulations through consultation process
Development of harmonised new acts,regulations and guidelines, including O&M byconsultant (draft)
Approval of new acts, regulations andguidelines, including O&M by cabinet
Revision of SLGA 2013 for PHE&RDD to beresponsible for O&M of water and sewerageand drainage schemes
Jan-March 2017
April-June 2017
July-Dec 2017
Jan-June 2018
July-Dec 2018

415
StrategicObjectives/Outcomes
Short Term Actions1 - 3 years
Medium Term Actions4 - 6 years
Activities Time Frame
Legislative review ofsanitation, sewerage anddrainage acts, policies,regulations anddevelopment ofharmonised new acts,regulations and guidelines,including O&M
Periodic review of new legislations, policiesand regulations and their implications forWASH after every two years by technicalexperts and sector stakeholders
Dec 2020
Dec 2022
Sectoral operatingprocedures (designguidelines) for planningand managementdeveloped
Development of StandardOperating Procedures(design guidelines) forwater planning,management and O&M forPHE&RDD
Development of StandardOperating Procedures(design guidelines) forwastewater and solidwaste planning,management and O&M forLG&HTPD
Deployment of Team
Stakeholder consultation
Development of draft Standard OperatingProcedures (design guidelines) for planning,management and O&M by consultant;
Review of developed SOPs by PHE&RDD ,LG&HTPD and P&DD
Incorporating Feedback in final SOPs
Approval of SOPs by departments
Jan-March 2017
April-June 2017
July-Oct 2017
Nov-Dec 2017
Jan-March 2018
April-June 2018
Operational guidelines forCBOs for water andsanitation developed
Development of guidelinesfor CBOs for projectmanagement and O&M ofwater supply schemes
Development of guidelinesfor CBOs for projectmanagement and O&M for
Advertising Request for proposal
Selection of technical team
Development of draft guidelines for projectmanagement and O&M of water supplyschemes, sanitation, sewerage and drainage
Jan 2017
Feb 2017
March-June 2017

416
StrategicObjectives/Outcomes
Short Term Actions1 - 3 years
Medium Term Actions4 - 6 years
Activities Time Frame
sanitation, sewerage anddrainage schemes
schemes
Incorporating feedback in draft guidelines
Approval of guidelines
Sep-Oct 2017
Dec 2017Municipal services dutybearers have necessarymanagerial and leadershipskills for an integrated,safely managed andnutrition-sensitive watersupply, sewerage anddrainage, and solid wastemanagement programme
Orientation and capacitybuilding programme of 2big cities, 119 town and1297 union council officialson application ofregulations, policies andstrategies in planning,development and deliveryof municipal services thatare integrated, safelymanaged and nutrition-sensitive
At least 50% of 2 big cities,119 town and 1297 unioncouncil officials haveparticipated in a capacitybuilding programme onplanning for andimplementing watersupply, sewerage anddrainage, and solid wastemanagement that areintegrated, safely managedand nutrition-sensitive
Identification of technical team
Development of training modules onapplication of regulations, policies andstrategies in planning, development anddelivery of municipal services that areintegrated, safely managed and nutrition-sensitive
Review of training modules
Finalization of training modules withincorporating feedback
Jan-Feb 2017
March-Dec 2017
Jan-June 2018
July-Dec 2018
Identification of Training Team
Training of Trainers
Conducting Trainings/ orientation workshopson regulations, policies and strategies inplanning, development and delivery ofmunicipal services that are integrated, safelymanaged and nutrition-sensitive by MasterTrainers
Ensuring 50% of 2 big cities, 119 town and1297 union council officials participate intraining programme
Jan-March 2019
April-June 2020
June 2020-June 2021
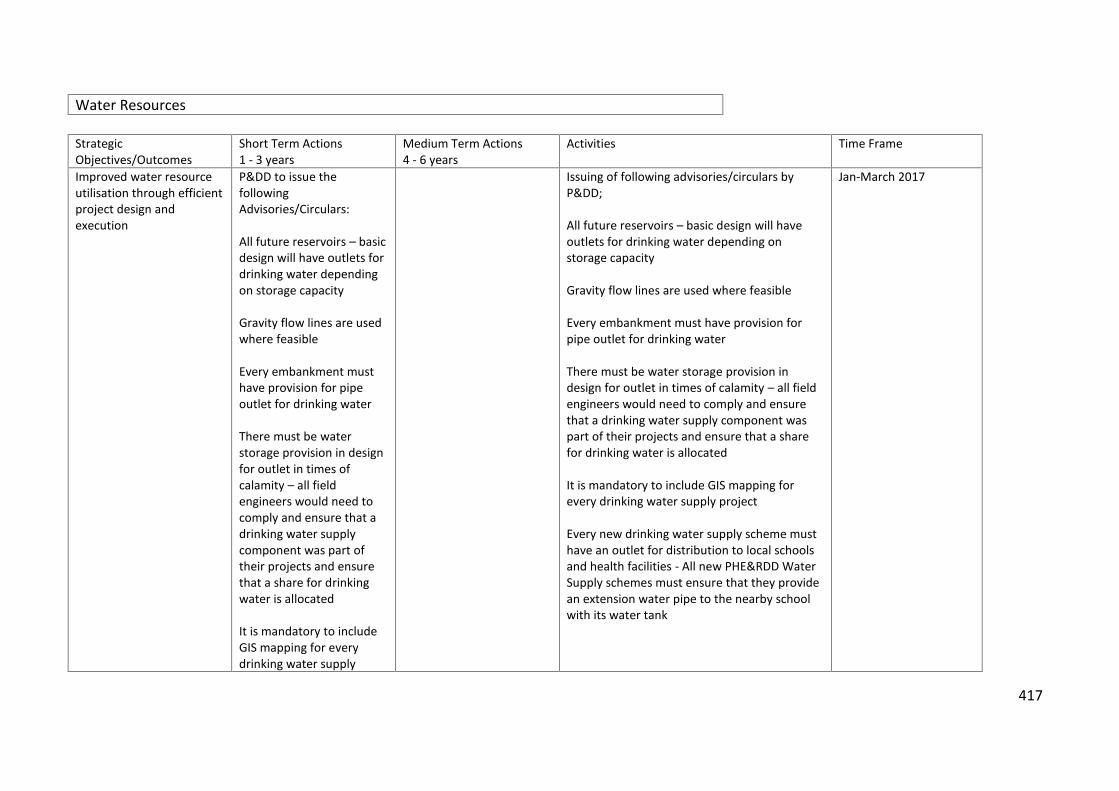
417
Water Resources
StrategicObjectives/Outcomes
Short Term Actions1 - 3 years
Medium Term Actions4 - 6 years
Activities Time Frame
Improved water resourceutilisation through efficientproject design andexecution
P&DD to issue thefollowingAdvisories/Circulars:
All future reservoirs – basicdesign will have outlets fordrinking water dependingon storage capacity
Gravity flow lines are usedwhere feasible
Every embankment musthave provision for pipeoutlet for drinking water
There must be waterstorage provision in designfor outlet in times ofcalamity – all fieldengineers would need tocomply and ensure that adrinking water supplycomponent was part oftheir projects and ensurethat a share for drinkingwater is allocated
It is mandatory to includeGIS mapping for everydrinking water supply
Issuing of following advisories/circulars byPⅅ
All future reservoirs – basic design will haveoutlets for drinking water depending onstorage capacity
Gravity flow lines are used where feasible
Every embankment must have provision forpipe outlet for drinking water
There must be water storage provision indesign for outlet in times of calamity – all fieldengineers would need to comply and ensurethat a drinking water supply component waspart of their projects and ensure that a sharefor drinking water is allocated
It is mandatory to include GIS mapping forevery drinking water supply project
Every new drinking water supply scheme musthave an outlet for distribution to local schoolsand health facilities - All new PHE&RDD WaterSupply schemes must ensure that they providean extension water pipe to the nearby schoolwith its water tank
Jan-March 2017

418
project
Every new drinking watersupply scheme must havean outlet for distribution tolocal schools and healthfacilities - All newPHE&RDD Water Supplyschemes must ensure thatthey provide an extensionwater pipe to the nearbyschool with its water tank
District profiles developedfor water resourcemanagement anddevelopment
Conduct a study on waterresource management anddevelopment in eachdistrict and map availablewater resources withpotential for domestic andmunicipal use (5 districts inshort-term)
Conduct a study on waterresource management anddevelopment in eachdistrict and map availablewater resources withpotential for domestic andmunicipal use (10 districtsin medium-term)
Development of ToRs for Study
Reviewing the study design developed bytechnical team
Finalizing the study design
Data collection on water resourcemanagement and development in eachdistrict and mapping available waterresources with potential for domestic andmunicipal use in 5 districts
Data analysis and report writing by technicalteam
Review of draft report
Final Report of 5 districts by incorporatingfeedback
March 2017
April 2017
May-June 2017
July-Sep 2017
Oct-Nov 2017
Dec 2017
Jan-Feb 2018
Replication of study in other 10 districts Jan 2020-Feb 2021

419
District level preparednessfor water safety anddisaster risk reductionenhanced
Conduct water safetyplanning at district levelincluding disaster riskreduction (10 districts inmedium term) for dutybearers
Build capacities at townand UC level for watersafety planning anddisaster risk reduction (60towns and 500 UCs)
Recruitment of technical experts
Development of study design
Data collection for mapping out UCs at risk ofdisaster and poor quality water;
Conducting water safety planning at districtlevel including DRR in other 5 districts
Jan-March 2017
March-2017
April-June 2017
July-Sep 2017
Conducting water safety planning at districtlevel including DRR in other 10 districts
Developing training material for Town and UCstaff
Training of Trainers
Training of Town and UC staff on water safetyplanning and disaster risk reduction (60 townsand 500 UCs) by Master Trainers
Jan-June 2020
July-Sep 2020
Oct-Dec 2020
Jan-June 2021
Sectoral capacity forclimate change adaptationand mitigation developed
Sub-sector climate changeadaptation and mitigationstrategies developed
Mapping of towns at risk ofeffects of climate change
Piloting of climate changeadaptation and mitigationin selected towns (to beidentified)
Developing ToRs for strategy
Stakeholder consultation
Draft climate change adaptation andmitigation strategies
Approval of climate change adaptation andmitigation strategies
Study on Mapping of towns at risk of effectsof climate change by consultants
Jan-Feb 2017
March-Sep 2017
Oct-Dec 2017
Jan-March 2018
April-Dec 2018

420
Developing PC I for identified towns to pilot ofclimate change adaptation and mitigationprojects
Implementation of project;
Review/Evaluation of project to assess lessonlearnt/replication of project
April-June 2020
July 2020-June 2022
July 2022
Municipal services dutybearers fully conversantwith climate change and itsmitigation strategies
Need assessment of sub-sector human resources forclimate change adaptationand mitigation
Capacity buildingprogramme of city, townand union council officialsin pilot areas on climatechange mitigationstrategies
Developing ToRs for consultant;
Finalizing study tools and design
Training Need Assessment of sub-sectorhuman resources for climate changeadaptation and mitigation;
March-April 2019
May-June 2019
July-Dec 2019
Development of training module on climatechange adaptation and mitigation
Training of Trainers
Conducting training of city, town and unioncouncil officials in pilot areas on climatechange mitigation strategies by MasterTrainers
Jan-March 2020
April-June 2020
July-Dec 2020
Rainwater harvestingsystems implemented inpilot areas
Rainwater harvesting pilotprojects evaluated andplan to extend to otherfeasible cities developed
In participating pilot areas,rainwater harvestingprovides at least 10% ofwater used for non-domestic municipalservices and horticulture
Third Party evaluation of rainwater harvestpilot projects for replication of these projects;
Jan-March 2019
Developing proposal for rainwater harvestingprojects based on recommendation ofevaluation report
Mobilizing resources
Implementation of project in participatingpilot areas, rainwater harvesting provides atleast 10% of water used for non-domestic
April-June 2019
July-Aug 2019
Sep 2019-June 2022
421
municipal services and horticulture
422
Water Supply
StrategicObjectives/Outcomes
Short Term Actions1 - 3 years
Medium Term Actions4 - 6 years
Activities Time Frame
All cities, towns and UCshave surveys, strategiesand action plans forintegrated water supply,water safety, sewerage anddrainage, storm waterdrainage and solid wastemanagement
(common to water supply,sanitation and solid waste)
All cities have completedsurveys, GIS mapping andstrategies, and startimplementing action plansfor integrated watersupply, water safety,sewerage and drainage,storm water drainage andsolid waste management
Develop integrated watersupply, water safety,sanitation, storm waterdrainage and solid wastemanagement action plansfor all cities
At least 50% of UCs (500)have completed surveys,GIS mapping andstrategies, and startimplementing action plansfor integrated watersupply, water safety,sewerage and drainage,storm water drainage andsolid waste management
Develop integrated watersupply, water safety,sanitation, storm waterdrainage and solid wastemanagement action plansfor 500 UCs
Deployment of Technical Experts;
Development of software by TechnicalExperts;
Survey for GIS mapping;
Developing GIS maps for integrated watersupply, water safety, sewerage and drainage,storm water drainage and solid wastemanagement;
Developing action plans for 500 UC onintegrated water supply, water safety,sanitation, storm water drainage and solidwaste management based on city GIS maps
Jan-March 2017
April-June 2017
July2017-June 2018
July 2018- June 2019
July 2020-June 2021
Improved and safelymanaged water supplycoverage enhanced tomeet access gap
Develop an SOP for all newand existing water supplyschemes to provideimproved and safelymanaged drinking waterwhich is:Accessible: located onpremisesAvailable: available whenneededSafe: free of faecal andpriority chemicalcontaminationAugmented by improved
Plan and implement safelymanaged water supplyschemes to reduce accessgapBy 50% in medium termimproved availability from6 hours to 8 hours dailypiped drinking water that is‘fit for drinking; in at least50% of areas
Execution of schemes oncost sharing basis i.e.Community invests in
Developing SoPs for all new and existing watersupply schemes to provide improved andsafely managed drinking water;
Developing PC I of water supply schemes in25% of areas for improved availability from 4hours to 6 hours daily
Allocating resources for water supply schemes
Execution of water supply schemes project oncomponent sharing basis i.e. Communityinvests in maintenance and internalcomponent, while Government invests for
Jan-March 2017
April-June 2017
July-Aug 2017
Sep 2017-June 2019

423
StrategicObjectives/Outcomes
Short Term Actions1 - 3 years
Medium Term Actions4 - 6 years
Activities Time Frame
transmission anddistribution networks andincreased overheadreservoir capacity
Plan and implement safelymanaged water supplyschemes to reduce accessgapBy 20% in short termimproved availability from4 hours to 6 hours dailypiped drinking water that is‘fit for drinking; in at least25% of areas
Execution of schemes oncost sharing basis i.e.Community invests inmaintenance and internalcomponent, whileGovernment invests forexternal component
Install water flow monitorsat tube wells; alsointroduce flow monitors atvalves
maintenance and internalcomponent, whileGovernment invests forexternal component
Install water flow monitorsat tube wells; alsointroduce flow monitors atvalves
external component
Installation of water flow monitors at tubewells and valves level Sep 2017-June 2019
Developing PC I of water supply schemes inother 50% of areas for improved availabilityfrom 6 hours to 8 hours daily
Allocation of resources
Execution of water supply schemes project oncomponent sharing basis i.e. Communityinvests in maintenance and internalcomponent, while Government invests forexternal component
Installation of water flow monitors at tubewells and valves level
April-June 2019
July-Aug 2019
Sep 2019-June 2022
Sep 2019-June 2022
Dysfunctional and non-functional schemesrehabilitated andmaintained (538 schemesfit for repair plus 200additional schemes)
Rehabilitate 260dysfunctional and non-functional water supplyschemes
Rehabilitate 278dysfunctional and non-functional water supplyschemes
Developing Proposal for rehabilitation of 260dysfunctional and non-functional water supplyschemes;
Mobilizing resources for rehabilitation of
April-June 2017
July-Aug 2017

424
StrategicObjectives/Outcomes
Short Term Actions1 - 3 years
Medium Term Actions4 - 6 years
Activities Time Frame
schemes
Rehabilitation of 260 dysfunctional and non-functional water supply schemes;
Sep 2017-June 2019
Developing proposal for rehabilitation of 278dysfunctional and non-functional water supplyschemes
Mobilizing resources for rehabilitation ofschemes
Rehabilitation of 278 dysfunctional and non-functional water supply schemes;
April-June 2019
July-Aug 2019
Sep 2019-June 2022
Ageing water supplyschemes infrastructurereplaced (50 schemes peryear)
Replace infrastructure ofageing water supplyschemes (more than 20years) – 150 schemes
Replace infrastructure ofageing water supplyschemes (more than 20years) – 150 schemes
Designing replacement of infrastructure ofageing water supply schemes (more than 20years) – 150 schemes
Resource mobilization for replacement ofinfrastructure
Replacing infrastructure of ageing watersupply schemes (more than 20 years) – 150schemes
April-June 2017
July-Aug 2017
Sep 2017-June 2019
Reviewing the performance of short termaction
Designing replacement of infrastructure ofageing water supply schemes (more than 20years) – other 150 schemes
Resource mobilization for replacement ofinfrastructure
April-June 2019
April-June 2019
July-Aug 2019

425
StrategicObjectives/Outcomes
Short Term Actions1 - 3 years
Medium Term Actions4 - 6 years
Activities Time Frame
Replacing infrastructure of ageing watersupply schemes (more than 20 years) – other150 schemes
Sep 2019-June 2022
Water supply schemes in119 towns upgraded
Storage capacity needs ofcities and townsdetermined
Upgrade water supplyschemes in 30 townsincluding extra overheadstorage capacity
Upgrade water supplyschemes in 40 townsincluding extra overheadstorage capacity
Storage capacity need assessment in all citiesand towns;
Developing PC I for upgrading water supplyschemes in 30 towns including extra overheadstorage capacity
Allocating resources for work execution
Upgrading water supply schemes in 30 townsincluding extra overhead storage capacity
Jan-March 2017
April-June 2017
July-Aug 2017
Sep 2017-June 2019
Reviewing the performance of short termaction
Developing PC I for upgrading water supplyschemes in other 40 towns including extraoverhead storage capacity
Allocating resources for work execution
Upgrading water supply schemes in other 40towns including extra overhead storagecapacity
April-June 2019
April-June 2019
July-Aug 2019
Sep 2019-June 2022Energy efficient watersupply schemes (600)
Map areas that havepersistent power shortage
Introduce solar energysupported water supplyschemes
At least 180 water supply
At least 180 water supplyschemes converted to solarenergy
Map areas that have persistent powershortage
Developing designs and proposal forinstallation of solar energy panels for watersupply schemes;
Converting 180 water supply schemes
Jan-March 2017
April-June 2017
June 2017-June 2019

426
StrategicObjectives/Outcomes
Short Term Actions1 - 3 years
Medium Term Actions4 - 6 years
Activities Time Frame
schemes converted to solarenergy
All new water supplyschemes are solar energycompliant where feasible
converted to solar energy in areas ofpersistent power shortage
Circulating guidelines for designing all newwater supply schemes, solar energy compliantwhere feasible;
Jan-March 2017
Reviewing the performance of short termaction
Developing designs and proposal forinstallation of solar energy panels for watersupply schemes;
Converting other 180 water supply schemesconverted to solar energy in areas ofpersistent power shortage
April-June 2019
April-June 2019
Sep 2019-June 2022
Community awarenessabout water use, safety,maintenance andpreservation enhanced inall districts through aneffective BCC strategy
Conduct communityawareness sessions,including women andchildren, and disseminatekey messages developedunder BCC strategy byusing billboards andleaflets in each districtevery year
Conduct communityawareness sessions,including women andchildren, and disseminatekey messages developedunder BCC strategy byusing billboards andleaflets in each districtevery year
District WASH Ranking
Selection of Low ranked districts forcommunity awareness programme
Developing PC I for community awarenessprogramme on WASH;
Developing material for communityawareness sessions, including women andchildren
Formulate key messages for communityawareness programme
Designing billboards, leaflets and other IECmaterial for community awareness
Jan-Feb 2017
March 2017
April-June 2017
July-Sep 2017
July-Sep 2017
Oct-Dec 2017
427
StrategicObjectives/Outcomes
Short Term Actions1 - 3 years
Medium Term Actions4 - 6 years
Activities Time Frame
Training of Trainers
Training of Social Mobilizers by MasterTrainers
Conducting community awareness sessions,including women and children, anddisseminate billboards, leaflets and other IECmaterial- in each district every year
Jan-March 2018
March-June 2018
July 2018-June 2019
Strengthen communitydevelopment activities ofPHE&RDD for socialmobilisation and O&M(2594 social mobilisers)
Recruit 2 social mobilisersper UC and orient in waterissues and maintenance
Maintain 2 socialmobilisers per UC andorient in water issues andmaintenance
Recruiting 2 social mobilisers per UC
Orientation of social mobilizers in water issuesand maintenance;
Managing 2 social mobilisers per UC andorient in water issues and maintenance;
Monitoring and reporting of social mobilisers
Jan-March 2018
April-June 2018
July 2018-June 2019
July 2018-June 2019

428
Water Quality
StrategicObjectives/Outcomes
Short Term Actions1 - 3 years
Medium Term Actions4 - 6 years
Activities Time Frame
Quarterly water qualitytesting at water source
PHE&RDD conductsmonthly water quality testsof town water supplies andfiltration plants, andquarterly testing of at least25% of tube wells (250)
PHE&RDD conductsmonthly water quality testsof town water supplies andfiltration plants, andquarterly testing of at least50% of tube wells (500)
Circulating guidelines for monthly waterquality tests of town water supplies andfiltration plants, and quarterly testing of tubewells to all district and sub-district offices ofPHE&RDD
Conducting monthly water quality tests oftown water supplies and filtration plants, andquarterly testing of by PHE&RDD
Central data management of water qualityand ensuring that quarterly testing of at least25% of tube wells (250) done regularly
Jan-March 2017
April 2017-Dec 2019
April 2017-Dec 2019
Conducting monthly water quality tests oftown water supplies and filtration plants, andquarterly testing of by PHE&RDD
Central data management of water qualityand ensuring that quarterly testing of at least50% of tube wells (500) done regularly
Jan 2020-Dec 2022
Jan 2020-Dec 2022
Quarterly quality testing ofdistribution network
At least 25% coverage ofdistribution system everyquarter (250 tube wells)
Annual monitoring ofwater quality in rivers andstreams in collaborationwith Irrigation department
At least 50% coverage ofdistribution system everyquarter (500 tube wells)
Annual monitoring ofwater quality in rivers andstreams in collaborationwith Irrigation department
Circulating guidelines for Quarterly watertesting of coverage of distribution system;
Quarterly water testing of 25% coverage ofdistribution system every quarter (250 tubewells);
Central database management and reporting
Annual monitoring of water quality in rivers
Jan-March 2017
April 2017-Dec 2019
April 2017-Dec 2019
2017, 2018, 2019
429
StrategicObjectives/Outcomes
Short Term Actions1 - 3 years
Medium Term Actions4 - 6 years
Activities Time Frame
and streams in collaboration with Irrigationdepartment;
Quarterly water testing of at least 50%coverage of distribution system everyquarter (500 tube wells);
Central database management and reporting
Annual monitoring of water quality in riversand streams in collaboration with Irrigationdepartment;
Jan 2020-Dec 2022
Jan 2020-Dec 2022
2017, 2018, 2019
District level water qualitytesting laboratoriesestablished (29 districts)
Establish water testinglaboratory facilities in 5districts
Establish water testinglaboratory facilities in 10districts
Developing PCI for establishment of watertesting laboratory facilities in 5 districts;
Resource mobilization
Recruitment of human resource andprocurement of tools/equipment
Establishment of water testing laboratory in5 districts
April-June 2017
July-Aug 2017
Sep 2017-April 2018
May-June 2018
Developing PCI for establishment of watertesting laboratory facilities in other 10districts;
Resource mobilization
Recruitment of human resource andprocurement of tools/equipment
April-June 2019
July-Aug 2019
Sep 2019-April 2020

430
StrategicObjectives/Outcomes
Short Term Actions1 - 3 years
Medium Term Actions4 - 6 years
Activities Time Frame
Establishment of water testing laboratory inother 10 districts May-June 2020
All ground and overheadreservoirs supplied withchlorination treatment
Conduct study todetermine the status ofground and overheadreservoirs in cities andtowns
Scheduled six monthlycleaning and maintenanceof all reservoirs
Installation of chlorinatorsin 30% of reservoirs (ortube wells where storagecapacity does not exist)and issue and orient usersin standard operatingprocedure and safety forchlorination
Scheduled six monthlycleaning and maintenanceof all reservoirs
Installation of chlorinatorsin 60% of reservoirs (ortube wells where storagecapacity does not exist)and issue and orient usersin standard operatingprocedure and safety forchlorination
Developing ToRs for study to determine thestatus of ground and overhead reservoirs incities and towns
Recruitment of Technical Experts;
Conducting study to determine the status ofground and overhead reservoirs in cities andtowns
Schedule six monthly cleaning andmaintenance of all reservoirs as peridentified needs in study;
Developing proposal for Installation ofchlorinators in 30% of reservoirs;
Installation of chlorinators in 30% ofreservoirs (or tube wells where storagecapacity does not exist) and issue and orientusers in standard operating procedure andsafety for chlorination
Jan-March 2017
April 2017
May-Sep 2017
Oct 2017 and onward
April-June 2017
July 2017-June 2019
Six monthly cleaning and maintenance of allreservoirs as per identified needs in study;
Developing PC I for Installation ofchlorinators in 60% of reservoirs;
Installation of chlorinators in 60% ofreservoirs (or tube wells where storagecapacity does not exist) and issue and orientusers in standard operating procedure and
Jan 2020 and onward
April-June 2019
July 2019-June 2021
431
StrategicObjectives/Outcomes
Short Term Actions1 - 3 years
Medium Term Actions4 - 6 years
Activities Time Frame
safety for chlorination
Community awarenessabout water quality(including adoption oftreatment of safe drinkingwater in the household)enhanced in all districtsthrough an effective BCCstrategy
Conduct communityawareness sessions,including women andchildren, and disseminatekey messages developedunder BCC strategy forwater quality by usingbillboards and leaflets ineach UC every year (1297)
Promote use of low costportable water qualitytesting and monitoring atvillage level
Conduct communityawareness sessions,including women andchildren, and disseminatekey messages developedunder BCC strategy forwater quality by usingbillboards and leaflets ineach UC every year (1297)
Promote use of low costportable water qualitytesting and monitoring atvillage level
District WASH Ranking
Selection of Low ranked districts forcommunity awareness programme
Developing PC I for community awarenessprogramme on WASH;
Developing material for communityawareness sessions, including women andchildren
Formulate key messages for communityawareness programme
Designing billboards, leaflets and other IECmaterial for community awareness
Training of Trainers
Training of Social Mobilizers by MasterTrainers
Conducting community awareness sessions,
Jan-Feb 2017
March 2017
April-June 2017
July-Sep 2017
July-Sep 2017
Oct-Dec 2017
Jan-March 2018
March-June 2018

432
StrategicObjectives/Outcomes
Short Term Actions1 - 3 years
Medium Term Actions4 - 6 years
Activities Time Frame
including women and children, anddisseminate billboards, leaflets and other IECmaterial- in each district every year
July 2018 and onward

433
Sanitation (Sewerage and Drainage)
StrategicObjectives/Outcomes
Short Term Actions1 - 3 years
Medium Term Actions4 - 6 years
Activities Time Frame
All cities, towns and UCshave surveys, strategiesand action plans forintegrated water supply,water safety, sewerage anddrainage, storm waterdrainage and solid wastemanagement
(common to water supply,sanitation and solid waste)
All cities have completedsurveys, GIS mapping andstrategies, and startimplementing action plansfor integrated watersupply, water safety,sewerage and drainage,storm water drainage andsolid waste management
Develop integrated watersupply, water safety,sanitation, storm waterdrainage and solid wastemanagement action plansfor all cities
At least 50% of UCs (500)have completed surveys,GIS mapping andstrategies, and startimplementing action plansfor integrated watersupply, water safety,sewerage and drainage,storm water drainage andsolid waste management
Develop integrated watersupply, water safety,sanitation, storm waterdrainage and solid wastemanagement action plansfor 500 UCs
Deployment of Technical Experts;
Development of software by TechnicalExperts;
Survey for GIS mapping;
Developing GIS maps for integrated watersupply, water safety, sewerage and drainage,storm water drainage and solid wastemanagement;
Developing action plans for 500 UC onintegrated water supply, water safety,sanitation, storm water drainage and solidwaste management based on city GIS maps
Jan-March 2017
April-June 2017
July2017-June 2018
July 2018- June 2019
July 2020-June 2021
Improved and safelymanaged sanitationservices coverageenhanced to reduce accessgap in urban areas andrural areas, especially inthose that are alsonutrition-sensitive
Develop an SOP for all newsanitation schemes tomeet criteria for 'safelymanaged’ which include:not shared with otherhouseholdsexcreta are safely disposedin situ or transported andtreated off-siteguidelines for integration
Plan and implement safelymanaged sanitationschemes to reduce accessgapBy 50% in medium termreduce proportion ofhouseholds connected toopen drains from 24% to20%
Developing SOP for all new sanitation schemesto meet criteria for 'safely managed’ whichinclude: not shared with other householdsexcreta are safely disposed in situ ortransported and treated off-site guidelines forintegration in interventions in nutrition-sensitive areas
Disseminating the SoPs to all district and sub-district offices
Jan-March 2017
April-May 2017

434
StrategicObjectives/Outcomes
Short Term Actions1 - 3 years
Medium Term Actions4 - 6 years
Activities Time Frame
in interventions innutrition-sensitive areas
Plan and implement safelymanaged sanitationschemes to reduce accessgapBy 20% in short termreduce proportion ofhouseholds connected toopen drains from 27% to24%
Execution of schemes oncost sharing basis i.e.Community invests inmaintenance and internalcomponent, whileGovernment invests forexternal component
Execution of schemes oncost sharing basis i.e.Community invests inmaintenance and internalcomponent, whileGovernment invests forexternal component
Developing PC I for safely managed sanitationschemes to reduce access gap by 50% reduceproportion of households connected to opendrains
Allocation of resources for safely managedsanitation schemes
Execution of sewerage schemes on componentsharing basis i.e. Community invests inmaintenance and internal component, whileGovernment invests for external component
April-June 2019
July-Aug 2019
Sep 2019-April 2020
Wastewater treatmentplants established in 119towns (12 per year)
Establish wastewatertreatment plants in 36towns
Establish wastewatertreatment plants in 36towns
Designing wastewater treatment plant in 12towns every year
Installation of wastewater treatment plant in12 towns every year
O&M of installed wastewater treatment plant
April-June 2017
July 2017-June 2022
Jan 2018-Dec 2022

435
StrategicObjectives/Outcomes
Short Term Actions1 - 3 years
Medium Term Actions4 - 6 years
Activities Time Frame
Water supply andsanitation schemes linkedwith wastewater treatment
At least 25% of newschemes have in-builtwastewater treatmentfacility
Incorporate wastewatertreatment options (likeoxidation ponds, wetlands,sewerage treatment units,community septic tanks) inrural sanitation schemes
At least 50% of newschemes have in-builtwastewater treatmentfacility
Incorporate wastewatertreatment options (likeoxidation ponds, wetlands,sewerage treatment units,community septic tanks) inrural sanitation schemes
Developing guidelines for new schemes havein-built wastewater treatment facility
Disseminating guidelines to all district and sub-district offices
Monitoring the execution of guidelines for newschemes and ensuring at least 25% of newschemes have in-built wastewater treatmentfacility
Introducing wastewater treatment options (likeoxidation ponds, wetlands, seweragetreatment units, community septic tanks) inrural sanitation schemes
Jan-March 2017
April-May 2017
June 2017 and onward
July 2017-June 2019
Monitoring the execution of guidelines for newschemes and ensuring at least 50% of newschemes have in-built wastewater treatmentfacility
Incorporating wastewater treatment options(like oxidation ponds, wetlands, seweragetreatment units, community septic tanks) inrural sanitation schemes
Jan 2020 and onward
July 2019-June 2022
436
StrategicObjectives/Outcomes
Short Term Actions1 - 3 years
Medium Term Actions4 - 6 years
Activities Time Frame
Monitor contaminationlevels of industrial effluent
LG&HTPD, PHE&RDD,Irrigation department,PCSIR and SindhEnvironment ProtectionAgency map majorindustrial wastewaterflows and conduct periodicwastewater testing andpublic reporting ofindustrial effluent quality
Environment protectionregulations enforced
Hazard and risk GISmapping of contaminatedrivers and water bodiesdone
Conduct periodicwastewater testing andpublic reporting ofindustrial effluent quality
Environment protectionregulations enforced
Devising a collaboration mechanism betweenLG&HTPD, PHE&RDD, Irrigation department,PCSIR and Sindh Environment ProtectionAgency for mapping major industrial effluentquality;
Mapping major industrial wastewater flows
Conducting periodic wastewater testing andpublic reporting of industrial effluent quality
Enforcement of Environment protectionregulations
Jan-March 2017
April-June 2017
Quarterly June 2017 andonward
July 2017 and onward
Hazard and risk GIS mapping of contaminatedrivers and water bodies done
Conducting periodic wastewater testing andpublic reporting of industrial effluent quality
Enforcement of Environment protectionregulations
Jan-Dec 2020
Quarterly
July 2017 and onward
Increased proportion oftreated industrialwastewater
Set up Combined EffluentTreatment Plant (CETP) forcluster of industries wherefeasible
Identify industries withhigh volume of untreatedeffluent and prioritise forenforcement of regulations
At least 5% of industrialwastewater treated
Feasibility study of installation of CombinedEffluent Treatment Plant (CETP) for cluster ofindustries
Installation of Combined Effluent TreatmentPlant (CETP) for cluster of industries at feasibleplaces
Identification of industries with high volume ofuntreated effluent and prioritise forenforcement of regulations
April-June 2017
July 2017-June 2019
June 2017 and onward

437
StrategicObjectives/Outcomes
Short Term Actions1 - 3 years
Medium Term Actions4 - 6 years
Activities Time Frame
Monitoring the enforcement of regulations andensuring at least 5% of industrial wastewatertreated
Jan 2017 and onward
Optimal sewage flowcapacity maintained
Sewage flows determinedfor all cities and towns, andsix monthly de-silting andcleaning of 30% drains andsewers with safe sludgedisposal in towns andzones in cities
Six monthly de-silting andcleaning of 60% drains andsewers with safe sludgedisposal in towns andzones in cities
Designing a study for determining sewage flowof all cities and towns
Data collection and identification of high flowtowns and zones in cities
Review of draft report and finalizing report
six monthly de-silting and cleaning of 30%drains and sewers with safe sludge disposal inidentified high flow towns and zones in cities,
April-June 2017
July-Sep 2017
Oct-Dec 2017
Jan 2018 and onward
Six monthly de-silting and cleaning of 60%drains and sewers with safe sludge disposal inidentified high flow towns and zones in cities
Jan 2020 and onward
Optimal status of sewermaintenance equipment(sucking machine, jettingmachine, sucking/jettingmachine)
Status of equipmentavailability andfunctionality determinedfor each town and cityzone
At least 30% of towns andcity zones equipped withsewer maintenanceequipment
At least 60% of towns andcity zones equipped withsewer maintenanceequipment
Development of questionnaire for mapping ofsewer equipment
Data collection for status of equipmentavailability and functionality determined foreach town and city zone
Identification of the needs of equipment
Allocation of resources for equipment support
Equipment support to at least 30% of townsand city zones for sewer maintenanceequipment
Jan 2017
Feb-April 2017
May-June 2017
July-Aug 2017
Sep 2017-June 2018

438
StrategicObjectives/Outcomes
Short Term Actions1 - 3 years
Medium Term Actions4 - 6 years
Activities Time Frame
Review the progress of short term action
Allocation of resources for equipment supportto 60% of towns and city zones
Equipment support to at least 60% of townsand city zones for sewer maintenanceequipment
April-May 2019
June-July 2019
Aug 2019-June 2020
Adequate and functionalcollector and branchsewers
Status of collector andbranch sewers in each cityand town determined
Phased replacement orlaying of new linesinstituted
Phased replacement of25% non-functionalcollector and branchsewers or laying of newlines instituted
Map out status of collector and branch sewersin each city and town
Developing guidelines for phased replacementor laying of new lines
Disseminating guidelines phased replacementor laying of new lines adopted as SoPs forsewer designs
Jan-June 2017
June-July 2017
Aug-Sep 2017
Developing proposal and designing of phasedreplacement of non-functional collector andbranch sewers
Resource allocation
Execution work for phased replacement of 25%non-functional collector and branch sewers orlaying of new lines
April-June 2018
July-Aug 2018
Sep 2018 and onward
Optimal functionality ofpumping stations
Status of pumping stationsin each city and towndetermined
Phased rehabilitation planinstituted for at least 30%dysfunctional pumpingstations
Phased rehabilitation planinstituted for at least 60%dysfunctional pumpingstations
Designing templates for information collectionon status of pumping stations in each city andtown
Data collection and analysis
Status report furnishing all necessary
Jan-March 2017
April-May 2017
June-Sep 2017

439
StrategicObjectives/Outcomes
Short Term Actions1 - 3 years
Medium Term Actions4 - 6 years
Activities Time Frame
information
Developing phased rehabilitation plan for atleast 30% dysfunctional pumping stations
Rehabilitation plan of at least 30%dysfunctional pumping stations
Sep 2017
July 2018-June 2019
Developing phased rehabilitation plan of other60% dysfunctional pumping stations
Rehabilitation plan of other 60% dysfunctionalpumping stations
April-June 2019
July 2019-June 2021
Systematic management ofOperation andMaintenance of sewerageand drainage systems
Develop O&M manual forsewerage and drainageincluding sewer desiltingsafety measures
Train LG&HTPD andPHE&RDD staff in use ofO&M manual
Refresher training toLG&HTPD and PHE&RDDstaff on use of O&Mmanual
Identification of key challenges in O&M ofsewerage and drainage
Developing O&M manual for sewerage anddrainage including sewer desilting safetymeasures addressing the identified challenges
Pre-testing the manual in field
Training of LG&HTPD and PHE&RDD staff in useof O&M manual
July-Aug 2017
Sep-Dec 2017
Jan-Feb 2018
March-June 2018
Refresher training to LG&HTPD and PHE&RDDstaff on use of O&M manual
Jan-March 2020
Community awareness andsocial mobilisationregarding sanitation,nutrition and hygieneenhanced in all UCsthrough effectiveimplementation of BCCstrategy
Conduct communityawareness sessions,including women andchildren, and disseminatekey messages developedunder BCC strategy byusing billboards andleaflets in each UC everyyear (1297 UCs)
Conduct communityawareness sessions,including women andchildren, and disseminatekey messages developedunder BCC strategy byusing billboards andleaflets in each UC everyyear (1297 UCs)
District WASH Ranking
Selection of Low ranked districts forcommunity awareness programme
Developing PC I for community awarenessprogramme on WASH;
Developing material for community
Jan-Feb 2017
March 2017
April-June 2017
July-Sep 2017

440
StrategicObjectives/Outcomes
Short Term Actions1 - 3 years
Medium Term Actions4 - 6 years
Activities Time Frame
awareness sessions, including women andchildren
Formulate key messages for communityawareness programme
Designing billboards, leaflets and other IECmaterial for community awareness
Training of Trainers
Training of Community Resource Persons byMaster Trainers
Conducting community awareness sessions,including women and children, anddisseminate billboards, leaflets and other IECmaterial- in each district every year
July-Sep 2017
Oct-Dec 2017
Jan-March 2018
March-June 2018
July 2018 and onward
2 Community ResourcePersons (preferably onemale and one female)deployed for BCC for eachUC (2594 CommunityResource Persons)
Deploy and orient 2594Community ResourcePersons in 1297 UCs
Maintain 2594 CommunityResource Persons in 1297UCs
Training of 2594 Community Resource Personsin 1297 UCs on sanitation
Conducting community awareness session onsanitation by Resource Persons
Monitoring and supervision of ResourcePersons
March-June 2018
July 2018 and onward
July 2018 and onward
Safe sanitation practicespromoted in high opendefecation zones,nutrition-sensitive andpolio priority areas
Develop provincial anddistrict level road maps onPATS/ODF for identifiedvillages in 13 prioritydistricts
Incentivising the ODFvillages by laying of water
Incentivising the ODFvillages by laying of watersupply scheme, seweragesystem, waste watertreatment, etc
Execution of schemes oncost sharing basis i.e.
Circulating the notification for developing roadmaps on PATS/ODF for identified villages in 13priority districts
Development of provincial and district levelroad maps on PATS/ODF for identified villagesin 13 priority districts
Jan-Feb 2017
March-June 2017

441
StrategicObjectives/Outcomes
Short Term Actions1 - 3 years
Medium Term Actions4 - 6 years
Activities Time Frame
supply scheme, seweragesystem, waste watertreatment, etc
Execution of schemes oncost sharing basis i.e.Community invests ininternal component, whileGovernment invests forexternal component
Collaborate withinternational partners andNGOs for integrating WASHcomponent ininterventions in nutrition-sensitive areas
Community invests ininternal component, whileGovernment invests forexternal component
Collaborate withinternational partners andNGOs for integrating WASHcomponent ininterventions in nutrition-sensitive area
Incentivising the ODF villages by laying of watersupply scheme, sewerage system, waste watertreatment, etc
July 2018 and onward
Incentivising the ODF villages by laying of watersupply scheme, sewerage system, waste watertreatment, etc
Execution of schemes on cost sharing basis i.e.Community invests in internal component,while Government invests for externalcomponent
Collaborate with international partners andNGOs for integrating WASH component ininterventions in nutrition-sensitive areas
Jan 2020 and onward
Jan 2020 and onward

442
Solid Waste
StrategicObjectives/Outcomes
Short Term Actions1 - 3 years
Medium Term Actions4 - 6 years
Activities Time Frame
All cities, towns and UCshave surveys, strategiesand action plans forintegrated water supply,water safety, sewerage anddrainage, storm waterdrainage and solid wastemanagement
(common to water supply,sanitation and solid waste)
All cities have completedsurveys, GIS mapping andstrategies, and startimplementing action plansfor integrated watersupply, water safety,sewerage and drainage,storm water drainage andsolid waste management
Develop integrated watersupply, water safety,sanitation, storm waterdrainage and solid wastemanagement action plansfor all cities
Conduct wastecharacterisation studies(including hospital waste)for mega cities
At least 50% of UCs (500)have completed surveys,GIS mapping andstrategies, and startimplementing action plansfor integrated watersupply, water safety,sewerage and drainage,storm water drainage andsolid waste management
Develop integrated watersupply, water safety,sanitation, storm waterdrainage and solid wastemanagement action plansfor 500 UCs
Conduct wastecharacterisation studies(including hospital waste)for intermediate cities
Deployment of Technical Experts;
Development of software by Technical Experts;
Survey for GIS mapping;
Developing GIS maps for integrated watersupply, water safety, sewerage and drainage,storm water drainage and solid wastemanagement;
Developing action plans for 500 UC onintegrated water supply, water safety,sanitation, storm water drainage and solidwaste management based on city GIS maps
Jan-March 2017
April-June 2017
July2017-June 2018
July 2018- June 2019
July 2020-June 2021Conduct waste characterisation studies(including hospital waste) for mega cities
July 2017-June 2018
Integrated solid wastemanagement implementedin 29 districts (5 in shortterm, 10 in medium term,and 13 in long term)
Develop integrated solidwaste management in 5districts (Karachi,Hyderabad, ShaheedBenazirabad and Larkana)
Develop integrated solidwaste management in 10districts
Feasibility study for developing integrated solidwaste management in 5 districts (Karachi,Hyderabad, Shaheed Benazirabad and Larkana)
Developing PC I for integrated solid wastemanagement in 5 districts (Karachi, Hyderabad,Shaheed Benazirabad and Larkana)
Jan-May 2017
June 2017

443
StrategicObjectives/Outcomes
Short Term Actions1 - 3 years
Medium Term Actions4 - 6 years
Activities Time Frame
Execution of integrated solid wastemanagement in 5 districts (Karachi, Hyderabad,Shaheed Benazirabad and Larkana)
July 2017-June 2019
Feasibility study for developing integrated solidwaste management in 10 districts
Developing PC I for integrated solid wastemanagement in 10 districts
Execution of integrated solid wastemanagement in 10 districts
Jan-May 2020
June 2020
July 2020-June 2022
Town and UC level profilesdeveloped for wastewaterand solid waste in 119towns and 1297 UCs
Conduct a study onwastewater and solidwaste in 119 towns todevelop townlevel profiles (includinginfrastructure, equipmentand staffing)
Conduct a study onwastewater and solidwaste in 1297 UCs todevelop UC level profiles(including infrastructure,equipment and staffing)
Periodic updating of townand UC level profiles
Developing study guidelines
Identification of experts
Signing of contacts
Field research by experts
Draft report on wastewater and solid waste in119 towns to develop town level profiles(including infrastructure, equipment andstaffing)
Review of report
Final report with incorporating remarks ofreview
Jan 2017
Feb 2017
March 2017
April-Dec 2017
Jan-March 2018
April-May 2018
June 2018
444
StrategicObjectives/Outcomes
Short Term Actions1 - 3 years
Medium Term Actions4 - 6 years
Activities Time Frame
Replicating the study in 1297 UCs to developUC level profiles (including infrastructure,equipment and staffing)
Annual updates in town and UC level profiles
Jan 2020-June 2021
July 2018 and onward
Solid waste collection anddisposal
At least 70% of solid wastegenerated is collected anddisposed of per day
At least 30 town councilsproviding door to doorcollection service
Village based solid wastemanagement piloted inselected villages
At least 80% of solid wastegenerated is collected anddisposed of per day
At least 60 town councilsproviding door to doorcollection service
Village based solid wastemanagement scaled up to10% villages in Sindh
Information collection for current status ofsolid waste collection and disposal
Planning the resources to achieve, at least 70%of solid waste generated is collected anddisposed of per day and at least 30 towncouncils providing door to door collectionservice
Designing models for solid waste managementat village level
Piloting the model in selected villages
Jan-March 2017
April-May 2017
June-July 2017
Aug 2017-June 2019
Review the progress of short term actions
Extending the solid waste managementservices to 80% generated waste is collectedand disposed of per day and at least 60 towncouncils providing door to door collectionservice
Extending village base solid waste managementservices up to 10% villages in Sindh
April-June 2019
July 2019-June 2022
July 2019-June 2022
Effective solid wastemanagement
Develop a minimumstandards list of staffing,hardware and equipmentfor solid wastemanagement and upgrade
Upgrade the hardware andequipment for solid wastemanagement in 30 towncouncils (10 per year)
Develop a minimum standards list of staffing,hardware and equipment for solid wastemanagement
Jan-March 2017
April-May 2017

445
StrategicObjectives/Outcomes
Short Term Actions1 - 3 years
Medium Term Actions4 - 6 years
Activities Time Frame
in 30 town councils (10 peryear)
Reviewing the existing resources of 30 towncouncils (10 per year) against minimumstandard list and identification of gaps
Planning human, hardware and equipmentresource to fill the gaps
Upgrading the resources in 30 town councils(10 per year)
Jun-July 2017
Aug 2017 –June 2019
Replicating the exercise for other 30 towncouncils (10 per year) and upgrading theresources
July 2019-June 2021
Efficient Solid wastedisposal and recycling
At least 30% town councilshave established transferstations to reduce disposaltime
Recycle at least 10% ofsolid waste by systematicseparation
Sanitary landfill optionsidentified for towns wherefeasible
At least 60% town councilshave established transferstations to reduce disposaltime
Recycle at least 15% ofsolid waste by systematicseparation
At least 20 towns served bysanitary landfill sites
Mapping the status of transfer station in towncouncils
Designing transfer stations to reduce disposaltime
Mobilizing resources
Execution work for establishing transferstations in at least 30% town councils
Reviewing the progress and lesson learnt ofshort term action
Extending the transfer stations to 60% towncouncils
Jan-April 2017
May-June 2017
July-Aug 2017
Sep 2017-June 2019
April-June 2019
July 2019-June 2021
Research on options systematic separation ofsolid waste
Identification of feasible options for systematic
Jan-March 2017
April-June 2017

446
StrategicObjectives/Outcomes
Short Term Actions1 - 3 years
Medium Term Actions4 - 6 years
Activities Time Frame
separation of solid waste
Introducing recycling of solid waste bysystematic separation for at least 10% solidwaste
Examining the achievement of short termaction
Extending the recycling of solid waste bysystematic separation for at least 15% solidwaste
July 2017-June 2019
April-June 2019
July 2019-June 2021
Designing feasibility study for identifyinglandfill options for towns
Deploying human resource for study
Feasibility study report finalized
Allocating resources for establishing land fillsites at feasible places in 20 towns
Establishment of land fill sites at feasible placesin 20 towns
Jan-March 2017
April-June 2017
July-Sep 2017
June 2018
July 2018-June 2020
Waste to Energy Formalise contracts withcompanies for waste toenergy options
At least each mega city hasa WTE option in place
Estimating solid waste supplies in mega cities
Designing terms of contract for contractors ofWTE
Tender publication
Jan-June 2017
July-Sep 2017
Oct 2017
Nov-Dec 2017

447
StrategicObjectives/Outcomes
Short Term Actions1 - 3 years
Medium Term Actions4 - 6 years
Activities Time Frame
Selection of contractors
Developing WTE option in each of mega citiesby contractors
Monitoring and regulation of contractors
Jan-Dec 2018
Jan 2018 to onward
Safe hospital high riskwaste disposal
Health departmentestablishes hospital wastemanagement committeesin each hospital in line withthe Environmental andMedical WasteManagement Guidelines
Health department incollaboration withLG&HTPD orients eachhospital wastemanagement committeeon Environmental andMedical WasteManagement Guidelines,municipal solid waste andhigh risk waste and theirseparate disposal
Each mega city andintermediate city has a
Each town has acentralised and functionalhigh risk hospital wastedisposal facility
At least 60% of hospitalhigh risk waste disposed ofsafely
Circulating letter to health department byLG&HTPD for formalizing hospital wastemanagement committees in each hospital
Facilitating the process of formalizing hospitalwaste management committees in eachhospital in line with the Environmental andMedical Waste Management Guidelines
Orientation of hospital waste managementcommittees on Environmental and MedicalWaste Management Guidelines, municipal solidwaste and high risk waste and their separatedisposal
Functioning of hospital waste managementcommittees for safe disposal of hospital waste
Ensuring the centralised and functional highrisk hospital waste disposal facility serving forat least 50% of hospital waste disposal in eachmega city and intermediate city
Jan-March 2017
April-July 2017
Aug-Sep 2017
Oct 2017 and onward
Nov 2017 to onward

448
StrategicObjectives/Outcomes
Short Term Actions1 - 3 years
Medium Term Actions4 - 6 years
Activities Time Frame
centralised and functionalhigh risk hospital wastedisposal facility
At least 50% of hospitalhigh risk waste disposed ofsafely
Reviewing the progress of short term action
Extending the high risk hospital waste disposalfacility to town level with at least 60% ofhospital waste safely disposal
Jan-March 2020
April 2020 and onward
Safe and hygienicSlaughterhouses
Update status of allslaughterhouses(recognised andunrecognised) in eachdistrict and prioritise thosefor rehabilitation, solidwaste and wastewatermanagement
Develop slaughterhousesafety and hygiene practiceguidelines and orient 100%slaughterhouse staff inrecognisedslaughterhouses in safehandling and disposal ofcarcass, entrails, hides, andwastewater
At least 30% of municipalservices dispose ofslaughterhouse solid wastesafely
Provide refresher trainingon slaughterhouse safetyand hygiene practiceguidelines to 100%slaughterhouse staff inrecognisedslaughterhouses in safehandling and disposal ofcarcass, entrails, hides, andwastewater
At least 60% of municipalservices dispose ofslaughterhouse solid wastesafely
Develop questionnaire for profiling ofslaughterhouses
Circulating questionnaire to districtgovernments for collecting profiles of eachslaughterhouse (recognised and unrecognised)
Developing central database ofslaughterhouses (recognised andunrecognised)
Data Analysis for identifying the need ofrehabilitation, solid waste and wastewatermanagement
Designing rehabilitation, solid waste andwastewater management of prioritizedslaughterhouses during data analysis
Execution of rehabilitation, solid waste andwastewater management work
Developing slaughterhouse safety and hygienepractice guidelines
Deployment of human resource for orientation
Jan-Feb 2017
March-June 2017
July-Aug 2017
Sep-Oct 2017
Nov-Dec 2017
Jan-Dec 2018
Nov-Dec 2017
Jan-March 2018

449
StrategicObjectives/Outcomes
Short Term Actions1 - 3 years
Medium Term Actions4 - 6 years
Activities Time Frame
of slaughterhouses’ staff
Orientation of slaughterhouses’ staffslaughterhouse staff in recognisedslaughterhouses in safe handling and disposalof carcass, entrails, hides, and wastewater
Reviewing the mechanism of slaughterhousemonitoring and ensuring at least 30% ofmunicipal services dispose of slaughterhousesolid waste safely
April-June 2018
July 2018 to Dec 2019
Refresher training of slaughterhouses’ staffslaughterhouse staff in recognisedslaughterhouses in safe handling and disposalof carcass, entrails, hides, and wastewater
Extending the disposal of slaughterhouse solidwaste safely to 60%
Jan-April 2019
July 2019-Dec 2022
Efficient and effectivemanagement of IndustrialSolid Waste
Determine the currentstatus of industrial solidwaste production anddisposal
Develop strategies andactions for efficient andeffective management ofindustrial solid waste
Identification of various sources of informationon industrial solid waste production anddisposal
Information collection and data analysis
Recognizing the key issues in industrial solidwaste production and disposal
Stakeholder consultation on key issues
Drafting strategies and actions for efficient andeffective management of industrial solid waste
Implementation of strategies and actions for
Jan-March 2017
April-June 2017
July-Aug 2017
Sep-Dec 2017
Jan-June 2018
July 2018 to onward

450
StrategicObjectives/Outcomes
Short Term Actions1 - 3 years
Medium Term Actions4 - 6 years
Activities Time Frame
efficient and effective management ofindustrial solid waste
Monitoring progress on strategies and actionsJune 2018 to onward

451
Health, Hygiene and Nutrition
StrategicObjectives/Outcomes
Short Term Actions1 - 3 years
Medium Term Actions4 - 6 years
Activities Time Frame
Fully functional water andsanitation services inhealth facilities DHQs,THQs/CHs, RHCs, CDs,MCHs at communal andfacility level
For Basic Health Units withmissing facilities for waterand sanitation (about 20%of BHUs), provideextension of waterdistribution pipe fromwater supply scheme,water tank and 2 latrinesper BHU
Health Department andPHE&RDD to jointlyconduct a situation analysisand update the status ofmissing facilities for waterand sanitation in all healthfacilities and develop aJoint Action Plan (JAP) toaddress these
Provision of missing WASHfacilities (latrines, handwashing spots, filter tap fordrinking water purposes,supply of soap and watertreatment technology athealth facility) in targetedhealth facilities based onJoint Action Plan (JAP)
Provide water distributionpoint to local health facilityin all new water supplyschemes
Provide water distributionpoint to local health facilityin all new water supplyschemes
Provision of missing WASHfacilities (latrines, handwashing spots, filter tap fordrinking water purposes,supply of soap and watertreatment technology athealth facility) in targetedhealth facilities based onJoint Action Plan (JAP)
Devising mechanism for collaboration of HealthDepartment and PHE&RDD
Designing study situation analysis study missingfacilities for water and sanitation in healthfacilities
Deployment and training of data collectionteam
Data collection from all health facilitiesincluding DHQs, THQs/CHs, RHCs, CDs, MCHs
Data analysis and report writing
Develop Joint Action Plan (JAP) to addressidentified gaps in missing facilities for waterand sanitation at health facilities
Mobilizing resources for implementation of JAP
Provision of missing WASH facilities (latrines,hand washing spots, filter tap for drinkingwater purposes, supply of soap and watertreatment technology at health facility) intargeted health facilities based on Joint ActionPlan (JAP)
Formulating guidelines by PHE&RDD forprovision of water distribution point to local
Jan-March 2017
April-June 2017
July-Aug 2017
Sep-Dec 2017
Jan-Feb 2018
March-April 2018
May-June 2018
July 2018-June 2019
May-June 2018

452
StrategicObjectives/Outcomes
Short Term Actions1 - 3 years
Medium Term Actions4 - 6 years
Activities Time Frame
health facility in all new water supply schemes
Circulating guidelines to all district and sub-district offices
July 2018
Hospital WasteManagement Rulesimplemented in 88hospitals as initial priority.
Implement Hospital WasteManagement Rules in 27hospitals
Implement Hospital WasteManagement Rules in 27hospitals
Reviewing the status of Hospital WasteManagement
Identifying the gaps in Hospital WasteManagement
Provision of necessary resources for HospitalWaste Management
Enforcing Hospital Waste Management Rules in27 hospitals
Formulating a monitoring team for HospitalWaste Management
Quarterly review of the progress andtroubleshooting
April-May 2017
June 2017
July 2017-June 2018
July 2018 to onward
July 2018
Sep 2018 and onward
Replicating the model in other 27 hospitals
Plan for phased implementation of HospitalWaste Management Rules in all health facilities
Jan 2020-Dec 2022
Multi-sector nutrition-sensitive WASHprogramme implementedin nutritionally deficientdistricts
Multi-sector nutrition-sensitive WASHprogramme implementedin 3 nutritionally deficientdistricts
Multi-sector nutrition-sensitive WASHprogramme implementedin 10 nutritionally deficientdistricts
Analysing the available datasets i.e. PDHS,PSLM, MICS and DHIS etc. for identifying theneeds of multi-sector nutrition-sensitive WASHprogramme
Designing the programme for multi-sectornutrition-sensitive WASH
Jan-March 2017
April-June 2017

453
StrategicObjectives/Outcomes
Short Term Actions1 - 3 years
Medium Term Actions4 - 6 years
Activities Time Frame
Allocating resources for programme
Establishing PMU for programmeimplementation in 3 priority districts
Programme Implementation
Programme Review
July-Aug 2017
Sep-Dec 2017
Jan 2018 to Dec 2019
Dec 2019
Replicating the programme to other 10 districts Jan 2020- Dec 2022
Nutrition-sensitive WASHintegrated in healthpromotion in primaryhealth care
Nutrition-sensitive WASHhealth education moduleadded to curriculum ofLHWs/CMWs/LHVs withsupporting trainingmaterial as part of multi-sector nutrition-sensitiveWASH interventions
Master trainers, districttrainers and facility trainersoriented in key nutrition-sensitive WASH messagesand LHWs/CMWs/LHVsprovided training onnutrition-sensitive WASHhealth promotion andhygiene as part of on-goingtraining by healthdepartment
At least 100% of
At least 60% ofLHWs/CMWs/LHVs receiverefresher training innutrition-sensitive WASHhealth promotion andhygiene as part of on-goingtraining by healthdepartment
Review of current curriculum ofLHWs/CMWs/LHVs
Identification of needs of adding educationmaterial on Nutrition-sensitive WASH
Engaging experts to develop Nutrition-sensitiveWASH educational material
Material Development by experts
Integrating the developed material incurriculum of LHWs/CMWs/LHVs
Trainings of master trainers, district trainersand facility trainers on key nutrition-sensitiveWASH messages
Training of LHWs/CMWs/LHVs on nutrition-sensitive WASH by master trainers, districttrainers and facility trainers
Jan-March 2017
April 2017
March-April 2017
May-Sep 2017
Oct-Dec 2017
Jan-June 2018
July-Dec 2018

454
StrategicObjectives/Outcomes
Short Term Actions1 - 3 years
Medium Term Actions4 - 6 years
Activities Time Frame
LHWs/CMWs/LHVs trainedin nutrition-sensitive WASHhealth promotion andhygiene as part of on-goingtraining by healthdepartment
Refresher Training of LHWs/CMWs/LHVs onnutrition-sensitive WASH
Jan-June 2020
Nutrition-sensitive WASHintegrated in healthadvocacy and BCCcampaigns and healthweeks
Nutrition-sensitive WASHcomponent of healthpromotion and hygieneintegrated in mother andchild health weeks as partof on-going campaign byhealth department
Advocacy and BCCcampaign held at healthfacility, district andprovincial levels as part ofon-going health campaigns
Key messages to advertisedin electronic and printmedia as part of on-goinghealth campaigns
Nutrition-sensitive WASHcomponent of healthpromotion and hygienedisseminated in motherand child health weeks aspart of on-going campaignby health department
Advocacy and BCCcampaign held at healthfacility, district andprovincial levels as part ofon-going health campaigns
Key messages to advertisedin electronic and printmedia as part of on-goinghealth campaigns
Integration of Nutrition-sensitive WASHcomponent of health promotion and hygiene inmother and child health weeks as part of on-going campaign by health department
Developing key messages for advocacy and BCCcampaign of Nutrition-sensitive WASHcomponent
Advertised key messages in electronic and printmedia as part of on-going health campaigns
Oct-Dec 2017
Jan-March 2017
April 2018 to onward
455
StrategicObjectives/Outcomes
Short Term Actions1 - 3 years
Medium Term Actions4 - 6 years
Activities Time Frame
IEC materials with keynutrition-sensitive hygienemessages distributed athealth facility level
Development of nutrition-sensitive IEC materials forprimary, secondary andtertiary health facilities
Availability at anddissemination of IECmaterials for 50% primary,secondary and tertiaryhealth facilities
Availability at anddissemination of nutrition-sensitive IEC materials for100% primary, secondaryand tertiary health facilities
Identification of experts
Designing of IEC material on nutrition-sensitiveWASH by experts
Printing of IEC Material
Dissemination of IEC material to 50% primary,secondary and tertiary health facilities
April 2017
Oct-Dec 2017
Jan-March 2018
April 2018 to onward
Reviewing the response of IEC material (changeassessment)
Identifying necessary changes in IEC Material
Printing and dissemination of IEC material in100% primary, secondary and tertiary healthfacilities
Jan-March 2020
April-June 2020
July 2020 to onward
WASH services at healthfacilities monitoredregularly by HealthDepartment
Regular monitoring andsupervision conducted byhealth facility in-charges,DHOs and respectivestakeholders
Regular monitoring andsupervision conducted byhealth facility in-charges,DHOs and respectivestakeholders
Designing questionnaire for WASH servicesmonitoring at health facilities
Disseminating the questionnaire to all healthfacility in-charges, DHOs and respectivestakeholders
Six monthly reporting by health facility in-charges, DHOs and respective stakeholders onWASH services in health facilities
Managing database on WASH services in healthfacilities
Jan-March 2017
April-May 2017
June 2017 to onward
July 2017 to onward
456
Education
StrategicObjectives/Outcomes
Short Term Actions1 - 3 years
Medium Term Actions4 - 6 years
Activities Time Frame
Nutrition-sensitive WASHintegrated in teachertraining programme
Collaborate with SindhTeacher EducationDevelopment Authority,Board of Curriculum &Extension Wing, ProvincialInstitute of TeacherEducation, Sindh TextbookBoard and incorporatenutrition-sensitive WASHhygiene promotion in pre-service and in-serviceteacher trainingprogramme and CPDtraining of teachereducators
Nutrition-sensitive WASHhygiene promotioncascaded through TeacherEducators as part of on-going educationprogramme
Nutrition-sensitive WASHhygiene promotioncascaded through TeacherEducators as part of on-going educationprogramme
Reviewing the current training material ofteachers
Diagnosing the need of incorporatingnutrition-sensitive WASH hygiene promotionmaterial in pre-service and in-service teachertraining programme and CPD training ofteacher educators
Developing nutrition-sensitive WASH hygienepromotion material by experts
Collaborating with Sindh Teacher EducationDevelopment Authority, Board of Curriculum &Extension Wing, Provincial Institute of TeacherEducation, Sindh Textbook Board andincorporate nutrition-sensitive WASH hygienepromotion in pre-service and in-service teachertraining programme and CPD training ofteacher educators
Designing cascade trainings of teachersthrough Teacher Educators as part of on-goingeducation programme on Nutrition-sensitiveWASH hygiene promotion
Conducting trainings of teachers throughTeacher Educators as part of on-going
March-April 2017
May-July 2017
Aug-Oct 2017
Nov-Dec 2017
Jan-March 2018
April-Aug 2018

457
StrategicObjectives/Outcomes
Short Term Actions1 - 3 years
Medium Term Actions4 - 6 years
Activities Time Frame
education programme on Nutrition-sensitiveWASH hygiene promotion
Monitoring the performance of trainingsApril-Aug 2018
Nutrition-sensitive WASHintegrated in schoolscurriculum
Collaborate with SindhTeacher EducationDevelopment Authority,Board of Curriculum &Extension Wing, ProvincialInstitute of TeacherEducation, Sindh TextbookBoard for inclusion oftopics on nutrition-sensitive water, sanitationand hygiene in curriculumfor classes 1 to 12
Reviewing the current curriculum for classes 1-12
Diagnosing the need of incorporatingnutrition-sensitive WASH hygiene promotionmaterial in curriculum
Developing nutrition-sensitive WASH hygienepromotion material by experts
Collaborate with Sindh Teacher EducationDevelopment Authority, Board of Curriculum &Extension Wing, Provincial Institute of TeacherEducation, Sindh Textbook Board for inclusionof topics on nutrition-sensitive water,sanitation and hygiene in curriculum for classes1 to 12
Jan-March 2017
April-June 2017
July-Dec 2017
Jan-June 2018
Menstrual hygienemanagement integrated inhealth and hygiene for girls
Nutrition-sensitive WASHhygiene promotion moduleincorporates menstrualhygiene management forgirls
Impart menstrual hygienemanagement education innutrition-sensitive WASHhygiene promotion to atleast 25% of girls middleand high schools as part ofon-going school health
Impart menstrual hygienemanagement education innutrition-sensitive WASHhygiene promotion to atleast 50% of girls middleand high schools as part ofon-going school healtheducation
Assessing the needs of school girls in menstrualhygiene education
Developing material for menstrual hygienemanagement
Incorporating menstrual hygiene managementin Nutrition-sensitive WASH hygiene promotionmodule
Impart sessions on menstrual hygienemanagement to 25% of girls in middle and high
April-May 2017
June-Sep 2017
Oct-Dec 2017
Jan-Dec 2018

458
StrategicObjectives/Outcomes
Short Term Actions1 - 3 years
Medium Term Actions4 - 6 years
Activities Time Frame
education schools
Reviewing the results of menstrual hygienemanagement sessions
Make necessary change in approach (ifhighlighted in review)
Impart sessions on menstrual hygienemanagement to 50% of girls in middle and highschools
Jan-May 2019
June-Aug 2019
Sep 2019-May 2020
100% of schools withmissing facilities havesafely managed drinkingwater and latrines (30% inshort term, 30% in mediumterm, 40% in long term)(extension of waterdistribution pipe fromwater supply scheme,water tank and 2 latrinesper school)
More than 30% of schoolswith missing facilities havesafely managed drinkingwater and latrines andinclude proper design ofwastewater in schools
More than 60% of schoolswith missing facilities havesafely managed drinkingwater and latrines andinclude proper design ofwastewater in schools
Develop policy guidelines for operationalmaintenance of WASH infrastructure in schools
Developing tools for information collection ofschools with missing facilities of safelymanaged drinking water and latrines andproper design of wastewater in schools
Data collection and analysis
Developing proposal for provision of missingfacilities in 30% schools
Mobilizing resources
Execution of construction work for missingfacilities have safely managed drinking waterand latrines and include proper design ofwastewater in 30% of schools
Jan-Feb 2017
March-May 2017
March-May 2017
June 2017
July 2017
Aug 2017-June 2019

459
StrategicObjectives/Outcomes
Short Term Actions1 - 3 years
Medium Term Actions4 - 6 years
Activities Time Frame
Examining the performance of short termaction
Provision of missing facilities have safelymanaged drinking water and latrines andinclude proper design of wastewater in other30% of schools
July 2019
Aug 2019-June 2021

460
Sector Efficiency and Capacity
StrategicObjectives/Outcomes
Short Term Actions1 - 3 years
Medium Term Actions4 - 6 years
Activities Time Frame
Reduced systems leakagesof Non Revenue Water andUnaccounted for Water
Map out points of systemleakages area by area andtake remedial measures forDistribution NetworkImprovements (DNI)
Reduce NRW and UAW to20% or less
Outsource at least 25% ofrevenue collection
Reduce NRW and UAW to20% or less
Developing guidelines for map out points ofsystem leakages
Mapping of points of system leakages area byarea
Taking remedial measures for DistributionNetwork Improvements (DNI)
Consultation with WASAs/TMAs to identify keyissues in Non-Revenue Water (NRW) andUnaccounted for Water (UAW)
Devising mechanism to reduce NRW and UAW
Execution of devised mechanism to reduceNRW and UAW to 20% or less
Developing guidelines for out sourcing revenuecollection
Publishing tender notice for outsourcingrevenue collection
Awarding contracts to companies for at least25% of revenue collection
Regulating the contractors
Jan-Feb 2017
April-June 2017
July 2017-June 2018
July-Sep 2017
Oct-Dec 2017
Jan 2017 to onward
Jan-March 2018
April 2018
May-June 2018
July 2018 to onward

461
StrategicObjectives/Outcomes
Short Term Actions1 - 3 years
Medium Term Actions4 - 6 years
Activities Time Frame
Increased household watermetering
Introduce water meteringin phases
All new connections to bemetered
At least 100% of highincome areas havemetering in place
All commercial andbusiness premises havewater metering
At least 10% of mediumincome areas havemetering in place
Developing proposal for metering in highincome and commercial areas
Installation of meters in all high incomeresidential areas, all commercial and businesspremises
Regular billing to metered premises
Circulating letters to all WASAs/TMAs for meterinstallation in all new connections
June 2017
July 2017-June 2018
July 2017 to onward
June 2017
Installation of meters in 10% of mediumincome areas
Regular billing to metered premises
July 2020-June 2021
July 2020 to onward
Efficient Billing andCollection
Collection period reducedto less than 30 days
Billing efficiency increasedto 50%
Financial collectionefficiency increased to 50%
Outsource billing andcollection
Collection period reducedto less than 15 days
Billing efficiency increasedto 75%
Financial collectionefficiency increased to 75%
Reducing bill collection period to less than 30days
Taking essential measures to increase billingand financial collection efficiency by 50%
July 2017
July 2017 to Dec 2019
Review the performance of short term actions
Reducing bill collection period to less than 15days
Taking essential measures to increase billingand financial collection efficiency by 75%
Jan-March 2020
April 2020
April 2020 to onward

462
StrategicObjectives/Outcomes
Short Term Actions1 - 3 years
Medium Term Actions4 - 6 years
Activities Time Frame
A functional Biometrictracking system in all citiesand towns
All mega cities have aninstalled and functionalbiometric tracking systemfor staff,equipment/vehicles
At least 50% ofintermediate cities have aninstalled and functionalbiometric tracking systemfor staff,equipment/vehicles
At least 30% of towns havean installed and functionalbiometric tracking systemfor staff,equipment/vehicles
At least 75% ofintermediate cities have aninstalled and functionalbiometric tracking systemfor staff,equipment/vehicles
At least 60% of towns havean installed and functionalbiometric tracking systemfor staff,equipment/vehicles
Designing biometric tracking system for staff,equipment/vehicles
Developing PC I for installation of biometrictracking system in mega cities at first stage,50% of intermediate cities at second stage,30% of towns at third stage
Execution work for installation of biometrictracking system for staff, equipment/vehicles
Monitoring the biometric tracking system atcentral level
Jan-April 2017
May-June 2017
July 2017-June 2018
July 2018-Dec 2019
Developing PC I for installation of biometrictracking system in other 25% of intermediatecities and 30% of towns
Execution work for installation of biometrictracking system for staff, equipment/vehicles
Monitoring the biometric tracking system atcentral level
May-June 2020
July 2020-June 2020
July 2021-Dec 2022
Human ResourceDevelopment for the sub-sectors
Conduct a human resourcecapacity, infrastructure andtraining capacity, andtraining needs assessmentin the sub-sectors anddevelop a human resourcedevelopment plan
Strengthen infrastructureand training capacities atLocal Government TrainingInstitutes
Designing a study on human resource capacity,infrastructure and training capacity, andtraining needs assessment in the sub-sectors
Identification of experts
Deployment of Team for data collection
Data collection and analysis
Report writing by experts highlighting the keyareas to strengthen infrastructure and training
Jan-March 2017
April 2017
May 2017
June-Dec 2017
Jan-March 2018

463
StrategicObjectives/Outcomes
Short Term Actions1 - 3 years
Medium Term Actions4 - 6 years
Activities Time Frame
capacities at Local Government TrainingInstitutes
Developing proposal for strengthening LocalGovernment Training Institutes
Execution work for strengthening LocalGovernment Training Institutes
April-June 2018
July 2018-June 2019
Technical training /workshops conducted fortown level LocalGovernment staff
Conduct 238 technicaltraining / workshops peryear for Local Governmenton SWM, DRR, RecordKeeping, Management andCommunity Mobilisation –2 training workshops pertown per year
Conduct 238 technicaltraining / workshops peryear for Local Governmenton SWM, DRR, RecordKeeping, Management andCommunity Mobilisation –2 training workshops pertown per year
Identification of Technical Expert
Training Need Assessment by Technical Expert
Designing training module for LocalGovernment staff on SWM, DRR, RecordKeeping, Management and CommunityMobilisation
Training of Master Trainers
Imparting training of Local Government staffon SWM, DRR, Record Keeping, Managementand Community Mobilisation (2 trainingworkshops per town per year) through cascadetraining model by master trainers
Monitoring training programme and ensuring238 technical training / workshops conductedper year
Jan-March 2017
April-May 2017
June-Sep 2017
Oct-Dec 2017
Jan 2018-Dec 2022
Jan 2018-Dec 2022
Capacities developed ofCBOs and civil society insolid waste management(LG&HTPD)
Conduct 238 capacitydevelopment workshopsper year of CBOs and civilsociety in solid wastemanagement (LG&HTPD)(2 workshops per town per
Conduct 238 capacitydevelopment workshopsper year of CBOs and civilsociety in solid wastemanagement (LG&HTPD)(2 workshops per town per
Conducting capacity development workshopsper year of CBOs and civil society in solid wastemanagement by LG&HTPD (2 workshops pertown per year)
Monitoring training programme and ensuring
June 2018-Dec 2022

464
StrategicObjectives/Outcomes
Short Term Actions1 - 3 years
Medium Term Actions4 - 6 years
Activities Time Frame
year) year) 238 technical training / workshops conductedper year
June 2018-Dec 2022
Technical training /workshops conducted fordistrict PHED staff
Conduct 145 technicaltraining / workshops peryear for district PHED staffon O&M, DRR, Record – 5training workshops perdistrict per year
Conduct 145 technicaltraining / workshops peryear for district PHED staffon O&M, DRR, Record – 5training workshops perdistrict per year
Identification of Technical Expert
Training Need Assessment by Technical Expert
Designing training module for PHED staff onO&M, DRR and Record
Training of Master Trainers
Imparting training of PHED staff on O&M, DRR,and Record (5 training workshops per districtper year) through cascade training model
Monitoring training programme and ensuring145 technical training / workshops conductedper year
Jan-March 2017
April-May 2017
June-Sep 2017
Oct-Dec 2017
Jan 2018-Dec 2022
Jan 2018-Dec 2022
Capacities developed ofCBOs and civil society inO&M of water supplyschemes (PHE&RDD) (5workshops per district peryear)
Conduct 145 capacitydevelopment workshopsper year of CBOs and civilsociety in O&M of watersupply and drainageschemes (PHE&RDD) (5workshops per district peryear)
Conduct 145 capacitydevelopment workshopsper year of CBOs and civilsociety in O&M of watersupply and drainageschemes (PHE&RDD) (5workshops per district peryear)
Conducting capacity development workshopsper year of CBOs and civil society in in O&M ofwater supply and drainage schemes byPHE&RDD (5 workshops per district per year)
Monitoring training programme and ensuring145 technical training / workshops conductedper year
June 2018-Dec 2022
June 2018-Dec 2022

465
Sector Financing
StrategicObjectives/Outcomes
Short Term Actions1 - 3 years
Medium Term Actions4 - 6 years
Activities Time Frame
Sectoral budgeting andexpenditure reportingstratified separately foreach sub-sector(environment, watersupply, sewerage anddrainage)
Conduct a financialbudgeting and expenditurereview of sectoral budgetsand expenditures andstratify actual sub-sectorspends against sub-sectorbudgets for last five years
Introduce sub-sectorexpenditure reportingseparately forenvironment, watersupply, sewerage anddrainage, and solid waste
At least 70% of districtsand talukas report sub-sectoral spending bystratified reportingprocedure
Recruitment of technical experts for financialbudgeting and expenditure review of sectoralbudgets and expenditures and stratify actualsub-sector spends against sub-sector budgetsfor last five years
Data collection by technical experts
Reviewing the report of technical experts
Finalizing the report by technical experts
Developing guidelines for sub-sectorexpenditure reporting separately forenvironment, water supply, sewerage anddrainage, and solid waste
Circulating guidelines to all relevantdepartments and stakeholders
Monitoring the performance of sub-sectorexpenditure reporting and ensuring that atleast 70% of districts and talukas report sub-sectoral spending by stratified reportingprocedure
Jan-March 2017
April-July 2017
Aug-Sep 2017
Oct-Dec 2017Dec 2022
Jan-March 2018
April 2018
June 2018 to onward

466
StrategicObjectives/Outcomes
Short Term Actions1 - 3 years
Medium Term Actions4 - 6 years
Activities Time Frame
Increased Own SourceRevenue (OSR) in sub-sectors by Town Councils
Incentivise by providingmatching grants to TownCouncils related to sub-sector OSR
At least 30% of TownCouncils increase theirbaseline sub-sector OSR by100% or more
At least 60% of TownCouncils increase theirbaseline sub-sector OSR by200% or more
Formulating criteria for matching grants toTown Councils in sub-sectors having IncreasedOwn Source Revenue (OSR)
Assessing Town Councils having increased OSRin sub-sectors
Awarding matching grants to town councils andensuring that at least 30% of Town Councilsincrease their baseline sub-sector OSR by 100%or more
Jan-March 2017
April-June 2017
June 2018-Dec 2019
Reviewing the performance of short termaction
Awarding matching grants to town councils andensuring that at least 60% of Town Councilsincrease their baseline sub-sector OSR by 200%or more
Jan-March 2020
June 2020-Dec 2021
Increased regulated privatesector participation in sub-sectors
Incentivise private sectorwith subsidies to providewater supply, filtrationplants, O&M services,rehabilitation ofdysfunctional schemes,solid waste management,wastewater treatment inselected areas and city andtown zones
Determine type of contractarrangement and ensureregulatory mechanism inplace
At least 30% or more ofcoverage of municipalservices in mega citiesprovided by private sector
At least 20% or more ofcoverage of municipalservices in intermediatecities provided by privatesector
At least 10% or more ofcoverage of municipalservices in Towns providedby private sector
Formulating rules for incentivising privatesector with subsidies to provide water supply,filtration plants, O&M services, rehabilitationof dysfunctional schemes, solid wastemanagement, wastewater treatment
Selection of areas , city and town zones forincentivizing private sector
Subsiding private sector for provision watersupply, filtration plants, O&M services,rehabilitation of dysfunctional schemes, solidwaste management, wastewater treatment inselected areas and city and town zones
Monitoring and regulating the contractors and
Jan-March 2017
April-June 2017
July 2017-Dec 2022
July 2017-Dec 2022

467
StrategicObjectives/Outcomes
Short Term Actions1 - 3 years
Medium Term Actions4 - 6 years
Activities Time Frame
ensuring that subsiding benefits results in 30%or more of coverage of municipal services inmega cities, 20% or more coverage inintermediate cities and 10% or more ofcoverage in Towns
Increased developmentexpenditure allocation toand spending by sub-sectors
Allocate 8% of ADPallocation to the sector
Increase proportionateADP allocation for ongoingschemes from 69% to 75%and correspondinglyreduce ADP allocation tonew schemes from 31% to25%
40% of sector developmentallocation requirement andrelease achieved
Allocate 9% of ADPallocation to the sector
Increase proportionateADP allocation for ongoingschemes from 75% to 80%and correspondinglyreduce ADP allocation tonew schemes from 25% to20%
50% of sector developmentallocation requirement andrelease achieved
Organizing annual reviews on allocation ofADPs in WASH sector
Advocacy by Multi-Sectoral SteeringCommittee, Departmental TechnicalCommittee, WASH Steering Committee andother sector partners on increasing proportionof WASH related budget in ADPs
Annual and periodical reviews of sectorfinancing guarantees that 40% of sectorfinancing requirements released by June 2019and 50% by June 2022
In July, every year
Aug 2017 to onward
In July, every year
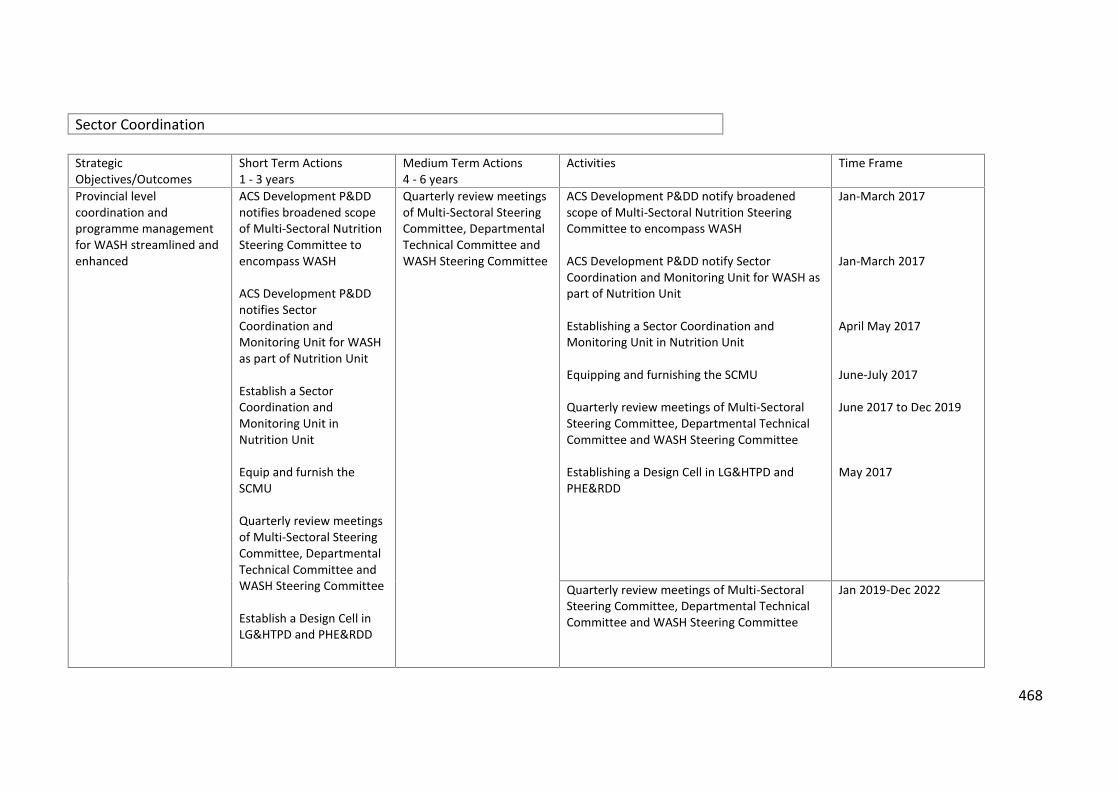
468
Sector Coordination
StrategicObjectives/Outcomes
Short Term Actions1 - 3 years
Medium Term Actions4 - 6 years
Activities Time Frame
Provincial levelcoordination andprogramme managementfor WASH streamlined andenhanced
ACS Development P&DDnotifies broadened scopeof Multi-Sectoral NutritionSteering Committee toencompass WASH
ACS Development P&DDnotifies SectorCoordination andMonitoring Unit for WASHas part of Nutrition Unit
Establish a SectorCoordination andMonitoring Unit inNutrition Unit
Equip and furnish theSCMU
Quarterly review meetingsof Multi-Sectoral SteeringCommittee, DepartmentalTechnical Committee andWASH Steering Committee
Establish a Design Cell inLG&HTPD and PHE&RDD
Quarterly review meetingsof Multi-Sectoral SteeringCommittee, DepartmentalTechnical Committee andWASH Steering Committee
ACS Development P&DD notify broadenedscope of Multi-Sectoral Nutrition SteeringCommittee to encompass WASH
ACS Development P&DD notify SectorCoordination and Monitoring Unit for WASH aspart of Nutrition Unit
Establishing a Sector Coordination andMonitoring Unit in Nutrition Unit
Equipping and furnishing the SCMU
Quarterly review meetings of Multi-SectoralSteering Committee, Departmental TechnicalCommittee and WASH Steering Committee
Establishing a Design Cell in LG&HTPD andPHE&RDD
Jan-March 2017
Jan-March 2017
April May 2017
June-July 2017
June 2017 to Dec 2019
May 2017
Quarterly review meetings of Multi-SectoralSteering Committee, Departmental TechnicalCommittee and WASH Steering Committee
Jan 2019-Dec 2022
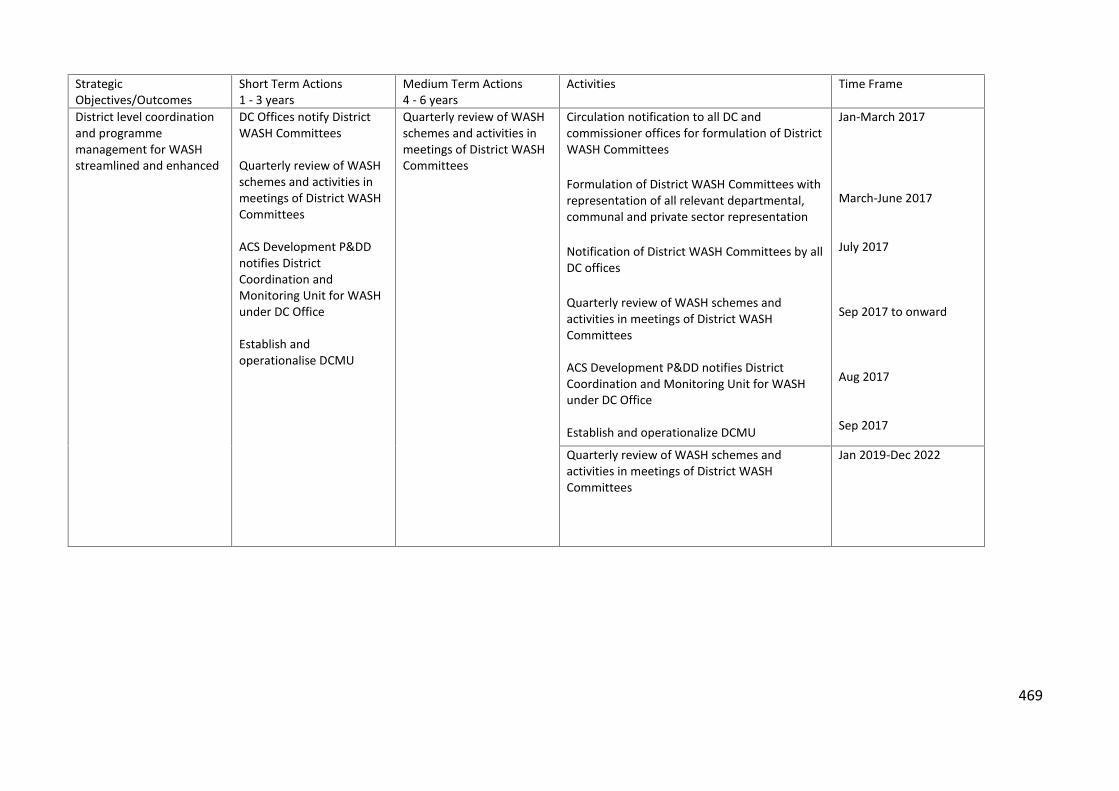
469
StrategicObjectives/Outcomes
Short Term Actions1 - 3 years
Medium Term Actions4 - 6 years
Activities Time Frame
District level coordinationand programmemanagement for WASHstreamlined and enhanced
DC Offices notify DistrictWASH Committees
Quarterly review of WASHschemes and activities inmeetings of District WASHCommittees
ACS Development P&DDnotifies DistrictCoordination andMonitoring Unit for WASHunder DC Office
Establish andoperationalise DCMU
Quarterly review of WASHschemes and activities inmeetings of District WASHCommittees
Circulation notification to all DC andcommissioner offices for formulation of DistrictWASH Committees
Formulation of District WASH Committees withrepresentation of all relevant departmental,communal and private sector representation
Notification of District WASH Committees by allDC offices
Quarterly review of WASH schemes andactivities in meetings of District WASHCommittees
ACS Development P&DD notifies DistrictCoordination and Monitoring Unit for WASHunder DC Office
Establish and operationalize DCMU
Jan-March 2017
March-June 2017
July 2017
Sep 2017 to onward
Aug 2017
Sep 2017
Quarterly review of WASH schemes andactivities in meetings of District WASHCommittees
Jan 2019-Dec 2022

470
Sector Monitoring
StrategicObjectives/Outcomes
Short Term Actions1 - 3 years
Medium Term Actions4 - 6 years
Activities Time Frame
Monitoring and reportingmechanism developed forwater and sanitationschemes
Reporting templates forwater supply andsanitation schemesdeveloped and tested;Reporting pathwayestablished from UC todistrict to provincial level
District LG&HTPD andPHE&RDD staff trained inits use
Annual WASH progressreports produced
Publishing request for Expression of Interestfor improving reporting mechanism of DistrictLG&HTPD and PHE&RDD
Deployment of technical expert
Assessment of existing mechanism of reportingand identifying gaps
Developing templates for water supply andsanitation schemes
Field testing of templates
Revising template based on field test
LG&HTPD and PHE&RDD device mechanism ofreporting on template from UC to district toprovincial level
Training/orientation of staff in reportingtemplate
Central information management
March 2017
April 2017
May-July 2017
July 2017
Aug 2017
Sep 2017
Aug 2017
Sep-Nov 2017
Dec 2017 to onward
Developing annual WASH progress reports Jan 2019 and onwardannually
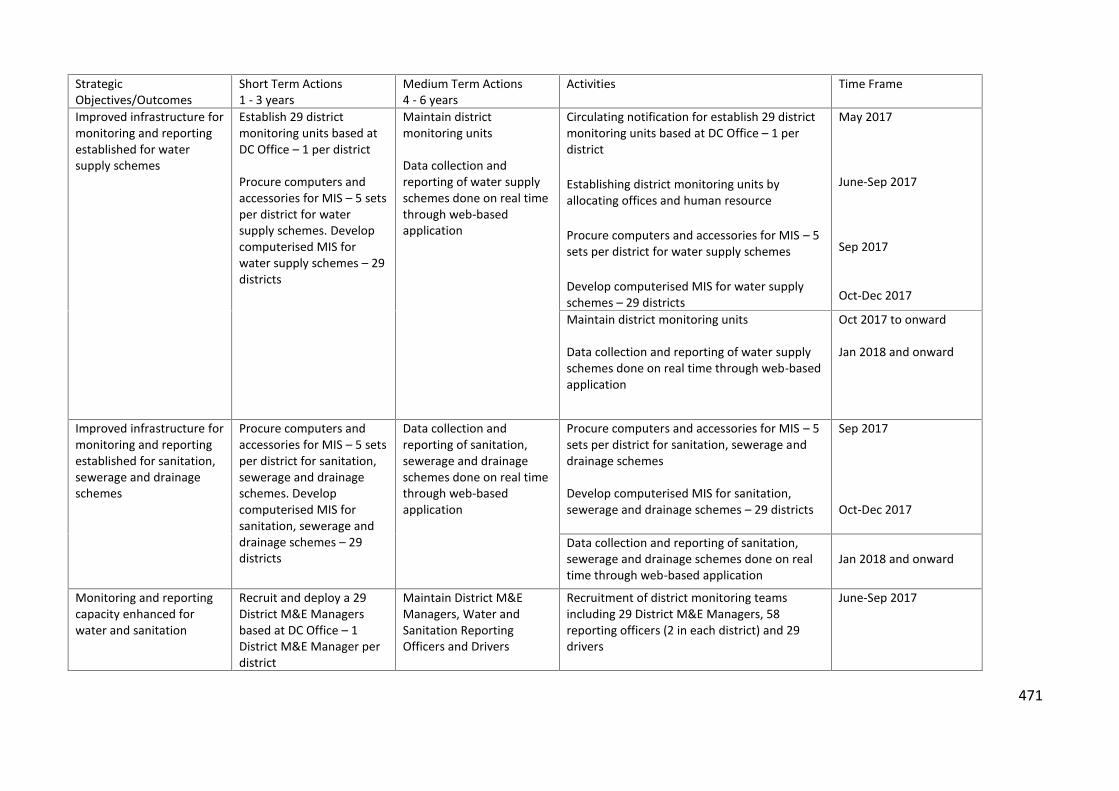
471
StrategicObjectives/Outcomes
Short Term Actions1 - 3 years
Medium Term Actions4 - 6 years
Activities Time Frame
Improved infrastructure formonitoring and reportingestablished for watersupply schemes
Establish 29 districtmonitoring units based atDC Office – 1 per district
Procure computers andaccessories for MIS – 5 setsper district for watersupply schemes. Developcomputerised MIS forwater supply schemes – 29districts
Maintain districtmonitoring units
Data collection andreporting of water supplyschemes done on real timethrough web-basedapplication
Circulating notification for establish 29 districtmonitoring units based at DC Office – 1 perdistrict
Establishing district monitoring units byallocating offices and human resource
Procure computers and accessories for MIS – 5sets per district for water supply schemes
Develop computerised MIS for water supplyschemes – 29 districts
May 2017
June-Sep 2017
Sep 2017
Oct-Dec 2017
Maintain district monitoring units
Data collection and reporting of water supplyschemes done on real time through web-basedapplication
Oct 2017 to onward
Jan 2018 and onward
Improved infrastructure formonitoring and reportingestablished for sanitation,sewerage and drainageschemes
Procure computers andaccessories for MIS – 5 setsper district for sanitation,sewerage and drainageschemes. Developcomputerised MIS forsanitation, sewerage anddrainage schemes – 29districts
Data collection andreporting of sanitation,sewerage and drainageschemes done on real timethrough web-basedapplication
Procure computers and accessories for MIS – 5sets per district for sanitation, sewerage anddrainage schemes
Develop computerised MIS for sanitation,sewerage and drainage schemes – 29 districts
Sep 2017
Oct-Dec 2017
Data collection and reporting of sanitation,sewerage and drainage schemes done on realtime through web-based application
Jan 2018 and onward
Monitoring and reportingcapacity enhanced forwater and sanitation
Recruit and deploy a 29District M&E Managersbased at DC Office – 1District M&E Manager perdistrict
Maintain District M&EManagers, Water andSanitation ReportingOfficers and Drivers
Recruitment of district monitoring teamsincluding 29 District M&E Managers, 58reporting officers (2 in each district) and 29drivers
June-Sep 2017

472
StrategicObjectives/Outcomes
Short Term Actions1 - 3 years
Medium Term Actions4 - 6 years
Activities Time Frame
Recruit and deploy 58Water and SanitationReporting Officers – 2 perdistrict based at DC Office
Recruit and deploy 29drivers – 1 driver perdistrict based at DC Office
Training of District M&E managers andReporting Officers on MIS and reportingtemplates
Deployment of monitoring teams at DC Office
Oct-Dec 2017
Sep 2017
Management and supervision of districtmonitoring team
Sep 2017 and onward
Travel for monitoring andreporting facilitated
Procure 29 vehicles formonitoring and reporting –1 vehicle per district basedat DC Office
Maintain vehicles Tender publication for procurement of vehicles
Selection of suitable tender for procurement of29 vehicles
Placing 1 vehicle each district for monitoringand reporting support
Sep 2017
Oct 2017
Nov-Dec 2017
Management and maintenance of vehicles Jan 2018 to onward

ACRONYMS
ACF Action against HungerADB Asian Development BankAJK Azad Jammu and KashmirAl AluminiumAPHA American Public Health AssociationAs ArsenicASER Annual Status of Education ReportAWB Area Water BoardAZRI Arid Zone Research InstituteBCEW Bureau of Curriculum and Extension WingBHU Basic Health UnitBISE Board of Intermediate and Secondary EducationBISP Benazir Income Support ProgrammeCa CalciumCAC Community Advisory CommitteesCAEWRI Climate Change, Alternate Energy and Water Resources InstituteCBOs Community Based OrganisationsCCT Conditional Cash TransferCDG City District GovernmentCDP Community Development ProgrammeCH Civil HospitalCIF Curriculum Implementation FrameworkCl ChlorideCMWs Community MidwivesCPD Continuing Professional DevelopmentCRI Climate Risk IndexCSUSC Central Sindh Urban Services CorporationDBG Drainage Beneficiaries’ GroupDC District CommissionerDCMU District Coordination and Monitoring UnitDMC District Municipal CorporationDNI Distribution Network ImprovementsDOs Direct OutletsDRIP Drainage and Reclamation Institute of PakistanDSE Directorate of School EducationDWUA Drinking Water User AssociationsECHO European Community Humanitarian aid OfficeELD Education and Literacy Department
474
ELDC Education Leadership Development CentreEMIS Education Management Information SystemEPI Expanded Programme for ImmunisationETRC Education Technology Resource CentreEU European UnionFANSA Fresh Water Action Network South AsiaFATA Federally Administered Tribal AreasFe Iron (Ferrous)FLCF First Level Care FacilityFOs Farmer OrganisationsFY Financial YearGCA Gross Command AreaH-WASA Hyderabad Water and Sanitation AuthorityHCU Health Care UnitHDI Human Development IndexHRDC Human Resource Development CentreHSR Higher Surface ReservoirIBIS Indus Basin Irrigation SystemID&FCRC Irrigation, Drainage and Flood Control Research CouncilIMNCI Integrated Management of Newborn and Childhood IllnessesIPs Implementing PartnersIRSP Integrated Rural Support ProgrammeIRWR Internal Renewable Water ResourcesITE Initial Teacher EducationIYCF Infant and Young Child Feeding and careK PotassiumKBCA Karachi Building Control AuthorityKIA Korangi Industrial AreaKW&SB Karachi Water and Sewerage BoardLCMC Local Council Monitoring CommitteeLG Local GovernmentLG&HTPD Local Government and Housing Town Planning DepartmentLHWs Lady Health WorkersLIA Landhi Industrial AreaMC Municipal Committee/Municipal Corporation/Metropolitan CorporationMDGs Millennium Development GoalsMg MagnesiumMGD Million gallons per dayMHA Million HectaresMHM Menstrual Hygiene Management

475
MNA Member of National AssemblyMNCH Mother Newborn and Child HealthMoA Memorandum of AgreementMoFEPT Ministry of Federal Education and Professional TrainingMPA Member of Provincial AssemblyMPI Multi-dimensional Poverty IndexMTRI Municipal Training Research InstituteMUET Mehran University of Engineering and TechnologyNa SodiumNARC National Agricultural Research CentreNi NickelNRSP National Rural Support ProgrammeNSP Nutrition Support ProgrammeNSUSC Northern Sindh Urban Services CorporationNWQL National Water Quality LaboratoryO&M Operation and MaintenanceOHR Overhead ReservoirOPP-RTI Orangi Pilot Project Research and Training InstituteORS Oral rehydration Solution/SaltsORT Oral Rehydration TherapyP&DD Planning and Development Department and Special InitiativesPCAS-W Pakistan Centre for Advanced Studies in WaterPCRWR Pakistan Council of Research in Water ResourcesPCSIR Pakistan Council for Scientific and Industrial ResearchPDMA Provincial Disaster Management AuthorityPEACe Provincial Education Assessment CentrePEFSA Pakistan Emergency Food Security AlliancePHE&RDD Public Health Engineering and Rural Development DepartmentPHED Public Health Engineering departmentPITE Provincial Institute for Teacher EducationPKR Pakistani Rupeesppb Parts Per BillionPPHI People’s Primary Health InitiativePPP ParityPSQCA Pakistan Standards and Quality Control AuthorityQASC Quality Assurance and Support CentreR&D Research and DevelopmentRBOD Right Bank Outfall DrainRDD Rural Development DepartmentRO Reverse Osmosis

476
RoB Rules of BusinessRs RupeesRSU Reform Support UnitRWSS Rural Water Supply SchemesSAP Social Action ProgrammeSARC Southern Zone Agricultural Research CentreSCADA Supervisory Control And Data AcquisitionSCIP Sindh Cities Improvement Investment ProgrammeSCMU Sector Coordination and Monitoring UnitSDGs Sustainable Development GoalsSEMIS Sindh Education Management Information SystemSESP Sindh Education Sector PlanSIDA Sindh Irrigation and Drainage AuthoritySITE Sindh Industrial EstateSLO Student Learning OutcomesSMBBMU Shaheed Mohtarma Benazir Bhutto Medical UniversitySMSDP Sindh Municipal Services Delivery ProgrammeSO4 SulphateSOP Standard Operating ProcedureSRSO Sindh Rural Support OrganizationSSS Saaf Suthro SindhSSUSC Southern Sindh Urban Services CorporationSTBB Sindh Textbook BoardSTEDA Sindh Teacher Education Development AuthoritySWM Solid Waste ManagementTARWR Total Actual Renewable Water ResourcesTC Town CouncilTDS Total Dissolved SolidsTEIs Teacher Education InstitutesTMA Tehsil Municipal AdministrationTOTs Training of TrainersTP Treatment PlantUF Ultra FiltrationUNDP United Nations Development ProgrammeUNICEF United Nations Children’s Emergency FundUP&SP Urban Policy and Strategic PlanningUS United StatesUSAID United States Agency for International DevelopmentVDA Village Development AssociationVDP Village Development Plan

477
WAC Water Allocation CommitteeWAPDA Water and Power Development AuthorityWCA Water Course AssociationWFP World Food ProgrammeWHO World Health OrganizationWINS Women’s and Infants Nutrition ProgrammeWinS WASH in SchoolsWRRI Water Resources Research InstituteWSS Water Supply SchemesWTP Water Treatment Plant

478
OPERATIONAL DEFINITIONS
Agency - means an Agency established under any of the laws for the time being enforced andincludes any government department and any other local or international organisation
Agricultural Solid Waste - Solid waste that is generated by the rearing of animals, and producingand harvesting of crops or trees.
Aquifer - means a layer of water-bearing strata located underground that conveys water insufficient quantity to supply pumping wells or natural springs
Arsenic Contamination - is the natural contamination of drinking water caused by application ofinsecticides, wood preservatives, mining activities and petroleum refining. The water qualityguidelines mentioned by the NDWQS state that the level of arsenic contamination for safedrinking water should not exceed 0.05 mg/L (50 ppb).
Authority - means an Authority established under any law and includes any government, local orinternational authority
Bacterial contamination - is usually measured by the faecal coliform levels in the water. Faecalcoliform is an indicator organism; it is easily measured and can signal the presence of otherharmful bacteria in water.
Basic Sanitation - means provision of sewerage services to the inhabitants of any area using thelowest-cost technology ensuring hygienic excreta and sludge disposal and a clean healthy livingenvironment
Basic Water Supply - means the supply of prescribed quantity and quality of water to households,including informal households, to support life and personal hygiene
Bulk Water Entitlement - means the volumetric authorisation given by the Commission to a bulkwater supplier for a specific period of time as provided in the permit granting the entitlement
Bulk Water Supplier - means any person, who having procured a bulk water entitlement, treats itas per prescribed standards and then supplies it to service provider in an area or service providersin more than one area for retail distribution; and includes a supplier of wastewater treatmentservices
CBO - refers to Community Based Organisation; Organise and motivate community of the village(s)of WSS Scheme for ascertaining need for the scheme, Providing support to Public HealthEngineering for planning, designing, estimation, execution and operation of the scheme andoperate & maintain rural water supply schemes.
Chemical contamination - is measured by a test specific to a particular chemical. Chemicalscontaminations can naturally occur or can be caused by anthropogenic activities entering fromeither point sources (such as a specific leak from a pipe or a dumping site) or from non-pointsources (such as oil or other gasoline products from large-scale runoff from a highway or parkinglot), and are considered to be very harmful.
Community Led Total Sanitation - is an “innovative methodology for mobilising communities tocompletely eliminate open defecation. Communities are facilitated to conduct their own appraisaland analysis of open defecation and take their own action to become open defecation free.”
479
Component Sharing - Approach by which responsibility for development of sanitationinfrastructure is bifurcated between community and government. The community pays for andconstructs internal infrastructure (household latrines, lane and small collector sewers) while thegovernment agency construct external infrastructure (primary and trunk sewerage, disposalstations and treatment plants). The division of components is explained below.
a. Internal Development comprises of Inside the house-sanitary latrines, In the lane-underground sewerage line, and Small, secondary or collector sewers.
(Community is responsible for internal development)
b. External Development that constitutes Large secondary or collector sewerage, Trunk sewer/nullah development, Disposal station, and Treatment plant.
(Government is responsible for external development)
Conservancy - means the collection, treatment, removal and disposal of refuse
Consumer - means any end user who receives water supply or sanitation services from a serviceprovider
Drain - includes a sewer, a house drain, a drain of any other description, a tunnel, a culvert, aditch, a channel or any other device for carrying sullage or rain water
Drinking Water - means water used for municipal purposes including drinking, cooking, hygieneand other domestic uses
Effluent - means wastewater discharged from point sources which enters into a body of water orupon land, or wastewater arising as a by-product of any water use
Environmental Remediation Use - means use of water for environmental remediation purposes
Groundwater - means subsurface water that occurs beneath a water table in soils and rocks, or inecological formations
Groundwater Vulnerability - is defined as the tendency and likelihood for general contaminants toreach the water table after introduction at the ground surface
Hospital waste management - It means the management of waste produced by hospitals (duringdiagnosis, treatment or immunisation of human beings or animals or in research) using suchtechniques that will help to check the spread of diseases
Improved sanitation facilities - Facilities that ensure hygienic separation of human excreta fromthe human contact. They include pour-flush latrines/ toilets, linked to piped sewerage systemseptic tank, pit latrines, ventilated improved pit latrine, pit latrine with slab, composting toilets
Improved source of drinking water – refers to piped into dwelling; piped into compound, yard orplot; piped to neighbour; public tap or standpipe; tube well; hand pump with tap; motorisedpump; protected well; protected spring; bottled mineral water

480
Industrial (Residual) Solid Waste - Solid waste generated by industrial processes andmanufacturing
LG&HTPD - refers to the Local Government and Housing Town Planning Department and itsattached and affiliated entities
Local Government - means a local government established under the Sindh Local Government Act,2013, and includes a Union Council, a Municipal Committee, a Municipal Corporation, theMetropolitan Corporation, and a District Council
Metropolitan Corporation - means the Metropolitan Corporation Karachi
Municipal Committee - means a Municipal Committee constituted under the SLGA 2013
Municipal Corporation - means a Municipal Corporation constituted under the SBLGA 2013
Municipal Purpose - means use of water in an area for drinking, domestic and recreational use,horticultural, industrial or commercial use and includes such other purposes as may be prescribedbut excludes water used solely for the purposes of irrigation
Municipal services - include intra-city network of water supply, sanitation, conservancy, removaland disposal of sullage, refuse, garbage, sewer or storm water, solid or liquid waste, drainage,public toilets, express ways bridges, flyovers, public roads, streets, foot paths, traffic signals,pavements and lighting thereof, public parks, gardens, graveyards, arboriculture, landscaping,billboards, hoardings, fire fighting, land use control, zoning, master planning, classificationdeclassification or reclassification of commercial or residential areas, markets, housing, urban orrural infrastructure, environment and construction, maintenance or development of these servicesand enforcement of any law relating to municipal services
Municipal Water - means the total water required for municipal purposes in an area
National Drinking Water Quality Standards - means the standards approved the PakistanEnvironmental Protection Council in March 2010
National Environmental Quality Standards - means the standards issued by the PakistanEnvironmental Protection Agency established under the Pakistan Environmental Protection act,1997
Open defecation - Defecation in fields, forests, bushes, bodies of water or other open spaces, ordisposal of human faeces with solid waste
Operational Cost Coverage – This is the ratio of total annual operational revenue divided by totalannual operating costs
Public sector - refers to all ministries, departments, entities, bodies and local governments at theprovincial, federal and local levels
Refuse - includes rubbish, offal, night-soil, carcasses of animals, deposits of sewerage, waste andany other offensive matter
Rural Councils – these include the following: Union Council for each Union, comprising a village or a number of villages having, as far as
possible, an aggregate population between 7000 and 15000, excluding its urban areas and thecantonment areas
District Council for each District, comprising the area of a revenue district, excluding its urbanareas and the cantonment areas

481
Safe Drinking Water - refers to the water complying with national/provincial drinking waterquality standards
Sanitation - is defined as hygienic means of preventing human contact with the hazards of wastes.Wastes include human and animal faeces, solid wastes, domestic wastewater (sewage, sullage,and grey water), industrial wastes, and agricultural wastes, hygienic means of prevention by usingengineering solutions (e.g. sewerage and wastewater treatment), simple technologies (e.g.latrines, septic tanks), or even by personal hygiene practices (e.g. simple hand washing with soap)
Service Providers - refer to local government institutions, WASA, CBOs responsible for themanagement, treatment and distribution of municipal water or collection, transport, treatmentand disposal of wastewater
Sewage & wastewater treatment - Chemical, biological, and mechanical procedures applied to anindustrial or municipal discharge or to any other sources of contaminated water to remove,reduce, or neutralise contaminants before discharging it into a water body
Sewerage - means a system of collection of wastewater from an area including its houses,institutions, industry and public places; the pumping, treatment and disposal of such wastewater,effluent, sludge, and other end products
Shared sanitation facilities - Sanitation facilities of an otherwise acceptable type shared betweentwo or more households. Shared facilities include public toilets
Small Towns - Small towns are those having a population of less than hundred thousand,comprising of two to three union councils devoid of any municipal council
Solid Waste - means any garbage, refuse, sludge from a waste treatment plant, water supplytreatment plant, or air pollution control facility and other discarded material, including solid,liquid, semisolid, or contained gaseous material resulting from industrial, commercial, mining, andagricultural operations, and from community activities, but does not include solid or dissolvedmaterial in domestic sewage, or solid or dissolved materials in irrigation return flows or industrialdischarges
Sources of Drinking Water Supply – these include the following: Tap water is a delivery system where the water is delivered through a network of pipes and
the water is treated before it is supplied. In urban areas generally, water comes in to housethrough pipes and is stored in tanks, built in the house. Then the water for the use ofhousehold is lifted to small tanks built at the top of the house
Hand Pump is a pump operated manually to draw water from a bored hole. Sometimeshand pump and motor are operated at the same hole
Dug well is of two types - opened and closed well. Closed well is a dug well with a coveringand opened well is a dug well without covering
Surface Water - means water, which lies above the surface of the ground, is open to theatmosphere and is subject to surface runoff
Total Sanitation - Combination of four interventions that include; hygiene, foul waterdisposal/drainage, excreta disposal and solid waste management (sustaining ODF status andensuring its sustainability)
Unimproved Sanitation facilities - Facilities that do not ensure hygienic separation of humanexcreta from human contact. Unimproved facilities include pit latrines without a slab or platform,hanging latrines and bucket latrines
482
Urban Councils – these include the following:
Metropolitan Corporation for the Capital City comprising an urban area having populationexceeding 500,000
Municipal Corporation for each City comprising an urban area having a population exceeding100,000 but not exceeding 500,000
Municipal Committee for each Municipality, comprising an urban area having a populationexceeding 15,000 but not exceeding 100,000
User of Water - means any natural or artificial person or persons, whether Government owned orcontrolled or not, who or which uses water for any municipal purpose
Village - means an integrated and contiguous human habitation commonly identified by a nameand includes a dhok, gaown, killi or any other comparable habitation. There may be one or moreVillages / Killies in a Mauza
Water and Sewerage Services Provider - means any Government or private body establishedunder any law and operating as services providers
Water Body - means both natural and man-made bodies of fresh, brackish, and saline waters, andincludes, but is not limited to, aquifers, groundwater, springs, creeks, streams, rivers, ponds,lagoons, water reservoirs and lakes but does not include bodies constructed, developed and usedpurposely as water treatment facilities, or water storage for recycling and re-use which areintegral to process industry or manufacturing
Water Coverage - refers to the proportion of the population that has access to safe drinkingwater.
Water Pollution - means any alteration of the physical, chemical, biological, or radiologicalproperties of a water body resulting in the impairment of its purity or quality
Water Quality - means the quality of water, which conforms to the national drinking water qualitystandards. It also means water the quality whereof is appropriate as per standards issued by aregulating authority for the purpose for which it is supplied or used
Water safety planning approach - is a plan to ensure the safety of drinking water through the useof a comprehensive risk assessment and risk management approach that encompasses all steps inwater supply from catchment to consumer
Water Service - means in general water supply and sewerage services, unless otherwise specified
Water Supply Services - means the appropriation, conveyance, treatment and distribution ofmunicipal water, or water (through withdrawal and abstraction of ground or surface water orharvesting of rainwater) intended to be converted to municipal water
Well - means a well sunk for the search or abstraction of water by a person or persons for carryingout scientific investigations, exploration, development or management work for the survey andassessment of water resources or for providing water and includes open well, dug well, bore-well,dug-cum-bore-well, tube well and collector well
Working Ratio – This is the ratio of total operating expenses divided by total operating revenues

Annex 1 – Bottleneck Analysis – Safely Managed Water Resources
Determinants Bottlenecks Identified Opportunities Description PriorityENABLINGENVIRONMENT
Social Norms Water is generally considered a free andinfinite source, and no voice andaccountability mechanism in place forinjudicious use of water.
The political leadership and media shaping thevoices for depleting water resources, poorwater quality, inapt water management andclimate change impacting life.
High
Legislation/ Policy Lack of implementation arrangements/structures for approved or draft drinking waterpolicies in the provinces.
The legal framework, even under LGA, fordrinking water is patchy, weak and fragmentedespecially around O&M, communityparticipation, and resource allocationscriterion.
Sindh policies are drafted.
The Ministry of Planning, Development andReforms initiating to review existing policies toalign with SDGs and national commitments
Legislative review for drinking water isneeded.
High
Budget/Expenditure
Political interests of the government drive thebudgetary allocations rather inequities /needs.
Lack of data in line with SDGs and appropriateplanning tools. Need assessment, planning andbudgeting is top down- wider communityconsultations rarely held for project proposals(PC-1)
Sectoral WASH expenditure data is not readilyaccessible and available- including funds spentby CSOs, LG and private sector
WASH budget especially for drinking waterincreasing mostly on water filtration -advocacy with elected representatives toaddress regional inequities.
Capacity development of provinces to referSDGs in provincial budget- Extend support inpreparing planning manuals to improve qualityof government project proposals (PC1)
Advocacy with Finance/ P&DD to track WASHexpenditures through their existing system,with bifurcation by sector and source offinancing.
High+
Management/Coordination
No single regularity and monitoring authorityexist for M&E and reporting of drinking waterin the provinces.
Lack of clarity on roles and responsibilities-multiple institutions/ departments conductneed assessment and execution of drinkingwater projects with poor coordination and
The development of guidelines for watersupply initiatives under new LGA in theprovince.
Need for creation of Programme ManagementUnit or Steering Committee for WASH in theprovinces for sector coordination, supervisionand monitoring.
High

484
knowledge managementJoint sector reviews needed.
SUPPLY Availability ofessentialcommodities /inputs
Energy crisis: regular breakdown of powersupplies and increasing costs limits efficiencyof water supply schemes in rural and urbanareas.The communities are unable to pay theburgeoning cost of electricity in rural watersupply
Lack of necessary equipment, tools andfinancing for O&M.
Develop provincial & district water supplyplans validated by a wide range ofstakeholders, defining clear targets, indicators,and budgeted activities.
Conduct joint sector reviews to track progress.Assess and pilot new technological innovationslike solar energy, water metering, O&Mfinancing and sustainability- Learning shouldbe documented.
Medium
Access toadequately staffedservices, facilitiesand information
Systematic professional capacity developmentis missing both for urban as well as ruralWASH.
Lack of ageing and efficiency profiling ofequipment/ tools and machinery
Lack of uniformity on WASH indicators underdifferent HHs surveys and MIS of governmentand corporate bodies.
The capacity assessment of human resourcesfor WASH in the provinces followed bycapacity enhancement of training instituteswith courses and infrastructure.
Provincial & district based aging profiling ofequipment, tools and machinery.Create consensus on WASH indicators to becovered in MICS/PSLM as well as MIS andproposed dashboards.
High+
DEMAND
Financial Access
Available funds are not distributed among thedistricts and tehsils on equity and need basis.
Lack of information about contributions andresources available from public and privatesources.
Periodic mapping of inequities for safe waterfor advocacy with political leadership & donorsfor resource mobilization.
Budgetary analysis at the provincial/districtslevels for advocacy through PMUs
High
Social and CulturalPractices andBeliefs
Beliefs that water is free and readily availableand disempowerment of rights holdersincluding women and children impedes theirdemand for accountability from WASH serviceproviders
Adoption of bottom up sustainable behavioralapproaches to generate demand for safelymanaged water services by ensuring thatperspectives, concerns and voices of all,including marginalized groups, are reflected inupstream policy dialogue, decision making,and interventions
High+
Continuity of Use The implementation arrangements are notbacked with necessary legislation that defines
Strong social mobilization for ownership andaccountability.
Medium

485
roles and responsibilities of communities &stakeholders around O&M of waterinfrastructure
Conditional cash transfers for nutrition andhealth programmes be linked with O&M ofdrinking water and improved sanitation
QUALITY Quality
Over 80% of drinking water being used isbacterially contaminated as per PCRWR. TheNEQS include water & sanitation but notfollowed largely
Review and develop water quality standards inline with international and SDGs needs.Work with PCRWR to capacitate stakeholdersand local organizations on quality
High+
(Source: National Wash Data Diagnostic Study 2016. Ministry of Climate Change, Government of Pakistan)
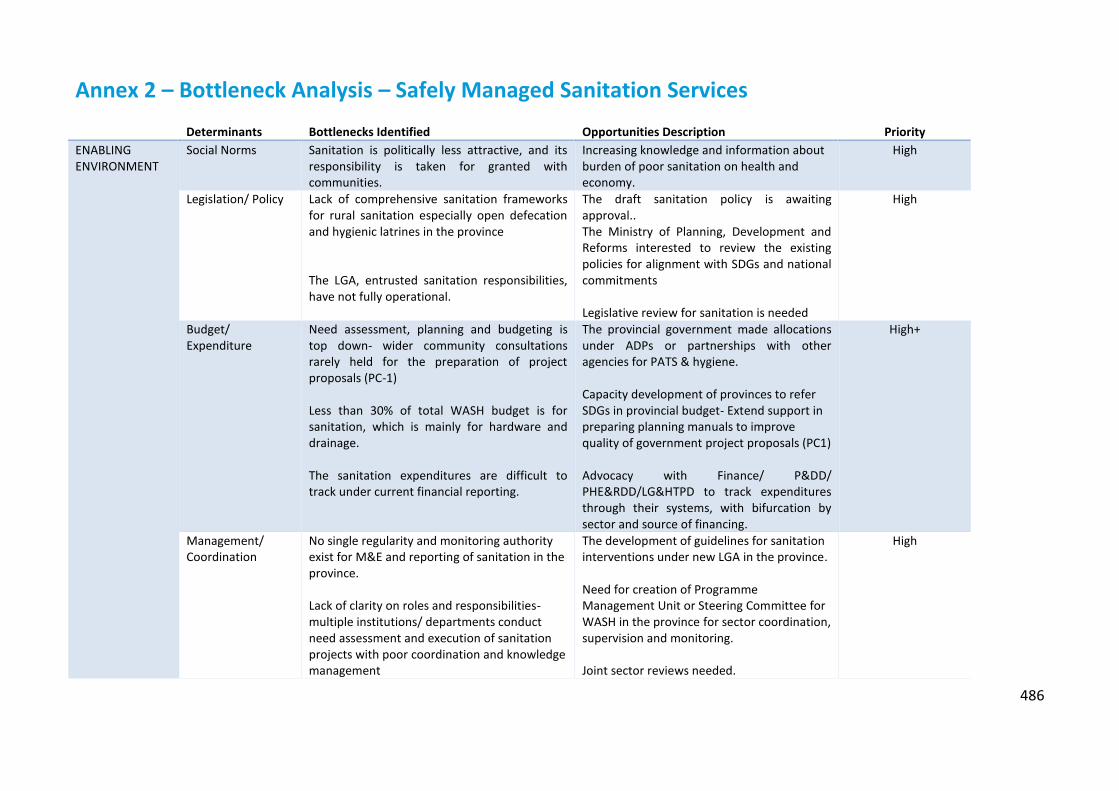
486
Annex 2 – Bottleneck Analysis – Safely Managed Sanitation Services
Determinants Bottlenecks Identified Opportunities Description PriorityENABLINGENVIRONMENT
Social Norms Sanitation is politically less attractive, and itsresponsibility is taken for granted withcommunities.
Increasing knowledge and information aboutburden of poor sanitation on health andeconomy.
High
Legislation/ Policy Lack of comprehensive sanitation frameworksfor rural sanitation especially open defecationand hygienic latrines in the province
The LGA, entrusted sanitation responsibilities,have not fully operational.
The draft sanitation policy is awaitingapproval..The Ministry of Planning, Development andReforms interested to review the existingpolicies for alignment with SDGs and nationalcommitments
Legislative review for sanitation is needed
High
Budget/Expenditure
Need assessment, planning and budgeting istop down- wider community consultationsrarely held for the preparation of projectproposals (PC-1)
Less than 30% of total WASH budget is forsanitation, which is mainly for hardware anddrainage.
The sanitation expenditures are difficult totrack under current financial reporting.
The provincial government made allocationsunder ADPs or partnerships with otheragencies for PATS & hygiene.
Capacity development of provinces to referSDGs in provincial budget- Extend support inpreparing planning manuals to improvequality of government project proposals (PC1)
Advocacy with Finance/ P&DD/PHE&RDD/LG&HTPD to track expendituresthrough their systems, with bifurcation bysector and source of financing.
High+
Management/Coordination
No single regularity and monitoring authorityexist for M&E and reporting of sanitation in theprovince.
Lack of clarity on roles and responsibilities-multiple institutions/ departments conductneed assessment and execution of sanitationprojects with poor coordination and knowledgemanagement
The development of guidelines for sanitationinterventions under new LGA in the province.
Need for creation of ProgrammeManagement Unit or Steering Committee forWASH in the province for sector coordination,supervision and monitoring.
Joint sector reviews needed.
High

487
SUPPLY Availability ofessentialcommodities /inputs
Less than 10% rural population has anydrainage system outside their houses.
Lack of necessary machinery and techniques fordisposal stations and appropriate wastewatertreatments along with financing for O&M
Lack of access and availability of sanitationaccessories especially to rural communities
Develop provincial & district sanitation plansvalidated by stakeholders, defining cleartargets, indicators, and budgeted activities.Conduct joint sector reviews to trackprogress.Pilot and scale up new technologicalinnovations in sanitation marketing,improved sanitation, wastewater treatment,O&M financing and sustainability- Learningshould be documented.
Medium
Access toadequately staffedservices, facilitiesand information
Systematic capacity development throughprofessional training and mentoring is missingboth for urban as well as rural WASH.Lack of ageing and efficiency profiling ofequipment/ tools and machinery
Lack of uniformity on WASH indicators underdifferent HHs surveys and MIS of governmentand corporate bodies.
The capacity assessment of human resourcesfor WASH in the provinces followed bycapacity enhancement of training instituteswith courses and infrastructure.Provincial & district based ageing profiling ofequipment, tools and machinery.
Create consensus on WASH indicators to becovered in MICS/PSLM as well as MIS andproposed dashboards.
High+
DEMAND
Financial Access
Available funds are not distributed among thedistricts and tehsils on equity and need basis.
Lack of information about contributions andresources available from public and privatesources.
Periodic mapping of inequities for improvedsanitation for advocacy with politicalleadership & donors for resourcemobilization.
Budgetary analysis at the provincial/districtslevels for advocacy through PMUs
High
Social and CulturalPractices andBeliefs
Open defecation in rural areas is part of theirsocial behavior and cultural practices.Even having knowledge, gap exists in hygienepractices.
Only 2/3rd of people WASH hands with soapand water.
Promote communication for social changeinitiatives that engage, motivate andempower communities and networks toinfluence or strengthen social norms andcultural practices that supports long-termsustainable social change for sanitationpractices
High+
Continuity of UseThe implementation arrangements are notbacked with necessary legislation that definesroles and responsibilities of communities
Conditional cash transfers for nutrition andhealth programmes should be linked withsustainability of sanitation & hygiene.
Medium
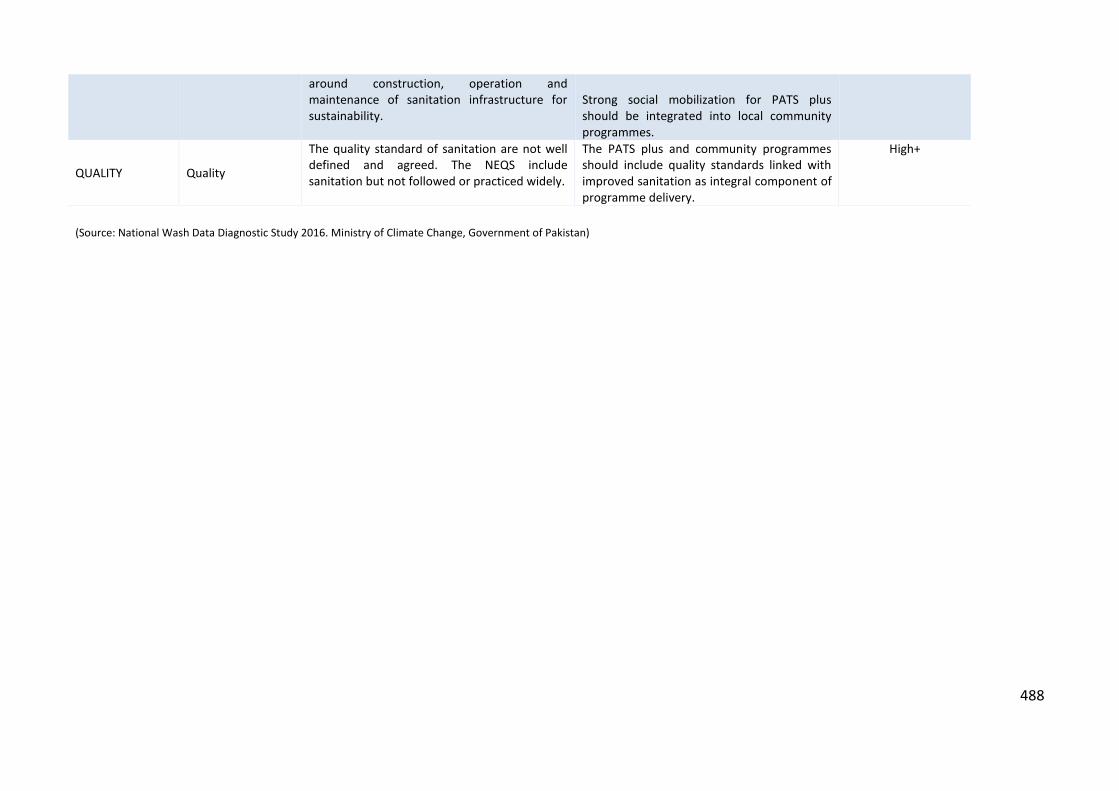
488
around construction, operation andmaintenance of sanitation infrastructure forsustainability.
Strong social mobilization for PATS plusshould be integrated into local communityprogrammes.
QUALITY Quality
The quality standard of sanitation are not welldefined and agreed. The NEQS includesanitation but not followed or practiced widely.
The PATS plus and community programmesshould include quality standards linked withimproved sanitation as integral component ofprogramme delivery.
High+
(Source: National Wash Data Diagnostic Study 2016. Ministry of Climate Change, Government of Pakistan)

489
Annex 3 – Bottleneck Analysis – Institutional WASH
Determinants Bottlenecks Identified Opportunities Description PriorityENABLINGENVIRONMENT
Social Norms The provision and maintenance of WASH inschools, health facilities and public buildings isconsidered the responsibilities s of state
The School Management Committees andHealth Committees have representation oflocal communities whom are being capacitedthrough training
High
Legislation/ Policy National Education policy 2009, a guidingdocument for the province, has not describedspecific interventions for WASH.
Draft National Policy 2009 and ProvincialHealth Sector Strategies did not reflect WASHcomponent.
National housing policy 2001 out-dated, anddid not talk about public and work placeWASH.
Provincial Education Sector plan emphasizedand defined activities for school WASH.
Engage local representative and communitiesfor legislation/ enforcement of public latrines/WASH at work place.
High
Budget/Expenditure
Fragmented information about budgetallocated and spent on WASH in schools- thatis mostly with missing facilities.
No budgetary information about WASH inhealth facilities.
No budgetary information about public toilets.
Increase budget for missing facilities in theprovince – advocacy for WASH specific budgetin education/schools.
Engage with PPHI and health department forreporting on WASH budget in health facilities
Advocate LG for specific budget on publictoilets
High
Management/Coordination
Poor coordination mechanism betweenhealth, education, PHE&RDD and LG&HTPDaround institutional WASH at the national,provincial and district levels. The districtWASH committees have lack of necessarylegislative backing and upward reporting tosingle body.
The programme management unit for WASHshould be advocated for setting up at theprovincial level with line reporting fromeducation, health, LG&HTPD and PHE&RDD,P&DD and environment with reporting fromdistricts and TMAs.The provincial government advocated forendorsing ToRs of district WASH committees
High
SUPPLY Availability of Lack of necessary data/ information from Create a database for availability of inputs/ High
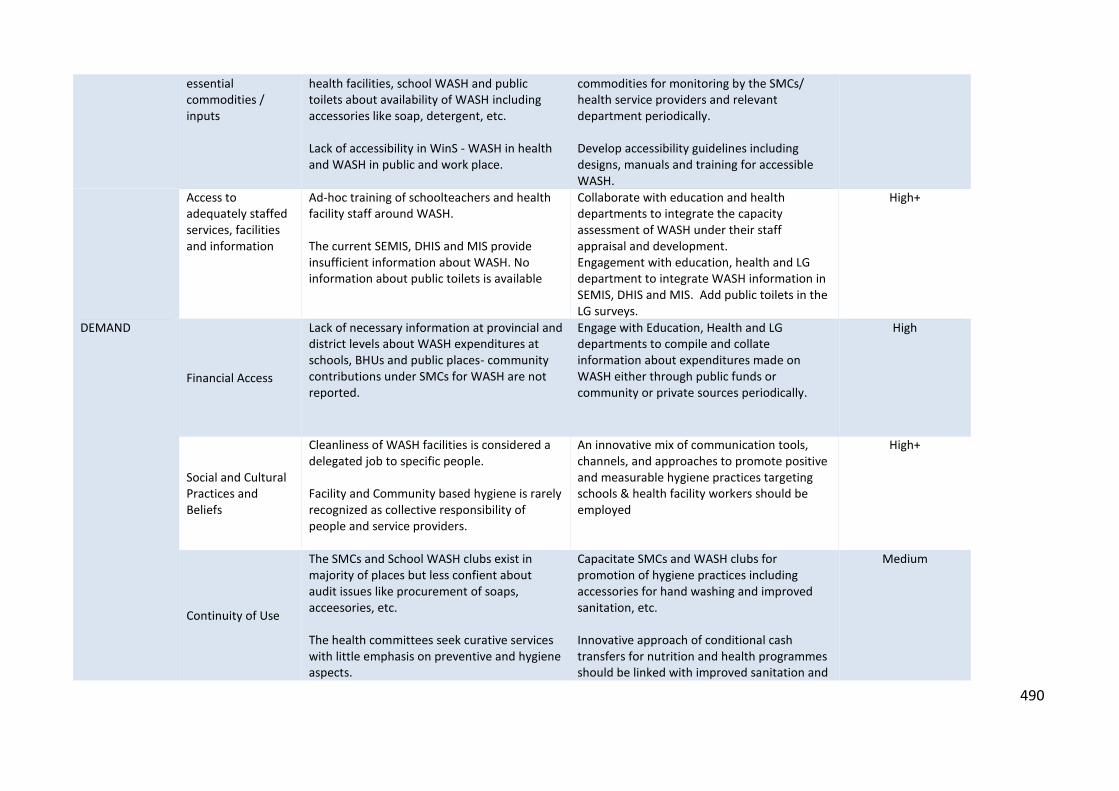
490
essentialcommodities /inputs
health facilities, school WASH and publictoilets about availability of WASH includingaccessories like soap, detergent, etc.
Lack of accessibility in WinS - WASH in healthand WASH in public and work place.
commodities for monitoring by the SMCs/health service providers and relevantdepartment periodically.
Develop accessibility guidelines includingdesigns, manuals and training for accessibleWASH.
Access toadequately staffedservices, facilitiesand information
Ad-hoc training of schoolteachers and healthfacility staff around WASH.
The current SEMIS, DHIS and MIS provideinsufficient information about WASH. Noinformation about public toilets is available
Collaborate with education and healthdepartments to integrate the capacityassessment of WASH under their staffappraisal and development.Engagement with education, health and LGdepartment to integrate WASH information inSEMIS, DHIS and MIS. Add public toilets in theLG surveys.
High+
DEMAND
Financial Access
Lack of necessary information at provincial anddistrict levels about WASH expenditures atschools, BHUs and public places- communitycontributions under SMCs for WASH are notreported.
Engage with Education, Health and LGdepartments to compile and collateinformation about expenditures made onWASH either through public funds orcommunity or private sources periodically.
High
Social and CulturalPractices andBeliefs
Cleanliness of WASH facilities is considered adelegated job to specific people.
Facility and Community based hygiene is rarelyrecognized as collective responsibility ofpeople and service providers.
An innovative mix of communication tools,channels, and approaches to promote positiveand measurable hygiene practices targetingschools & health facility workers should beemployed
High+
Continuity of Use
The SMCs and School WASH clubs exist inmajority of places but less confient aboutaudit issues like procurement of soaps,acceesories, etc.
The health committees seek curative serviceswith little emphasis on preventive and hygieneaspects.
Capacitate SMCs and WASH clubs forpromotion of hygiene practices includingaccessories for hand washing and improvedsanitation, etc.
Innovative approach of conditional cashtransfers for nutrition and health programmesshould be linked with improved sanitation and
Medium

491
Poor advocacy for public toilets by the localorganizations.
hygiene.
PATS plus approaches should be integratedinto local development initiatives and scalingup of nutrition programme of Government.
QUALITY Quality
Draft WinS quality standards in schools andminimum service delivery standards includingWASH in health facilities exist but not beingimplemented and monitored.
Develop and finalize WinS quality standardswith respective department of education andother stakeholders in the provinces.
Engage health departments to finalize andimplement WASH related standard at PHCfacility developed by Pakistan standards andquality control authority
High+
(Source: National Wash Data Diagnostic Study 2016. Ministry of Climate Change, Government of Pakistan)
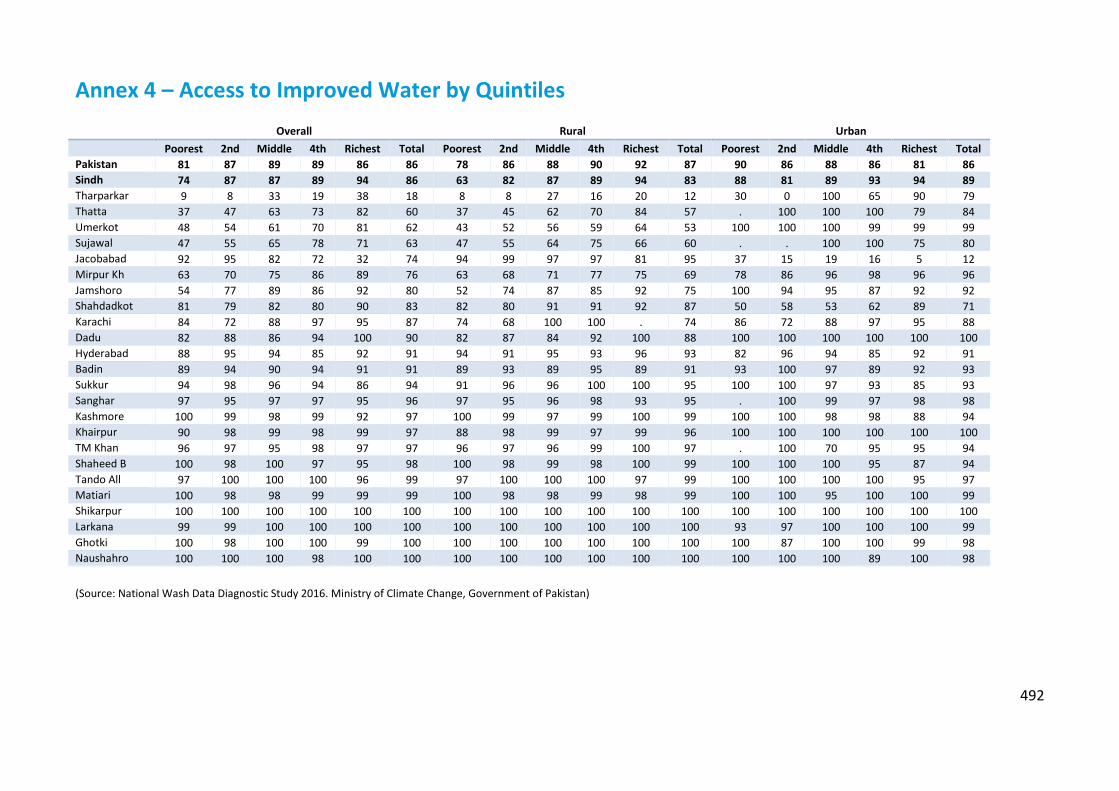
492
Annex 4 – Access to Improved Water by QuintilesOverall Rural Urban
Poorest 2nd Middle 4th Richest Total Poorest 2nd Middle 4th Richest Total Poorest 2nd Middle 4th Richest TotalPakistan 81 87 89 89 86 86 78 86 88 90 92 87 90 86 88 86 81 86Sindh 74 87 87 89 94 86 63 82 87 89 94 83 88 81 89 93 94 89Tharparkar 9 8 33 19 38 18 8 8 27 16 20 12 30 0 100 65 90 79Thatta 37 47 63 73 82 60 37 45 62 70 84 57 . 100 100 100 79 84Umerkot 48 54 61 70 81 62 43 52 56 59 64 53 100 100 100 99 99 99Sujawal 47 55 65 78 71 63 47 55 64 75 66 60 . . 100 100 75 80Jacobabad 92 95 82 72 32 74 94 99 97 97 81 95 37 15 19 16 5 12Mirpur Kh 63 70 75 86 89 76 63 68 71 77 75 69 78 86 96 98 96 96Jamshoro 54 77 89 86 92 80 52 74 87 85 92 75 100 94 95 87 92 92Shahdadkot 81 79 82 80 90 83 82 80 91 91 92 87 50 58 53 62 89 71Karachi 84 72 88 97 95 87 74 68 100 100 . 74 86 72 88 97 95 88Dadu 82 88 86 94 100 90 82 87 84 92 100 88 100 100 100 100 100 100Hyderabad 88 95 94 85 92 91 94 91 95 93 96 93 82 96 94 85 92 91Badin 89 94 90 94 91 91 89 93 89 95 89 91 93 100 97 89 92 93Sukkur 94 98 96 94 86 94 91 96 96 100 100 95 100 100 97 93 85 93Sanghar 97 95 97 97 95 96 97 95 96 98 93 95 . 100 99 97 98 98Kashmore 100 99 98 99 92 97 100 99 97 99 100 99 100 100 98 98 88 94Khairpur 90 98 99 98 99 97 88 98 99 97 99 96 100 100 100 100 100 100TM Khan 96 97 95 98 97 97 96 97 96 99 100 97 . 100 70 95 95 94Shaheed B 100 98 100 97 95 98 100 98 99 98 100 99 100 100 100 95 87 94Tando All 97 100 100 100 96 99 97 100 100 100 97 99 100 100 100 100 95 97Matiari 100 98 98 99 99 99 100 98 98 99 98 99 100 100 95 100 100 99Shikarpur 100 100 100 100 100 100 100 100 100 100 100 100 100 100 100 100 100 100Larkana 99 99 100 100 100 100 100 100 100 100 100 100 93 97 100 100 100 99Ghotki 100 98 100 100 99 100 100 100 100 100 100 100 100 87 100 100 99 98Naushahro 100 100 100 98 100 100 100 100 100 100 100 100 100 100 100 89 100 98
(Source: National Wash Data Diagnostic Study 2016. Ministry of Climate Change, Government of Pakistan)

493
Annex 5 – Access to Piped Water by QuintilesArea Poorest Second Middle Fourth Richest TotalPakistan 9.9 21.0 24.9 36.4 32.5 25.2Sindh 6.0 19.0 37.6 59.1 58.0 35.6Shikarpur 2.7 1.8 0.5 0.0 0.0 0.9Larkana 0.0 1.2 0.0 0.5 2.3 0.9Jacobabad 0.9 0.9 2.1 0.8 2.3 1.4Kashmore 0.5 0.0 1.9 3.5 2.9 1.8Khairpur 2.4 1.7 0.0 2.6 8.6 3.2Tando Allah Yar 2.7 2.7 5.0 6.0 6.2 4.6Matiari 3.3 1.2 4.0 4.7 9.5 4.7Ghotki 2.6 2.8 4.6 4.5 11.4 5.1Tharparkar 1.1 0.4 2.2 1.9 21.1 5.4Tando Mohammad Khan 0.0 0.7 1.3 9.9 16.2 5.8Shaheed Benazir Abad 3.4 3.1 3.9 9.7 9.2 6.1Sanghar 0.0 0.0 10.9 14.0 6.1 6.6Shahdadkot 5.5 3.8 9.3 9.3 16.6 9.3Sujawal 0.7 1.9 0.8 9.9 32.0 10.0Naushahro Feroze 1.7 0.0 4.2 21.8 22.0 10.6Badin 3.2 5.5 6.5 12.7 27.1 11.5Dadu 5.7 4.0 12.7 19.6 31.7 15.6Umerkot 12.8 3.1 24.8 25.7 39.2 22.2Thatta 0.3 13.2 20.7 23.7 49.2 22.9Sukkur 11.5 20.9 21.7 28.2 39.1 24.1Mirpur Khas 2.6 6.7 19.4 39.2 61.9 27.0Jamshoro 21.6 37.4 53.0 53.7 58.3 45.6Hyderabad 27.0 69.0 70.2 64.3 71.7 60.3Karachi 79.2 64.8 84.3 94.8 87.8 81.9
(Source: National Wash Data Diagnostic Study 2016. Ministry of Climate Change, Government of Pakistan)
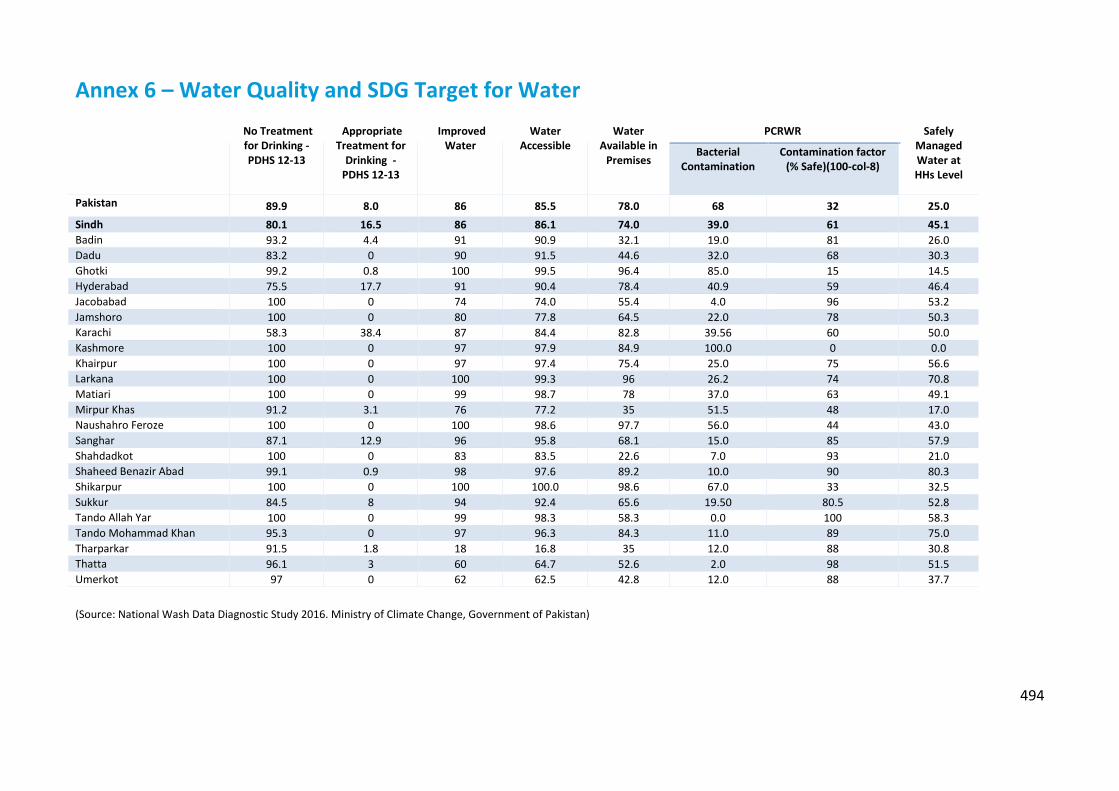
494
Annex 6 – Water Quality and SDG Target for WaterNo Treatmentfor Drinking -PDHS 12-13
AppropriateTreatment for
Drinking -PDHS 12-13
ImprovedWater
WaterAccessible
WaterAvailable in
Premises
PCRWR SafelyManagedWater atHHs Level
BacterialContamination
Contamination factor(% Safe)(100-col-8)
Pakistan 89.9 8.0 86 85.5 78.0 68 32 25.0Sindh 80.1 16.5 86 86.1 74.0 39.0 61 45.1Badin 93.2 4.4 91 90.9 32.1 19.0 81 26.0Dadu 83.2 0 90 91.5 44.6 32.0 68 30.3Ghotki 99.2 0.8 100 99.5 96.4 85.0 15 14.5Hyderabad 75.5 17.7 91 90.4 78.4 40.9 59 46.4Jacobabad 100 0 74 74.0 55.4 4.0 96 53.2Jamshoro 100 0 80 77.8 64.5 22.0 78 50.3Karachi 58.3 38.4 87 84.4 82.8 39.56 60 50.0Kashmore 100 0 97 97.9 84.9 100.0 0 0.0Khairpur 100 0 97 97.4 75.4 25.0 75 56.6Larkana 100 0 100 99.3 96 26.2 74 70.8Matiari 100 0 99 98.7 78 37.0 63 49.1Mirpur Khas 91.2 3.1 76 77.2 35 51.5 48 17.0Naushahro Feroze 100 0 100 98.6 97.7 56.0 44 43.0Sanghar 87.1 12.9 96 95.8 68.1 15.0 85 57.9Shahdadkot 100 0 83 83.5 22.6 7.0 93 21.0Shaheed Benazir Abad 99.1 0.9 98 97.6 89.2 10.0 90 80.3Shikarpur 100 0 100 100.0 98.6 67.0 33 32.5Sukkur 84.5 8 94 92.4 65.6 19.50 80.5 52.8Tando Allah Yar 100 0 99 98.3 58.3 0.0 100 58.3Tando Mohammad Khan 95.3 0 97 96.3 84.3 11.0 89 75.0Tharparkar 91.5 1.8 18 16.8 35 12.0 88 30.8Thatta 96.1 3 60 64.7 52.6 2.0 98 51.5Umerkot 97 0 62 62.5 42.8 12.0 88 37.7
(Source: National Wash Data Diagnostic Study 2016. Ministry of Climate Change, Government of Pakistan)

495
Annex 7 – Access to Improved Sanitation by QuintilesOverall Rural Urban
District Poorest 2nd Middle 4th Richest Total Poorest 2nd Middle 4th Richest Total Poorest 2nd Middle 4th Richest TotalPakistan 20 45 63 77 82 57 15 29 47 63 77 46 58 75 82 85 84 77Sindh 11 20 48 68 65 42 8 11 8 12 9 9 44 70 81 83 72 70Larkana 1 0 0 3 2 1 1 0 0 2 3 1 0 0 0 5 2 2Naushahro 3 0 0 0 2 1 0 0 0 0 0 0 17 0 0 0 5 5Dadu 0 1 1 3 1 1 0 1 1 3 0 1 0 0 0 0 1 1Shikarpur 0 1 0 2 8 2 0 1 0 1 5 1 0 0 0 5 12 6Matiari 1 1 2 3 5 2 1 0 2 5 6 3 0 6 0 0 2 2Sujawal 0 0 0 2 6 2 0 0 0 1 3 0 . . 0 10 9 9Tharparka 1 1 0 2 4 2 1 1 0 1 3 1 15 0 0 7 5 6Tando All 7 4 4 2 4 4 7 4 5 3 3 5 0 0 0 0 5 3Umerkot 6 1 6 5 4 5 4 1 4 5 1 3 31 0 22 5 8 11Jacobabad 2 5 6 5 12 6 1 5 6 6 20 6 9 0 9 2 8 7Badin 6 6 4 3 13 6 4 4 3 3 17 5 48 18 10 2 9 10Shaheed B 1 1 2 15 17 7 0 0 0 1 2 1 17 4 13 34 41 27Jamshoro 2 6 7 12 10 7 1 6 2 1 10 4 27 8 21 28 9 18Thatta 0 0 0 5 33 8 0 0 0 0 4 0 . 0 0 51 62 57Khairpur 5 7 11 4 16 9 5 9 9 7 10 8 6 0 16 0 22 10Sanghar 13 20 3 6 9 10 13 20 4 2 1 10 . 0 0 13 25 13Shahdadko 12 16 8 9 10 11 13 17 10 14 13 13 0 0 0 0 8 3Sukkur 14 9 8 5 19 11 19 14 19 23 14 17 5 2 2 1 19 7Tando Moh 18 17 13 8 15 14 18 18 14 10 13 15 . 0 0 0 16 11Kashmore 23 14 24 17 6 17 21 13 16 15 13 17 37 36 44 19 3 18Ghotki 25 19 17 9 17 17 26 19 17 8 19 18 0 20 15 10 15 14Hyderabad 17 21 20 26 21 21 23 23 0 7 6 19 9 21 22 26 21 21Mirpur Kh 33 30 25 25 31 29 33 27 20 12 0 22 41 61 49 44 48 48Karachi 91 97 98 100 100 97 56 58 67 61 . 57 99 100 99 100 100 99
(Source: National Wash Data Diagnostic Study 2016. Ministry of Climate Change, Government of Pakistan)

496
Annex 8 – No Toilet (Open Defecation) by QuintilesArea Poorest Second Middle Fourth Richest Total Literate IlliteratePakistan 39.8 17.7 6.7 2.2 0.9 13.0 6.2 20.9Sindh 24.7 9.5 1.8 0.4 0.6 7.5 3.0 12.7Jacobabad 22.7 7.3 4.7 1.1 0.8 7.6 2.9 9.5Kashmore 3.4 12.4 4.3 7.7 1.9 5.7 2.8 7.2Shikarpur 10.0 9.1 2.9 1.4 0.7 4.5 2.4 5.9Larkana 2.9 1.1 0.4 0.0 0.0 0.8 0.5 0.9Shahdadkot 1.4 0.3 0.6 1.9 0.8 1.1 0.7 1.5Sukkur 15.6 3.6 0.0 0.0 0.0 3.8 1.3 6.1Ghotki 7.0 4.5 1.2 0.8 0.0 2.6 1.6 3.5Khairpur 13.5 6.0 1.8 0.5 0.9 4.1 1.8 5.3Naushahro Feroze 21.3 3.4 1.4 0.0 0.0 4.6 2.0 9.6Shaheed Benazir Abad 10.3 3.8 2.9 1.6 0.0 3.3 1.9 4.7Dadu 28.9 6.6 0.6 0.0 8.1 8.4 6.0 15.2Jamshoro 50.8 24.5 8.5 4.9 0.7 16.8 6.4 24.8Hyderabad 24.3 0.4 0.7 0.0 0.0 5.3 1.1 10.0Tando Allah Yar 10.5 7.0 6.9 1.1 0.0 4.8 2.8 5.5Tando Mohammad Khan 11.8 15.8 6.1 4.2 1.2 7.7 3.2 8.4Matiari 43.2 31.5 15.9 12.1 9.5 22.2 12.9 28.3Badin 22.5 24.9 25.7 14.8 1.5 17.7 8.4 21.5Thatta 23.0 39.7 44.2 30.5 8.6 29.1 19.9 31.4Sujawal 32.2 34.0 55.0 54.8 25.1 40.8 22.2 46.4Sanghar 17.6 12.6 17.3 3.2 0.2 9.4 3.0 14.6Mirpur Khas 15.0 24.8 17.5 7.0 0.0 12.6 5.2 17.1Umerkot 62.0 57.4 45.9 28.5 7.3 39.5 23.9 46.7Tharparkar 42.8 57.5 32.6 47.3 19.6 43.8 34.9 48.5Karachi 0.9 0.7 0.4 0.0 0.0 0.4 0.3 0.8
(Source: National Wash Data Diagnostic Study 2016. Ministry of Climate Change, Government of Pakistan)
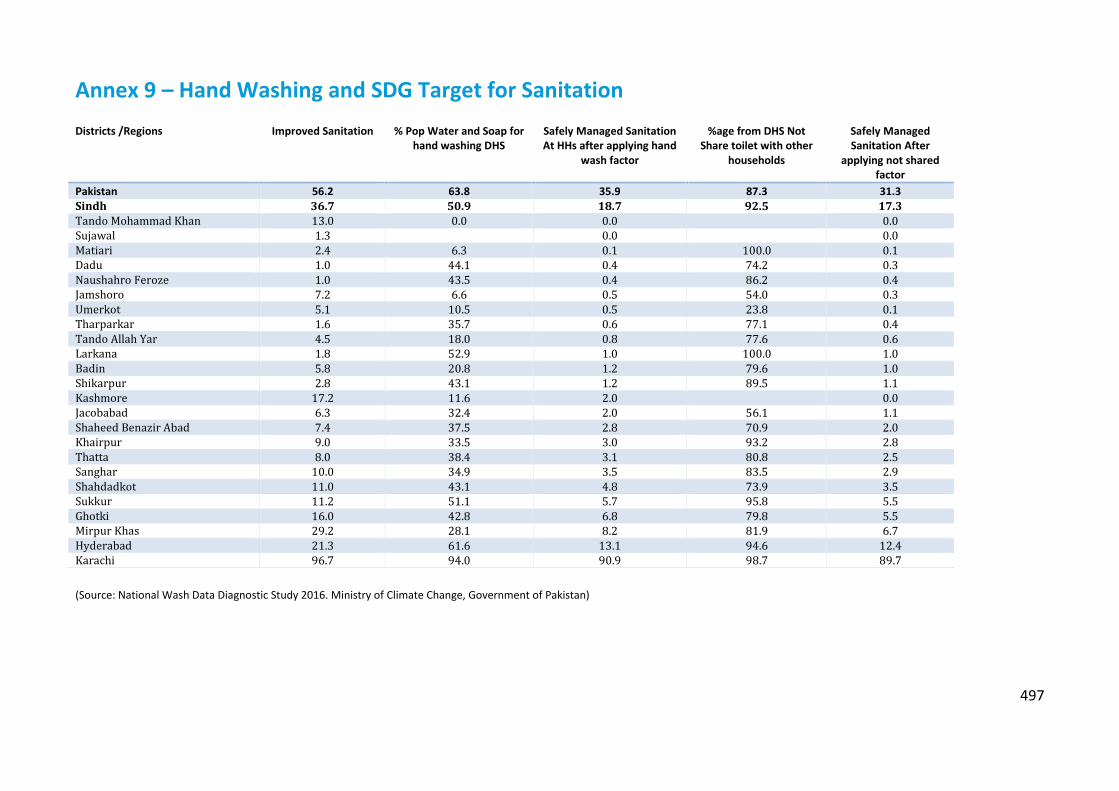
497
Annex 9 – Hand Washing and SDG Target for SanitationDistricts /Regions Improved Sanitation % Pop Water and Soap for
hand washing DHSSafely Managed SanitationAt HHs after applying hand
wash factor
%age from DHS NotShare toilet with other
households
Safely ManagedSanitation After
applying not sharedfactor
Pakistan 56.2 63.8 35.9 87.3 31.3Sindh 36.7 50.9 18.7 92.5 17.3Tando Mohammad Khan 13.0 0.0 0.0 0.0Sujawal 1.3 0.0 0.0Matiari 2.4 6.3 0.1 100.0 0.1Dadu 1.0 44.1 0.4 74.2 0.3Naushahro Feroze 1.0 43.5 0.4 86.2 0.4Jamshoro 7.2 6.6 0.5 54.0 0.3Umerkot 5.1 10.5 0.5 23.8 0.1Tharparkar 1.6 35.7 0.6 77.1 0.4Tando Allah Yar 4.5 18.0 0.8 77.6 0.6Larkana 1.8 52.9 1.0 100.0 1.0Badin 5.8 20.8 1.2 79.6 1.0Shikarpur 2.8 43.1 1.2 89.5 1.1Kashmore 17.2 11.6 2.0 0.0Jacobabad 6.3 32.4 2.0 56.1 1.1Shaheed Benazir Abad 7.4 37.5 2.8 70.9 2.0Khairpur 9.0 33.5 3.0 93.2 2.8Thatta 8.0 38.4 3.1 80.8 2.5Sanghar 10.0 34.9 3.5 83.5 2.9Shahdadkot 11.0 43.1 4.8 73.9 3.5Sukkur 11.2 51.1 5.7 95.8 5.5Ghotki 16.0 42.8 6.8 79.8 5.5Mirpur Khas 29.2 28.1 8.2 81.9 6.7Hyderabad 21.3 61.6 13.1 94.6 12.4Karachi 96.7 94.0 90.9 98.7 89.7(Source: National Wash Data Diagnostic Study 2016. Ministry of Climate Change, Government of Pakistan)
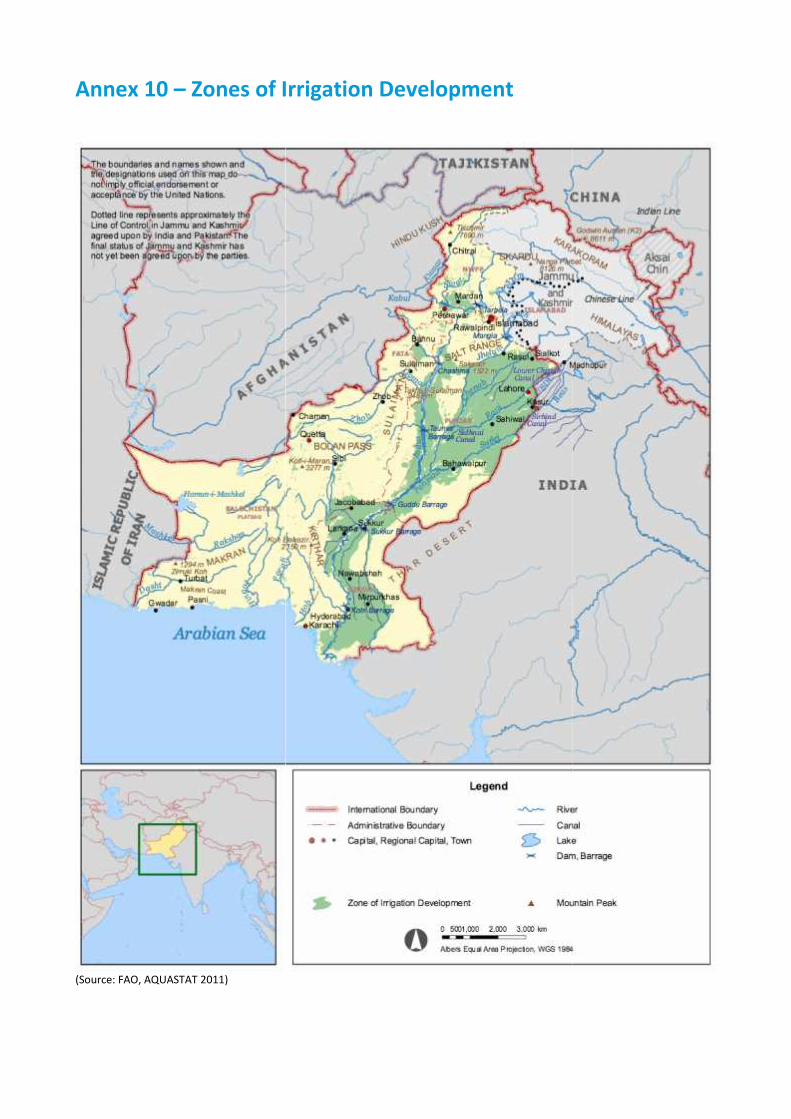
Annex 10 – Zones of Irrigation Development
(Source: FAO, AQUASTAT 2011)
Annex 10 – Zones of Irrigation Development
(Source: FAO, AQUASTAT 2011)
Annex 10 – Zones of Irrigation Development
(Source: FAO, AQUASTAT 2011)

499
Annex 11 – Zones of Salinity and Water Logging
(Source: Land use Atlas of Pakistan, 2009. Ministry of Environment, Government of Pakistan)
499
Annex 11 – Zones of Salinity and Water Logging
(Source: Land use Atlas of Pakistan, 2009. Ministry of Environment, Government of Pakistan)
499
Annex 11 – Zones of Salinity and Water Logging
(Source: Land use Atlas of Pakistan, 2009. Ministry of Environment, Government of Pakistan)

500
Annex 12 – Proposed Water Reservoirs for Karachi
(Source: Karachi Strategic Development Plan 2020. Master Plan Group of Offices, City District Government Karachi)
500
Annex 12 – Proposed Water Reservoirs for Karachi
(Source: Karachi Strategic Development Plan 2020. Master Plan Group of Offices, City District Government Karachi)
500
Annex 12 – Proposed Water Reservoirs for Karachi
(Source: Karachi Strategic Development Plan 2020. Master Plan Group of Offices, City District Government Karachi)

501
Annex 13 – Proposed Sewage Treatment Plants in Karachi
(Source: Karachi Strategic Development Plan 2020. Master Plan Group of Offices, City District Government Karachi)
501
Annex 13 – Proposed Sewage Treatment Plants in Karachi
(Source: Karachi Strategic Development Plan 2020. Master Plan Group of Offices, City District Government Karachi)
501
Annex 13 – Proposed Sewage Treatment Plants in Karachi
(Source: Karachi Strategic Development Plan 2020. Master Plan Group of Offices, City District Government Karachi)
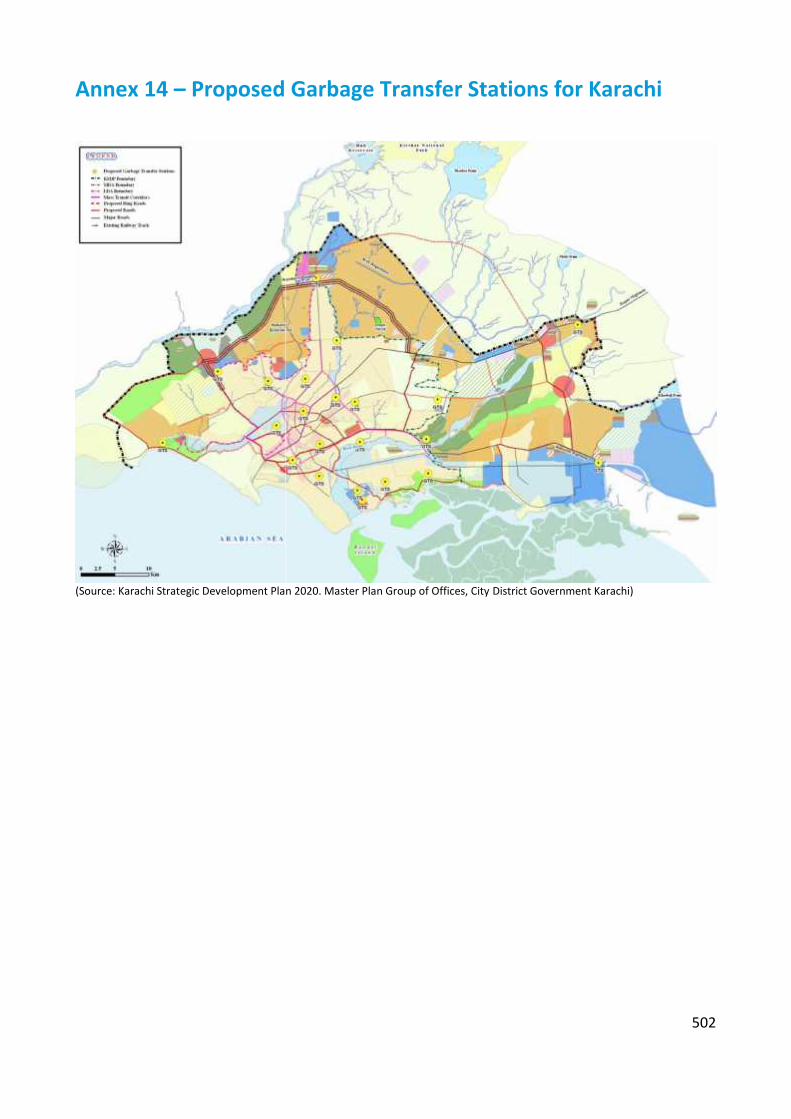
502
Annex 14 – Proposed Garbage Transfer Stations for Karachi
(Source: Karachi Strategic Development Plan 2020. Master Plan Group of Offices, City District Government Karachi)
502
Annex 14 – Proposed Garbage Transfer Stations for Karachi
(Source: Karachi Strategic Development Plan 2020. Master Plan Group of Offices, City District Government Karachi)
502
Annex 14 – Proposed Garbage Transfer Stations for Karachi
(Source: Karachi Strategic Development Plan 2020. Master Plan Group of Offices, City District Government Karachi)

Annex 15 – Stakeholder Analysis
Stakeholder Interviews
As part of the consultation process to develop the Sindh Sector Development Plan for WASH,several key stakeholders were consulted. The synthesis from this process is provided below.
Pakistan Council for Research in Water Resources
Pakistan Council of Research in Water Resources (PCRWR) is an apex autonomous researchorganisation established with the objective to conduct, organise, coordinate and promoteresearch in all aspects of water resources. PCRWR was established in 1964, under a resolution andnamed as Irrigation, Drainage and Flood Control Research Council (IDFCRC) under the Ministry ofNatural Resources. It was brought under the control of Ministry of Science and Technology in1970. The Council was renamed as Pakistan Council of Research in Water Resources (PCRWR) in1985. Since its inception, PCRWR has played its role as a national research organization byundertaking and promoting applied as well as basic research in various disciplines of water sector,more specifically, irrigation, drainage, surface and groundwater management, groundwaterrecharge, watershed management, desertification control, rainwater harvesting, , water qualityassessment and monitoring, drinking water, industrial water, sewerage management anddevelopment of innovative water resource management, conservation and quality improvementtechnologies, etc.
The PCRWR is mandated to conduct, organise, co-ordinate and promote research in all fields ofwater resources engineering, planning and management, so as to optimally use the available landand water resources and to help achieve sustainability in the agricultural sector.
The following key challenges were identified and recommendations made during the consultation.
Challenges Inadequate water quality monitoring mechanism Poor dissemination of available knowledge (huge water quality data with PCRWR) among
professionals for informed decision making Vast area of Sindh (about two-thirds) has brackish groundwater leading to no alternatives but
costly surface water schemes Low priority of government on health and hygiene There is no check on effluent disposal into canals. The water in canals may be used for drinking
and other household purposes in the downstream. This practice may have huge health impacts
Recommendations There is a need to take informed decisions in implementing water supply schemes while
keeping water quality data in view Water conservation techniques should be promoted particularly rain water harvesting Low cost technological solutions need to be developed and adopted (indigenous bio-sand
filters and arsenic removal filters) for rural areas Health and hygiene awareness should be made part of every scheme
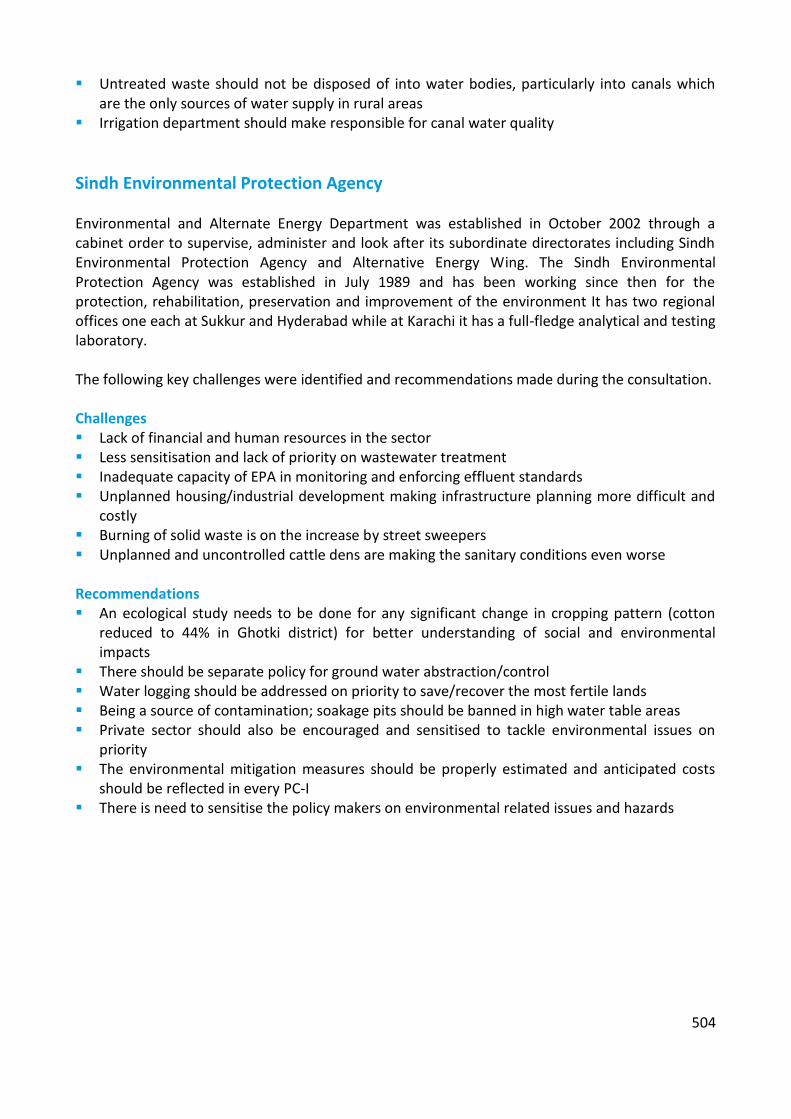
504
Untreated waste should not be disposed of into water bodies, particularly into canals whichare the only sources of water supply in rural areas
Irrigation department should make responsible for canal water quality
Sindh Environmental Protection Agency
Environmental and Alternate Energy Department was established in October 2002 through acabinet order to supervise, administer and look after its subordinate directorates including SindhEnvironmental Protection Agency and Alternative Energy Wing. The Sindh EnvironmentalProtection Agency was established in July 1989 and has been working since then for theprotection, rehabilitation, preservation and improvement of the environment It has two regionaloffices one each at Sukkur and Hyderabad while at Karachi it has a full-fledge analytical and testinglaboratory.
The following key challenges were identified and recommendations made during the consultation.
Challenges Lack of financial and human resources in the sector Less sensitisation and lack of priority on wastewater treatment Inadequate capacity of EPA in monitoring and enforcing effluent standards Unplanned housing/industrial development making infrastructure planning more difficult and
costly Burning of solid waste is on the increase by street sweepers Unplanned and uncontrolled cattle dens are making the sanitary conditions even worse
Recommendations An ecological study needs to be done for any significant change in cropping pattern (cotton
reduced to 44% in Ghotki district) for better understanding of social and environmentalimpacts
There should be separate policy for ground water abstraction/control Water logging should be addressed on priority to save/recover the most fertile lands Being a source of contamination; soakage pits should be banned in high water table areas Private sector should also be encouraged and sensitised to tackle environmental issues on
priority The environmental mitigation measures should be properly estimated and anticipated costs
should be reflected in every PC-I There is need to sensitise the policy makers on environmental related issues and hazards
505
Sindh Planning and Development and Special Initiatives Department
The P&DD is the main planning department for the Government of Sindh.
The following key challenges were identified and recommendations made during the consultation.
Challenges Capacity issue of professionals in the sector Inadequate sensitisation and lack of ownership in development works General tendency of over-design of schemes and thereby increasing costs Project management is a critical issue in designing and executing water and sanitation schemes Casual approach to project costing and planning as reflected through PC-1s (missing drawings,
implementation plan and beneficiaries etc)
Recommendations Avoid duplication of efforts and resources by improving coordination among key players in the
sector The schemes should be demand driven and should be well within the local context The schemes involving lower O&M costs should be preferred A workable implementation plan should be a part of every scheme design (PC-1) to adequately
monitor progress Due to scarce financial resources; water and sanitation schemes need to design and
implement wisely and optimally
Public Health Engineering and Rural Development Department
This is the main stakeholder responsible for execution of rural water supply and sanitationschemes.
The following key challenges were identified and recommendations made during the consultation.
Challenges Non-availability of potable ground water in most of Sindh Inadequate allocation of funds for O&M of completed schemes Inadequate capacity of local government department – both technical and financial- for taking
over water supply and sanitation schemes completed and implemented by PHED Due to absence of electric connection, many completed water supply and sanitation schemes
are non-functional
Recommendations There should be one organisation / department for both project execution and post
completion O&M The schemes should be so designed that these could be completed in one year. The release of
funds in subsequent years has always been a problem The funds allocated for a scheme should be made available (released) at the start of the fiscal
year

506
Electric connection for water supply and sanitation schemes should be given on priority basis.No scheme should be approved without approval of required electric connection
There is need to establish a proper PHE wing in LG&RD having a pool of good engineers(transferred from PHED or newly recruited)
Adequate funds should be allocated for O&M of the completed schemes
Directorate of Urban Policy and Strategic Planning
Government of Sindh has established the Directorate of Urban Policy and Strategic Planning(UP&SP) in the Planning and Development Department, with the mandate to plan for sustainableurban development in the province to realise the objectives of economic growth, plannedinfrastructure development - dictated by a strong policy and regulatory regime and to also addressinequities caused by intra-urban and regional disparities. In order to achieve these objectives theDirectorate has adopted a multi-pronged approach that includes preparation of policies, plans andprojects - as well as discourse with the citizenry and the intellectuals.
The following key challenges were identified and recommendations made during the consultation.
Challenges Roles and responsibilities at various levels are vague and duplicating leading to diffused
accountability The lack of capacity of public sector officials in taking right decisions and setting priorities for
budget allocations Water and sanitation tariffs are too low to cover cost of service delivery that in turn leads to
further deterioration of services
Recommendations In the Sindh context, untreated wastewater, currently being disposed of into sea, may also be
looked into while developing WASH sector policies Instead of new schemes, budget allocation for on-goings schemes should be done on priority
to ensure timely completion and to avoid cost over-run Water and sanitation sector policy should be synergetic with other related policies particular
the health policies for having consolidated effects Sustainable Development Goals (SDGs) should be accounted for while developing Water and
sanitation sector policies The O&M mechanism of Water and sanitation schemes need to be strengthened as brick and
mortar type schemes are normally the priority of policy makers Emphasis should also be taken to complete PC-IV proforma which provides a sound basis to
allocate proper O&M funds for a completed scheme No new scheme should be included in ADP for a particular area unless and until on-going
schemes are completed Monitoring mechanism needs to be strengthened for effective development

507
Education Department – Reform Support Unit
The establishment of Reform Support Unit (RSU) was conceptualised as a means to build theinstitutional capability of the Department of Education. The very rationale of this programme is tostreamline the existing edifice of education delivery and provide policy inputs for futureadvancement of education growth both in terms of access and quality. The institutional structureof RSU comprises of three wings: policy wing; monitoring and evaluation wing; and EMIS wing. Thepolicy wing provides inputs for policy formulation and develops institutional memory of thedepartment. The monitoring and evaluation wing develops reporting mechanisms as well asconducts evaluation of different interventions of Department of Education. The results ofevaluations are ploughed back into policy. The existing structure of the Sindh EducationManagement System (SEMIS) has been made an integral part of the RSU as a first step to have areliable and timely data for further policy formulation. The RSU is also envisioned as a forum toprovide a platform for donor coordination as a measure to synchronise different donor's resourcesand efforts in a consolidated vision of educational excellence.
The following key challenges were identified and recommendations made during the consultation.
Challenges Inadequate funding resources for the sector A large majority of schools are without water and sanitation facilities Wrong priorities for allocation of development funds Capacity constraints in the water and sanitation sector
Recommendations Low cost technological models should be introduced, particularly for rural schools Aggressive awareness campaign should be launched regarding health impacts of poor
sanitation and absence of proper hygiene practices Teaching curricula should be included in health and hygiene issues Water and sanitation sector should not go in isolation rather linkages should be developed
with other sectors particularly health and education
Karachi Water Supply and Sewerage Board
The Karachi Water & Sewerage Board is a service based consumer oriented organisationresponsible for production, transmission and distribution of potable water to the citizens ofKarachi, managing sewerage systems within the city to ensure hygienic environment,development of scheme to cover short falls in services and collection of revenues for sustainedeconomic viability.
The following key challenges were identified and recommendations made during the consultation.
Challenges Huge population influx in Karachi from all over Pakistan; putting more pressure on available
water and sanitation services Ever widening demand and supply water gap in Karachi

508
Water quality is a big issue in Sindh, as most of the available ground water is brackish
Recommendations Karachi should be given separate water quota other than for Sindh; as it is termed as mini
Pakistan Climate change aspects need to be considered for all future developments in water and
sanitation Water utilities need to adapt climate smart measures in their planning More storage reservoirs and dams are needed to capture increased water flows as a result of
increased glacier melting Domestic and municipal water consumptions account for only 5% even then we are facing
scarcity. There is need to prioritise competitive water uses More than 90% of available water is being used for agriculture (irrigation) with centuries old
methods leading to huge losses. There is need to employ more water efficient irrigationmethods and to conserve water for other uses
Like water apportion award, we should have an interprovincial drinking water apportion award Wastewater recycling should be made on priority with needed treatment In rural areas we should introduce low cost wastewater solutions like floating gardens
(constructed wetlands) There is need to sensitise policy makers (politicians) on water and sanitation issues and
allocation of necessary funds and resources Water quality needs to be monitored on regular basis. Accordingly, a robust monitoring plan
should be developed at provincial level
Sindh Solid Waste Management Board
The Sindh Solid Waste Management Board was established under the The Sindh Solid WasteManagement Board Act, 2014 to provide for the establishment of a Board called as the “SindhSolid Waste Management Board” for the collection and disposal of solid and other waste in theProvince of Sindh.
The following key challenges were identified and recommendations made during the consultation.
Challenges Lack of will and dedication of public sector officials in efficient service delivery Wrong priority of funds allocation for development works Capacity constraints of water and sanitation professionals
Recommendations The overall goal should be to improve environment for uplifting quality of life Ideally solid waste management should be the purview of one entity dedicated for water and
sanitation services. But solid waste should be handled by a separate entity other than waterand sanitation service provider under the current circumstances
There should be dedicated water and sewerage board at each Administrative Division level(similar to KW&SB). As water and sanitation services have upstream (if water source is in otherdistrict) and downstream (wastewater is disposed into a water body) effect, it needs macrolevel management
509
The role of divisional boards would be to give policy and set directions. Whereas districtswould be responsible for actual service delivery
A separate section should be dedicated on solid waste in Sanitation Policy Adequate linkages should be suggested in policy with other areas (social, economic, health,
environment etc.)
North Sindh Urban Services Corporation
The North Sindh Urban Services Corporation has been established under the CompaniesOrdinance 1984 for the secondary cities of the Northern cluster of Sindh Province. This UrbanServices Corporation aims to aggregate participating Tehsil Municipal Administration’s (TMAs)water supply, waste water and solid waste management operation in a single institution toleverage economies of scale, introduce new skills and management, and increase focus onoperations, maintenance and financial management. Presently, NSUSC is being implemented in 7cities (Sukkur/New Sukkur, Rohri, Khairpur Mirs, Shikarpur, Larkana, Jacobabad and Ghotki).
The following key challenges were identified and recommendations made during the consultation.
Challenges Political Interference leading to compromised decision making Lack of capacity of sector officials Inadequate allocation of financial resources Insufficient machinery Water quality issue Lack of will among professionals and internal rift – impact negatively in achieving sector
targets and objectives
Recommendations Mass awareness is needed particularly for effective water and sanitation services particularly
for solid waste management Need to change the mind set of public – water and sanitation services are not free and need
cost recovery for sustainability and further improvement Sensitisation and awareness campaigns should make use of schools, notables and public
gatherings Improve water and sanitation tariff to cover at least operational costs Discourage free or even subsidised WSS services Seek customised technological solutions to meet local requirements Establish customers’ care centre for quickly addressing public complaints Develop and implement SOPs for each process/step in WSS service delivery Involve /engage press and media proactively for disseminating of development activities,
constraints and seek public support

510
Cantonment Board Malir
Malir Cantonment is administratively governed through "Cantonment Board Malir", a Local Bodyby its charter, under the jurisdiction of Ministry of Defence, through the Military Lands andCantonment Department, headed by a Director General. The governance of the CantonmentBoard derives authority from the Cantonment Act, 1924 and rules and regulations madethereunder. The cantonment maintains its own infrastructure of water supply, electricity and isoutside the jurisdiction of City District Government Karachi.
The following key challenges were identified and recommendations made during the consultation.
Challenges No water pricing mechanism Lack of solid waste dumping sites No or inadequate wastewater treatment
Recommendations Wastewater reuse needs to be encouraged after proper treatment Cost recovery of water and sanitation services should be ensured Close monitoring and keen follow up of development works should be made on priority Coordination mechanism among various water and sanitation sector stakeholders should be
improved for expeditious outputs Dedicated dumping sites should be made available for solid waste disposal Water quality monitoring should be made a part of the overall development agenda Filter plants need to be installed in areas where normal water supply schemes are not
economically feasible
Hyderabad Water and Sanitation Agency
Hyderabad WASA is the main utility for Hyderabad City.
The following key challenges were identified and recommendations made during the consultation.
Challenges Haphazard development in absence of any master plan at city level Low cost recovery leading towards ever deteriorating water and sanitation services Lack of awareness among consumers towards better use of water and sanitation services,
(leakages, garbage dumping in sewers, illegal water connections and pumping through mainlines etc.)
The development projects are politically motivated thus jeopardise or at least compromise thetrue demand
Change of government is detrimental to on-going schemes; as the new government has itsown priorities. Resultantly the on-going schemes are inordinately delayed and in most casesare cost over-runs

511
Recommendations City wide master planning needs to done The funding once allocated for a scheme should be properly ensured The on-going schemes should have priority in receipt of development funds Adequate funds should be allocated for water treatment (chemicals) facilities to ensure supply
of potable water to consumers Public awareness on water and sanitation services, cost recovery and other related issues
should be aggressively followed Dignitaries should be involved for effective dissemination of key motivating messages At national level, the awareness campaign (like of polio) should be launched particularly for
water conservation, health impacts and on cost recovery Water metering should be promoted as a critical demand management tool Water and sanitation sector should be reformed at city level by separating and designating
responsibilities of Production, Distribution and Maintenance to three different entities Capacity building of water professionals should be made on regular basis Cash crunched water utilities should be given bailout package by government to make them
financially self-sufficient Legal authority should be given to water utilities for enforcing its policy (illegal water and
sewer connections) and boosting cost recovery Consumers’ survey should be conducted on regular intervals to gauge the utilities outreach
and level of services Effluent should be treated on priority Water storage capacity should be increased Governance of water sector institutions should be improved for efficient services delivery
NED Engineering University of Engineering and Technology
The NED University of Engineering and Technology, was established in March 1977 under an Act ofthe Provincial Assembly of Sindh after upgrading of the former NED Government EngineeringCollege, which was set up in 1922. The NED University is thus one of the oldest institutions inPakistan for teaching and producing Engineering graduates.
The following key challenges were identified and recommendations made during the consultation.
Challenges Overexploitation of groundwater which is threatening the water balance Water scarcity forces migration to other places which are not yet water scarce areas but could
lead to further water stress Most of the water and sanitation infrastructure is old and hampering effective service delivery Irrational water pricing causes poor level of service and enhance corruption Most of water supply schemes are politically motivated rather than cope with the actual needs Water availability and demand gap is widening day by day due to increased population and
lack of proper planning
Recommendations Wastewater should be treated and managed at source for cost effectiveness

512
Pipe leakages should be addressed on priority; as these not only lead to huge wastage oftreated water but also a continuous source of pollutions in overall water supply network
Groundwater abstraction needs to be controlled More storage reservoirs and dams need to be built to adequately cater for variations in water
availability The water and sanitation management for urban and rural should be designed with respect to
social, cultural and economic context There is need to define a clear ownership of various water bodies for better monitoring of
water resources There should be a mechanism for regular technological updating and capacity building of
sector professionals Accountability needs to be strengthened at all levels Reduce discretionary powers as a policy measure High moral values need to be inculcated among people from all walks of life through
enhanced awareness and behavioural change campaigns There is need to raise awareness on current water challenges (scarcity, conservation and
climate change effect etc.) Systems should be so designed that water theft (through pumps and illegal connections) is
minimised Solid waste should be taken as a resource and accordingly be reused or recycled Introduce policy of award and penalty at all levels to promote accountability and efficient
service delivery
Mehran University of Engineering Technology
The Pakistan Centre for Advanced Studies in Water (PCAS-W) has been established at the MehranUniversity of Engineering and Technology (MUET) Jamshoro under the Cooperative Agreementsigned with USAID on Dec. 12, 2014 for five years. The USAID-funded Pakistan Centre forAdvanced Studies MUET in water is a state of the art and modern applied research centre. PCAS-Wis a world class education and applied research centre dedicated to resolving Pakistan’s watercrises through applied research, developing specialist human resources and technologies;academia-industry collaboration; and policy formulation. The centres will generate cost-effectiveand sustainable solutions to Pakistan’s challenges related to water and educating the nextgeneration of scientists, engineers, and policy makers through innovative academic programmesin water that are focused on applied research.
The following key challenges were identified and recommendations made during the consultation.
Challenges Water Quality is a serious issue and is being grossly neglected by concerned agencies. Water treatment measures are not adequate, particularly in water treatment plants, (case of
H-WASA), treatment process is being compromised (lesser degree of sedimentation,inadequate flocculation – adding no coagulant- and inappropriate filtration and absence ofchlorination). Such a situation is leading to serious health risks for the consumers
The machinery is in dilapidated situation due to no or deferred O&M There is no robust mechanism of monitoring and oversight There is need to improve accountability with proper check and balance arrangements in place

513
Insufficient cost recovery Embedded corruption in the system
Recommendations Rural urban migration – needs to be studied in context of push and pull factors as water is also
a push factor. Urban areas are already water stressed and any additional population influxcould further aggravate the situation
Water mapping in terms of its availability / scarcity needs to be done Population settlements should be adoptive of water availability /scarcity context Water governance needs to be strengthened Availability of water should be taken as a right and access should accordingly be universal (for
all) Increase water and sewerage tariff to cover operational expenditures Community Participation should be through the entire project cycle Raising awareness on water borne diseases and its linkage with provision of water and
sanitation services Mechanism should be in place for wider dissemination of R&D findings in the sector Promote low cost technologies in the sector In the context of growing water scarcity, wastewater re-cycling should be an option
National Rural Support Programme
Established in 1991, National Rural Support Programme (NRSP) is the largest Rural SupportProgramme in the country in terms of outreach, staff and development activities. It is a not forprofit organisation registered under Section 42 of Companies Ordinance 1984.
NRSP's mandate is to alleviate poverty by harnessing people's potential and undertakedevelopment activities in Pakistan. It has a presence in 61 Districts in all the four Provincesincluding Azad Jammu and Kashmir through Regional Offices and Field Offices. NRSP is currentlyworking with more than 2.9 million poor households organised into a network of 185,766Community Organisations. With sustained incremental growth, it is emerging as Pakistan's leadingengine for poverty reduction and rural development.
The following key challenges were identified and recommendations made during the consultation.
Challenges Water quality is a major issue in Sindh context Lack of coordination among various actors in the sector; leading to overlapping and duplication
of resources and efforts There is no mechanism to monitor the sector issues and progress in a coherent way Inadequate low cost solution in rural localities particularly in sparsely populated areas
Recommendations Health and Hygiene should be an integral part of all schemes Exclusive yet mandatory funds need to be allocated for health and hygiene (soft component) in
water and sanitation schemes

514
An integrated approach (water, sanitation, health and hygiene) should be adopted; as schemesmeeting such criteria appeared to be more sustainable and long lasting
IEC material needs to be developed for use of improved quality water Behaviour change is a key in sanitation and solid waste management ODF needs to be promoted by sensitising communities on related health issues At district level, a water and sanitation coordination committee should be formulated to assess
the need, monitor progress in sector and liaise with/ among participating organisations There should be central database for the sector to know precisely who is doing what and
where For civil society organisations working in the sector; increased level of government support is
critical for efficient service delivery More effective tools (school teachers, LHVs) need to be developed for sensitising the
communities on health and hygiene related issues Softer issues should be promoted through smart messages in the media
Sindh Rural Support Organisation
Established in 2003, the Sindh Rural Support Organisation (SRSO) is the major Rural SupportProgramme in Northern Sindh. It is a not-for-profit organisation registered under Section 42 of theCompanies Ordinance 1984. SRSO is present in 10 districts, namely Sukkur, Khairpur, Ghotki,Nausharo Feroze, Shaheed Banazirabad, Shikarpur, Jacobabad, Larkana, Kashmore-Kandhkot, andQambar-Shadadkot. The mandate of SRSO is to alleviate poverty by harnessing the people’spotential and to undertake development activities in Sindh.
The following key challenges were identified and recommendations made during the consultation.
Challenges Poor implementation of policy, developmental activities Lack of horizontal and vertical linkages in the water and sanitation sector Lack of consultation with key stakeholders in development planning Politically motivated schemes having lesser impact in overall service coverage Inadequate government writ in implementing its policy measures
Recommendations Community involvement and their active participation are critical for success of projects Communities’ voice could be integrated through community based organisations There is a need to formulate a rural development policy All developments in rural areas should broadly follow the principles and guidelines given in
policy documents Village Development Plans (VDPs) should be prepared for each village and should adhere to
the general guidelines given in the rural development policy Channel more financial resources in the water and sanitation sector Discourage/avoid construction of open drains as these are a source of pollution and
contamination Government officers should be given a tenure posting to avoid political influence (no threat of
transfer) and promote accountability (have to leave the job after certain time)

515
Capacity building of professionals involved in the sector is of paramount importance andrequires due attention
Sector planning should be done at national/provincial level and all development should followthe macro level planning
Hygiene is a critical issue and community should be sensitised in the context of health impacts Governance in the sector needs to be improved by giving civil society organisations a more
proactive role in planning, monitoring and execution of public sector projects Access to information for public sector projects should be encouraged /promoted
Research and Development Foundation
The organisation was established and registered in the year 2002 at Hyderabad with the objectiveto innovate social solutions against long standing problems through action research and creatingimpacts on lives and livelihoods of the less privileged sections of the society. The organisation wasestablished by young and energetic development professionals who believed in values oftransparency, accountability and equality. The organisation started its operations as a volunteereffort in its formative phase but later on since 2008 it started implement development projects incollaboration with funding agencies and humanitarian organisations. Hence by 2008, a formalstructure of the organisation evolved and professional staff were hired to carry out the projects.The organisation is being looked after by an elected Board of Directors.
The following key challenges were identified and recommendations made during the consultation.
Challenges Brackish ground water in almost two-thirds of the province makes water supply schemes costly Communities are forced to access brackish water in the absence of any water supply scheme Poor consultation with communities in case of public sector schemes Most of the sector schemes are not demand driven; as such more likely to fail when these are
handed over to communities for post completion O&M
Recommendations Promote low cost technologies like bio-sand filters Solar based technologies should be introduced in rural areas to reduce operational cost and
achieve sustainability of schemes ODF sanitation approach should be intensified CLTS may be strengthened and consolidated More resources should be injected in the sector
HANDS
Health and Nutrition Development Society (HANDS) was founded in 1979.HANDS has evolvedsince then as one of the largest Non-Profit Organisation of the country with an integrateddevelopment model. HANDS has a network of 30 offices across the country and has access tomore than 16.2 million population in nearly 20,274 villages/settlements in 34 districts of Pakistan.

516
HANDS strength is 18 volunteer Board Members, more than 1502 full time staff and nearly onemillion community based volunteers of 5205 medium and small size organisations.
The following key challenges were identified and recommendations made during the consultation.
Challenges In urban areas, slums and poor settlements are often neglected for water and sanitation
services Very low coverage of sanitation in rural areas of Sindh has huge health implications Water utilities lack in needed policy and regulation with regards to cover slum areas
Recommendations Water and sanitation sector should also not only be capable of responding to disasters but
should also get prepared for such events In rural areas CLTS model should be promoted Low cost sanitation models should be designed and implemented for universal sanitation
coverage Every water utility should have an exclusive policy to expand its outreach in slums and katchi
abadies Water and sanitation services should be provided in an integrated way (water, sanitation, solid
waste and wastewater treatment) where possible The sector plans and policy should have a strong monitoring mechanism to gauge progress and
to take corrective measures during course of implementation
WaterAid Pakistan
WaterAid launched its programme in Pakistan in 2006. It has helped marginalised communitiesestablish sustainable water supplies and sanitation services. It has also influenced governmentpolicy-makers to serve the interests of vulnerable people. WaterAid's strategy in Pakistan is towork through local partners to improve hygiene behaviour and ensure people have access towater supply and sanitation services, with a special emphasis on innovative approaches,participatory methods, women and other vulnerable groups, hygiene promotion, monitoring andevaluation, and sustainability. WaterAid is working with seven partner organisations in sevendistricts of Sindh, Punjab and Khyber Pakhtunkhwa to bring change in the lives of those livingwithout safe water and sanitation.
The following key challenges were identified and recommendations made during the consultation.
Challenges Monitoring of water quality is a critical issue and often neglected despite huge health impacts Health and hygiene do not get proper attention in water and sanitation sector Demand management by service provider does not get proper attention leading to water
scarcity in already water stressed environment
Recommendations Water Security mapping needs to be done and updated periodically

517
Water conservation technologies should be promoted (rainwater harvesting, ground waterrecharging etc.)
Donors should build capacity of the government with particular focus on policy and reformingthe sector
An integrated approach needs to be followed in the water and sanitation sector. End of pipesolutions (effluent treatment) should also get priority in overall development agenda/ planning
District level water and sanitation coordination mechanism needs to be developed fordeveloping synergies and avoiding overlapping of resources and efforts
Strengthen implementation monitoring mechanism for development effectiveness Central database for water and sanitation sector need to be maintained at district/provincial
level for generating updated reports There should be time bound targets at all levels (policy, implementation, service providers,
increasing access etc.)
Plan Pakistan
Plan is an International, Child Centred Community Development Organisation with no religious,political, or government affiliation. Plan Pakistan is a member of its global network of 66 Countriesworking with 10 million children, women and men. Plan Pakistan began its programmes inPakistan in 1997 and its work covers around 150 communities, benefiting about 50,000 childrenunder the areas of health, education, livelihood, child and gender rights, and disaster riskreduction and response. Plan implements its programmes and projects at the grassroots level inHealth, Education, Water and Sanitation, Income Generation, and Building Relations.
The following key challenges were identified and recommendations made during the consultation.
Challenges Lack of capacity of services provider in synergetic planning and implementation Absence (or insufficient) of central database of the water and sanitation sector Negligible attention on wastewater treatment Lack of support funds (for logistics, travel, equipment, stationery etc.) in public sector entities,
leading to inefficient services delivery Ambiguity and confusion in sector jargons (ODF, CLTS, PATS etc.)
Recommendations Need to develop workable coordination among sector actors particularly among donors CLTS approach should be effectively followed for expanding access to safe sanitation services The villages that have successfully achieved ODF status should be given water supply schemes
on priority as an incentive There is a need to develop ground water monitoring to regulate abstraction of this scarce
resource Water and sanitation sector should be viewed in totality (keeping in view, other developments,
environment and social aspects) for sustainability of interventions Encourage re-use of water through treatment ODF campaign should be followed religiously

518
Appropriate tools should be employed for awareness raising and behaviour change; theseinclude use of LHWs, School teachers, UC Secretaries, and children. The capacity shouldaccordingly be built for persons involved
BHU doctors should also be involved in ODF campaign; as they can better highlight healthimpacts of poor sanitation conditions
A dedicated unit should be established at provincial level to monitor progress of milestonesidentified in water and sanitation policy/strategy
Uniformity and consistency – with clear definitions- should be made in sector Acronyms toavoid confusion
Consistent approach (with similar incentives, subsidies etc.) should be followed, at least in thesame district; in implementing various programmes in an area to avoid implementationconfusion
Academia should involve in the water and sanitation sector particularly for finding low costsolutions for water, sanitation and wastewater treatment
Asian Development Bank
The Asian Development Bank (ADB) was conceived in the early 1960s as a financial institution thatwould be Asian in character and foster economic growth and cooperation in one of the poorestregions in the world. ADB assists its members, and partners, by providing loans, technicalassistance, grants, and equity investments to promote social and economic development.
The following key challenges were identified and recommendations made during the consultation.
Challenges Diffused responsibilities in the sector leading to inefficient services and lack of accountability Absence of any anchor/ focal department at district level (to whom interested parties/donors
could directly interact) Lack of political will to implement the development agenda Wrong priorities in allocation of funds and resources Capacity building gaps among the policy makers, institutions and civil society organisations
Recommendations Overall management/ governance of water and sanitation sector needs to be strengthened In urban context, provision of water and sanitation services should be well integrated with the
overall urban sector planning. Sector development in isolation would be bound to fail orineffective
Political leadership needs to be sensitised on water and sanitation sector’s needs andrequirements through awareness raising, dialogue and exposure visits
Need to find political champions among the policy makers and critical mass within the systemto bring required change in a sustainable fashion
Different governance/ management structure for rural and urban areas in water and sanitationsector should be kept in mind while doing development planning
A synergetic approach should be followed in policy measures for water and sanitation sector(Considering urban planning, environment, education and other related sectors)
Performance benchmarking in the sector needs to be introduced. Accordingly, the sectorinstitutions should be rewarded/penalised

519
Monitoring of sector should be strengthened by introducing crispy and measureable indicators An output based budgeting needs to be done Academia also be sensitised to play its active role in water and sanitation sector through R&D
and technological innovations
Focus Group Discussions
Over 50 Focus Group Discussions (FGDs) were held with students, teachers, local councillors,community members, LHWs etc to gauge their views about water and sanitation in the province.These FGDs were undertaken in Hyderabad, Sanghar, Dadu and Gadap Town in Karachi.
The following key themes emerged from the FGDs.
WaterA mixed trend of piped water supply and ground water pumping has been observed. Cities i.e.Hyderabad, Karachi and some areas of Dadu have water supply connections. However,towns/small cities i.e. Mithi, Shahdad Pur (Sanghar) rely entirely on ground water. In rural areas,ground water is the major source, while dug wells (particularly in Tharparkar) and canal water areother sources. Complaints of old laid water supply lines; water contamination (bad smell, tasteand colour) and brackish water are very common. Filtration plants have been installed in big citiesand towns. However, timely maintenance (Cartridge replacement) of these filters remains aquestion mark. Furthermore, delay in construction of development projects has also observed i.e.water filtration plant in village Tando Fazal, Hyderabad is under construction since the last one andhalf year and, while a city level filtration plant in Shahdadpur Sanghar is under construction sincethe last two years. A trend of purchasing drinking water at the rate of PKR 20-30 per can (10-20litres) has also been observed in urban areas. Hepatitis and jaundice diseases are found in all ofthe interviewed communities.
Sewerage/DrainagePiped sewerage is available in most of the urban areas of Karachi, Hyderabad, Dadu andShadadpur (Sanghar). However, there are common issues of overflowing of sewerage gutters.There are two major factors that lead to this situation 1) desilting of gutter/sewerage line has notbeen performed regularly; 2) natural gravity is not available for sewage flow and lines areconnected with sewerage wells that throw water to the main trunk line by way of a motor pump -however, due to load-shedding or disconnection (because of over-dues) of electricity from motor-pumps, this system is not functional. Furthermore, open drains exist in some areas of Dadu,Shadadpur (Sanghar) and Mithi, and in entire rural areas. However, in urban areas drains arepaved while in rural areas unpaved drains are common. It is generally observed that waste waterflows directly to canals without any treatment in urban areas, while in rural areas it is flows to thestreets (if drain system doesn’t exist) or to the fields (if drain system exists).
ToiletsHousehold toilets are available in almost all of the urban areas except urban slums (BhagriMohalla Dadu). Majority of these toilets are connected directly with sewerage lines or open
520
drains. However, toilets connected with septic tanks also exist in urban areas. In larger villages,household level toilets exist above 50%, while in smaller villages/hamlets the concept ofhousehold toilet is not common or its need appreciated. The members of households withouttoilets defecate in the open. Furthermore, toilets in rural areas are mostly connected withunpaved pits and infrequently with septic tanks.
Solid Waste ManagementUrban areas have been served with solid waste management services by the Government.However, non availability of street level dumping stations or trolleys are very common complaints.Generally, garbage is dumped in empty plots from where it is collected in a range of time between2 days to a month. Furthermore, regular sweeping of streets is very uncommon in smallcities/towns i.e. Dadu and Mithi. There are no solid waste services in rural areas. In larger villages,communities themselves allot a place for dumping solid waste and very occasionally burn it.
Hand WashingRegular hand washing with soap before eating and after toilet is not above 50%. However,washing hands with water only or occasionally hand washing with soap is common. In FGDs withLHWs, it was revealed that hand washing before breastfeeding by lactating women is notcommon.
GovernanceGenerally, the community doesn’t show their satisfaction from WASH services by the government.However, the newly elected local government representatives prioritise WASH issues. But theseelected representatives are not clear about their role as per the SLGA 2013.
NGOs InitiativesA number of NGOs have been implementing WASH related projects i.e. HANDS and OPP inKarachi; Sukaar Foundation, Sami Foundation and NRSP in Mithi; RDF in Hyderabad; Oxfam inDadu and; DevCon in Sanghar etc.
National Lady Health Workers ProgrammeNational LHW programme is the largest programme in terms of outreach in which almost 90% ormore areas are covered with this programme. WASH is part of the curriculum of LHWs i.e. use ofboiled or filtered drinking water, keeping toilets clean and door closed, hand washing beforeeating/feeding and after toilet use. LHWs have also formed women groups to whom they deliversessions for peer to peer learning. Furthermore, WASH mapping of respective areas i.e. type ofwater sources, toilet availability and drainage system is part of LHWs monthly reports. However,there is no centralised WASH database to capture information obtained from these monthlyreports.

521
School WASHPiped water in urban area schools and ground water in rural area schools are the main source ofdrinking water. However, bad taste, yellow colour, bad smell and brackish water have also beenrecorded regarding school water. Furthermore, except for some NGO initiatives, the water testhas never been performed for school water.
School toilets exist in almost all of the schools. However, there are a considerable number of non-functional toilets due to inappropriate management. There are a number of factors thatcontribute to this situation e.g. unavailability of water or excess of water in toilets, not cleaningtoilets regularly and choked toilets due to improper drainage. Furthermore, implementation ofguidelines of Sindh Education Sector Plan 2014-18 for toilet facility i.e. one toilet per 25 girls andone toilet per 40 boys has not observed in the schools visited. In high schools, this ratio is above100 students per toilet.
Soap availability at hand washing facilities of schools has not been seen in schools except thoseschools where an NGO or soap company provided soap. However, most of the students claim thatthey wash hands with soap after using toilet. This suggests that there is knowledge of critical timesof hand washing and may even be practiced.
Except some NGO’s training of teachers and school level sessions, no WASH training of teachershas been conducted by the education department. However, school level sessions on handwashing by some soap companies in urban areas and by NGOs in rural areas has createdawareness among students. A nutrition officer from the respective BHU also visits the school onmonthly basis and he/she occasionally imparts a session on WASH practices. Teachers don’tconsider that the existing curriculum addresses the WASH issues.
The themes that emerged from stakeholder consultation were used to develop strategic prioritiesfor the sector development plan.

522

523

524


![Water, Sanitation and Hygiene Education [WASHE] Training ...linked to good personal hygiene and environmental sanitation practices. In this regard, this Water, Sanitation and Hygiene](https://static.documents.pub/doc/80x56/5e3c600e23b9870736109e00/water-sanitation-and-hygiene-education-washe-training-linked-to-good-personal.jpg)


