Civil Engineering Studies Transportation Engineering Series No. 120 Traffic Operations Lab Series No. 5 UILU-ENG-2002-2010 ISSN-0917-9191 Drivers’ Evaluation of Performance of LED Traffic Signal Modules By Rahim F. Benekohal Madhav V. Chitturi A study conducted by Traffic Operations Laboratory Department of Civil and Environmental Engineering University of Illinois at Urbana-Champaign Prepared for Illinois Department of Transportation December 2002
Transcript
Civil Engineering Studies Transportation Engineering Series No. 120 Traffic Operations Lab Series No. 5
UILU-ENG-2002-2010
ISSN-0917-9191
Drivers’ Evaluation of Performance of LED Traffic Signal Modules
By Rahim F. Benekohal Madhav V. Chitturi A study conducted by Traffic Operations Laboratory Department of Civil and Environmental Engineering University of Illinois at Urbana-Champaign Prepared for Illinois Department of Transportation December 2002
Technical Report Documentation Page
1. 1.. Report No,
FHWA-IL/UI-TOL-5 2. Government Accession No.
3. Recipient's Catalog No
5. Report Date
December 11, 2002 6. Performing Organization Code
4. 4. Title and Subtitle
Drivers’ Evaluation of Performance of LED Traffic Signal Modules
7. 7.Author(s) 8.
Rahim F. Benekohal and Madhav V. Chitturi
8. Performing Organization Report No.
UILU-ENG-2002-2010
9. Performing Organization Name and Address
10. Work Unit (TRAIS) 11. Contract or Grant No.
Department of Civil and Environmental EngineeringUniversity of Illinois at Urbana-Champaign 205 N. Mathews Ave. Urbana, Illinois 6180
13. Type of Report and Period Covered
Project Report 2001-2002
12. Sponsoring Agency Name and Address
The Illinois Department of Transportation
14. Sponsoring Agency Code
15. 15. Supplementary
16. Abstract This study evaluated the performance of the LED modules from four manufacturers (Leotek, Gelcore, Dialight and Precision Solar) who provided the required number of LEDs for testing and evaluation at the Traffic Operations Lab. The criteria for evaluation were drivers’ perception of brightness, dottiness, and color compared to incandescent lenses. For circular red indication, brightness, dottiness, and color of Dialight LED module was similar to incandescent lens, but the other three were brighter, more dottier, and darker than incandescent lens. For circular yellow indication, brightness of Precision Solar LED was the same while the others were brighter than incandescent lens; they all were dottier and darker (orange-yellow) than incandescent lens. For circular green indication all the LED modules were brighter, dottier, darker (bluish) than incandescent lens. For yellow arrow indication, Leotek and Dialight are the same while Gelcore and Precision Solar were brighter than incandescent lens; all the LED modules were dottier and darker than incandescent lens. For green arrow indication, Leotek was the same as incandescent while Dialight, Gelcore and Precision Solar were brighter than incandescent lens; all the LED modules were dottier and darker than incandescent lens. The findings, though limited, indicated that there could be a significant difference in the perception of the LED modules by the older drivers. It is recommended to further study the effect of aging on the perception of the LED modules.
17. Key Words Light Emitting Diodes, LED Traffic Signal Modules, Traffic Signal, Signal Indicator, Driver Perception, Intersection Traffic Lights
18. Distribution Statement
19. Security Classif. (of this report)
Unclassified
20. Security Classif. (of this page)
Unclassified
21. No. of Pages
73
22. Price
`Form DOT F 1700.7 (8-72) Reproduction of completed page authorized
ii
Acknowledgment and Disclaimer
This study was conducted by the Traffic Operations Laboratory (TOL) at the University of Illinois at Urbana-Champaign. The Illinois Department of Transportation sponsored the study. The contents of this report reflect the views of the authors who are responsible for the facts and accuracy of the data presented herein. The contents do not reflect the official views or policies of the Illinois Department of Transportation. This report does not constitute a standard, specification, or regulation.
iii
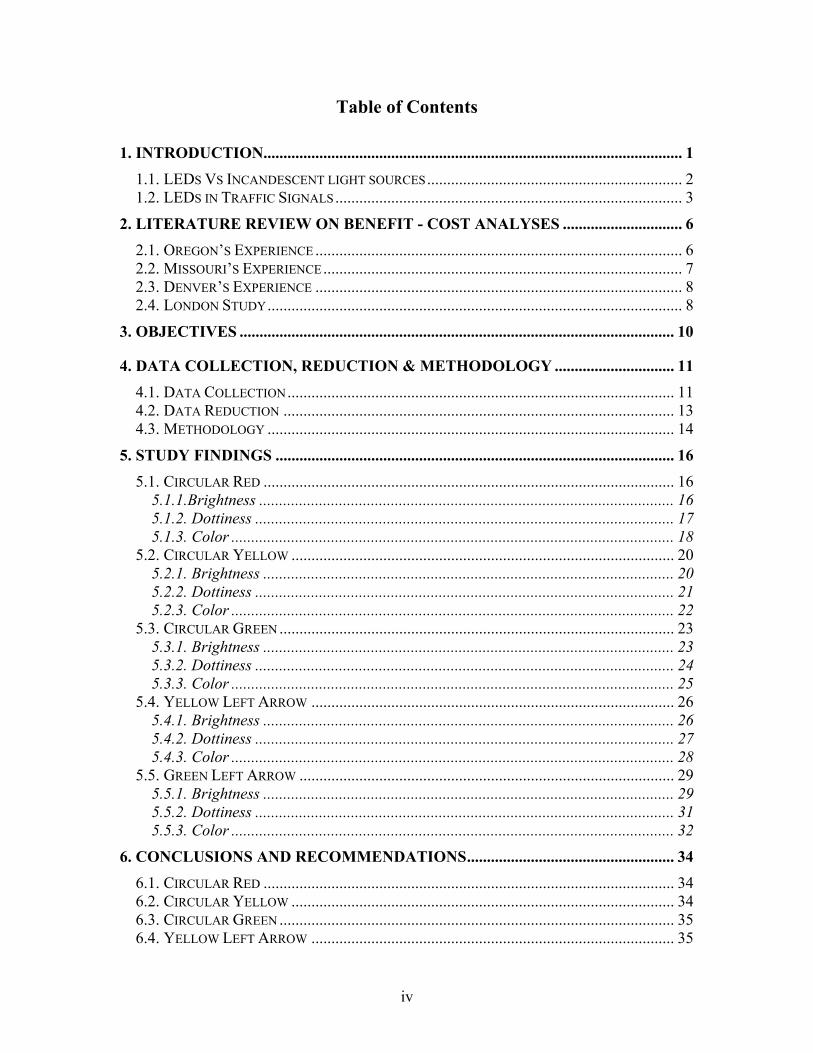
Table of Contents
1. INTRODUCTION......................................................................................................... 1 1.1. LEDS VS INCANDESCENT LIGHT SOURCES................................................................ 2 1.2. LEDS IN TRAFFIC SIGNALS....................................................................................... 3
2. LITERATURE REVIEW ON BENEFIT - COST ANALYSES .............................. 6 2.1. OREGON’S EXPERIENCE ............................................................................................ 6 2.2. MISSOURI’S EXPERIENCE.......................................................................................... 7 2.3. DENVER’S EXPERIENCE ............................................................................................ 8 2.4. LONDON STUDY........................................................................................................ 8
4. DATA COLLECTION, REDUCTION & METHODOLOGY .............................. 11
4.1. DATA COLLECTION................................................................................................. 11 4.2. DATA REDUCTION .................................................................................................. 13 4.3. METHODOLOGY ...................................................................................................... 14
5. STUDY FINDINGS .................................................................................................... 16 5.1. CIRCULAR RED ....................................................................................................... 16
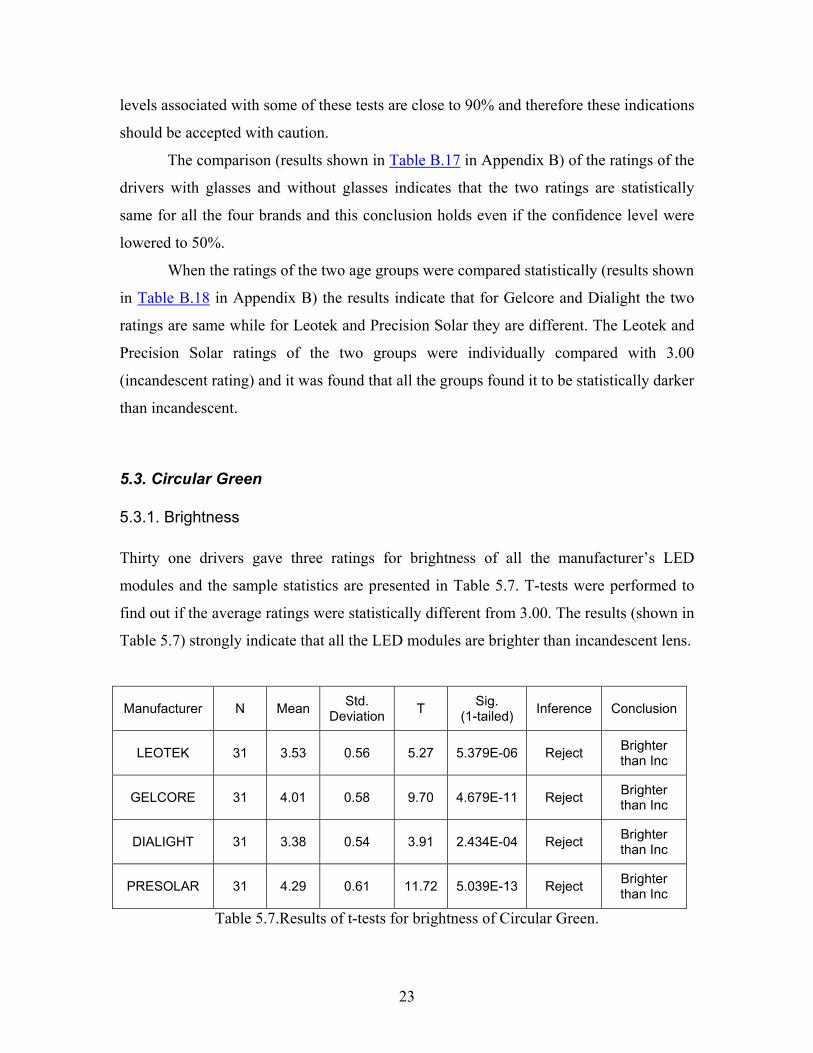
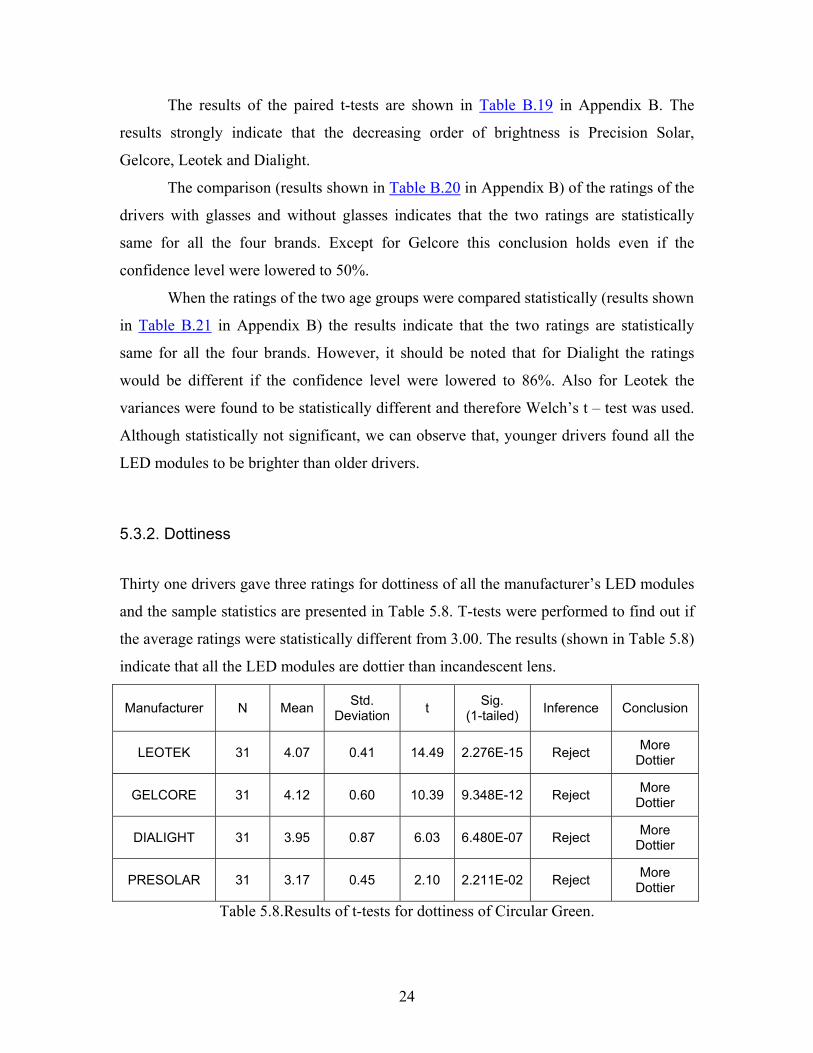
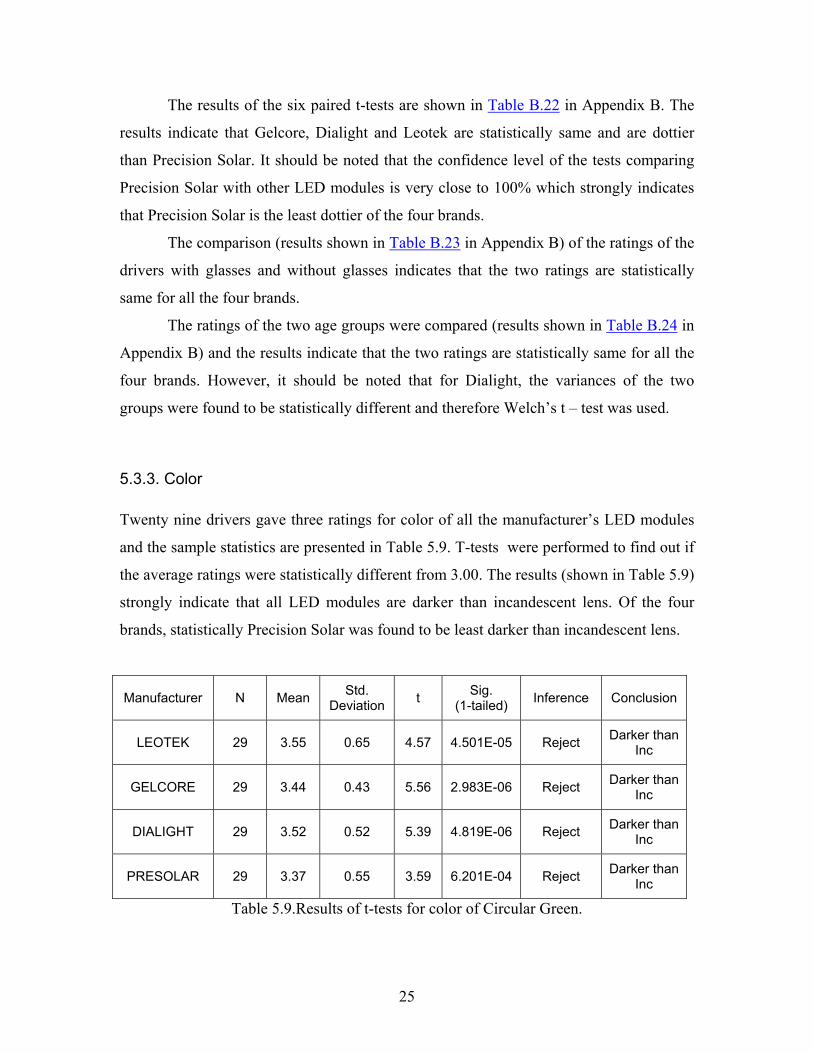
5.3. CIRCULAR GREEN ................................................................................................... 23 5.3.1. Brightness ....................................................................................................... 23 5.3.2. Dottiness ......................................................................................................... 24 5.3.3. Color ............................................................................................................... 25
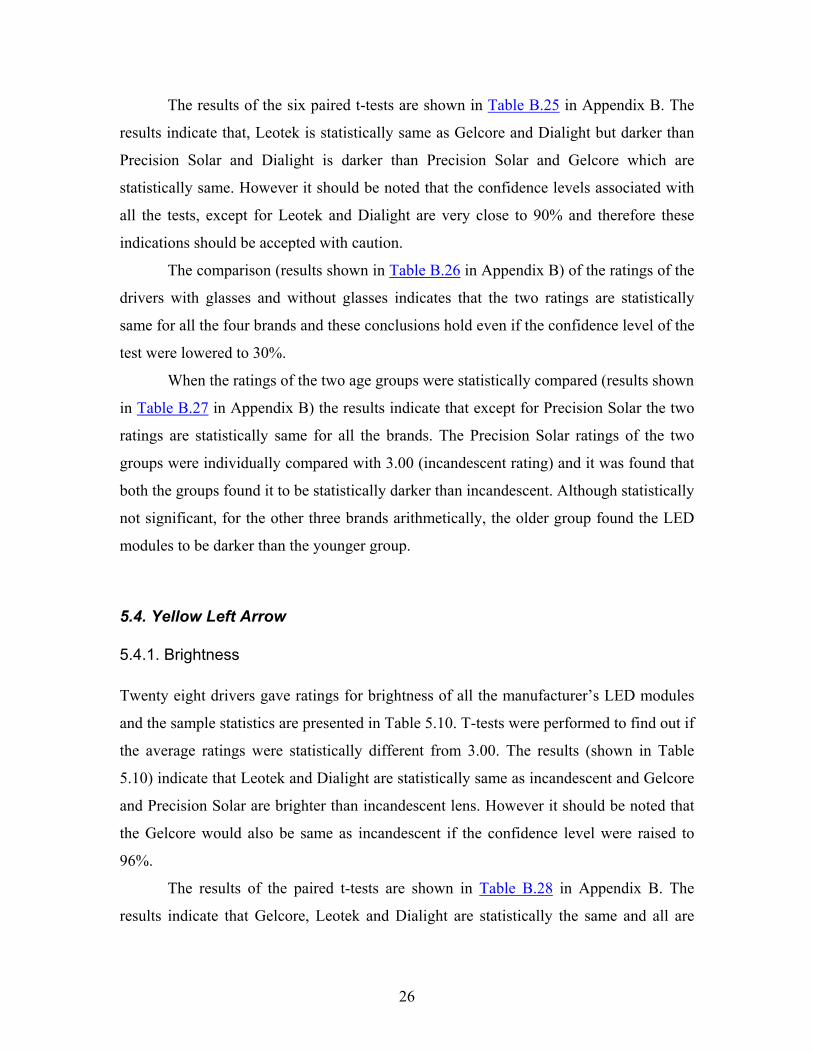
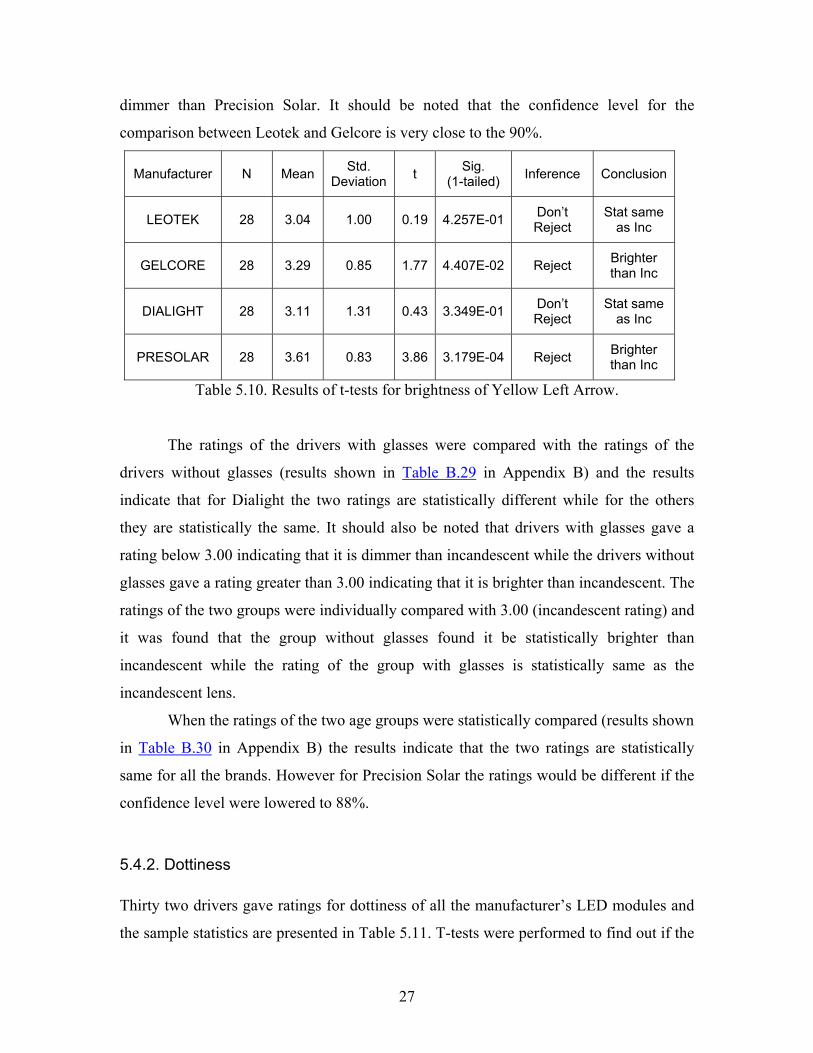
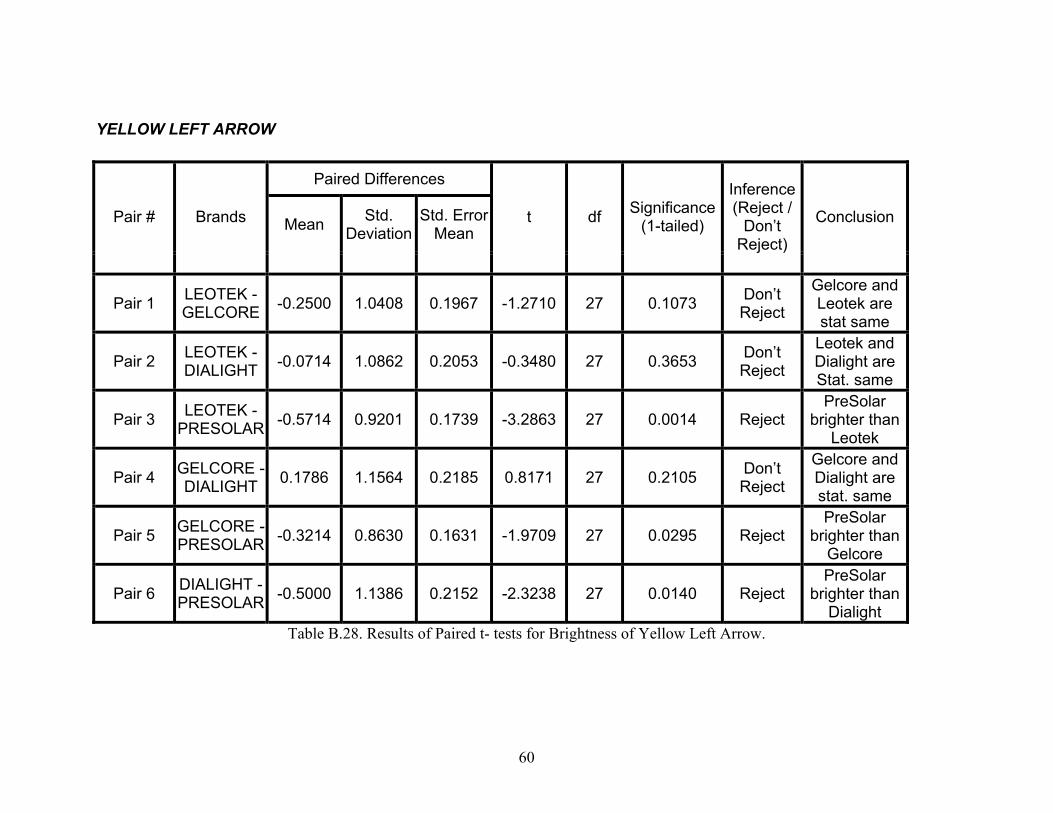
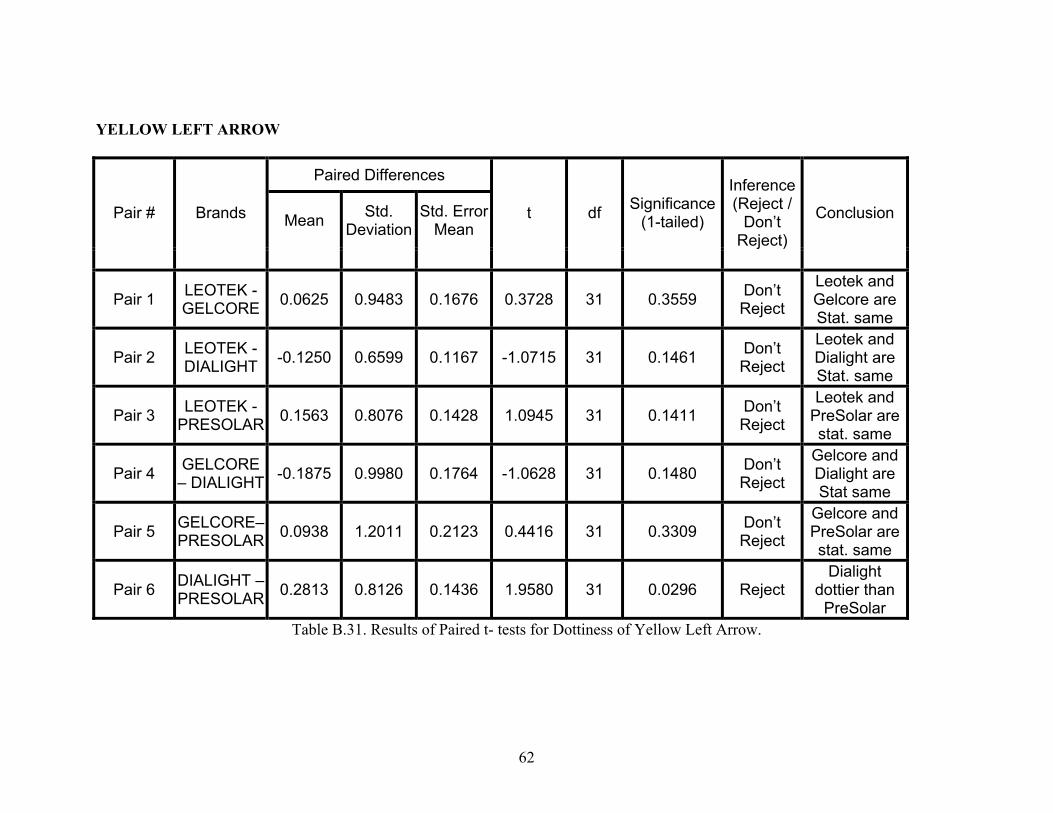
5.4. YELLOW LEFT ARROW ........................................................................................... 26 5.4.1. Brightness ....................................................................................................... 26 5.4.2. Dottiness ......................................................................................................... 27 5.4.3. Color ............................................................................................................... 28
5.5. GREEN LEFT ARROW .............................................................................................. 29 5.5.1. Brightness ....................................................................................................... 29 5.5.2. Dottiness ......................................................................................................... 31 5.5.3. Color ............................................................................................................... 32
6. CONCLUSIONS AND RECOMMENDATIONS.................................................... 34 6.1. CIRCULAR RED ....................................................................................................... 34 6.2. CIRCULAR YELLOW ................................................................................................ 34 6.3. CIRCULAR GREEN ................................................................................................... 35 6.4. YELLOW LEFT ARROW ........................................................................................... 35
iv
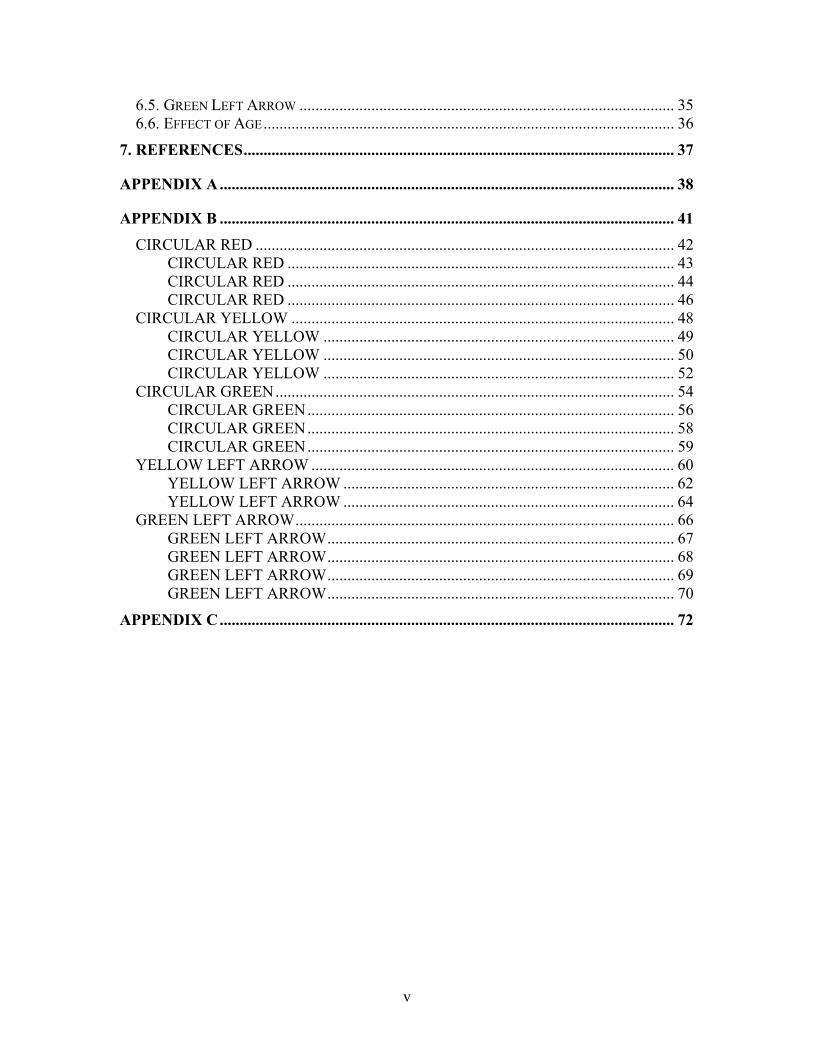
6.5. GREEN LEFT ARROW .............................................................................................. 35 6.6. EFFECT OF AGE....................................................................................................... 36
APPENDIX B .................................................................................................................. 41 CIRCULAR RED ......................................................................................................... 42
CIRCULAR RED ................................................................................................. 43 CIRCULAR RED ................................................................................................. 44 CIRCULAR RED ................................................................................................. 46
YELLOW LEFT ARROW ........................................................................................... 60 YELLOW LEFT ARROW ................................................................................... 62 YELLOW LEFT ARROW ................................................................................... 64
GREEN LEFT ARROW............................................................................................... 66 GREEN LEFT ARROW....................................................................................... 67 GREEN LEFT ARROW....................................................................................... 68 GREEN LEFT ARROW....................................................................................... 69 GREEN LEFT ARROW....................................................................................... 70
1. INTRODUCTION Nearly everyone is familiar with Light Emitting Diodes (LEDs) from their use as
indicator lights and numeric displays on consumer electronic devices. Light Emitting
Diodes, which were developed in the late 1960s are solid-state semi-conductor devices
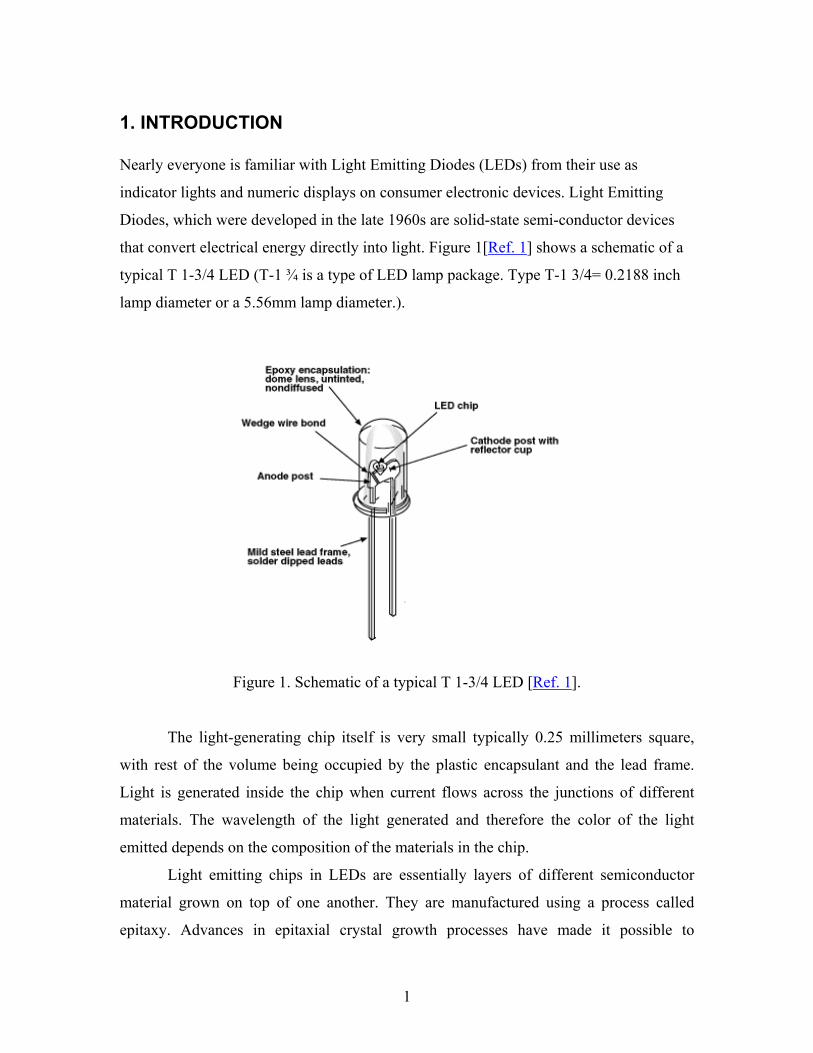
that convert electrical energy directly into light. Figure 1[Ref. 1] shows a schematic of a
typical T 1-3/4 LED (T-1 ¾ is a type of LED lamp package. Type T-1 3/4= 0.2188 inch
lamp diameter or a 5.56mm lamp diameter.).
Figure 1. Schematic of a typical T 1-3/4 LED [Ref. 1].
The light-generating chip itself is very small typically 0.25 millimeters square,
with rest of the volume being occupied by the plastic encapsulant and the lead frame.
Light is generated inside the chip when current flows across the junctions of different
materials. The wavelength of the light generated and therefore the color of the light
emitted depends on the composition of the materials in the chip.
Light emitting chips in LEDs are essentially layers of different semiconductor
material grown on top of one another. They are manufactured using a process called
epitaxy. Advances in epitaxial crystal growth processes have made it possible to
1
manufacture LED materials with high enough purity to produce colors that were not
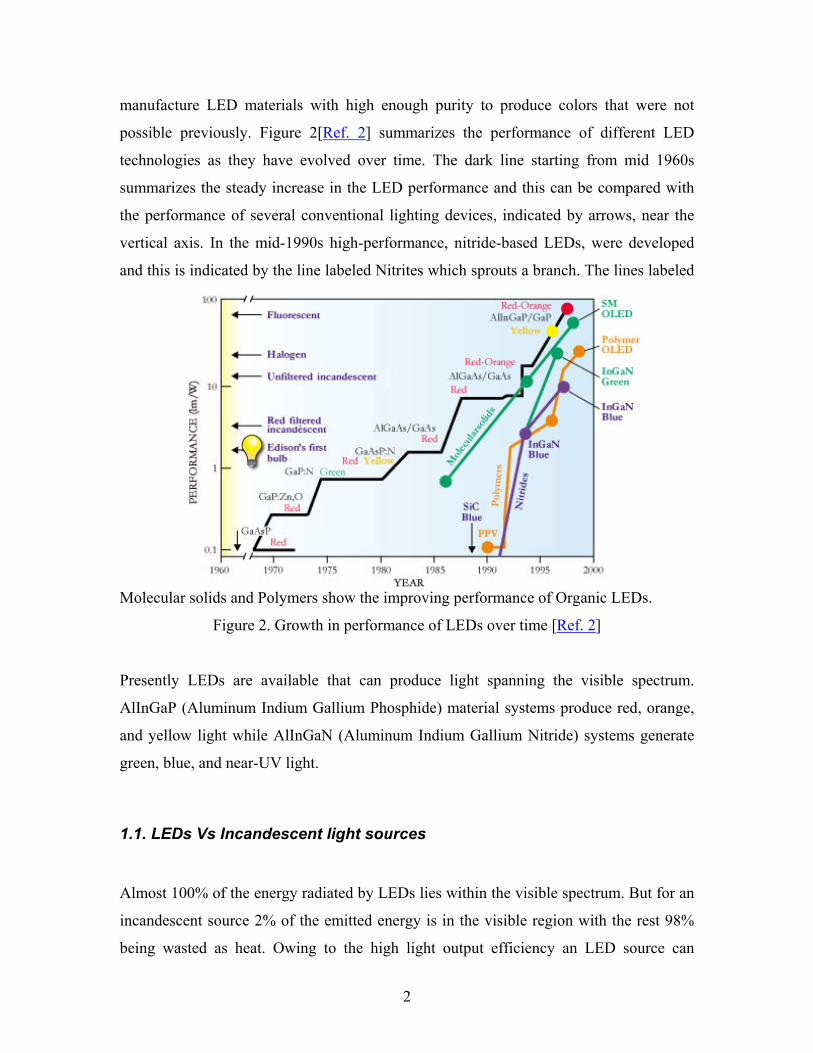
possible previously. Figure 2[Ref. 2] summarizes the performance of different LED
technologies as they have evolved over time. The dark line starting from mid 1960s
summarizes the steady increase in the LED performance and this can be compared with
the performance of several conventional lighting devices, indicated by arrows, near the
vertical axis. In the mid-1990s high-performance, nitride-based LEDs, were developed
and this is indicated by the line labeled Nitrites which sprouts a branch. The lines labeled
Molecular solids and Polymers show the improving performance of Organic LEDs.
Figure 2. Growth in performance of LEDs over time [Ref. 2]
Presently LEDs are available that can produce light spanning the visible spectrum.
AlInGaP (Aluminum Indium Gallium Phosphide) material systems produce red, orange,
and yellow light while AlInGaN (Aluminum Indium Gallium Nitride) systems generate
green, blue, and near-UV light.
1.1. LEDs Vs Incandescent light sources
Almost 100% of the energy radiated by LEDs lies within the visible spectrum. But for an
incandescent source 2% of the emitted energy is in the visible region with the rest 98%
being wasted as heat. Owing to the high light output efficiency an LED source can
2
generate light of same intensity as an incandescent source while consuming significantly
less electrical power.
Light emitted by the LEDs falls in very narrow spectral bandwidths, thereby
producing nearly monochromatic light and does not need to be filtered to produce the
required colors. On the contrary, incandescent sources are broadband emitters of white
light that must be optically filtered to achieve the desired color.
The light output of LED modules degrades over time. Degradation of LED light
output is a direct function of the junction temperature. However “for any given length of
time, the light output degradation of for an LED device is significantly less than that of
an incandescent lamp”[Ref. 3]. LEDs are durable and provide longer lamp life than
incandescent sources.
1.2. LEDs in Traffic Signals
As can be seen in Figure 2, advances in light emitting diode (LED) technologies have
made it possible to produce LEDs that emit colors throughout the visible spectrum and
have better performance than conventional technologies. This has made it possible to use
LEDs in a variety of lighting applications. Manufacturers have developed traffic signal
optical modules using LEDs. According to Strategies Unlimited, a market research
organization that conducts an annual market update of LED lighting products , about 10%
of all red traffic signals in the United States used LEDs in 2000. “In early signals, more
than 600 individual LEDs might be mounted together in a disk formation to produce the
circular indication, but these signals did not meet the requirements for distribution of
luminous intensity. The addition of lenses in front of the LEDs and increases in LED
light output brought their number from 600 to around 200. More recently, very high
output LEDs with broader intensity distributions have been developed, and in many
ways, the design of LED traffic signals has begun to mirror conventional incandescent
signals, with a clustered LED light source set back into a chamber and optical elements
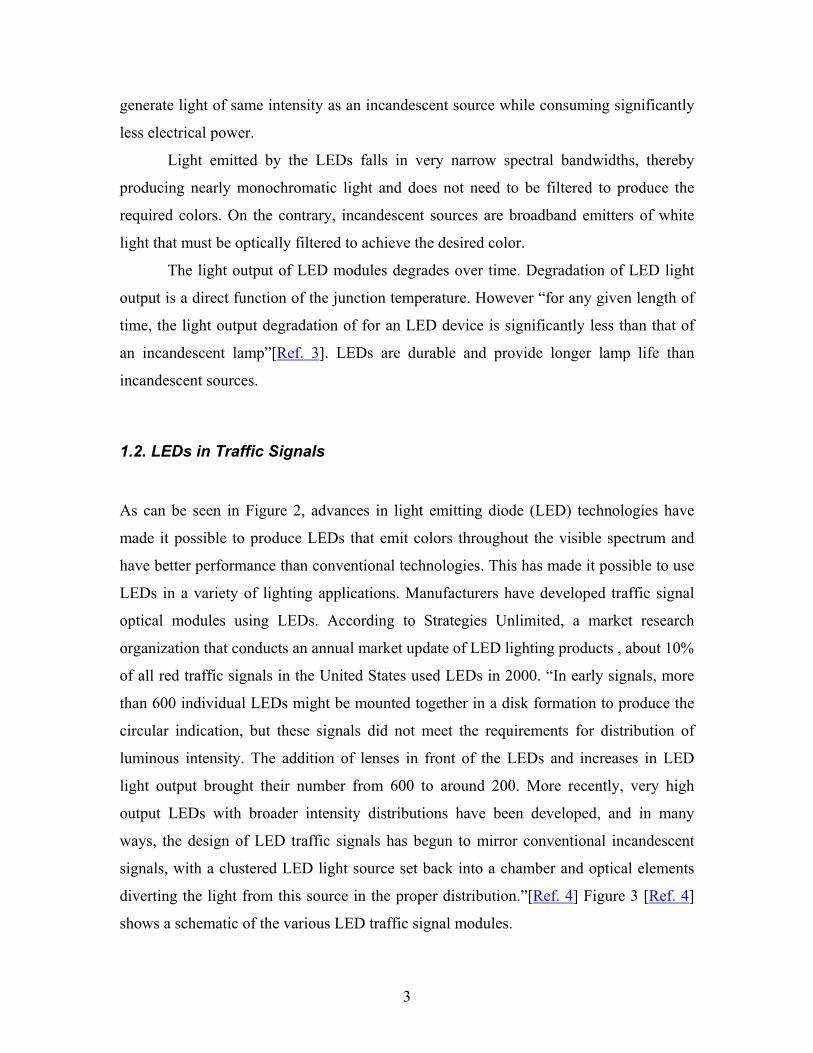
diverting the light from this source in the proper distribution.”[Ref. 4] Figure 3 [Ref. 4]
shows a schematic of the various LED traffic signal modules.
3
Figure 3. Top left: Incandescent traffic signals have been in use for many decades. Top right: Early LED signals used hundreds of tightly packed LEDs. Center left: With improved optics, fewer LEDs could be used. Center right: High output LEDs result in signals that appear similar to incandescent signals. Bottom: Head-on view of traffic signals, starting top left and going counter-clockwise [Ref. 4].
There are approximately 260,000 intersections with traffic signals in the US. Each
intersection has an average of 40 signal indications using either 69, 135, or 150 watts
incandescent lamps. Though, the incandescent lamps are very inexpensive, their use in
the traffic signals is a considerable economic burden for the governmental agencies
because of their high power consumption and annual preventative lamp replacement.
On the contrary, LED based traffic signals offer tremendous savings potential
because they consume much less power than the incandescent lenses for producing the
4
same output and do not require the annual preventive replacement due to their long life.
According to an estimate [Ref. 5] Light-emitting diodes (LEDs) could save nearly 2.5
billion kilowatt hours annually, if they replaced incandescent lenses in traffic signals.
Thus the use of LEDs in traffic signals results not only in energy cost savings for the
governmental agencies, but also helps the environment by using less power for operating
the signals. In the following section a literature review of the benefit-cost analyses that
were published is presented.
5
2. LITERATURE REVIEW ON BENEFIT - COST ANALYSES In this section a summary of four benefit-cost analyses of the use of LED modules in
traffic signals that have been documented in the literature is presented. Summaries of the
four studies followed by our comments are presented in four subsections to follow.
However, it should be noted that the conclusions reached in these studies are valid only
for the projects under consideration and are not necessarily applicable for any other
project. This is primarily because of the difference in:
• The benefits and costs being considered: In each subsection the factors that have been
considered in the particular studies are mentioned and it can be seen that the factors
that have been considered are different for different studies.
• Cost of the LED modules: The costs of the LED modules have been decreasing over
the years and the costs that have been used in these studies would be too high today.
2.1. Oregon’s Experience
The Oregon study [Ref. 6] traced the history of introduction of LED traffic signals in
Oregon by Oregon Department of Transportation (ODOT) after testing red LED modules
and finding them to be reliable. In 1995, ODOT started an LED traffic signal
implementation program in conjunction with 8 cities in Oregon (only Red 12” balls, Red
8” balls, Red 12” arrows and Pedestrian “hand” symbols were replaced). The report
presents an economic analysis comparing LED and incandescent traffic signals. In the
economic analysis, the factors considered were
• Lamp Cost
• Energy cost
It was estimated that for the ODOT project, the annual energy savings (considering only
red LEDs) would be 88% and after factoring in the lamp costs would result in annual
savings of 26%. The estimated payback period for the project was 3.6 years. However it
should be noted that the LEDs that were used in the Oregon study were based on
Aluminum Gallium Arsenide (AlGaAs) technology while the present LEDs use
Aluminum Indium Gallium Phosphide (AlInGaP) technology. This economic analysis
6
does not consider the initial cost of replacing incandescent lenses with LEDs and
maintenance savings due to the use of LED modules. Also, the data used for estimating
the energy costs is based on technical data sheets and not on actual metered energy usage.
For the Oregon project, through the Federal Highway Administration (FHWA)
Priority Technology Program, the participating agencies were reimbursed 30% of the cost
of the lenses and in addition, electric utility companies provided energy rebates to the
participating agencies. However, in the Benefit-Cost analysis performed, the actual cost
of the lenses was used and these rebates/reimbursements were not considered.
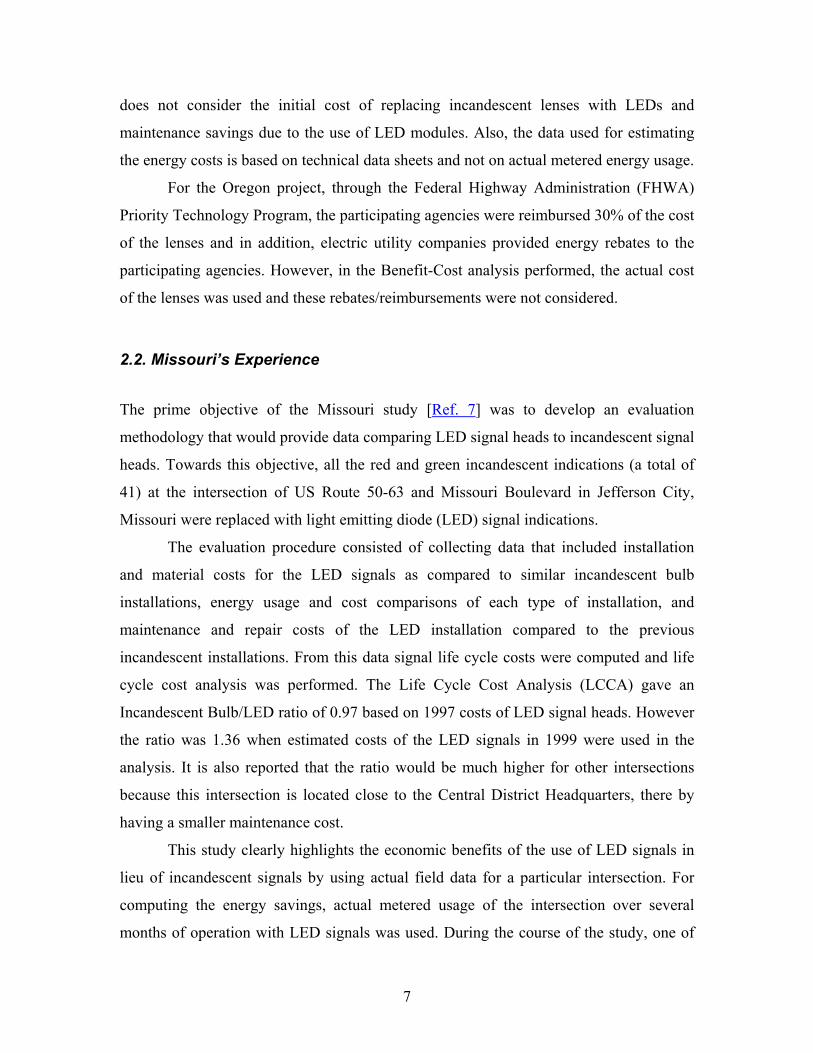
2.2. Missouri’s Experience
The prime objective of the Missouri study [Ref. 7] was to develop an evaluation
methodology that would provide data comparing LED signal heads to incandescent signal
heads. Towards this objective, all the red and green incandescent indications (a total of
41) at the intersection of US Route 50-63 and Missouri Boulevard in Jefferson City,
Missouri were replaced with light emitting diode (LED) signal indications.
The evaluation procedure consisted of collecting data that included installation
and material costs for the LED signals as compared to similar incandescent bulb
installations, energy usage and cost comparisons of each type of installation, and
maintenance and repair costs of the LED installation compared to the previous
incandescent installations. From this data signal life cycle costs were computed and life
cycle cost analysis was performed. The Life Cycle Cost Analysis (LCCA) gave an
Incandescent Bulb/LED ratio of 0.97 based on 1997 costs of LED signal heads. However
the ratio was 1.36 when estimated costs of the LED signals in 1999 were used in the
analysis. It is also reported that the ratio would be much higher for other intersections
because this intersection is located close to the Central District Headquarters, there by
having a smaller maintenance cost.
This study clearly highlights the economic benefits of the use of LED signals in
lieu of incandescent signals by using actual field data for a particular intersection. For
computing the energy savings, actual metered usage of the intersection over several
months of operation with LED signals was used. During the course of the study, one of
7
the left turn LED signals was seriously damaged in a lightning storm and had to be
replaced. The resulting repair cost was included in the repair costs for LEDs. However,
the cost of the replacing the LED signal was not included as that cost was borne by the
vendor under warrantee. The life cycle of the LED lamp was considered to be 7 years and
the cash flows were discounted while performing the analysis.
2.3. Denver’s Experience This study [Ref. 8] provides an estimate of the payback period for retrofitting all the 1200
intersections of Denver with LED traffic signals (red 8” and 12” ball, arrow, pedestrian
hand only). The factors considered in the analysis were acquisition cost, installation cost,
ancillary materials cost (cost of incandescents for yellow, green and white which were
group relamped in the retrofit project), energy savings, reduced replacement material
savings, labor savings due to reduced maintenance. The average simple payback period
for the project was estimated to be 4.28 years.
The net acquisition cost for the complete program was $ 1,333,225 and represents
17,036 units. Denver realized a total rebate of $405,900 for the installation of 14,036
units before the expiration of the Public Service Company of Colorado’s (PSCO)
Demand Side energy Management (DSM) program. The supplier gave a 1% credit for
payment within 31 days, which resulted in an additional decrease of $ 17,556.
This study does not discount the cash flows. But, it should be noted that of the
three studies discussed so far, this study accounts for all the benefits and costs and is
more realistic and could possibly serve as a model for benefit-cost analyses of future
projects.
2.4. London Study
This study [Ref. 9] provides estimates on the expected savings if all traffic signals in
London were replaced by LED modules. In this study, the authors considered cost of the
LED modules, installation cost of LED modules, electricity and maintenance savings.
Based on the then prices of LED modules and electricity costs, the authors estimate that
8
the payback period for that project would be 8 years for Red, 28 years for Yellow and 18
years for Green LED modules.
It is interesting to note that while the Oregon study indicated a payback period of
3.6 years for their project that involves red signals mostly, the London study indicates a
payback period of 8 years for red signals. This is because the incandescent lenses being
used in London consume 50 watts while the lenses that are used in Oregon have a
consumption of 158 watts and the LED modules in London and Oregon use 13 and 20
watts, respectively. So the payback period for red lenses for London should be
approximately three times the payback period for Oregon. But the reported payback
period is significantly lower than 10.8(3*3.6 years) because in the London study, the
maintenance savings due to the use of LED modules are also considered while computing
the payback period. However, it should be noted that the authors assume that the entire
annual maintenance costs, which are being currently incurred with incandescent lenses
will be saved once the switch to LED modules takes place. It is imperative there will be
some maintenance, not necessarily involving relamping, even when the traffic signals are
converted to LED modules. It should also be noted that the authors do not consider any
replacement cost for LED modules over the payback period of the project, which is quite
high at 8 years for red, 28 years for Yellow and 18 years for green.
9
3. OBJECTIVES The Illinois Department of Transportation (IDOT) is considering replacing the
incandescent traffic signal lamps on the state highway system with LED modules by
requiring LED modules in the future traffic signal construction projects and retrofitting
the existing signals. The objective of this study is to evaluate the performance of the LED
modules from four manufacturers. The manufacturers are Leotek, Gelcore, Dialight and
Precision Solar. These manufacturers provided the required number of LEDs for testing
and evaluation at the Traffic Operations Lab. The purposes of the evaluation are:
• Identify those manufacturers whose LED modules are close to the incandescent lens
in their performance.
• Identify subset(s) of manufacturers whose LED modules are statistically the same in
their performance.
The criteria used for performance evaluation includes:
1. Brightness: Brightness could have been measured photometrically, but the spectral
content and spatial detail may differ between different technologies and that may
influence the perception of drivers. So, drivers were asked to compare the brightness
of LEDs to incandescent indications.
2. Dottiness: As the LED modules consist of strings of LEDs, they tend to appear like a
cluster of dots which is not the case with incandescent lens. Therefore, it is imperative
to know how drivers perceive the LED modules compared to incandescent lenses.
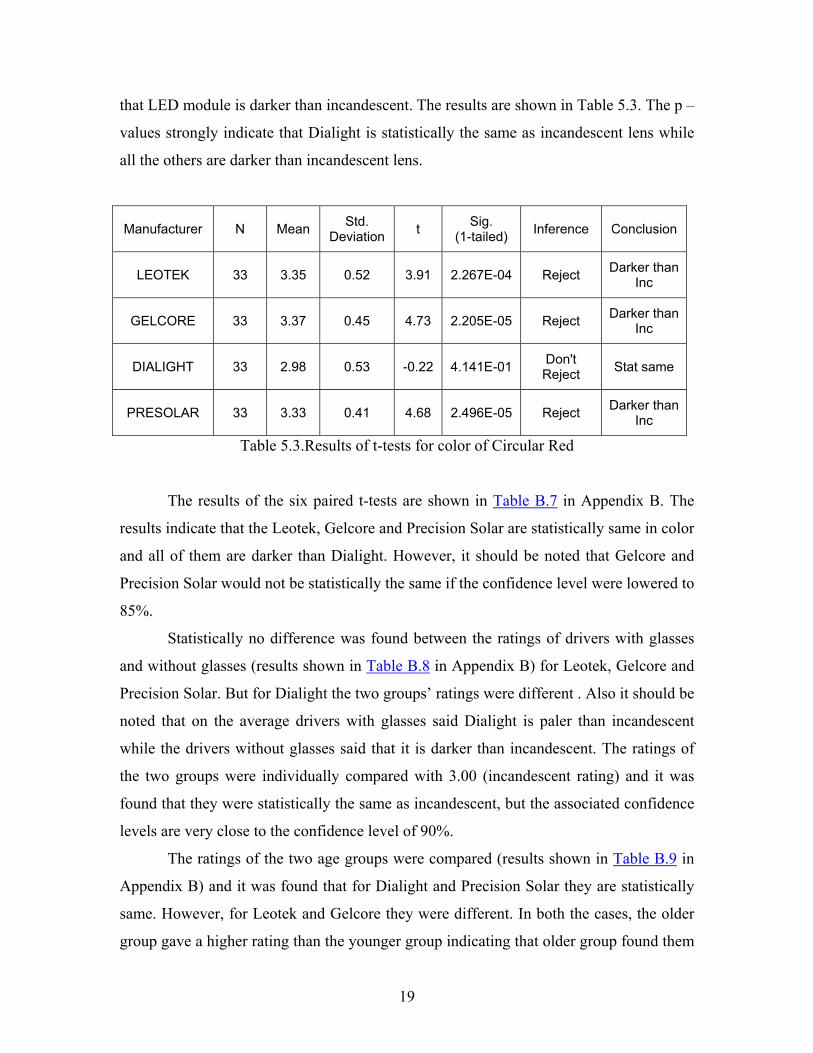
3. Color: Since the spectral distributions of different lenses differ, it is required to ensure
that any lenses that are used in the traffic signal heads resemble the incandescent
lenses in color. So, drivers were asked to compare the color of LED modules to the
corresponding colors in incandescent lenses.
10
4. DATA COLLECTION, REDUCTION & METHODOLOGY
4.1. Data Collection
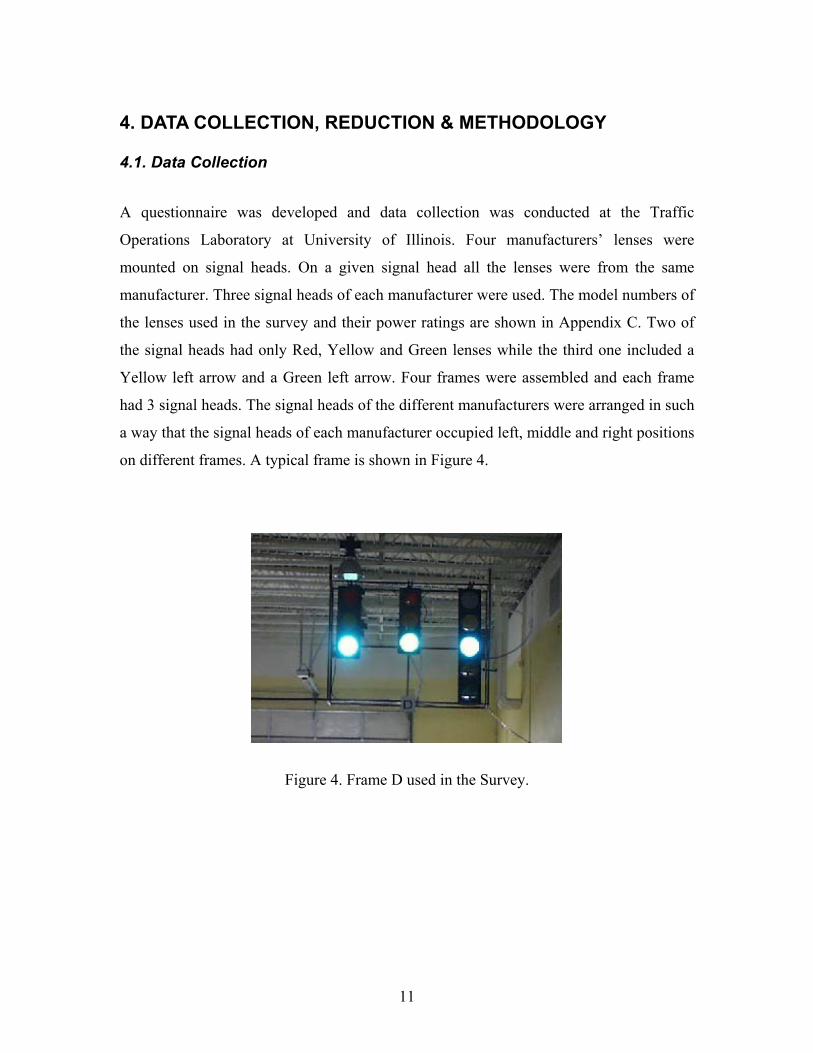
A questionnaire was developed and data collection was conducted at the Traffic
Operations Laboratory at University of Illinois. Four manufacturers’ lenses were
mounted on signal heads. On a given signal head all the lenses were from the same
manufacturer. Three signal heads of each manufacturer were used. The model numbers of
the lenses used in the survey and their power ratings are shown in Appendix C. Two of
the signal heads had only Red, Yellow and Green lenses while the third one included a
Yellow left arrow and a Green left arrow. Four frames were assembled and each frame
had 3 signal heads. The signal heads of the different manufacturers were arranged in such
a way that the signal heads of each manufacturer occupied left, middle and right positions
on different frames. A typical frame is shown in Figure 4.
Figure 4. Frame D used in the Survey.
11
Observers were asked to sit at four different viewing stations and at each station
view one of the frames. The distance between the viewing station and frame was about 70
feet. This represents approximately the distance between a stopped vehicle and the signal
head at an intersection with 2 through lanes per direction and a left turn pocket. The
viewing stations and the frames were clearly marked to avoid any confusion. Observers
moved from one station to another station after completing the survey for that frame.
The survey questionnaire requested the drivers to rate the performance of the LED
signal lenses relative to incandescent signal lenses in terms of brightness, solidness (as
opposed to being a series of dots) and color on a scale of 1 to 5, and 0 referring to No
Opinion. In order to avoid ambiguity about what the ratings 1 through 5 indicated,
descriptions of each rating were also provided. For example, in the case of brightness, 1
indicated much dimmer and 5 indicated much brighter compared to incandescent lenses
and 3 indicated the same as incandescent lenses. The observers had valid driving licenses
and were asked to identify their age group and indicate if they needed to wear glasses or
had any difficulty in distinguishing different shades of a color. A copy of the Survey
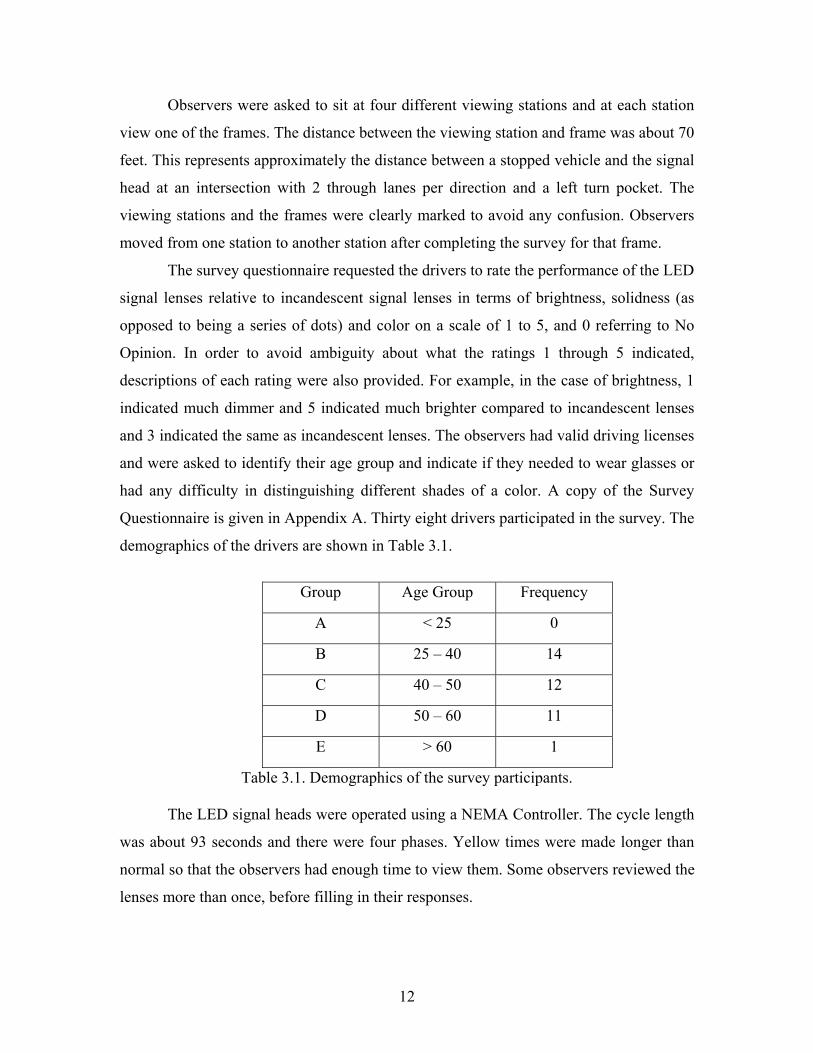
Questionnaire is given in Appendix A. Thirty eight drivers participated in the survey. The
demographics of the drivers are shown in Table 3.1.
Group Age Group Frequency
A < 25 0
B 25 – 40 14
C 40 – 50 12
D 50 – 60 11
E > 60 1
Table 3.1. Demographics of the survey participants.
The LED signal heads were operated using a NEMA Controller. The cycle length
was about 93 seconds and there were four phases. Yellow times were made longer than
normal so that the observers had enough time to view them. Some observers reviewed the
lenses more than once, before filling in their responses.
12
4.2. Data Reduction In an Excel Workbook, three spreadsheets were made corresponding to the three
questions in the survey questionnaire. The data from the 38 surveys was coded in
spreadsheets. However, after transferring the survey responses to the Excel file, it was
observed that not all drivers responded to all the questions in the survey. Therefore, for
each question in the survey (pertaining to the three aspects i.e., brightness, dottiness and
color) the subset of drivers who gave three ratings for the lenses of all the LED
manufacturers were identified. The average rating for each manufacturer’s LED modules
was calculated. These average ratings of the drivers were used to perform statistical tests
and conclude about the performance of the LED modules.
To check for the normality of the data, histograms of the average ratings of the
drivers were plotted and visually inspected for normality. As the data is categorical, we
could only check to see that there exists a symmetric curve with a peak at the center. To
ensure that drivers were consistent in the responses they gave to the three lenses of the
same color from a given manufacturer, the range of each driver’s responses to each of the
manufacturer’s LED modules was calculated. It was assumed that a range of one was
reasonable and did not constitute an inconsistency in the rating. Therefore, all drivers
who had ranges greater than or equal to two for any of their ratings were identified. For
each such driver, the sum of the ranges for each of the questions in the survey was
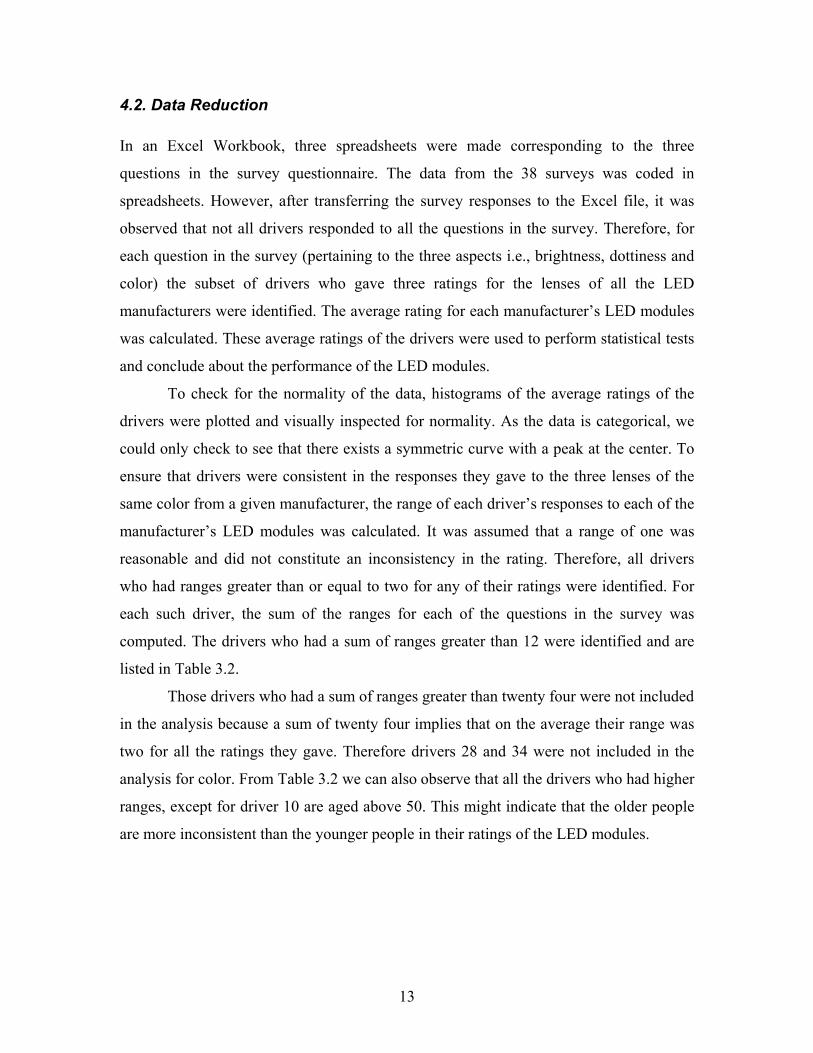
computed. The drivers who had a sum of ranges greater than 12 were identified and are
listed in Table 3.2.
Those drivers who had a sum of ranges greater than twenty four were not included
in the analysis because a sum of twenty four implies that on the average their range was
two for all the ratings they gave. Therefore drivers 28 and 34 were not included in the
analysis for color. From Table 3.2 we can also observe that all the drivers who had higher
ranges, except for driver 10 are aged above 50. This might indicate that the older people
are more inconsistent than the younger people in their ratings of the LED modules.
13
Driver # Age Group Color Problems Glasses Aspect Sum of
Ranges Brightness 16
9 50 – 60 No Yes Dottiness 13
10 40 – 50 No Yes Dottiness 18
26 50 – 60 No Yes Brightness 15
Brightness 12 27 > 60 No Yes
Dottiness 15
28 50 – 60 No No Color 25
34 50 – 60 No No Color 29
Brightness 12 38 50 – 60 No No
Color 13
Table 3.2. Drivers with inconsistent responses.
4.3. Methodology The methodology used in this study was asking drivers’ opinions on the performance of
LED modules compared to incandescent lens. To achieve the objectives of this study, t –
tests (one tailed) were conducted to compare the performance of each manufacturer’s
LED module with incandescent lens and paired t-tests were conducted to compare each
manufacturer’s LED modules with every other manufacturer’s LED module.
Also, in order to verify, if the age of the drivers affects the rating of the LED
modules, the responses were classified into two age groups viz., below 50 years and
above 50 years. Considering these two data sets as independent samples, independent
samples t-test was performed. Equality of variances of the two groups was first tested and
if they were statistically equal, regular t – test with pooled variance was used otherwise
Welch’s t – test was performed.
Furthermore, to check for the effect of wearing glasses, the responses were
classified into two groups viz., drivers with glasses and without glasses. Considering
these two data sets as independent samples, independent samples t – test was performed.
14
Equality of variances of the two groups was first tested and if they were statistically
equal, regular t – test with pooled variance was used otherwise Welch’s t – test was
performed. An α value of 0.10 was used in all the statistical tests.
15
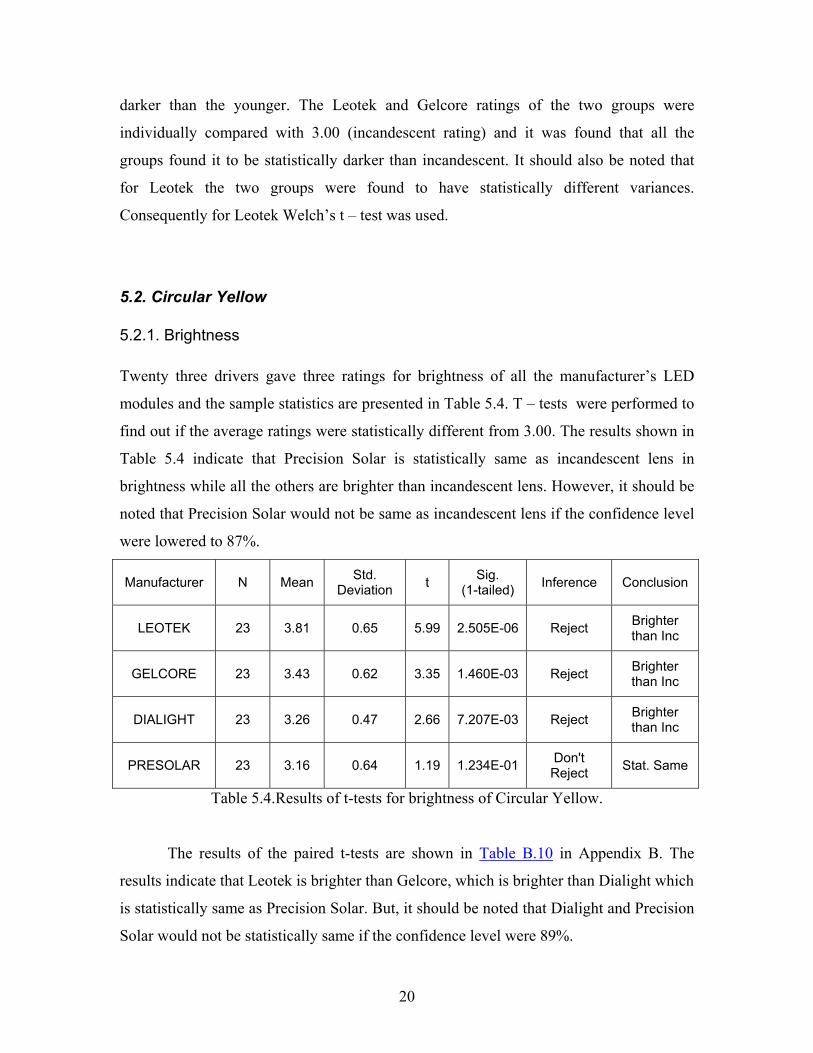
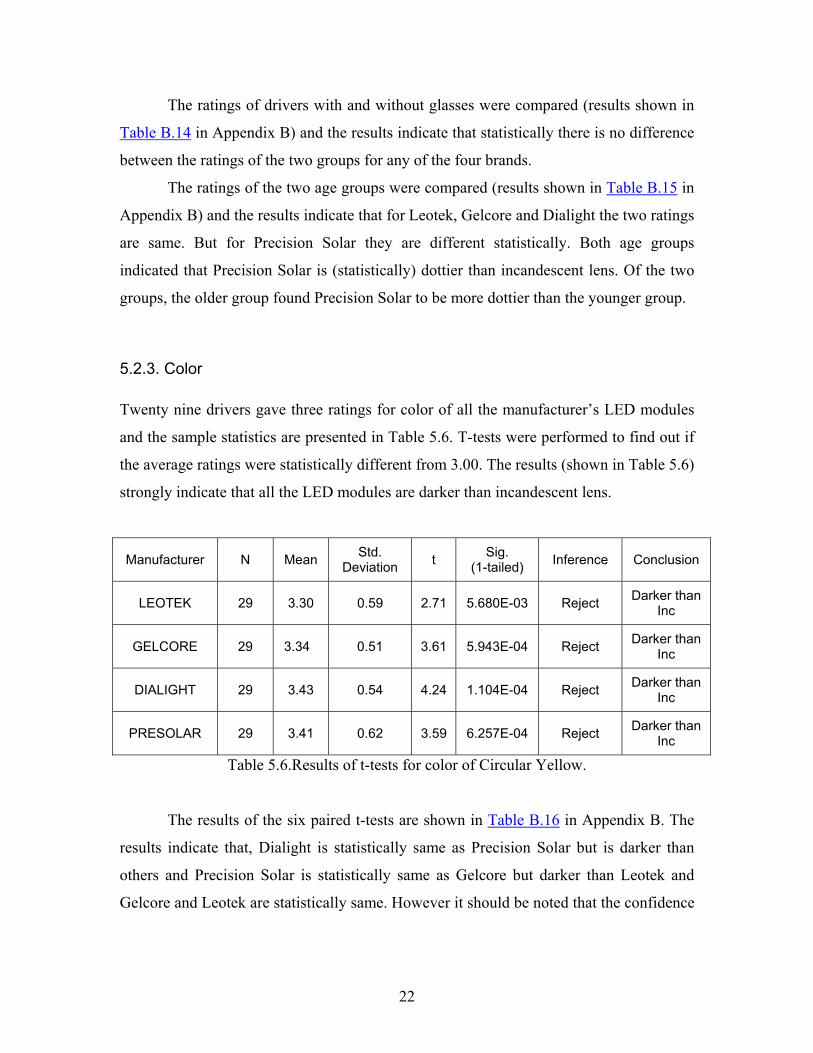
5. STUDY FINDINGS Five types of LED traffic signals (Circular Red, Circular Yellow, Circular Green, Yellow
left arrow and Green left arrow) were evaluated. The results for them are presented in
five separate sections to follow. Each of these sections is further divided into three
subsections corresponding to the three questions in the survey questionnaire (brightness,
dottiness, and color). Each subsection contains a discussion on the following items:
• Performance of each manufacturer’s lens with respect to incandescent lens
• Relative performance of the manufacturer’s lenses
• Effect of age on the responses
• Effect of wearing glasses on the responses
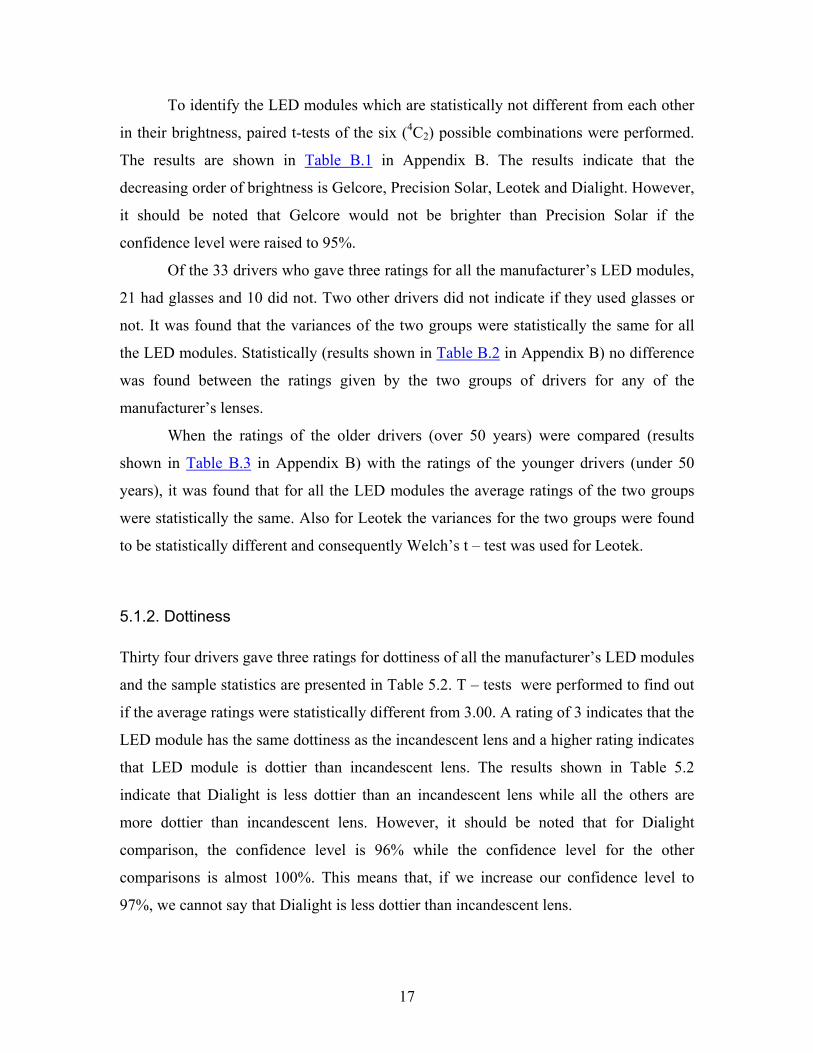
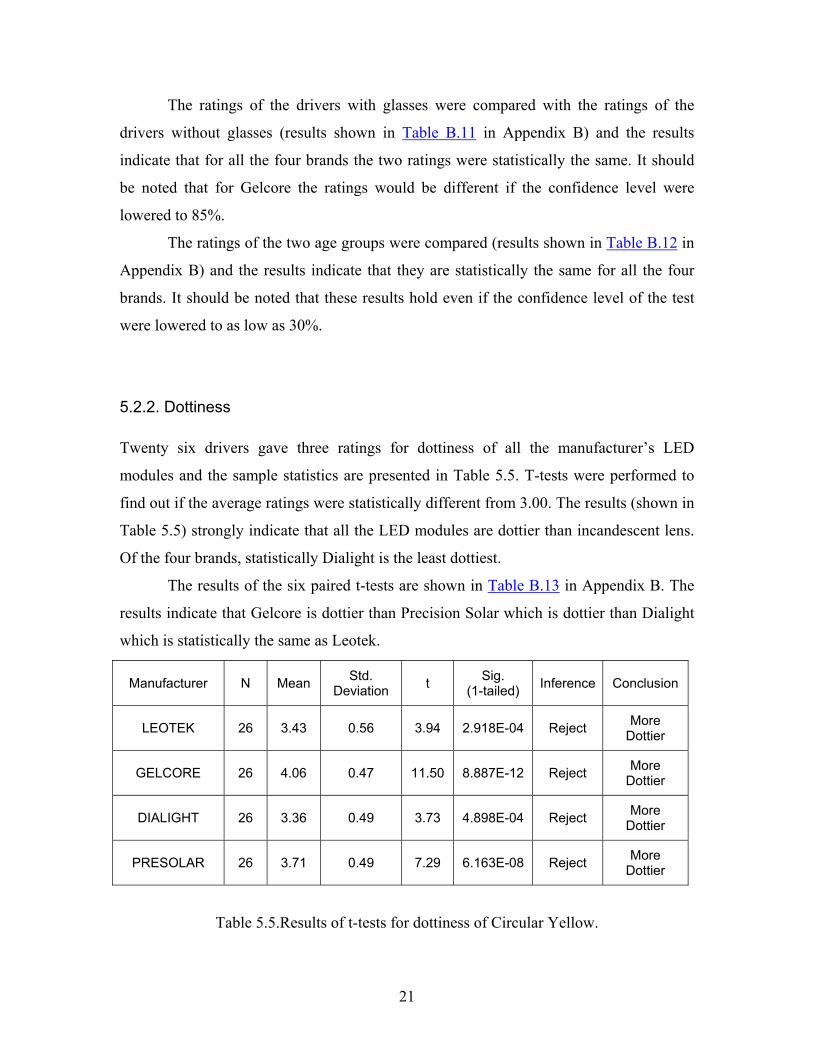
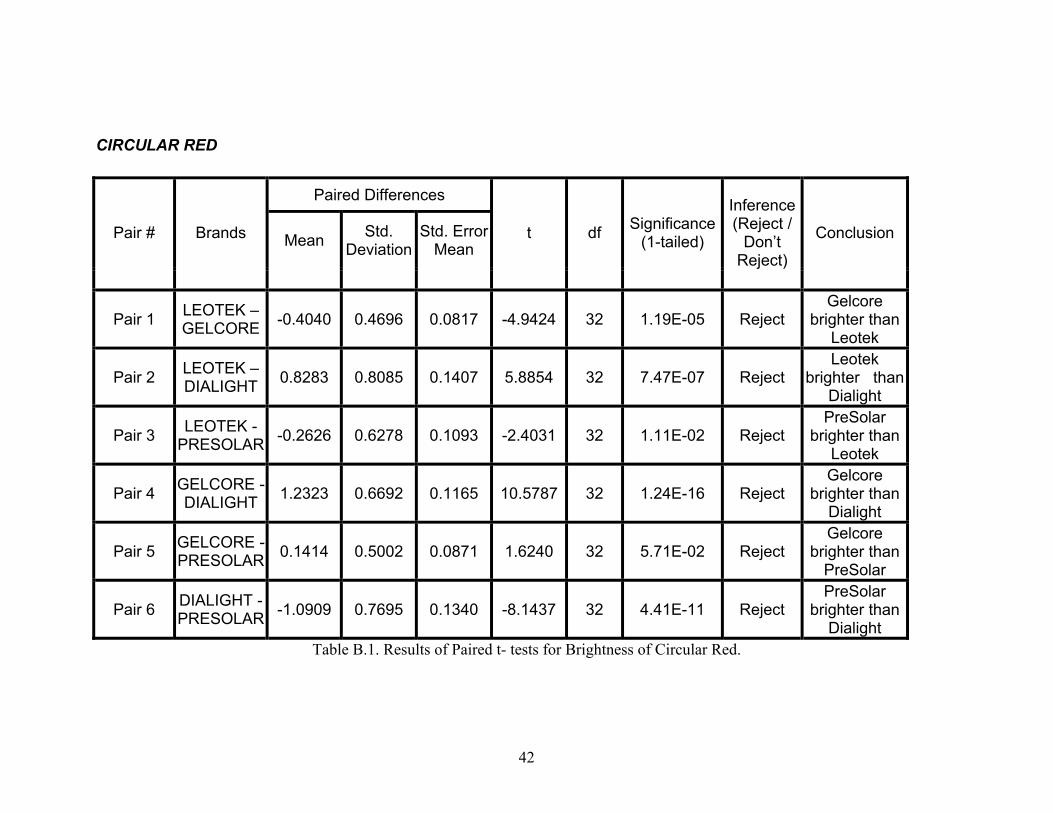
5.1. Circular Red
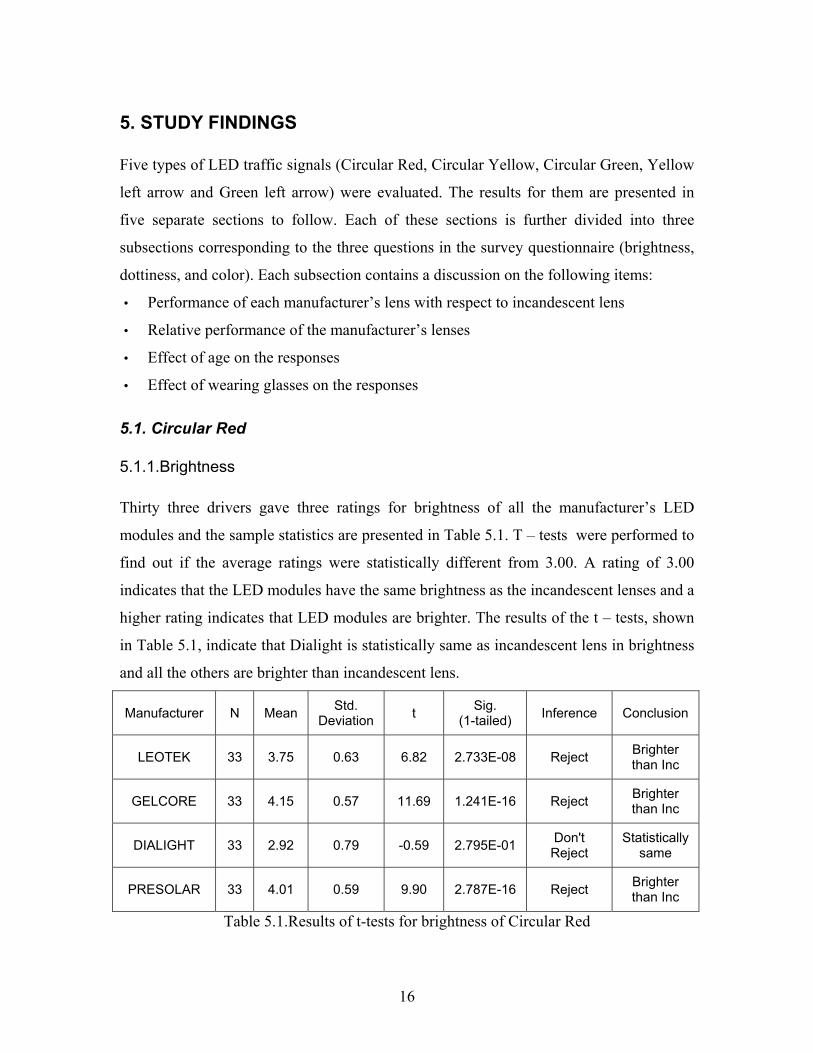
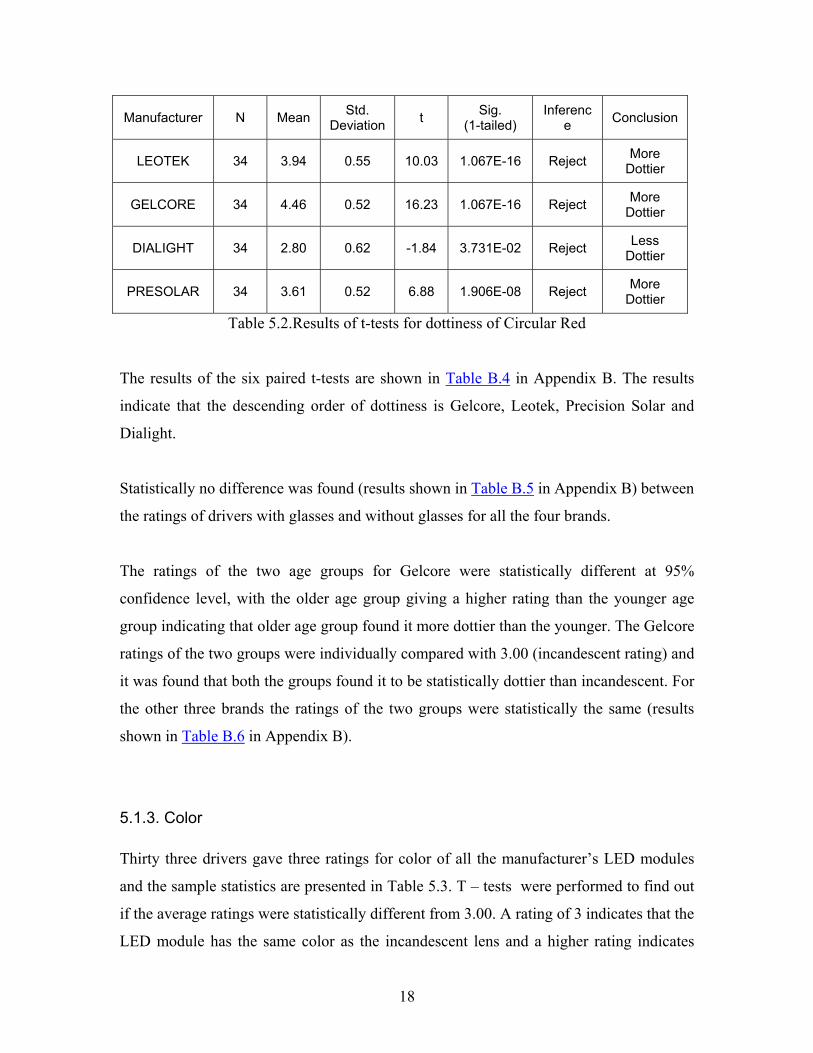
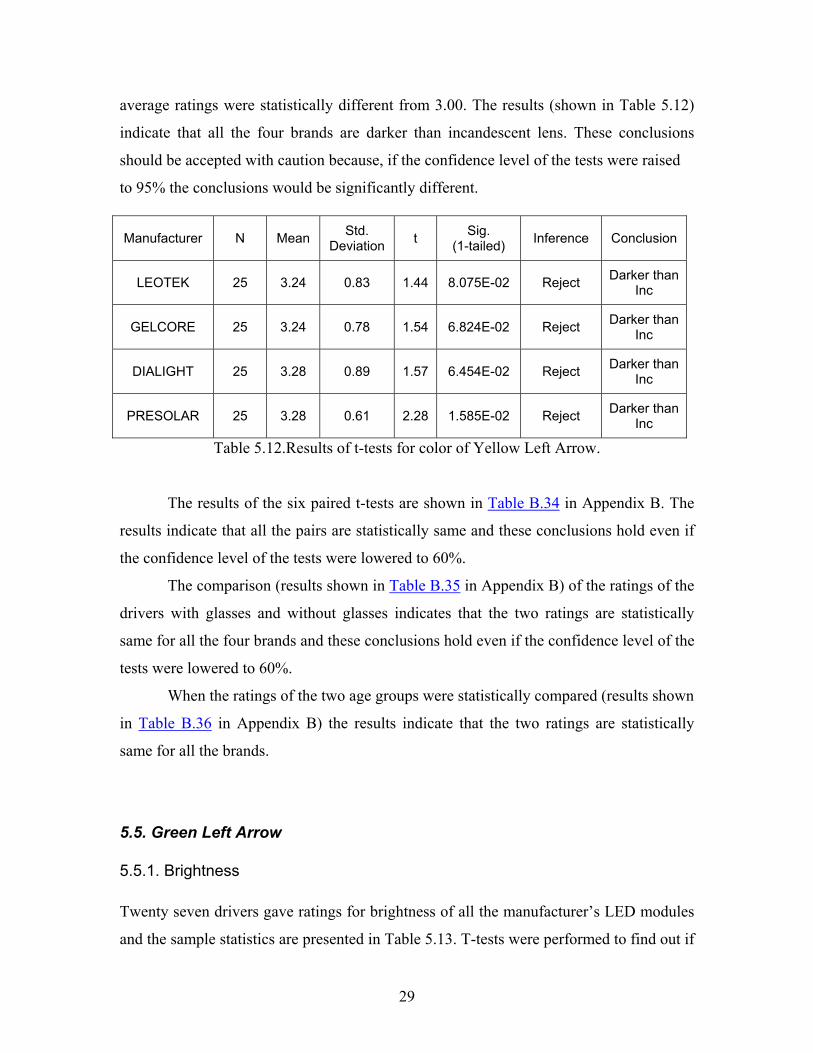
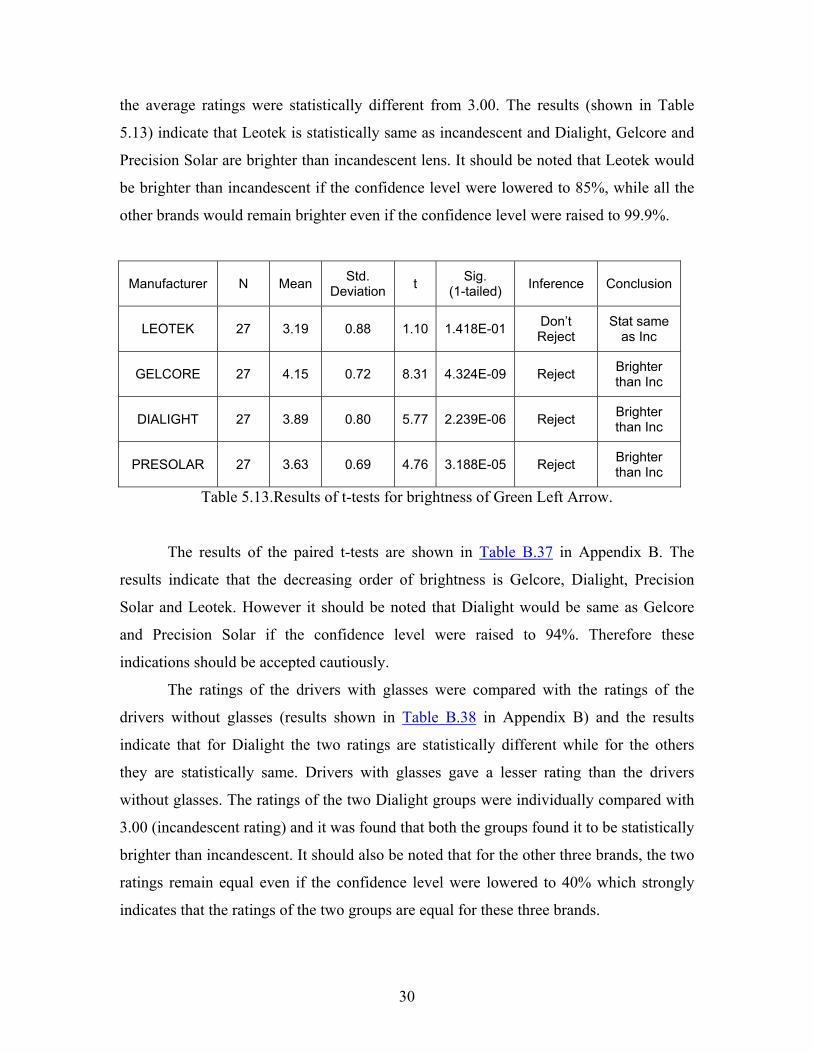
5.1.1.Brightness Thirty three drivers gave three ratings for brightness of all the manufacturer’s LED
modules and the sample statistics are presented in Table 5.1. T – tests were performed to
find out if the average ratings were statistically different from 3.00. A rating of 3.00
indicates that the LED modules have the same brightness as the incandescent lenses and a
higher rating indicates that LED modules are brighter. The results of the t – tests, shown
in Table 5.1, indicate that Dialight is statistically same as incandescent lens in brightness
and all the others are brighter than incandescent lens.
Manufacturer N Mean Std. Deviation t Sig.
(1-tailed) Inference Conclusion
LEOTEK 33 3.75 0.63 6.82 2.733E-08 Reject Brighter than Inc
GELCORE 33 4.15 0.57 11.69 1.241E-16 Reject Brighter than Inc
3. David L Evans. LED Technology in Message Signs and Traffic Signals. ITE 1994
Compendium of Technical Papers, pp 48-52.
4. Kathleen Daly and John D. Bullough. Traffic Signals. Lighting Futures, Vol. 5, No. 1,
2000.
5. Margaret Suozzo. A Market Transformation Opportunity Assessment for LED
Signals. American Council for an Energy-Efficient Economy.
6. Rob Edgar & Charles Close. Using Light Emitting Diodes in Traffic Signals Final
Report. FHWA-OR-RD-99-04, July 1998.
7. Anika Careaga. Light Emitting Diode Signal Installation Final Report. Missouri
Department of Transportation (MoDOT), Feb. 2000.
8. Darryl Winer. Denver leads in LED Traffic Signals. Public Works, Feb. 1997.
9. Ibrahim & Beasley. The Benefits of LED Traffic lights in London and the Pilot Test
Sites. Road Transport Information & Control Conference Publication, 1998.
10. T. Darcy Sullivan et al, Interim LED Purchase Specification of the Institute of
Transportation Engineer; Vehicle Traffic Control Signal Heads, Part 2: LED Vehicle
Traffic Signal Modules, July 1998.
37
Appendix A
38
There are 4 Viewing Stations and 4 LED frames. Please view one frame at a time. Your responses will be kept confidential and your opinions about the LED lights are important to us.
THANK YOU FOR YOUR COOPERATION
• Circle the Station number you are at? 1 2 3 4
• Circle the frame number you are viewing? A B C D
• Are you required to wear glasses or contact lens when driving? a. No b. Yes (please wear them now) HOW BRIGHT ARE THE LED LIGHTS COMPARED TO NEW INCANDESCENT TRAFFIC LIGHTS?
Much About Much No brighter Brighter the same Dimmer dimmer opinion
• RED light on the LEFT signal head 5 4 3 2 1 0 • RED light on the MIDDLE signal head 5 4 3 2 1 0 • RED light on the RIGHT signal head 5 4 3 2 1 0
• YELLOW light on the LEFT signal head 5 4 3 2 1 0 • YELLOW light on the MIDDLE signal head 5 4 3 2 1 0 • YELLOW light on the RIGHT signal head 5 4 3 2 1 0
• GREEN light on the LEFT signal head 5 4 3 2 1 0 • GREEN light on the MIDDLE signal head 5 4 3 2 1 0 • GREEN light on the RIGHT signal head 5 4 3 2 1 0
COMPARED TO NEW INCANDESCENT TRAFFIC LIGHTS, DO THE LED LIGHTS APPEAR SOLID VERSUS A SERIES OF DOTS (DOTTY)?
Much More About Less Much No more dotty dotty the same dotty less dotty opinion
• RED light on the LEFT signal head 5 4 3 2 1 0 • RED light on the MIDDLE signal head 5 4 3 2 1 0 • RED light on the RIGHT signal head 5 4 3 2 1 0
• YELLOW light on the LEFT signal head 5 4 3 2 1 0 • YELLOW light on the MIDDLE signal head5 4 3 2 1 0 • YELLOW light on the RIGHT signal head 5 4 3 2 1 0
• GREEN light on the LEFT signal head 5 4 3 2 1 0 • GREEN light on the MIDDLE signal head 5 4 3 2 1 0 • GREEN light on the RIGHT signal head 5 4 3 2 1 0
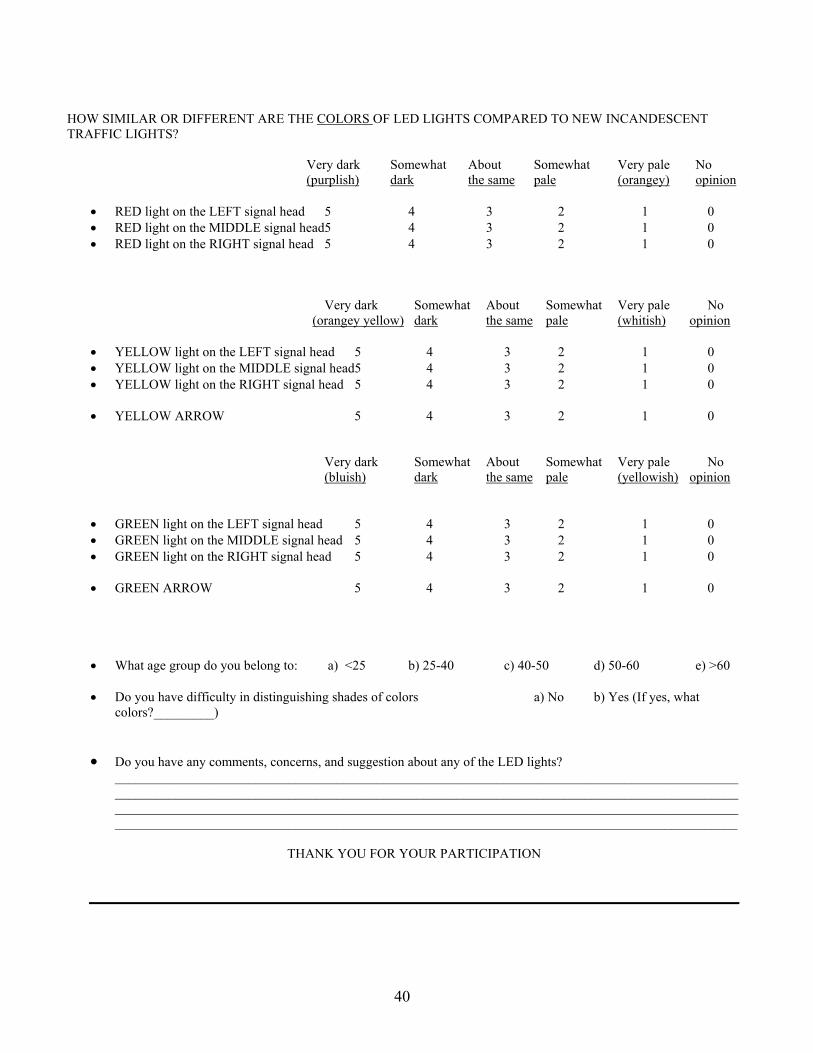
HOW SIMILAR OR DIFFERENT ARE THE COLORS OF LED LIGHTS COMPARED TO NEW INCANDESCENT TRAFFIC LIGHTS?
Very dark Somewhat About Somewhat Very pale No (purplish) dark the same pale (orangey) opinion
• RED light on the LEFT signal head 5 4 3 2 1 0 • RED light on the MIDDLE signal head5 4 3 2 1 0 • RED light on the RIGHT signal head 5 4 3 2 1 0
Very dark Somewhat About Somewhat Very pale No (orangey yellow) dark the same pale (whitish) opinion
• YELLOW light on the LEFT signal head 5 4 3 2 1 0 • YELLOW light on the MIDDLE signal head5 4 3 2 1 0 • YELLOW light on the RIGHT signal head 5 4 3 2 1 0
• YELLOW ARROW 5 4 3 2 1 0
Very dark Somewhat About Somewhat Very pale No (bluish) dark the same pale (yellowish) opinion
• GREEN light on the LEFT signal head 5 4 3 2 1 0 • GREEN light on the MIDDLE signal head 5 4 3 2 1 0 • GREEN light on the RIGHT signal head 5 4 3 2 1 0
• GREEN ARROW 5 4 3 2 1 0
• What age group do you belong to: a) <25 b) 25-40 c) 40-50 d) 50-60 e) >60
• Do you have difficulty in distinguishing shades of colors a) No b) Yes (If yes, what
colors?_________)
• Do you have any comments, concerns, and suggestion about any of the LED lights? ____________________________________________________________________________________________________________________________________________________________________________________________________________________________________________________________________________________________________________________________________________________________________________________
THANK YOU FOR YOUR PARTICIPATION
40
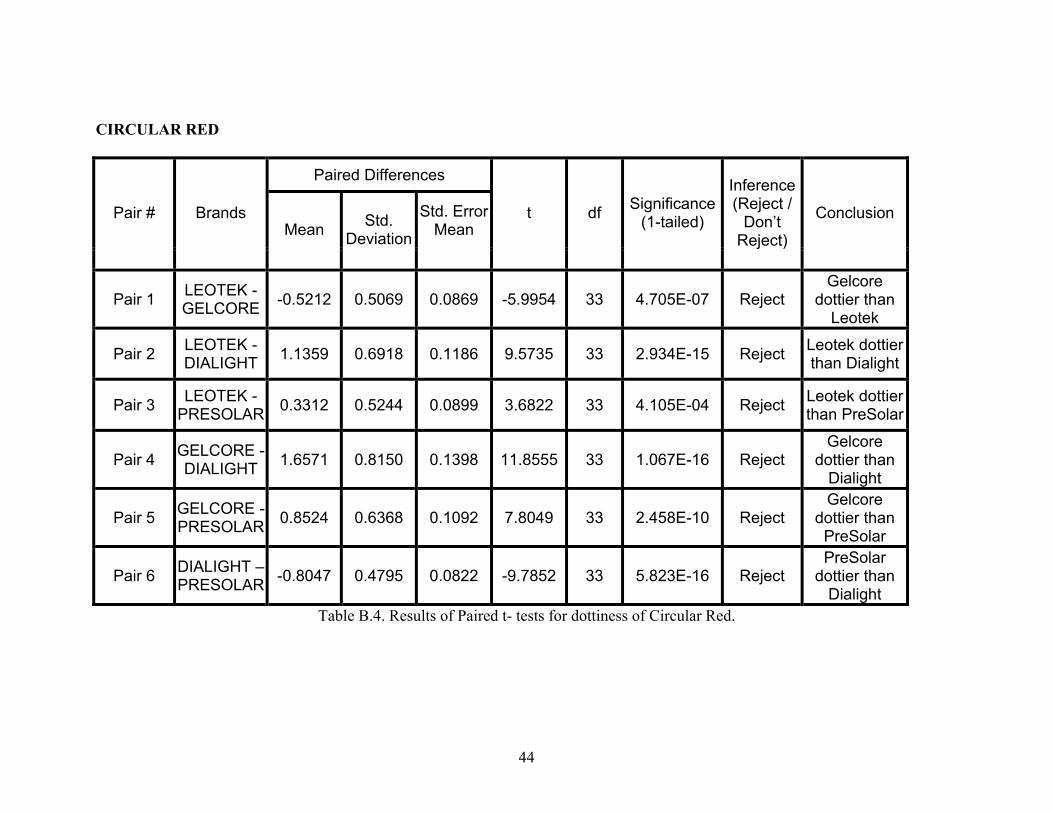
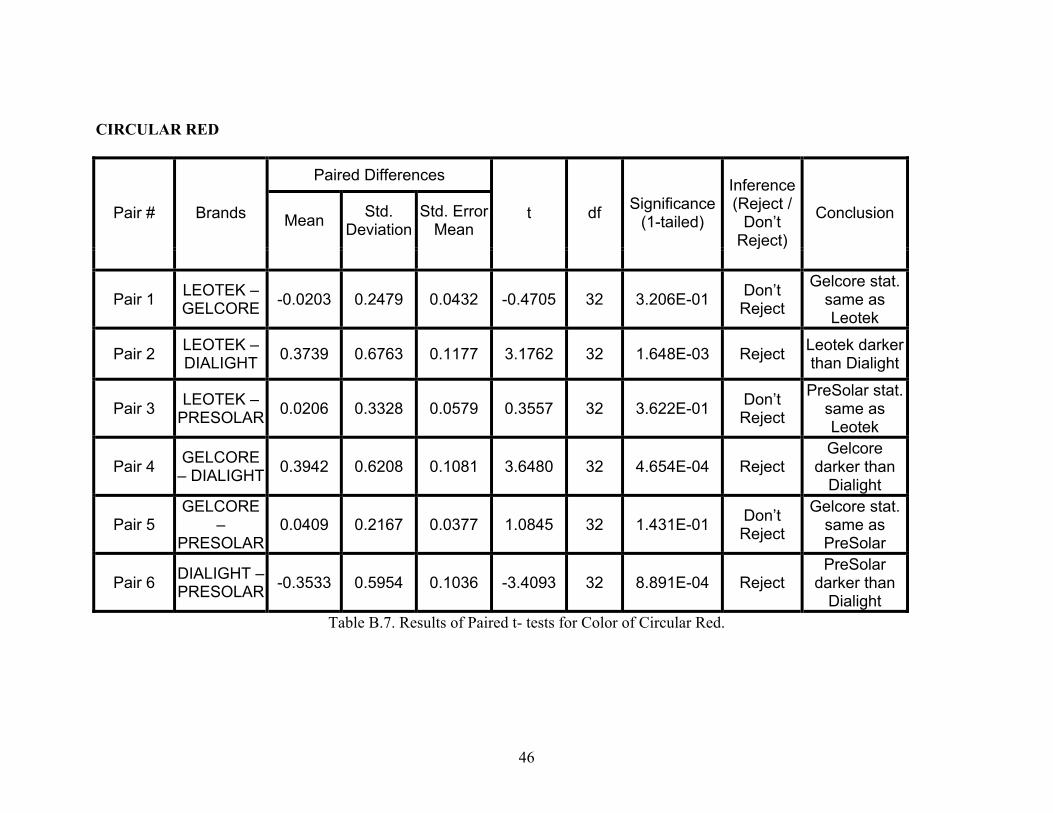
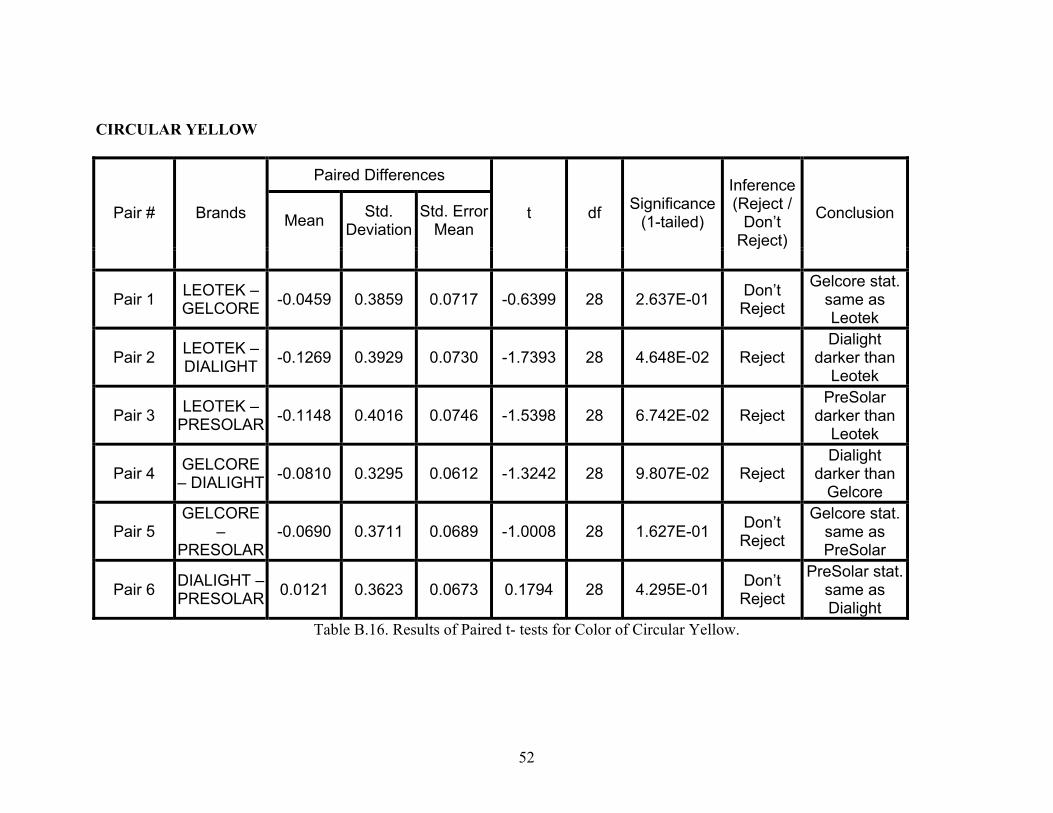
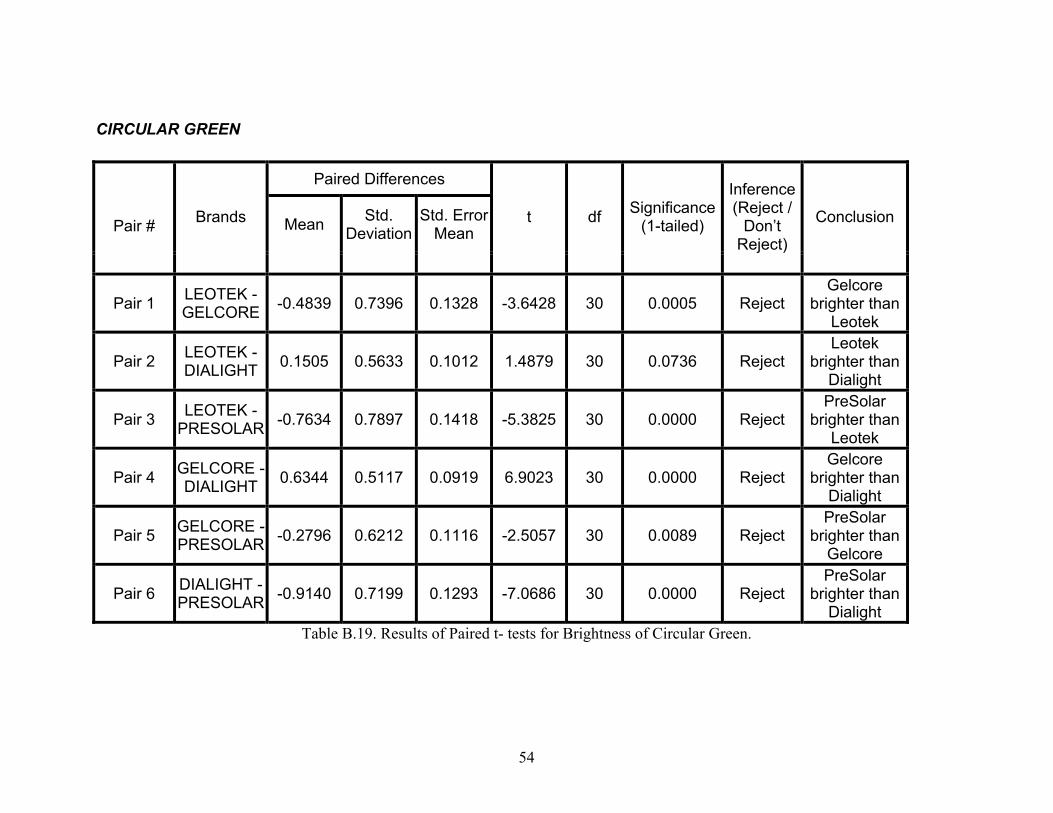
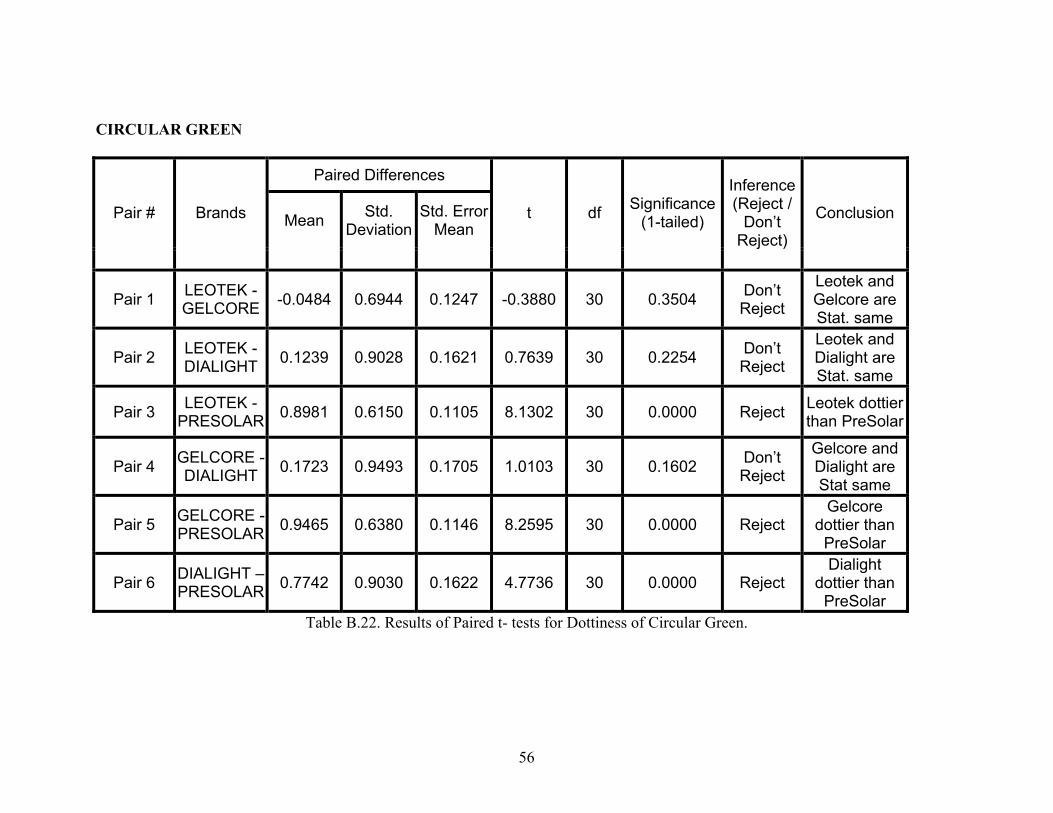
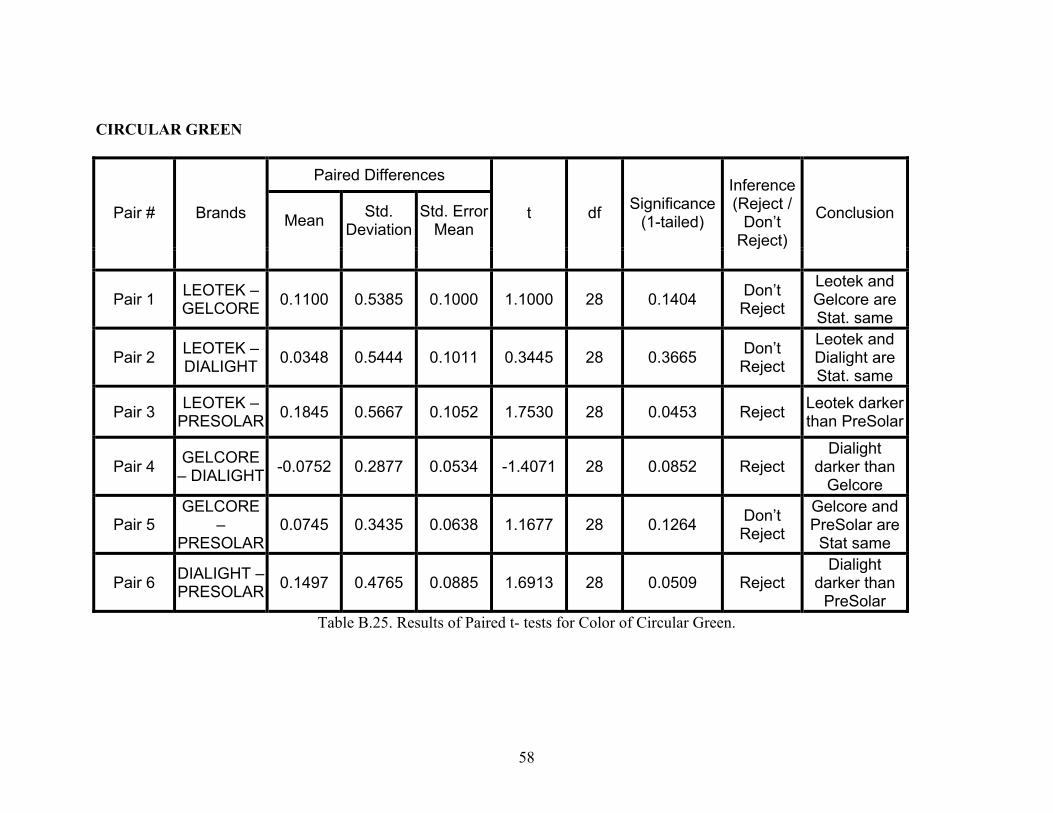
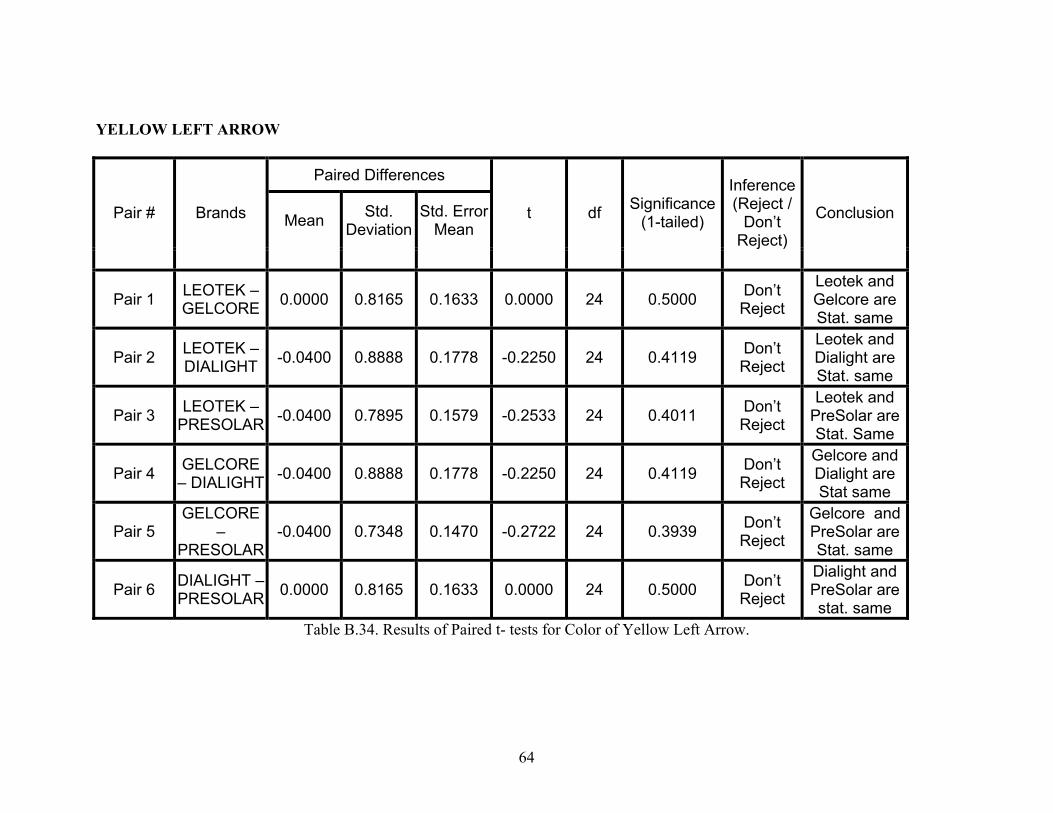
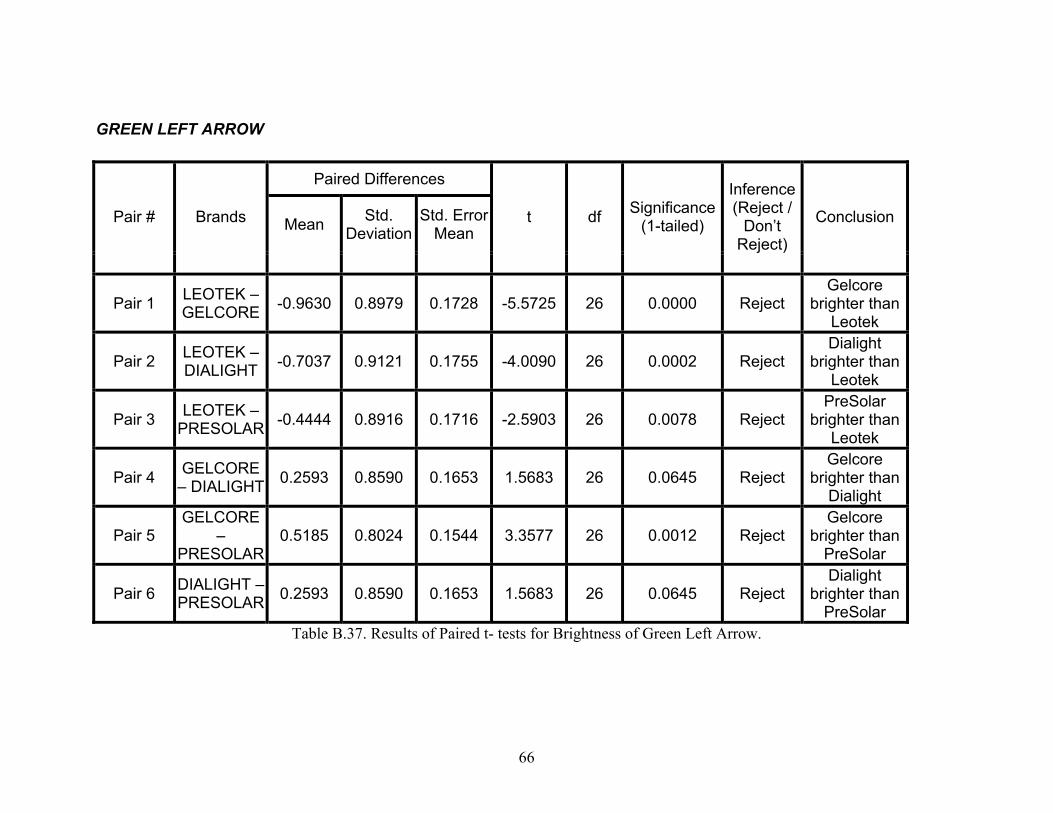
Appendix B One of the objectives was to identify those LED modules that are statistically not
different in terms of brightness, dottiness and color. For this purpose, paired t – tests were
performed to compare the performance of the six possible pairs of the LEDs lenses. The
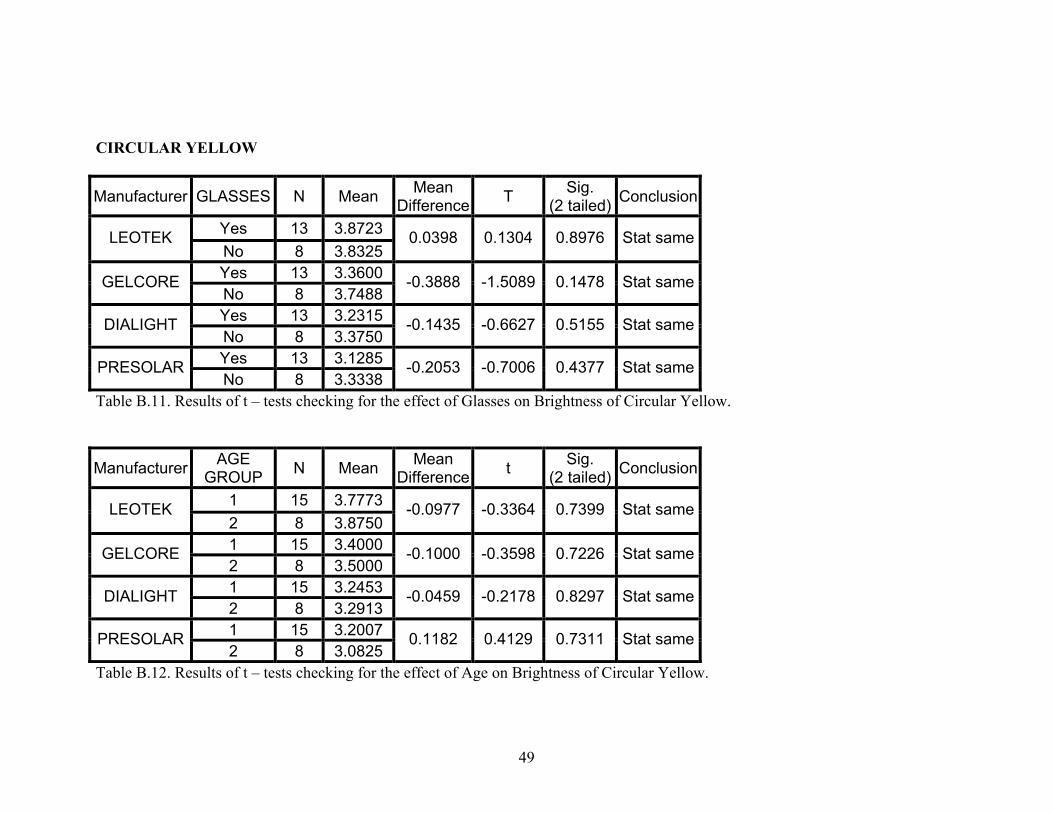
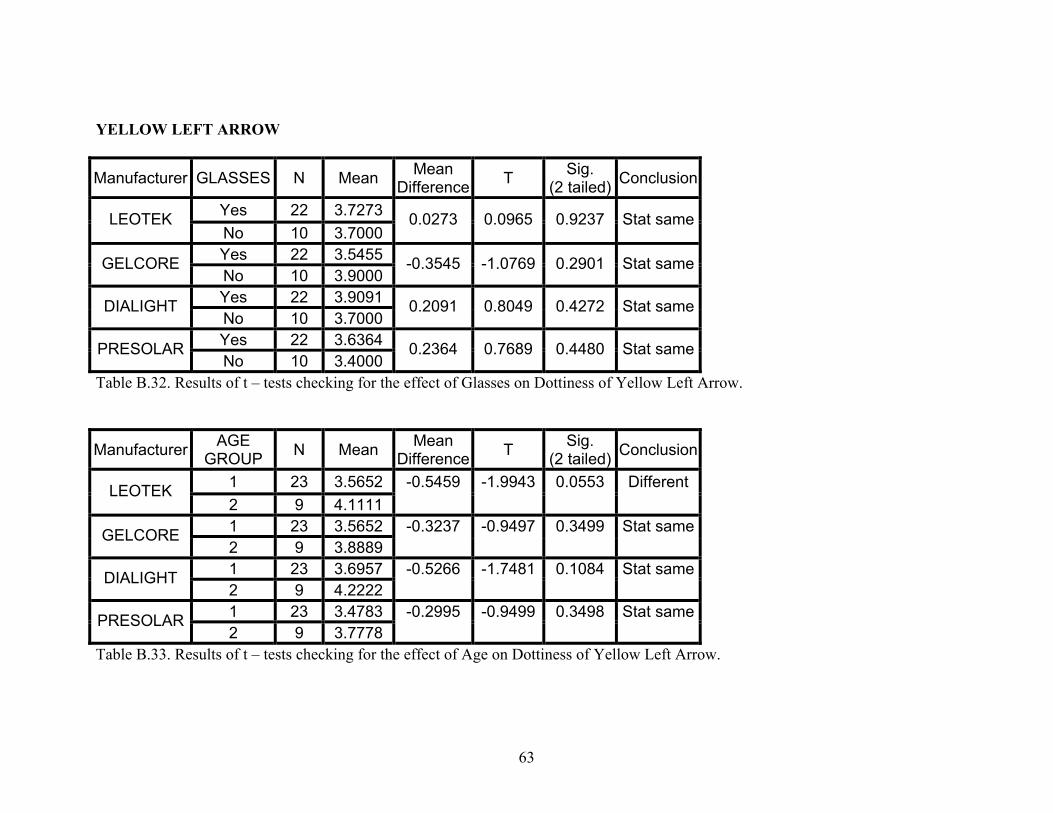
observers’ ratings were segregated according to the age group and tests were performed
to check if there was any difference in the ratings given by the two age groups. Also the
ratings of the observers with and without glasses were compared. For each lens (Circular
Red, Circular Yellow, Circular Green, Yellow Left Arrow, Green Left Arrow) and each
aspect (Brightness, Dottiness, Color) the results of the above mentioned three statistical
tests are shown in the Tables in this Appendix. Note that in the tables Precision Solar is
PreSolar Table B.43. Results of Paired t- tests for Color of Green Left Arrow.
70
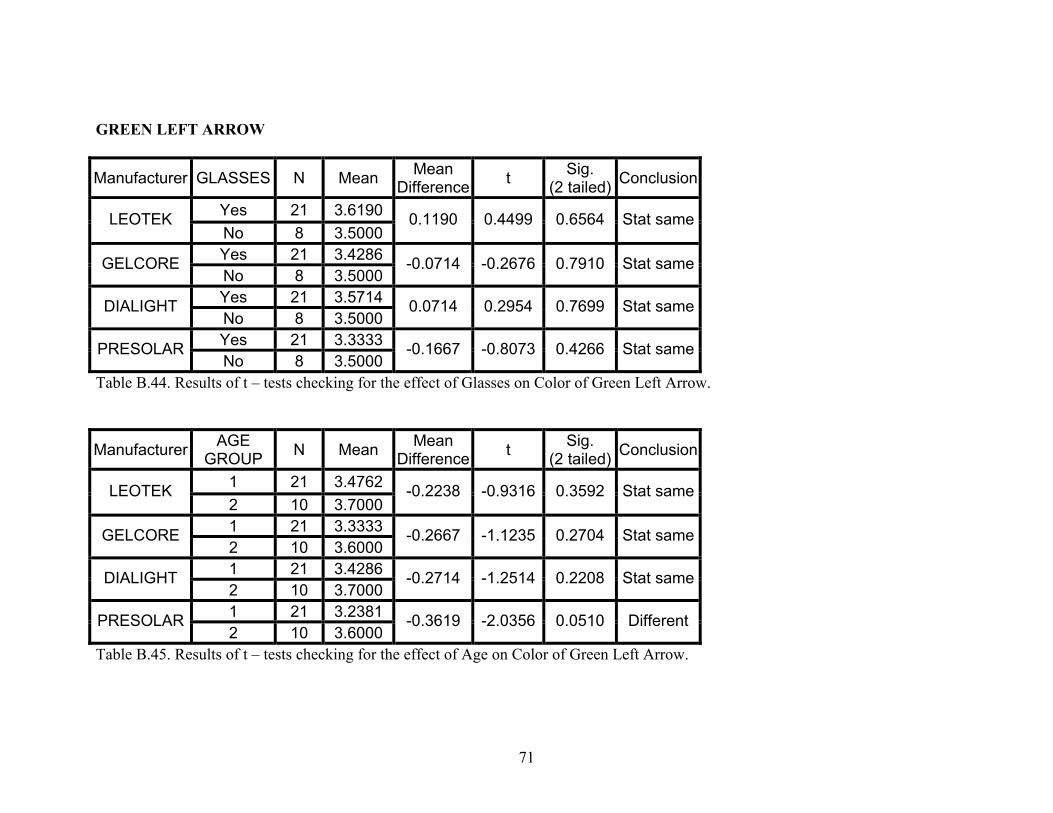
GREEN LEFT ARROW
Manufacturer GLASSES N Mean Mean Difference t Sig.
(2 tailed) Conclusion
Yes 21 3.6190 LEOTEK No
8 3.5000
0.1190 0.4499 0.6564 Stat same
Yes 21 3.4286GELCORE No
8 3.5000
-0.0714 -0.2676 0.7910 Stat same
Yes 21 3.5714DIALIGHT No
8 3.5000
0.0714 0.2954 0.7699 Stat same
Yes 21 3.3333PRESOLAR No
8 3.5000
-0.1667 -0.8073 0.4266 Stat same
Table B.44. Results of t – tests checking for the effect of Glasses on Color of Green Left Arrow.
Manufacturer AGE GROUP N Mean Mean
Difference t Sig. (2 tailed) Conclusion
1 21 3.4762 LEOTEK 2
10 3.7000
-0.2238 -0.9316 0.3592 Stat same
1 21 3.3333GELCORE 2
10 3.6000
-0.2667 -1.1235 0.2704 Stat same
1 21 3.4286DIALIGHT 2
10 3.7000
-0.2714 -1.2514 0.2208 Stat same
1 21 3.2381PRESOLAR 2
10 3.6000
-0.3619 -2.0356 0.0510 Different
Table B.45. Results of t – tests checking for the effect of Age on Color of Green Left Arrow.
71
Appendix C
72
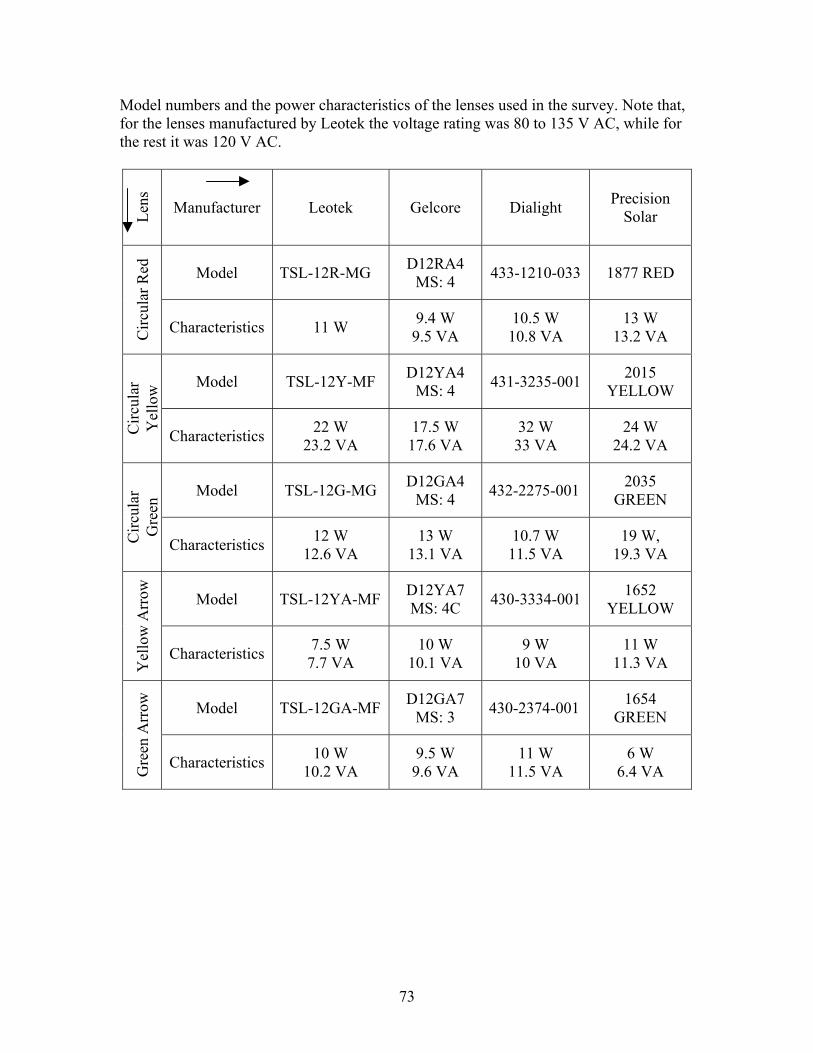
Model numbers and the power characteristics of the lenses used in the survey. Note that, for the lenses manufactured by Leotek the voltage rating was 80 to 135 V AC, while for the rest it was 120 V AC.
Lens
Manufacturer Leotek Gelcore Dialight Precision Solar
Model TSL-12R-MG D12RA4 MS: 4 433-1210-033 1877 RED