Driving Simulator Sickness Management at Turner-Fairbank Highway Research Center Ronald B. Hoffman Science Applications International Corporation Federal Highway Administration Turner-Fairbanks Highway Research Center, HRDS-07 6300 Georgetown Pike, Room F-215 McLean, VA 22101 (202) 493-3387 (202) 493-3390 [email protected]John A. Molino Science Applications International Corporation Federal Highway Administration Turner-Fairbanks Highway Research Center, HRDS-07 6300 Georgetown Pike, Room F-215 McLean, VA 22101 (202) 493-3381 (202) 493-3390 [email protected]Vaughan W. Inman Science Applications International Corporation Federal Highway Administration Turner-Fairbanks Highway Research Center, HRDS-07 6300 Georgetown Pike, Room F-215 McLean, VA 22101 (202) 493-3380 (202) 493-3390 [email protected]July 17, 2003 1
Transcript
Driving Simulator Sickness Management at Turner-Fairbank Highway Research Center
Ronald B. Hoffman Science Applications International Corporation
Federal Highway Administration Turner-Fairbanks Highway Research Center, HRDS-07
DSC North America 2003 Proceedings, Dearborn, Michigan, October 8-10, 2003 (ISSN 1546-5071).
ABSTRACT In the event that an experimental participant demonstrates symptoms of simulator sickness in one of the simulators at the Federal Highways Administration Turner-Fairbank Highway Research Center (TFHRC), a questionnaire and a postural stability test are administered periodically to monitor recovery. The Simulator Sickness Questionnaire (SSQ; Kennedy et al., 1993) is administered until the participant yields scores that are negligible values. For the participant with simulator sickness symptoms, the Total Severity Score (T), the Nausea (N), Oculomotor (O), and Disorientation (D) scores are monitored over two hours (if necessary) for decreases to values equal to or below baseline values. Likewise, the affected participant is monitored with an ataxia test, the Sharpened Romberg (SR) Postural Stability Test (Fregly and Graybiel, 1968) for recovery to the pre-drive level or greater. The simulator sickness management procedures are described in detail. The incidence of simulator sickness in the TFHRC Highway Driving Simulator (pitch, roll, and z-body axis motions) and the success of its management are discussed. INTRODUCTION Simulator sickness, a type of cybersickness (occurring both during and after exposure to a virtual environment) is differentiated from common motion sickness by the situation in which a person is often stationary but has a remarkable sense of self-motion through moving visual imagery and experiences symptoms similar to motion sickness symptoms. Although both motion sickness and simulator sickness produce the same types of symptoms, they are not identical. For motion sickness, vestibular stimulation alone can be sufficient to induce sickness condition, even though vision also can be a contributing factor. In the case of simulator sickness, the sickness can occur with only visual stimulation and no vestibular stimulation. One of the potentially dangerous problems for simulator sickness or any type of cybersickness is the possible after-effects that can develop in the hours following the virtual environment (VE) experience. These after-effects can linger for hours (1) and in some situations, for days (2). Consequently, in order to assure appropriate treatment of human research participants and the approval of the Human Centered Systems Teams’ experimental protocols by the Institutional Review Board (IRB)), a questionnaire and a postural stability test were selected for administering to all participants and for monitoring recovery in the event that simulator sickness is detected. At TFHRC, there are two types of simulation facilities that have the potential for inducing simulator sickness:
�� Fully Interactive Driving Simulator: Highway Driving Simulator (HDS). This simulator has the central feature of a car cab. Except for the engine, drive train, fuel system, and airbag system, the car is a complete four-door Saturn vehicle and participants in an experiment "drive" this essentially intact vehicle.
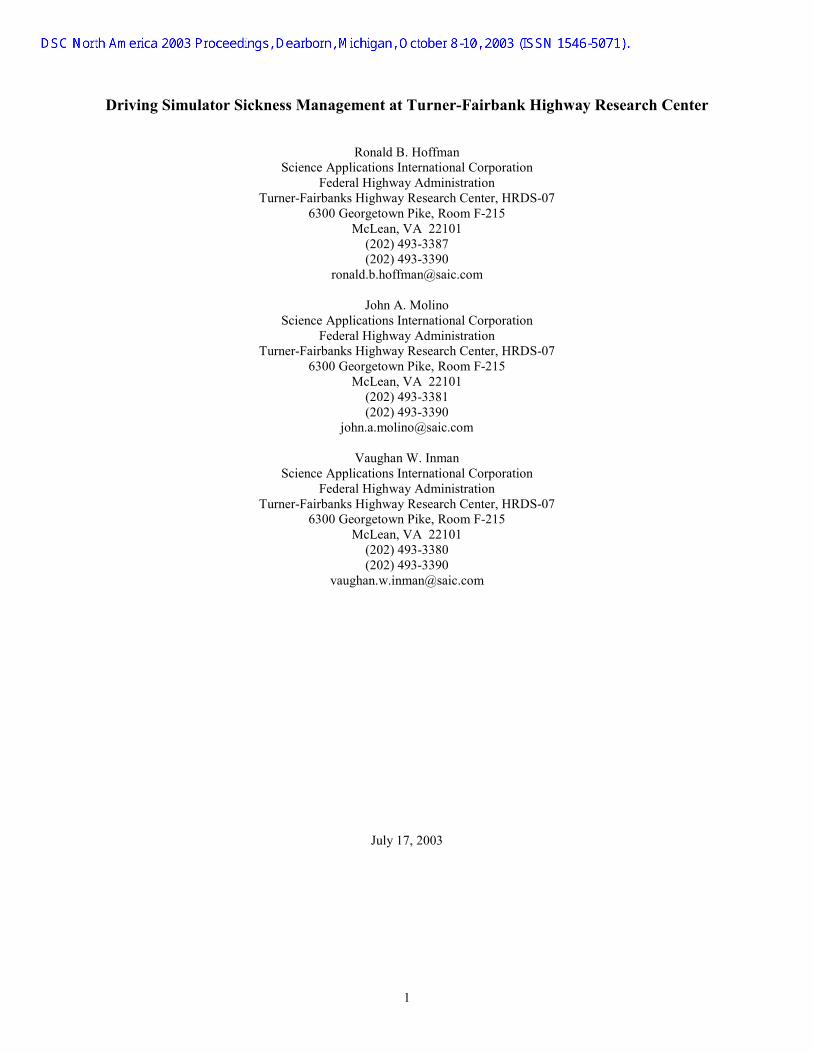
This vehicle is mounted on an electrically actuated motion base. The motion base is a three-degree of freedom design, and is directly controlled by the main simulation computer system, an SGI ONYX2 System. The motion base responds to the driver's actions by adjusting the pitch, roll, and z-body motion (heave) of the car cab. A speaker and bass shaker is mounted in each of the wheel wells of the car cab to simulate engine noise, tire squeal, and to provide roadway vibrations. The vibration unit will activate when the car operates on uneven terrain (i.e. rumble strips, roadway delineators, possibly even the texture of the road itself). There is also a group of four speakers that are positioned around the car, giving real-world like three-dimensional sound. As the car is operated, the driver views a roadway scene and surrounding environment projected on two screens, a screen to the front and sides of the car cab and one directly behind the car cab as shown in the bird's eye view in Figure 1.
2
NADS & Simulation Center
DSC North America 2003 Proceedings, Dearborn, Michigan, October 8-10, 2003 (ISSN 1546-5071).
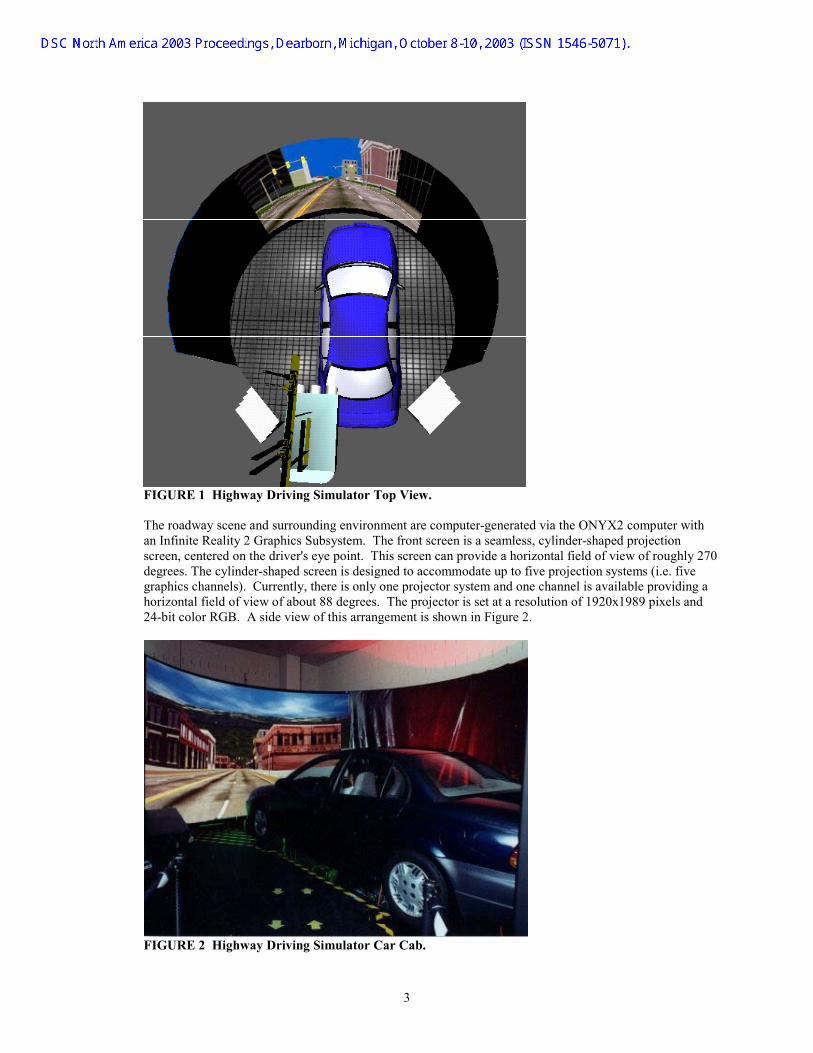
FIGURE 1 Highway Driving Simulator Top View. The roadway scene and surrounding environment are computer-generated via the ONYX2 computer with an Infinite Reality 2 Graphics Subsystem. The front screen is a seamless, cylinder-shaped projection screen, centered on the driver's eye point. This screen can provide a horizontal field of view of roughly 270 degrees. The cylinder-shaped screen is designed to accommodate up to five projection systems (i.e. five graphics channels). Currently, there is only one projector system and one channel is available providing a horizontal field of view of about 88 degrees. The projector is set at a resolution of 1920x1989 pixels and 24-bit color RGB. A side view of this arrangement is shown in Figure 2.
FIGURE 2 Highway Driving Simulator Car Cab.
3
NADS & Simulation Center
DSC North America 2003 Proceedings, Dearborn, Michigan, October 8-10, 2003 (ISSN 1546-5071).
The second screen is a rear projection screen, located behind the car cab. The driver can view this screen by looking through the rear and driver's side-view mirrors. Another high-resolution video projector, a Barco 1200 Video Projector is used to project the image onto this screen. This projection unit is mounted behind the projection screen. Together, these systems can be combined to generate the roadway environment scene. In reality, the driver perceives slightly different viewpoints from the rear and side-view mirrors. This difference was ignored in the HDS scenarios. The states of most simulation modules are sensed by the ONYX2 computer and software. All of the modules are under computer control. The Vehicle Dynamics Model (VDM) used in the current studies is based upon the VDM provided by Illusion Technologies International (ITI), Inc. It is comprised of five major components: engine, transmission, steering, suspension and brakes. The engine model uses an ideal air cycle with throttle-limited airflow to determine the engine torque and transforms the torque based upon the selected gear. The torque is proportioned from the transmission to the drive wheels using a differential gear. The steering model calculates the tire slip angles, lateral acceleration, longitudinal acceleration, yaw rate, etc. for a vehicle in steady state cornering. The suspension model uses simple damped linear spring equations to determine suspension roll and pitch caused by vehicle accelerations. The brake model generates wheel torques as a function of driver brake pedal force and brake controller commands. A summary of the motion limits for the HDS is presented in Table 1.
Front Bumper +532 mm to -504 mm (+20.93 in to -19.86 in)
Front Bumper +438 mm (+17.26 in)
Pitch +14.610
to -13.840
Rear +576 mm to -533 mm (+22.69 in to -20.98 in)
+12%
Rear +475 mm (+18.71 in)
Roll +18.880 Side +271 mm (+ 10.68in)
+15% Side +217 mm (+8.54 in)
Heave (z-body axis)
+203 mm (+8 in) +203 mm (+8 in)
TABLE 1 Summary of HDS Motion Limits The experimenter and HDS staff can monitor simulator operations using the central control console. The experimenter and staff can also verify that the experiment is progressing according to plan, observe the driver and the roadway scene, and check to assure data is being properly collected and recorded. Available data collection capabilities encompass (1) speed, (2) elapsed time, (3) steering wheel position, (4) number and pressure of brake applications, (5) accelerator position, (6) lateral placement, and (7) discrete event occurrences (experimenter defined responses to stimuli). The HDS capabilities include simulation of: (1) various road surfaces and roadway surface conditions, (2) various sets of vehicle dynamics to simulate different vehicle types, (3) fog and other atmospheric effects, (4) wind and road noises, (5) a siren sound activated when the driver exceeds a certain preset speed, (6) Highway Advisory Radio or other messages, in-vehicle video displays, for example, of ATIS navigation aids, (7) sloped driving surfaces, and (8) rumble strips or tire vibration.
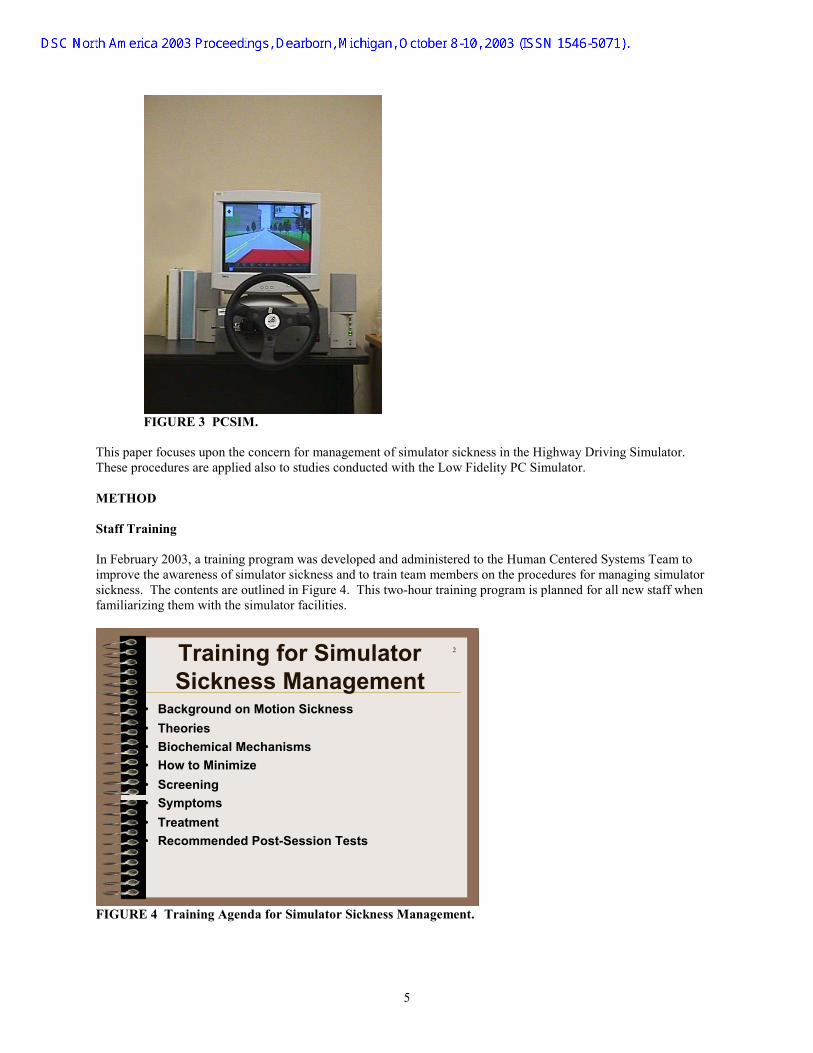
�� Low Fidelity/Part-Task Simulators: PC Simulator (PCSIM) The PCSIM, shown in Figure 3, is a fixed interactive driving simulator with a desktop driving console and a computer monitor display. The driving scene is fully interactive, but there is no motion base. This part-task driving simulator is based on a PC computer and can be programmed easily by means of the Scenario Definition Language (SDL). It is a driver-in-the-loop simulator that makes it possible to develop low cost interactive driving simulations. This relatively new simulator is being used to research various highway safety issues, such as roadway and intersection design, driver behavior/performance, and pedestrian and bicycle safety.
4
NADS & Simulation Center
DSC North America 2003 Proceedings, Dearborn, Michigan, October 8-10, 2003 (ISSN 1546-5071).
FIGURE 3 PCSIM.
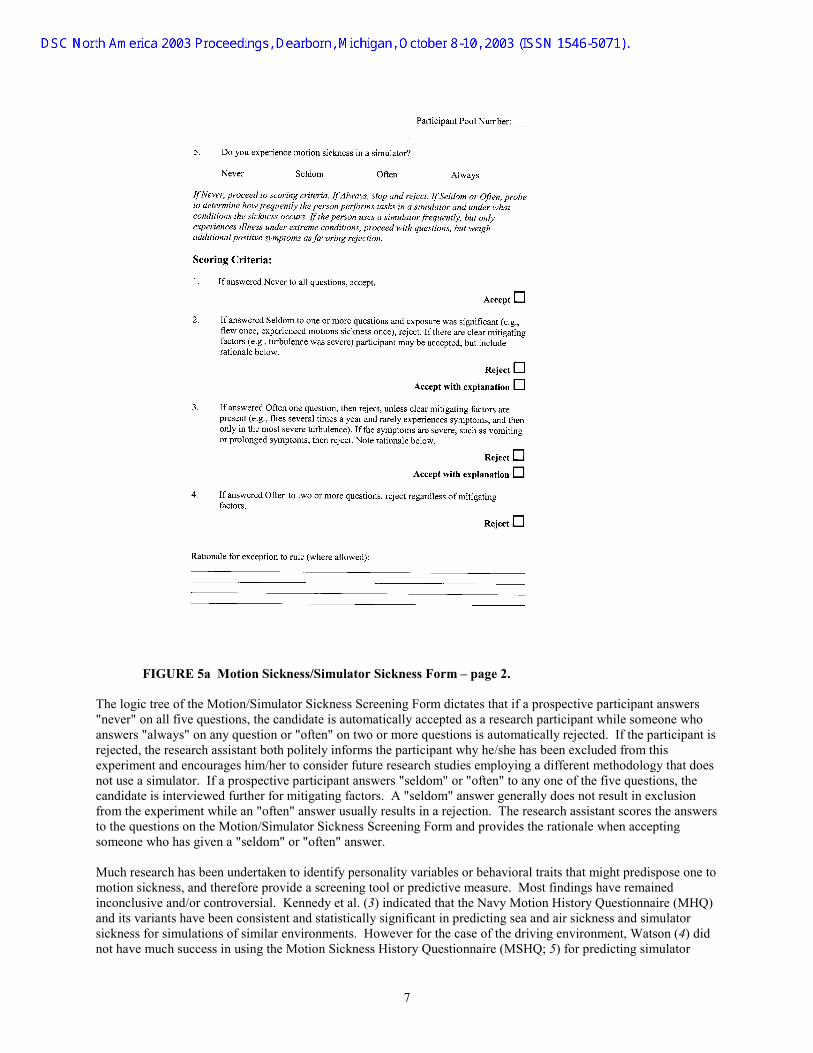
This paper focuses upon the concern for management of simulator sickness in the Highway Driving Simulator. These procedures are applied also to studies conducted with the Low Fidelity PC Simulator. METHOD Staff Training In February 2003, a training program was developed and administered to the Human Centered Systems Team to improve the awareness of simulator sickness and to train team members on the procedures for managing simulator sickness. The contents are outlined in Figure 4. This two-hour training program is planned for all new staff when familiarizing them with the simulator facilities.
IGURE 4 Training Agenda for Simulator Sickness Management.
2Training for SimulatorSickness Management
• Background on Motion Sickness• Theories• Biochemical Mechanisms• How to Minimize• Screening• Symptoms• Treatment• Recommended Post-Session Tests
F
5
NADS & Simulation Center
DSC North America 2003 Proceedings, Dearborn, Michigan, October 8-10, 2003 (ISSN 1546-5071).
Screening Procedure
order to minimize the number of experiment participants that may be sensitive to simulator sickness, a screening
hat it is
there is no “very susceptible to motion sickness” indicated, the intake form is filed for the intended simulator
phone.
Inprocess is used during recruitment. Prospective research participants are first screened for susceptibility to simulator sickness by means of the Participant Pool Intake Form (available from first author). A research assistant fills out this form during a telephone conversation with a prospective participant. If this participant notes a high susceptibility to motion sickness (in terms of frequency of occurrence), the research assistant politely notes tnot advisable for the candidate to participate. Although the prospective participant is excluded from a potential simulator study, he/she is included in the TFHRC confidential database of potentially interested research participants. Ifexperiment until the appointments are scheduled. When a research assistant later again calls a prospective participant to initiate scheduling, the Motion/Simulator Sickness Screening Form is completed over the teleThis form is illustrated in Figure 5a and Figure 5b.
FIGURE 5a Motion Sickness/Simulator Sickness Form – page 1.
6
NADS & Simulation Center
DSC North America 2003 Proceedings, Dearborn, Michigan, October 8-10, 2003 (ISSN 1546-5071).
FIGURE 5a Motion Sickness/Simulator Sickness Form – page 2.
he logic tree of the Motion/Simulator Sickness Screening Form dictates that if a prospective participant answers
s
at does
ers
uch research has been undertaken to identify personality variables or behavioral traits that might predispose one to
HQ)
id
T"never" on all five questions, the candidate is automatically accepted as a research participant while someone who answers "always" on any question or "often" on two or more questions is automatically rejected. If the participant irejected, the research assistant both politely informs the participant why he/she has been excluded from this experiment and encourages him/her to consider future research studies employing a different methodology thnot use a simulator. If a prospective participant answers "seldom" or "often" to any one of the five questions, the candidate is interviewed further for mitigating factors. A "seldom" answer generally does not result in exclusion from the experiment while an "often" answer usually results in a rejection. The research assistant scores the answto the questions on the Motion/Simulator Sickness Screening Form and provides the rationale when accepting someone who has given a "seldom" or "often" answer. Mmotion sickness, and therefore provide a screening tool or predictive measure. Most findings have remained inconclusive and/or controversial. Kennedy et al. (3) indicated that the Navy Motion History Questionnaire (Mand its variants have been consistent and statistically significant in predicting sea and air sickness and simulator sickness for simulations of similar environments. However for the case of the driving environment, Watson (4) dnot have much success in using the Motion Sickness History Questionnaire (MSHQ; 5) for predicting simulator
7
NADS & Simulation Center
DSC North America 2003 Proceedings, Dearborn, Michigan, October 8-10, 2003 (ISSN 1546-5071).
sickness in the high fidelity driving simulator at the University of Iowa. If an individual has demonstrated motion sickness in a particular setting, the probability is high that the same
ow
r
imulator Sickness Monitoring Procedure
s mentioned above, all experimenters on the Human Centered Systems Team who collect data in the simulators at
efore an experiment is run, the experimenter requests each participant to complete the Simulator Sickness s of a
was
n
nd
lso, the Sharpened Romberg (SR) Postural Stability Test (7) is administered. This classical ataxia test is This test
er
xperimenters will stop the simulator run if they observe significant symptoms of simulator sickness such as is
r at
hen the participant appears to be comfortable, the experimenter questions him/her if sufficient recovery has d the
individual will exhibit the same susceptibility again when exposed to the same or similar provocative stimuli. Although many individuals when exposed to the same environment will adapt with repeated exposures (often depending on the interval between such exposures) and symptoms will decrease, other persons must be taught hto cope and develop adaptations. Nevertheless at TFHRC, participants are generally placed in training trials before the actual experimental runs are implemented and carefully monitored for the development of early simulator sickness symptoms. These training trials serve as valuable screening trials and as an additional means to furtheeliminate those sensitive individuals that may have slipped through the recruitment screening process. As Watson(4) has suggested, this type of screening session may serve as a more practical method for assessing an individual’ssusceptibility for simulator sickness rather than any motion sickness history questionnaire used as a predictive tool. In fact, the training/screening session could be the very best predictive index for any simulator operator. S Athe TFHRC are trained to identify and, if necessary, to assist participants to recover from simulator sickness. BQuestionnaire (SSQ; 6) as depicted in Figure 6. The complete version of the SSQ now includes three sectionfew questions each in addition to the symptom checklist (personal communication, R.S. Kennedy ). The Pre-Exposure Background Information section has been omitted at TFHRC because much of the same informationcovered in the participant screening forms described above. Slightly modified versions of the Pre-Exposure Physiological Status Information section and the Post-Exposure Information section are included in the SSQ protocol used. Both of these sections incorporate one additional question each to probe for additional informatioabout symptoms (dizziness and disorientation). The participant’s responses are reviewed to determine his/her physical well-being and the SSQ score before the training trials are initiated. The SSQ is completed both pre- apost-drive for the HDS and the Low Fidelity PCSIM. The pre-drive and post-drive total severity scores and the subscale categories of nausea (N), oculomotor discomfort (O), and disorientation (D) are used for analyses of anysimulator sickness incidents. Aadministered to acquire baseline data but not to screen participants on susceptibility to simulator sickness. is performed on a hard floor with the participant in a stringent body position of arms folded against the chest, feet (shoes on or barefoot if wearing high heels) heel to toe and tandem aligned (participant preferred foot in front) andbody erect or nearly erect. The participant is required to close his/her eyes at any time after assuming the correct body and foot positions. Then the time of maintaining the stance with closed eyes is measured up to 60 seconds ptrial for four trials. Durations of five seconds or less are considered false starts and omitted from the data collection. The classical scoring has been modified to a selection of the best three of four trials for computing an average. The test is administered again after the simulator runs. The variability of this measure has been investigated and has been found to be relatively stable and reliable with little learning over days (8, 9). Ehyperventilation, nausea, vomiting, or fainting. Periodic dialog between the experimenter and the participant designed to probe and elicit the general well-being of the participant. If a simulator run is stopped, the laboratorylights are switched on if they were turned off, and the affected participant is helped out of the simulator. The participant is guided to a comfortable chair and is instructed to sit with her/his feet elevated and eyes closed foleast five minutes. A motion sickness bag is immediately at hand (but not shown) for the participant that requests one or is on the verge of vomiting. Woccurred to complete the SSQ and perform the SR Postural Stability Test. Subsequently, the questionnaire anstability test are administered approximately every 20 – 30 minutes until the affected participant reaches pre-determined criteria (usually scores at pre-drive levels) or until two hours elapses.
8
NADS & Simulation Center
DSC North America 2003 Proceedings, Dearborn, Michigan, October 8-10, 2003 (ISSN 1546-5071).
FIGURE 6 Symptom Checklist in SSQ.
hen the participant passes the two recovery assessments, he/she is paid for the entire experiment and any extra
the affected participant does not pass both recovery assessments within the two hours, the experiment staff will
ust
Wtime needed for recovery. Extra time for recovery beyond the allotted amount for the experiment is paid on a pro-rata basis for each one-half hour or fraction thereof. The participant is then released to leave. Ifcall and pay the fare for a taxi to drive the participant home. The participant is encouraged to relax there until the symptoms pass. Research staff will later call the participant at home to monitor the recovery. On a pre-arranged basis, FHWA will pay the taxi fare for the return trip for the participant to retrieve his/her car. If an affected participant refuses to take the two assessments and/or leaves the research facility without recovering, he/she msign a Caution Acknowledgement Waiver shown in Figure 7.
FIGURE 7 Caution Acknowledgement Waiver at TFHRC.
9
NADS & Simulation Center
DSC North America 2003 Proceedings, Dearborn, Michigan, October 8-10, 2003 (ISSN 1546-5071).
Methodological Limitations As in most behavioral management procedures that are dependent upon the participant subjective responses, the
t.
tive
hese simulator sickness management procedures have been only recently fully implemented, so only a small for
addition to the results of management methodology being limited by participant veracity and number, the problem
ilot Study
brief pilot study was conducted to compare two motion cue algorithms for the HDS. The experiment consisted of
here were four different types of curves: 1) right hand – 30 degrees of curvature (per 30.48 m or 100 ft); 2) left 0
s
d
nd
fter the first simulator run session of 16 trials, there was a short break of one to two minutes, followed by the
ime
n experimenter rode in the passenger seat for all trials and collected perceptual response data on paper forms.
r a 3-
veracity of the participant's responses can impact the success of being able to manage a simulator sickness incidenIt is assumed that most participants will disclose their feelings but some may not. If a participant, for whatever reason, decides to suppress information about his/her well-being, then the experimenter cannot achieve the effeccontrol over a simulator sickness incident. It is noteworthy that even in the small pilot study described below, there was a case in point of a participant denying symptoms he had just circled on the SSQ a couple of minutes before the experimenter gently probed the checklist results. The participant responded to the experimenter's queries, "Oh, I am not experiencing those anymore…" Tnumber of participants (seven males and seven females, total of 14) have been monitored accordingly and usedthe data presented in this paper. Additional data collections in the near future could shift some of the trends presented below. Inof observer variability, which has not been investigated, could be an additional confounding factor. P Athree driving sessions for each research participant: driving, riding, and blindfolded. In one simulator run session (active “steering” condition) the participant drove the simulator vehicle through a series of 16 curves in a random order. In a second simulator run session (passive “riding” condition), the simulator vehicle drove itself through the same series of 16 curves in a different random order, and the research participant passively sat in the driver’s seat and visually observed. In the third simulator run session (passive “blindfolded” condition), the simulator vehicle drove itself through the same series of 16 curves in a different random order, and the research participant passivelysat in the driver’s seat and wore a blindfold. In all three sessions, vehicle speed remained steady at 72.4 km per hr (45 mph; cruise control). Thand – 30 degrees; 3) right – 10 degrees; and 4) left – 10 degrees. All curves had a 90-degree deflection angle, a percent superelevation, high luminance pavement markings, and no vertical curves. These four different curve typewere randomized over each block of 16 trials in a different order each time. There were two different motion cueing algorithms: one where the car cab leaned into the curve and the other where car cab leaned out of the curve. These two motion algorithms were randomized over each block of 16 trials in a different order. Thus in any one driving session there were four different curve types paired with two different motion algorithms, or eight combinations, anone replication to make a total of 16 trials per block. Each trial consisted of a tangent, followed by a curve, followed by another tangent and took about 30 seconds. This pilot study concentrates primarily on the problem of determining appropriate motion cues for turning in curves. The motion cues associated with accelerating adecelerating were not investigated. Asecond run session, another short break, and a third run session. Each simulator run session took seven to eight minutes. A series of three sequential sessions were run for each participant, resulting in a total active exposure t21 to 24 minutes over about a half hour. There were no training sessions for this pilot study. AMore details on this study and the findings concerning parameters affecting motion perceptions are described in another paper at this conference by the second author. The research participants for the pilot study were derived from a pool of employees at the TFHRC, either government or contractor staff. The data collected for two participants were not considered for the motion cues analyses (presented in the other paper: Motion Cues foDOF Driving Simulator) because one participant developed simulator sickness and did not complete the three sessions, and the other was rejected to balance treatment groups.
10
NADS & Simulation Center
DSC North America 2003 Proceedings, Dearborn, Michigan, October 8-10, 2003 (ISSN 1546-5071).
RESULTS AND DISCUSSION
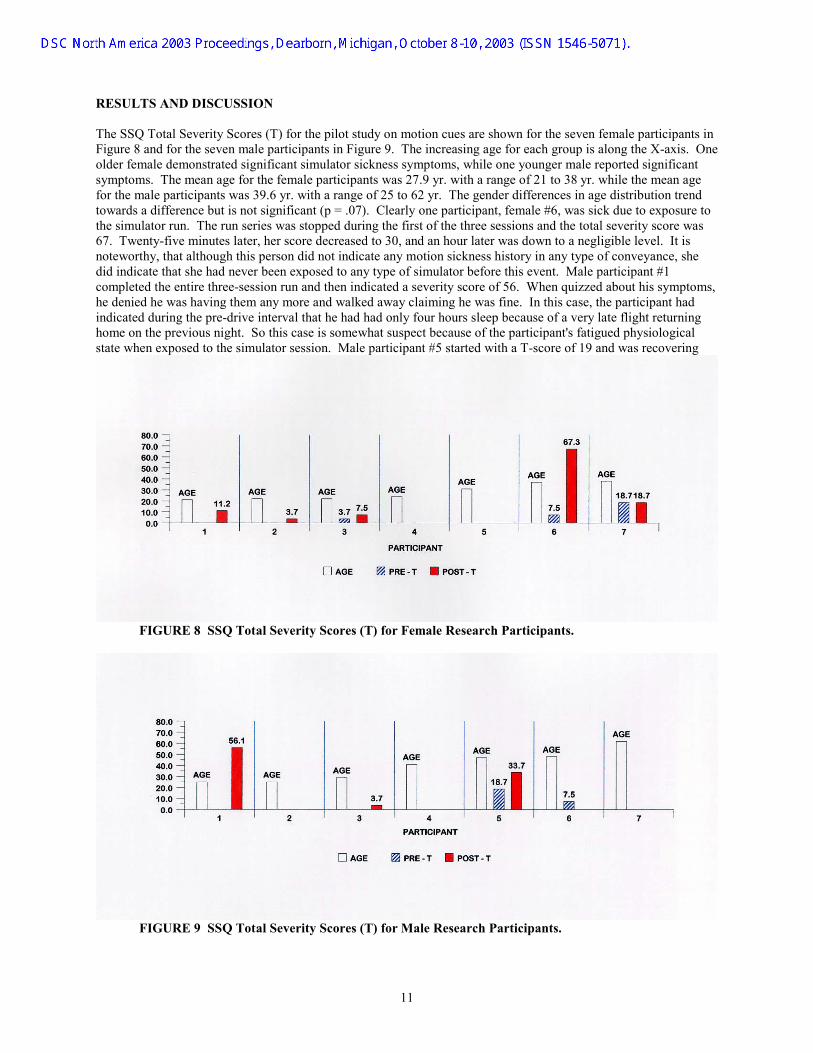
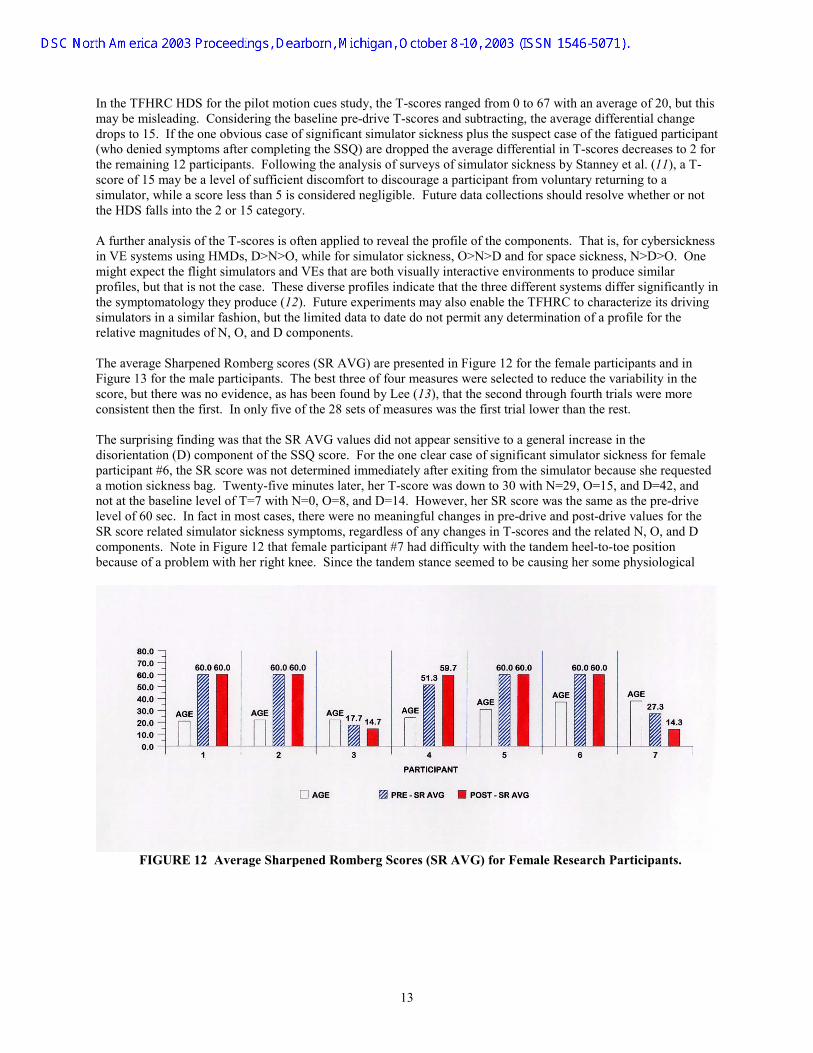
he SSQ Total Severity Scores (T) for the pilot study on motion cues are shown for the seven female participants in
ptoms,
TFigure 8 and for the seven male participants in Figure 9. The increasing age for each group is along the X-axis. One older female demonstrated significant simulator sickness symptoms, while one younger male reported significant symptoms. The mean age for the female participants was 27.9 yr. with a range of 21 to 38 yr. while the mean age for the male participants was 39.6 yr. with a range of 25 to 62 yr. The gender differences in age distribution trend towards a difference but is not significant (p = .07). Clearly one participant, female #6, was sick due to exposure tothe simulator run. The run series was stopped during the first of the three sessions and the total severity score was 67. Twenty-five minutes later, her score decreased to 30, and an hour later was down to a negligible level. It is noteworthy, that although this person did not indicate any motion sickness history in any type of conveyance, she did indicate that she had never been exposed to any type of simulator before this event. Male participant #1 completed the entire three-session run and then indicated a severity score of 56. When quizzed about his symhe denied he was having them any more and walked away claiming he was fine. In this case, the participant had indicated during the pre-drive interval that he had had only four hours sleep because of a very late flight returninghome on the previous night. So this case is somewhat suspect because of the participant's fatigued physiological state when exposed to the simulator session. Male participant #5 started with a T-score of 19 and was recovering
FIGURE 8 SSQ Total Severity Scores (T) for Female Research Participants.
FIGURE 9 SSQ Total Severity Scores (T) for Male Research Participants.
11
NADS & Simulation Center
DSC North America 2003 Proceedings, Dearborn, Michigan, October 8-10, 2003 (ISSN 1546-5071).
from a week-long head cold. The increase in discomfort after the simulator run series was completed was caused n
igures 10 and 11 show the profiles by gender for the SSQ subscale categories of nausea (N), oculomotor mptoms
terms of the SSQ, the average T-score has been found to be about 29 (range 19-55) for cybersickness induced for
t 16,
mainly by an increase in disorientation factors and some nausea that may have been confounded by an exacerbatioof his cold symptoms Fdiscomfort (O), and disorientation (D). No clear trends are evident to characterize the simulator sickness sydetected in the small group of participants. There is a hint that N might be higher than O or D and O, perhaps, higher than D in those demonstrating some symptoms post-drive. It is curious that male participant #1 showed O as the highest component in his SSQ and freely offered that he had some eyestrain after the simulator run. However, when queried about the rest of the cluster of his symptoms, he denied that he was experiencing anything anymore. InHead Mounted Display (HMD)-based Virtual Environment (VE) systems while the average T-score for eight helicopter simulators was 12 (range 7-20) and the average T-score for space sickness in 85 astronauts was abougreater than that for helicopter simulators but much less than for VE users (10).
FIGURE 10 SSQ Nausea (N), Oculomotor (O), and Disorientation (D) Subscales for Female Research Participants.
FIGURE 11 SSQ Nausea (N), Oculomotor (O), and Disorientation (D) Subscales for Male Research Participants.
12
NADS & Simulation Center
DSC North America 2003 Proceedings, Dearborn, Michigan, October 8-10, 2003 (ISSN 1546-5071).
In the TFHRC HDS for the pilot motion cues study, the T-scores ranged from 0 to 67 with an average of 20, but this
ant
or not
further analysis of the T-scores is often applied to reveal the profile of the components. That is, for cybersickness
ntly in
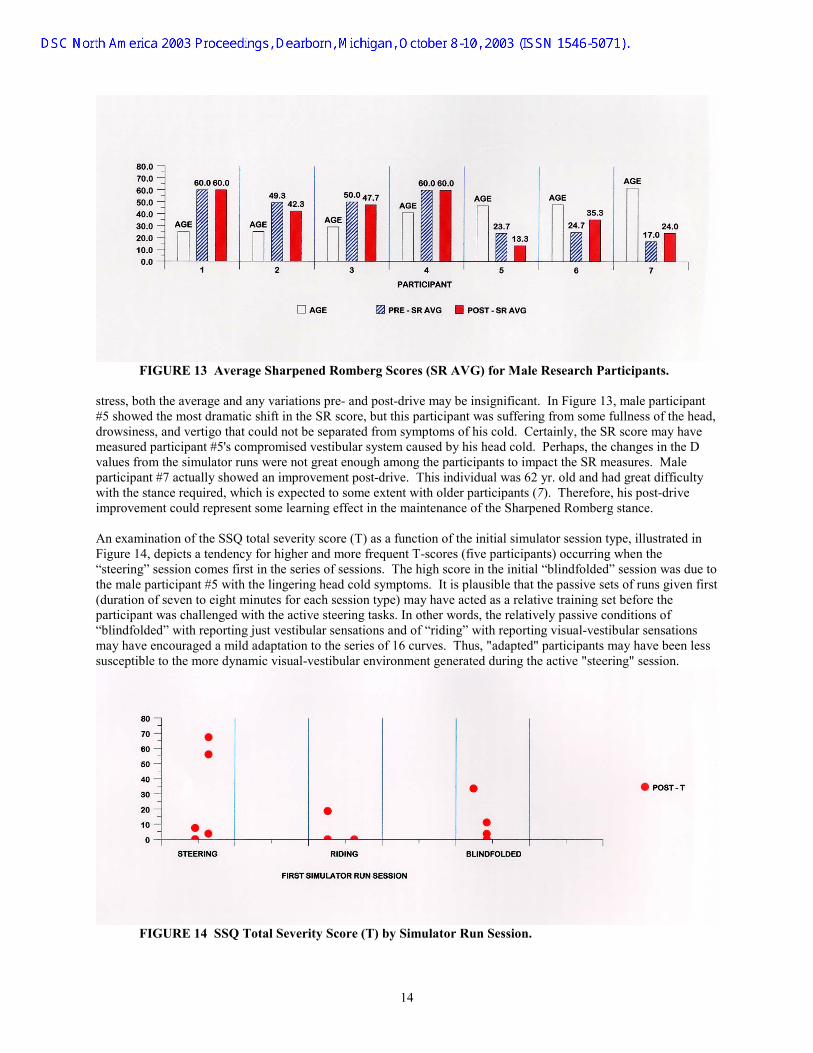
he average Sharpened Romberg scores (SR AVG) are presented in Figure 12 for the female participants and in
he surprising finding was that the SR AVG values did not appear sensitive to a general increase in the for female
al
may be misleading. Considering the baseline pre-drive T-scores and subtracting, the average differential change drops to 15. If the one obvious case of significant simulator sickness plus the suspect case of the fatigued particip(who denied symptoms after completing the SSQ) are dropped the average differential in T-scores decreases to 2 for the remaining 12 participants. Following the analysis of surveys of simulator sickness by Stanney et al. (11), a T-score of 15 may be a level of sufficient discomfort to discourage a participant from voluntary returning to a simulator, while a score less than 5 is considered negligible. Future data collections should resolve whether the HDS falls into the 2 or 15 category. Ain VE systems using HMDs, D>N>O, while for simulator sickness, O>N>D and for space sickness, N>D>O. One might expect the flight simulators and VEs that are both visually interactive environments to produce similar profiles, but that is not the case. These diverse profiles indicate that the three different systems differ significathe symptomatology they produce (12). Future experiments may also enable the TFHRC to characterize its driving simulators in a similar fashion, but the limited data to date do not permit any determination of a profile for the relative magnitudes of N, O, and D components. TFigure 13 for the male participants. The best three of four measures were selected to reduce the variability in the score, but there was no evidence, as has been found by Lee (13), that the second through fourth trials were more consistent then the first. In only five of the 28 sets of measures was the first trial lower than the rest. Tdisorientation (D) component of the SSQ score. For the one clear case of significant simulator sickness participant #6, the SR score was not determined immediately after exiting from the simulator because she requested a motion sickness bag. Twenty-five minutes later, her T-score was down to 30 with N=29, O=15, and D=42, and not at the baseline level of T=7 with N=0, O=8, and D=14. However, her SR score was the same as the pre-drive level of 60 sec. In fact in most cases, there were no meaningful changes in pre-drive and post-drive values for the SR score related simulator sickness symptoms, regardless of any changes in T-scores and the related N, O, and D components. Note in Figure 12 that female participant #7 had difficulty with the tandem heel-to-toe position because of a problem with her right knee. Since the tandem stance seemed to be causing her some physiologic
FIGURE 12 Average Sharpened Romberg Scores (SR AVG) for Female Research Participants.
13
NADS & Simulation Center
DSC North America 2003 Proceedings, Dearborn, Michigan, October 8-10, 2003 (ISSN 1546-5071).
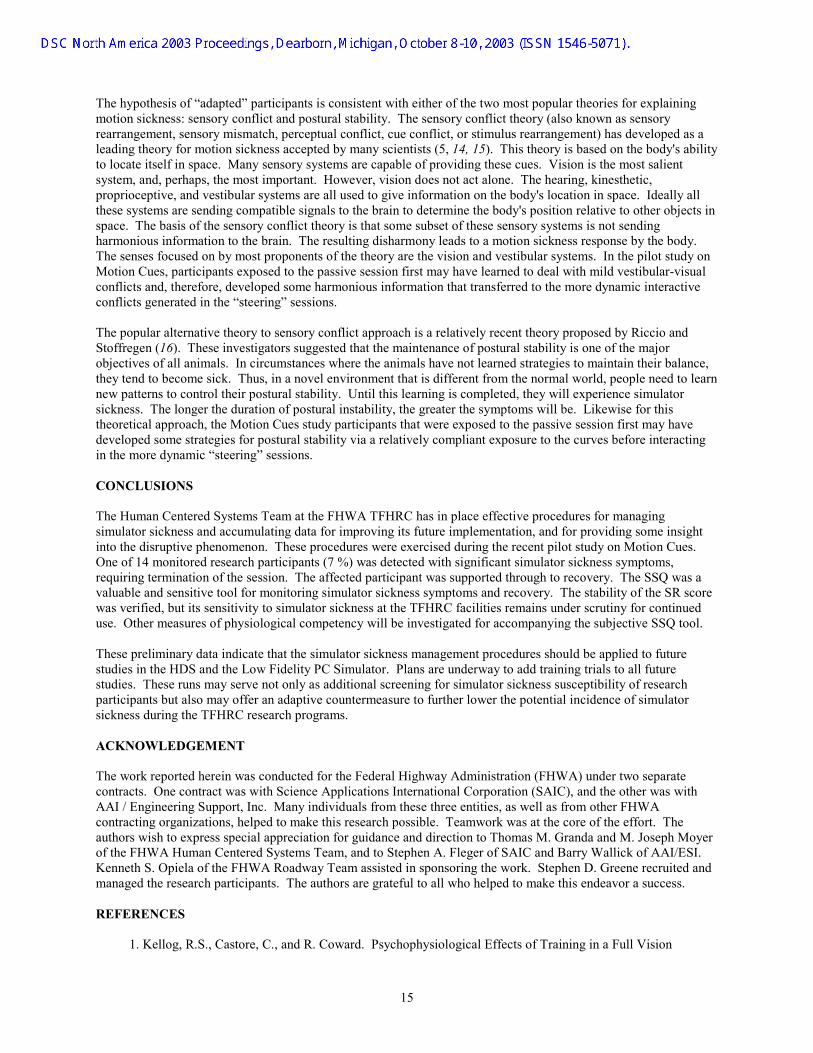
FIGURE 13 Average Sharpened Romberg Scores (SR AVG) for Male Research Participants. stress, both the average and any variations pre- and post-drive may be insignificant. In Figure 13, male participant #5 showed the most dramatic shift in the SR score, but this participant was suffering from some fullness of the head, drowsiness, and vertigo that could not be separated from symptoms of his cold. Certainly, the SR score may have measured participant #5's compromised vestibular system caused by his head cold. Perhaps, the changes in the D values from the simulator runs were not great enough among the participants to impact the SR measures. Male participant #7 actually showed an improvement post-drive. This individual was 62 yr. old and had great difficulty with the stance required, which is expected to some extent with older participants (7). Therefore, his post-drive improvement could represent some learning effect in the maintenance of the Sharpened Romberg stance. An examination of the SSQ total severity score (T) as a function of the initial simulator session type, illustrated in Figure 14, depicts a tendency for higher and more frequent T-scores (five participants) occurring when the “steering” session comes first in the series of sessions. The high score in the initial “blindfolded” session was due to the male participant #5 with the lingering head cold symptoms. It is plausible that the passive sets of runs given first (duration of seven to eight minutes for each session type) may have acted as a relative training set before the participant was challenged with the active steering tasks. In other words, the relatively passive conditions of “blindfolded” with reporting just vestibular sensations and of “riding” with reporting visual-vestibular sensations may have encouraged a mild adaptation to the series of 16 curves. Thus, "adapted" participants may have been less susceptible to the more dynamic visual-vestibular environment generated during the active "steering" session.
FIGURE 14 SSQ Total Severity Score (T) by Simulator Run Session.
14
NADS & Simulation Center
DSC North America 2003 Proceedings, Dearborn, Michigan, October 8-10, 2003 (ISSN 1546-5071).
The hypothesis of “adapted” participants is consistent with either of the two most popular theories for explaining motion sickness: sensory conflict and postural stability. The sensory conflict theory (also known as sensory rearrangement, sensory mismatch, perceptual conflict, cue conflict, or stimulus rearrangement) has developed as a leading theory for motion sickness accepted by many scientists (5, 14, 15). This theory is based on the body's ability to locate itself in space. Many sensory systems are capable of providing these cues. Vision is the most salient system, and, perhaps, the most important. However, vision does not act alone. The hearing, kinesthetic, proprioceptive, and vestibular systems are all used to give information on the body's location in space. Ideally all these systems are sending compatible signals to the brain to determine the body's position relative to other objects in space. The basis of the sensory conflict theory is that some subset of these sensory systems is not sending harmonious information to the brain. The resulting disharmony leads to a motion sickness response by the body. The senses focused on by most proponents of the theory are the vision and vestibular systems. In the pilot study on Motion Cues, participants exposed to the passive session first may have learned to deal with mild vestibular-visual conflicts and, therefore, developed some harmonious information that transferred to the more dynamic interactive conflicts generated in the “steering” sessions. The popular alternative theory to sensory conflict approach is a relatively recent theory proposed by Riccio and Stoffregen (16). These investigators suggested that the maintenance of postural stability is one of the major objectives of all animals. In circumstances where the animals have not learned strategies to maintain their balance, they tend to become sick. Thus, in a novel environment that is different from the normal world, people need to learn new patterns to control their postural stability. Until this learning is completed, they will experience simulator sickness. The longer the duration of postural instability, the greater the symptoms will be. Likewise for this theoretical approach, the Motion Cues study participants that were exposed to the passive session first may have developed some strategies for postural stability via a relatively compliant exposure to the curves before interacting in the more dynamic “steering” sessions. CONCLUSIONS The Human Centered Systems Team at the FHWA TFHRC has in place effective procedures for managing simulator sickness and accumulating data for improving its future implementation, and for providing some insight into the disruptive phenomenon. These procedures were exercised during the recent pilot study on Motion Cues. One of 14 monitored research participants (7 %) was detected with significant simulator sickness symptoms, requiring termination of the session. The affected participant was supported through to recovery. The SSQ was a valuable and sensitive tool for monitoring simulator sickness symptoms and recovery. The stability of the SR score was verified, but its sensitivity to simulator sickness at the TFHRC facilities remains under scrutiny for continued use. Other measures of physiological competency will be investigated for accompanying the subjective SSQ tool. These preliminary data indicate that the simulator sickness management procedures should be applied to future studies in the HDS and the Low Fidelity PC Simulator. Plans are underway to add training trials to all future studies. These runs may serve not only as additional screening for simulator sickness susceptibility of research participants but also may offer an adaptive countermeasure to further lower the potential incidence of simulator sickness during the TFHRC research programs. ACKNOWLEDGEMENT The work reported herein was conducted for the Federal Highway Administration (FHWA) under two separate contracts. One contract was with Science Applications International Corporation (SAIC), and the other was with AAI / Engineering Support, Inc. Many individuals from these three entities, as well as from other FHWA contracting organizations, helped to make this research possible. Teamwork was at the core of the effort. The authors wish to express special appreciation for guidance and direction to Thomas M. Granda and M. Joseph Moyer of the FHWA Human Centered Systems Team, and to Stephen A. Fleger of SAIC and Barry Wallick of AAI/ESI. Kenneth S. Opiela of the FHWA Roadway Team assisted in sponsoring the work. Stephen D. Greene recruited and managed the research participants. The authors are grateful to all who helped to make this endeavor a success. REFERENCES
1. Kellog, R.S., Castore, C., and R. Coward. Psychophysiological Effects of Training in a Full Vision
15
NADS & Simulation Center
DSC North America 2003 Proceedings, Dearborn, Michigan, October 8-10, 2003 (ISSN 1546-5071).
Simulator. Annual Scientific Meeting of the Aerospace Medical Association, May 1980. 2. Gower, D.W., and J.E. Fowlkes. Simulator Sickness in the UH-60 (Black Hawk) Flight Simulator.
USAARL 89-20 (AD-A214 434), U.S. Army Aeromedical Research Laboratory, September 1989. 3. Kennedy, R.S., Lane, N.E., and M.C. Grizzard. Use of a Motion History Questionnaire to Predict
Simulator Sickness. Proceedings of the Driving Simulation Conference 2000, Sophia Antipolis, Greece, September 2000.
4. Watson, G.S. A Synthesis of Simulator Sickness Studies Conducted in a High-Fidelity Driving Simulator.
Proceedings of the Driving Simulation Conference 2000, Paris, France: INRETS, September 2000. 5. Reason J.T., and J.J. Brand. Motion Sickness. Academic Press, New York:, 1975. 6. Kennedy, R.S., N.E. Lane, K.S. Berbaum, and M.G. Lilienthal. A Simulator Sickness Questionnaire
(SSQ): A New Method for Quantifying Simulator Sickness. International Journal of Aviation Psychology, Vol.3 , No.3, 1993, pp. 203-220.
7. Fregly, A.R., and A. Graybiel. An Ataxia Test Battery Not Requiring Rails. Aerospace Medicine, March
1968, pp. 277-282. 8. Kennedy, R.S., and L. Kuntz. A Floor-Based Postural Stability Measure as a Comparison Tool for
Repeated Measures Testing. Manuscript in preparation, 2002. 9. Hamilton, K.M., Kantor, L., and L.E. Magee. Limitations of Postural Equilibrium Tests for Examining
Simulator Sickness. Aviation, Space, and Environmental Medicine, Vol. 60, March, 1989, pp. 246-251. 10. Kennedy, R.S., and K.M Stanney. After Effect of Virtual Environment Exposure: Psychometric Issues.
In Smith, M., Salvendy, G., and R. Koubek (Eds.), Design of Computing Systems: Social and Ergonomic Considerations. Elsevier Science Publishers, Amsterdam, Netherlands, San Francisco, CA, August 24-29, 1997, pp. 897-900.
11. Stanney, K.M., Kennedy, R.S., and J.M. Drexler. Cybersickness is Not Simulator Sickness. Proceedings
of the Human Factors and Ergonomics Society 41st Annual Meeting, Albuquerque, 1997, pp. 1138-1142. 12. Kennedy, R.S., Lane, N.E., Lilienthal, M..G., Berbaum, K.S., and L.J Hettinger. Profile Analysis of
Simulator Sickness Symptoms: Application to Virtual Environment systems. Presence: Teleoperators and Virtual Environments, Vol. 1, No. 3, 1992, pp. 295-301.
13. Lee, C. Sharpening the Sharpened Romberg Test. European Journal of Underwater and Hyperbaric
Medicine, Vol. 3, No. 3, June 2002, pp 54-60. 14. Biocca, F. Will Simulation Sickness Slow Down the Diffusion of Virtual Environments: Influences on
Cybersickness. Presence, Vol. 1, 1992, pp. 447-459. 15. Pausch, R,. Crea, T., and M. Conway. A Literature Survey for Virtual Environments: Military Flight
Simulator Visual Systems and Simulator Sickness. Presence, Vol. 1, 1992, pp. 344-363. 16. Ricco, G.E., and T.A. Stoffregen. An Ecological Theory of Motion Sickness and Postural Instability.
Ecological Psychology, Vol. 3, No. 3, 1991, pp. 195-240.
16
NADS & Simulation Center
DSC North America 2003 Proceedings, Dearborn, Michigan, October 8-10, 2003 (ISSN 1546-5071).