Driving the global economy – and the forex market? Driving the global economy – and the forex market? • TRADING VOLATILITY: Two simple FX strategies • COMBINING PIVOT POINTS and candlestick patterns • HOW DEFICITS affect the dollar • FOREX TRADE JOURNAL: Diary of a currency trade • INDICATORS: Understanding true range
Transcript
Driving the global economy – and the forex market?
Driving the global economy – and the forex market?
Survey says: U.S. and U.K. FX volumedropped in in the fallLatest report offers a more timely look at forex activity. . . . . . . . . . . . . . . . . . 11
G7 meeting loomsChina expected to be in spotlight .11
Currency MoversU.S. Dollar: Q1 recovery should precede further downtrendBy Cornelius Luca . . . . . . . . . . . . . . . . . . .12
Global EconomyWhat’s on the horizon for the Chinese renminbi?Currency experts weigh in on the conse-quences of a revaluation of the Chinese renminbi. By Currency Trader Staff. . . . . . . . . . . . . .14
The Big PictureThe Golden Goose Rule Rethinking the U.S. economy, the dollar,and the near-term future the forex market.By Barbara Rockefeller. . . . . . . . . . . . . . .18
Global Economic Calendar . . . . . . .23
Currency StrategiesVolatility-based currency tradingHow to use inside bars and volatility comparisons to spot trade opportunities. By Kathy Lien. . . . . . . . . . . . . . . . . . . . . . .24
Pivot points and candlesticksCombining pivot-point analysis with a candle-stick pattern in an intraday trading approach. By John Person. . . . . . . . . . . . . . . . . . . . . .28
For how-to instruction on viewing the magazinevisit www.currencytradermag.com/ziniohelp.htm.
Looking for an advertiser?Consult the list below and click on the company name for a direct link to the ad in this month’s
issue of Currency Trader.
FXCM CMC CurrencyGain Capital
Investor FlixEFX
Index of Advertisers
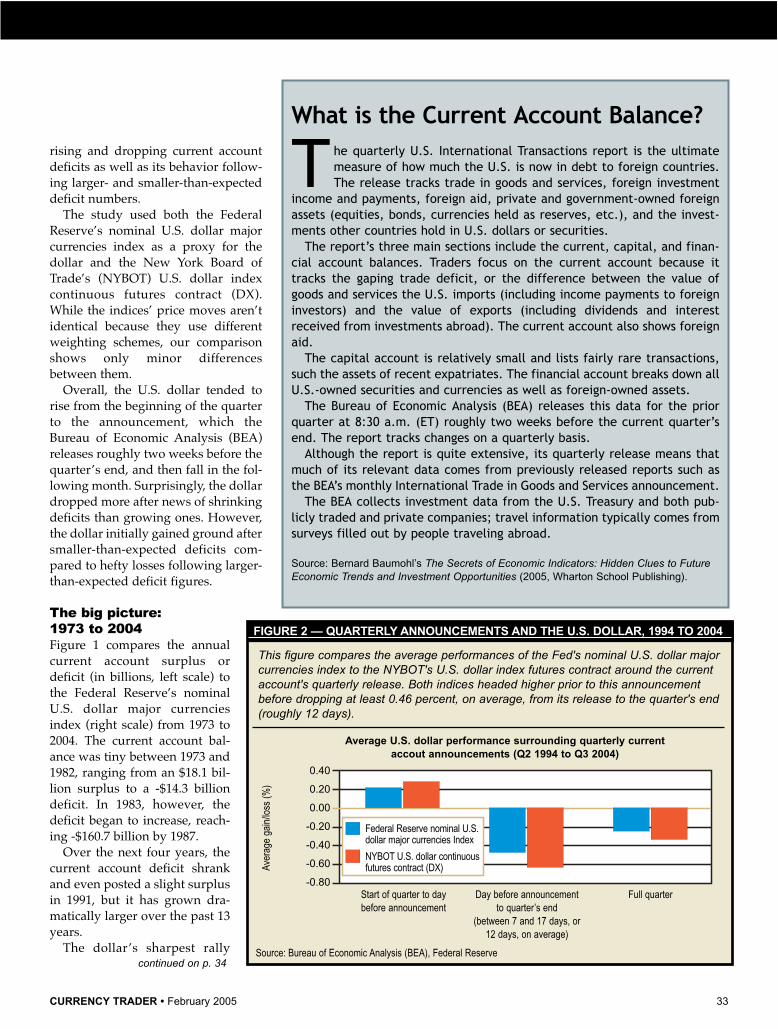
Currency CharacteristicsThe current account deficit’s impact on the U.S. dollarAn analysis of the U.S. dollar’s behavior around quarterly current account balancereports.By David Bukey. . . . . . . . . . . . . . . . . . . . . .32
T wenty or 30 years ago, it wasn’t uncommonto hear the opinion that when (not if) Chinaabandoned communism and a centralizedeconomy for democracy and free markets, it
would become an economic 800-pound gorilla.Western businesses salivated for
years at the prospect of tapping intothe potentially largest consumer mar-ket in the world. They began to makesmall inroads when the Chinese gov-ernment started loosening some reinsafter Mao Tse Tung’s death in 1976.But events such as the stand-off inTiananmen Square in 1989 made clearthe old guard was only looseningreins, not letting go of them entirely.
Nevertheless, in 2005 China hasmanaged to gallop to the front of theeconomic pack without officially dis-avowing a communist society. As cap-italism has gained traction, China’shuge populace is producing goodsand acquiring possessions like neverbefore, although on a per capita basisit is still earning and spending at ratesthat would seem austere to mostWesterners.
China’s economic explosion hasbeen attributed with (amont other things) driving globalcommodities prices higher, expanding the U.S. trade deficit,and, by association, threatening to upset worldwide cur-rency markets because of its decision to keep the renminbipegged to the dollar rather than allowing it to float freely.
Whether this will continue — and what will likely hap-pen if it does not — is the subject of “What’s on the horizonfor the Chinese renminbi?” There are a few scenarios,including a renminbi that is allowed to fluctuate in a fixedrange, and different opinions on how this will affect theforex market.
In "The Golden Goose Rule," Barbara Rockefeller touch-es on the issue of China in the context of a larger discussion
about a potential reconsideration ofthe health of the U.S. economy andwhether other countries will lose theirappetite for our paper assets. Theirsustained hunger has been financingour record deficits, but there are thosewho worry they may be full and readyto pull away from the table.
For now, traders interested in tech-niques for free-floating currencies canexperiment with ideas in the CurrencyCharacteristics and Trading Strategiessections.
“The current account deficit’simpact on the U.S. dollar” examineswhether the quarterly current accountnumbers are responsible for regularpatterns in the U.S. dollar. In“Volatility based currency trading,”contributor Kathy Lien discusses twosimple techniques — inside bars andshort-term/long-term volatility com-parisons — for exploiting volatility
The information in Currency Trader magazine is intended for educational pur-poses only. It is not meant to recommend, promote or in any way imply theeffectiveness of any trading system, strategy or approach. Traders are advisedto do their own research and testing to determine the validity of a trading idea.Trading and investing carry a high level of risk. Past performance does notguarantee future results.
For all subscriber services:www.currencytradermag.com
A publication of Active Trader®
CONTRIBUTORS
8 February 2005 • CURRENCY TRADER
CONTRIBUTORS
� Barbara Rockefeller (www.rts-forex.com) is aninternational economist with a focus on foreign exchange.She has worked as a forecaster, trader, and consultant atCitibank and other financial institutions, and currentlypublishes two daily reports on foreign exchange.Rockefeller is the author of Technical Analysis for Dummies(2004), 24/7 Trading Around the Clock, Around the World (JohnWiley & Sons, 2000), The Global Trader (John Wiley & Sons,2001) and How to Invest Internationally, published in Japanin 1999. A book tentatively titled How to Trade FX is in theworks.
� Kathy Lien is a chief strategist at FXCM,where she is responsible for research andanalysis for DailyFX.com, including technicaland fundamental research reports, marketcommentaries, and trading strategies. She wasan associate at JP Morgan Chase, where sheworked for more than three years in credit derivatives,cross markets, and foreign exchange trading. Lien’s experi-ence encompasses trading both in and out of the Forexmarket, including interest rate derivatives, bonds, equities,and futures. She has written for various industry publica-tions and news outlets, including CBS MarketWatch, andshe is frequently quoted on Bloomberg and Reuters.
� Cornelius Luca is the author of Technical AnalysisApplications(McGraw-Hill), Trading in the Global CurrencyMarkets (Prentice Hall, 2000), Technical Analysis Applicationsin the Global Currency Markets (Prentice Hall, 2004), andIntroduction to Technical Analysis (Euromone,1997). Heteaches several forex and technical analysis classes throughNew York University, the New York Institute of Finance,and Pace University's Lubin School of Business GraduateDivision. He has been trading and consulting since 1983. In2002, Luca joined Global Forex Trading, where he providesdaily, weekly, and monthly commentary on the major for-eign exchange markets.
� John Person is a 25-year veteran trader and registeredCommodity Trading Advisor. He is the author of TheComplete Guide to Technical Trading Tactics: How to ProfitUsing Pivot Points Candlesticks and Other Indicators. He isfeatured on CBS MarketWatch, Reuters, and Dow JonesNewswires, and also appears regularly on CNBC. Johncontributes daily commentaries found on the ChicagoBoard of Trade’s Web site and is the editor of the BottomLine Weekly Newsletter.
� Michael Schneider has been involved in tradingsince 1982 when he was head of the special interest groupinvestments of the German Apple user group and operatedone of the first low-cost quote vendors in Germany. Helater incorporated a small trading company that servedclients in Europe (primarily Monaco). Currently he is headof the supervisory board of a German stock firm and direc-tor of a second company that manages international proj-ects. In addition, he manages the office of the GermanVereinigung Technischer Analysten e.v., which is theGerman member of the International Federation ofTechnical Analysts.
The Chicago Mercantile Exchangehosted its first Global FX Summiton Jan. 19, featuring several for-
eign exchange industry leaders.Turnout was about 300 people.
The summit began
with a one-houreducational seminar geared to
those new to FX trading. An openingspeech by Diane Swonk, newlyappointed chief economist at MesirowFinancial, kicked off the afternoon.
Two simultaneous sessions followed,
one for the proprietary firms, tradingarcades and individuals, which dis-cussed the latest in trading platforms inthe foreign exchange cash markets. Theother session, for hedge funds, CTAs,and investment managers, focusedmainly on trading strategies and riskmanagement issues.
The last event was a roundtable dis-cussion with Robert Savage, managingdirector of FX sales at Goldman Sachs;Bill Brown, managing director atMorgan Stanley; Cornelius Luca, authorof Trading in the Global Currency Markets;Barbara Rockefeller of RockefellerTreasury Group; and Yra Harris, inde-pendent currency trader. The discus-sion was moderated by Andy Busch,currency strategist with BMO-HarrisBank.
The roundtable participants deter-mined that one of the most important
areas to watch in currencies in thefuture would be oil — specifically, whatcurrencies will increase or decrease inresponse to higher oil prices. The pan-elists all pointed toward Asia.
“In the case of Japan and China, theirlack of domestic sources of energy andtheir need to import huge amounts ofcrude oil, natural gas, and other energymakes them particularly sensitive tochanges in oil prices,” Morgan Stanley’sBrown said.
Goldman Sach’s Savage said all eyesshould be on emerging-market “BRIC”countries (Brazil, Russia, India, andChina).
“The BRICs have large populationbases, large natural resources, andunending technical talents as well aslarge consumer bases, creating hugeopportunities for play in the currencymarkets,” Savage said. �
10 February 2005 • CURRENCY TRADER
INDUSTRY NEWS
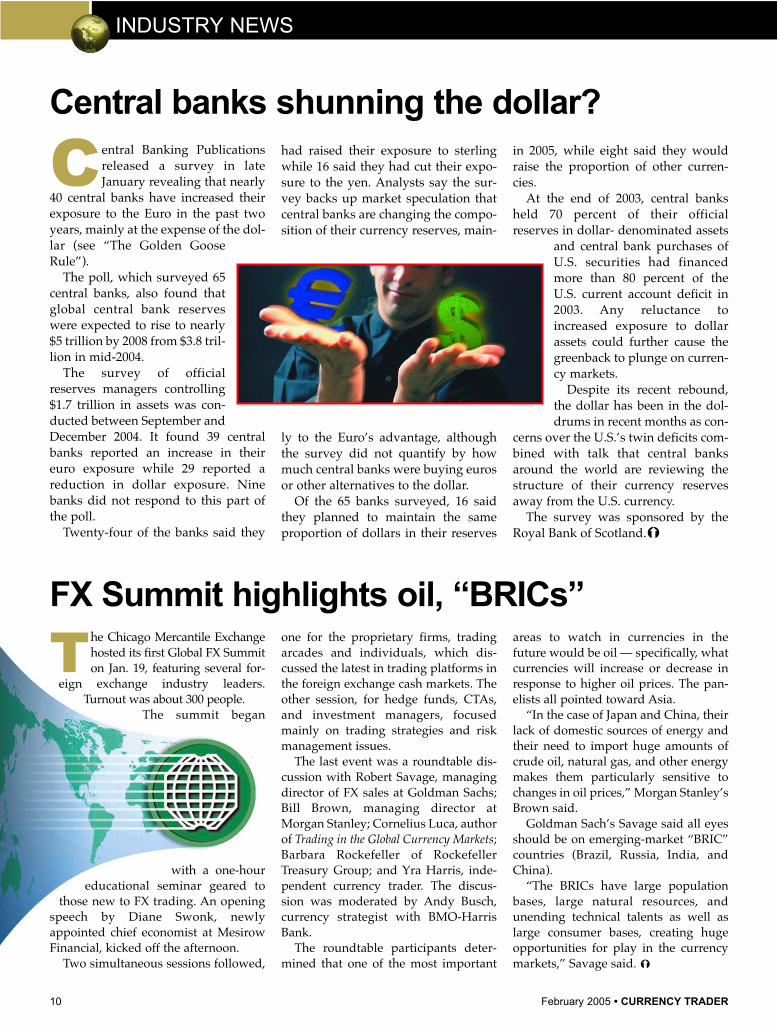
Central Banking Publicationsreleased a survey in lateJanuary revealing that nearly
40 central banks have increased theirexposure to the Euro in the past twoyears, mainly at the expense of the dol-lar (see “The Golden GooseRule”).
The poll, which surveyed 65central banks, also found thatglobal central bank reserveswere expected to rise to nearly$5 trillion by 2008 from $3.8 tril-lion in mid-2004.
The survey of officialreserves managers controlling$1.7 trillion in assets was con-ducted between September andDecember 2004. It found 39 centralbanks reported an increase in theireuro exposure while 29 reported areduction in dollar exposure. Ninebanks did not respond to this part ofthe poll.
Twenty-four of the banks said they
had raised their exposure to sterlingwhile 16 said they had cut their expo-sure to the yen. Analysts say the sur-vey backs up market speculation thatcentral banks are changing the compo-sition of their currency reserves, main-
ly to the Euro’s advantage, althoughthe survey did not quantify by howmuch central banks were buying eurosor other alternatives to the dollar.
Of the 65 banks surveyed, 16 saidthey planned to maintain the sameproportion of dollars in their reserves
in 2005, while eight said they wouldraise the proportion of other curren-cies.
At the end of 2003, central banksheld 70 percent of their officialreserves in dollar- denominated assets
and central bank purchases ofU.S. securities had financedmore than 80 percent of theU.S. current account deficit in2003. Any reluctance toincreased exposure to dollarassets could further cause thegreenback to plunge on curren-cy markets.
Despite its recent rebound,the dollar has been in the dol-drums in recent months as con-
cerns over the U.S.’s twin deficits com-bined with talk that central banksaround the world are reviewing thestructure of their currency reservesaway from the U.S. currency.
The survey was sponsored by theRoyal Bank of Scotland.�
Central banks shunning the dollar?
FX Summit highlights oil, “BRICs”
P olicymakers from the Group of Seven (G7) richnations’ club meet in London on Feb. 4-5 in amuch-anticipated bi-annual gathering, and are
expected to discuss the dollar’s three-year slide and theissue of currency flexibility, particularly in Asia.
At the start of the year, speculation that China mightrevalue its currency after the fall G7 meeting boostedother Asian currencies, such as the yen (see “What’s onthe Horizon For the Chinese Yuan”).
China and India will be included in the meetings thistime around. The U.S. dollar’s slide vs. the Euro and yenis expected to generate debate at the talks. Recent G7meetings have called for more flexibility in currency
exchange rates in an attempt to encourage parts of Asia— especially China — to relax exchange rates.
Theory has it that if China lets its yuan revalue, othersin Asia will be under less pressure to keep their curren-cies low vs. the dollar to ensure their exports remaincompetitive in terms of price on world markets. In lateJanuary, a news organization reported that a Chineseofficial said the country needs time before allowing itspegged currency to appreciate.
U.S. Treasury Secretary John Snow said he does notexpect G7 ministers to alter the group’s position on cur-rencies from last February, when they spoke out against“excessive volatility” in currency markets.�
Currency trading volumes inthe two biggest foreign ex-change centers appear to
have dropped from the record levelsrecorded earlier in the year, accordingto two reports.
The triennial survey of the marketconducted by the Bank forInternational Settlements (BIS)showed record average daily volumesof $1.9 trillion through April.
But surveys of the U.K. and U.S.markets by the Bank of England andthe New York Federal Reserve showvolumes in those two centers droppedto a combined $917 billion a day fortraditional foreign exchange productsfrom $1,196 billion in April. The twocenters account for almost half of alldaily trading activity in the foreignexchange markets.
The two aforementioned reportswere the first of what will become reg-ular six-monthly surveys of FX marketactivity. The Bank of England and theNew York Fed participate in the BIS’ssurvey, but the FX committees of bothsaid they felt the market would benefitfrom reporting of activity levels morethan once every three years.
“Our goal in launching this survey
is to help market participants identifyemerging trends in foreign exchange,”says Mark Snyder, chair of the NewYork Fed’s committee and head of for-eign exchange at State Street bank.
He says more frequent reportingshould help market participants man-age risk in the fast-moving market.
Both committees cautioned thattheir reports were not directly compa-rable with the BIS survey because ofslight differences in methodology. TheBank of England said the BIS habit ofreporting trade locations based on thesales desk, rather than where the tradewas conducted, could have under-reported trading in London, thebiggest center of activity.
Many banks have sales teams acrossthe continent but maintain one maintrading floor, often in London. However,market participants believe trading vol-umes might have surged since the sur-veys were taken.
EBS, the biggest inter-bank spotdealing platform, reported its busiestday in 11 years, worth $203 billion, inNovember. The platform also report-ed its busiest-ever week in Januarywith an average $162 billion tradeddaily. �
VOLUME, VOLUME,VOLUMEVolume at two of the larger onlinecurrency trading platforms morethan doubled in 2004. FXAll report-ed an increase of 104 percent to$4.9 trillion in volume, while HotspotFX said its volume totals have goneup almost 150 percent. The rise canbe somewhat attributed to the con-tinued decline of the U.S. dollar,which has caused hedge funds toenter the market to protect againstother investments.
IN FUTURES, TOOFutures brokers are enjoying theincrease in forex trading as well.Chicago-based Peregrine Financialreported record volume in currencyfutures trading in 2004 after en-hancing its trading platform. Totalvolume at PFG reached $28.4 bil-lion in 2004 — more than 10 timesthe 2003 total. For more informationon currency futures trading, go tothe Currency Futures page.
BIS DOESN’T JUSTTAKE SURVEYSThe Bank for International Settle-ments donated $50,000, or aroundtwo million Thai baht, to help easethe grief of tsunami victims.
Survey says: U.S. and U.K. FX volume dropped in the fall
CURRENCY TRADER • Feburary 2005 11
G7 meeting looms
12 February 2005 • CURRENCY TRADER
BY CORNELIUS LUCA
T he U.S. dollar started 2005on a strong note, whichencouraged traders to take
profits on some of their short posi-tions. By Dec. 31 the dollar was severe-ly oversold from both short- and long-term perspectives, although someeconomists might disagree with thisfor fundamental reasons.Consequently, some traders venturedto buy the dollar currencies. Where dowe go from here?
The dollar should attempt to recov-er for the rest of the first quarter of2005 before the next bout of selling willoccur. Central bankers made clear howto see the world through the prism offoreign exchange: The European cur-rencies have already experienced thenecessary adjustments, so it is now theAsian currencies’ turn to strengthenfurther and help alleviate the U.S.trade imbalance.
The U.S. deficitAs recently as January 2002, thetrade balance showed a gap of $30billion. By the end of that year, thegap widened by a little over onethird to around $40 billion.Between February and November2004, the gap surged from $42.1billion to $60.3 billion (see Figure1).
The easiest way of dealing withthis problem is the devaluation ofthe dollar, but selling the dollar isnot always as easy as it should be.Traditionally, the currency thathad to be bought against the dol-lar was the Japanese yen, asexports-loving Japan enjoyedasymmetrically large trade sur-pluses. But once the U.S.dollar/Japanese yen (USD/JPY)
collapsed to the 80 area in spring 1995,the shock was so big on both sides ofthe Pacific that once the exchange raterebalanced, no one uttered a wordabout a “structural problem.” So,when the Bank of Japan boughtunprecedented amounts of dollarsduring the second half of 2003 and the
first quarter of 2004, there was littlecomplaint from U.S. officials.
The problem is in November 2004the trade deficit with China reached$16.6 billion — a little more than aquarter of the total U.S. trade gap.Perhaps the U.S. would now love tofurther debase the dollar against the
CURRENCY MOVERS
U.S. trade deficit in goods and services 2000 to present (in billions of dollars)
Mo
nth
ly t
rad
e d
efic
it (
in b
illio
ns)
2000 2001 2002 2003 2004 2005
0
-10
-20
-30
-40
-50
-60
-70
Between January 2002 and November 2004, the U.S. trade deficit ballooned fromaround $30 billion to $60.3 billion.
FIGURE 1 — TRADE DEFICIT
Source: Bureau of Economic Analysis
Euro/U.S. dollar (EUR/USD), daily
16 29 2004 22 February 17 March 12 25 April 20
1.2800
1.2600
1.2400
1.2200
1.2000
1.1800
After forming a double top from January to February 2004, the Euro/U.S. dollar(EUR/USD) headed lower for 11 weeks.
FIGURE 2 — EURO DOUBLE TOP
Source: GFT DealBook FX 2
U.S. Dollar: Q1 recovery shouldprecede further downtrend
CURRENCY TRADER • February 2005 13
currency that causes most ofthe problem — the Chineseyuan. However, the yuan doesnot float freely — it is peggedto the dollar. Because the mar-kets cannot possibly exercisetheir role of shock absorberwithout free-floating rates, theonly way to achieve the sameresult is for China to revalue itsown currency.
Rumors have abounded thatChina will adjust the yuan bythe beginning of 2005, butnothing has happened (no sur-prise there). It’s very hard togauge what would makeChina listen to the needs of theG7 economies, particularlysince it holds the key to negoti-ations between North Koreaand the U.S. on nuclearweapons, and it also wants toweaken Taiwan.
Otherwise, there is the riskJapan will feel it doesn’t haveto allow the yen to strengthenbelow parity (100) with thedollar to single-handedlyexpose its exports to lowerprofits. This would translateinto another set of massiveinterventions by the Bank ofJapan, and even the FederalReserve of New York might beconvinced to make a mild con-tribution to propping up thedollar.
Technicals point to adollar recoveryWhile China’s yuan remainspegged, traders will likely taketheir cues from charts.
A year ago, the Euro/U.S. dollarrate (EUR/USD) formed a double topin January and February 2004 (seeFigure 2). From the second top, thepair headed lower for 11 weeks beforestalling and eventually resuming itsmajor uptrend.
In 2005, EUR/USD is on the verge offorming another potentially bearishreversal formation — the head-and-shoulders pattern (see Figure 3). The
pair peaked on Dec. 31 and has beendeclining since.
If it follows the same pattern,EUR/USD should extend its decline forseven or eight weeks, which should takeit down through late February or earlyMarch. It could slide as low as the 1.2200area, but it will first have to break belowthe 1.2600 area, shown in Figure 4.Following this significant low, the pairshould resume its major uptrend. �
Related reading byCornelius Luca:
Trading in the Global CurrencyMarkets (NYIF, second edition,2000).
Technical Analysis Applications inthe Global Currency Markets(Prentice Hall, 2004).
Euro/U.S. dollar (EUR/USD), daily
October 26 November 19 December 15 28 2005 21
1.3600
1.3400
1.3200
1.3000
1.2800
1.2600
1.2400
1.2200
EUR/USD is potentially on the verge of forming another bearish reversal formation — thehead-and-shoulders pattern. The pair peaked on Dec. 31 and has been declining since.
FIGURE 3 — POTENTIAL HEAD-AND-SHOULDERS?
Euro/U.S. dollar (EUR/USD), weekly
2003 Sept. Nov. 2004 Apr. June Aug. Oct. Dec.
1.4500
1.4000
1.3500
1.3000
1.2500
1.2000
1.1500
1.1000
From a long-term perspective, EUR/USD should extend its decline for seven or eightweeks, which should take it down through late February or early March — possibly aslow as the 1.2200 area, but it will have to break the 1.2600 level first. After that, it shouldresume its major uptrend.The channel lines connect major highs and lows.
FIGURE 4 — PROJECTING THE EUR/USD
Source: GFT DealBook FX 2
Source: GFT DealBook FX 2
ShoulderHead
Shoulder?
14 February 2005 • CURRENCY TRADER
BY CURRENCY TRADER STAFF
W hile the early weeksof 2005 ushered inmodest strengthen-ing of the U.S. dol-
lar vs. the Euro, a major wild cardremains on the currency horizon in theform of China. Throughout 2004, amidcontinuing weakness in the greenback,governments around the world point-ed to the Chinese renminbi’s peg to theU.S. dollar as a potentially destabiliz-ing global economic force. A potentialrevaluation of the Chinese currency vs.the dollar has long been a hot topic inthe forex markets and is likely toremain so as long as the bears continueto dominate action in the buck.
While analysts and traders aredivided on the likelihood of a potentialrevaluation for the renminbi in the firsthalf of 2005, let’s take a look at thebackground leading up to the currentsituation. What form would a revalua-tion take, and what could it mean forthe dollar and the other majors?
Hot growthChina has exploded onto the globaleconomic scene in recent years. With apopulation of nearly 1.3 billion people,China’s huge demand for raw materi-als as it strives to produce new goodsfor its burgeoning middle class hashelped support tremendous priceincreases in many global commodity
markets. Impressive gross domesticproduct (GDP) numbers have rolledout of China in recent years, with mostanalysts believing final growth num-bers came in around 9.3 percent in2004.
Amid concerns of potential overheat-ing late last year, the Chinese govern-ment hiked interest rates — for the firsttime in nine years — by 0.27 percent,bringing its benchmark lending rate to5.58 percent.
“For a while last year, everyone wasworried about a [growth] crash,” saysJim Glassman, senior economist at J.P.Morgan Chase in New York. “We don’tthink those fears make sense.”
While a modest slowdown is forecastfor 2005, economists still expect growthin the 8.0 to 8.5 percent region for Chinathis year. China is on a rapid growthpath.
Much has been written on the hard-working nature of the Chinese, which
GLOBAL ECONOMY
Euro/U.S. dollar (EUR/USD), weekly
2000 2001 2002 2003 2004 2005
1.35
1.30
1.25
1.20
1.15
1.10
1.05
1.00
0.95
0.90
0.85
Despite having bounced back in recent weeks, the dollar’s weakness is evidencedby the EUR/USD long-term uptrend. Some analysts argue a revaluation of theChinese renminbi could shift capital flows away from Europe and into Asia, whichwould be bearish for the Euro and bullish for many Asian currencies.
FIGURE 1 — DOLLAR DOWN (EURO UP)
Source: TradeStation
What’s on the Horizon for the Chinese renminbi?How would the dollar benefit
from a revaluation of the renminbi?
CURRENCY TRADER • February 2005 15
will likely play into speculationregarding the future growth prospectsof this nation.
“[The Chinese] are some of the mostindustrious and financially aggressivepeople in the world,” says BrianDolan, director of research at GainCapital. “A lot of them are worker beeswhere everyone has two jobs. Thateconomy is not going to experience aslowdown of any consequence formany years to come.”
The pegLooking at the currency exchange,however, many in the U.S. and Europehave long argued the renminbi is seri-ously undervalued, which givesChinese exporters a strong advantagein the global marketplace.
The Chinese renminbi exchange ratehas been pegged to the U.S. dollar atnear 8.28/8.30 renminbi (CNY) to theU.S. dollar for the past decade. U.S.government officials have pushed for arevaluation since September 2003. TheU.S. has criticized the peg at times, asrenminbi appreciation could potential-ly help trim the mammoth U.S.account deficit.
Why does this matter? Some marketwatchers have said China’s currencypeg to the U.S. dollar prevents correc-tion of the U.S. trade imbalance. Afterall, as the dollar continues to weakenvs. the Euro and other majors, the ren-minbi falls with it. This helps Chinamaintain an advantage in the worldmarketplace.
“The growth engine (for China)remained in the export sector in 2004,”says John Cairns, head of Asia researchfor Ideaglobal in Singapore.
Glassman agrees. “[Continued exporting strength] is a
safety net for China, and it’s a drivingforce for much of their growth.”
Glassman also notes that U.S.imports about $120 billion annuallyfrom China.
Pressure to revalueNonetheless, pressure is building inthe international community for Chinato open its currency to market forces.
“China is moving from being asmall closed economy, where a forexpeg is suitable, to a large open econo-my where a flexible exchange rate isneeded,” says Cairns. “China isalready by far the largest economy inthe world with a U.S. dollar peg.”
With the U.S. dollar in a massivebear market in recent years, fallingfrom around $0.83 vs. the Euro toaround $1.36 in late 2004, the renminbihas been depreciating along with it.
“The Chinese renminbi is underval-ued,” says Cairns. “The currentaccount balance was 44 billion in 2003and rose to an estimated $55 billion in2004 and should hit as much as $65 bil-lion this year. Combined with massivecapital inflows, this implies theauthorities have to buy more than ahundred billion U.S. dollars a year tokeep the peg intact. This, in turn,injects liquidity into the monetary sys-tem, leading to much-too-rapid mone-tary growth.”
Europe has been in favor of a reval-uation, if only to relieve some of theupward pressure off the Euro, whichhas been in a massive bull market vs.the dollar since 2002 (see the weeklyEUR/USD chart in Figure 1).
Analysts and traders have a widerange of views on potential revalua-tion of the renminbi. Some economistsbelieve a modest revaluation can beexpected in the first half of 2005, whileothers believe the Chinese will refuseto be pressured into a currency shift.
Won’t bow to pressureThose who contend a revaluation isunlikely in the near term point out thatChina is benefiting from the peg.
“They could always revalue theircurrency but what would be thepoint?” says Glassman. “By linking tothe dollar they can offer a stable cur-
rency, which is attractive. They canopen their economy and sayEuropeans and Americans are wel-come to build factories here. Also, itenables them to become an exportplatform for the American market andsends them on the road to develop-ment.
“[Revaluation] won’t happen ifeveryone keeps asking them to do it.China will only do it if it fits into theirlong-term plan. It’s a very closed sys-tem — outsiders aren’t allowed in. It’snot our choice.”
Tom Rogers, senior currency analystat Thomson Financial, points to thelong history of the Chinese as success-ful traders, going back to the days ofthe Silk Road.
“There is not much reason for themto change,” he says. “I know what thestick is — the international community.But what’s the carrot for China to reval-ue their economy? The Chinese arevery good traders. They aren’t going todo it without getting something inreturn. Unless they get some sort of G8membership or military cooperationpact, it’s not going to happen.”
The Great Wall Remember, also, that China is thecountry that built the Great Wallbeginning more than 2,500 years agoto keep out potential invaders. Morethan 1,500 miles long, it is the onlyman-made structure that can be seenfrom outer space.
As Gain Capital’s Dolan notes, it isimportant to view the currency conun-drum within the context of the culturaldifferences that exist between the Eastand the West.
“They’ve said they won’t make anychanges while the rest of the world isbreathing down their back,” he says.
continued on p. 16
Throughout 2004, amid continuing weakness in the
greenback, governments around the world pointed
to the Chinese renminbi’s peg to the U.S. dollar as
a potentially destabilizing global economic force.
16 February 2005 • CURRENCY TRADER
GLOBAL ECONOMY continued
“These are the same people who built theGreat Wall over several hundred years.Time is on their side. I wouldn’t expectany sort of revaluation this year at all.”
Modest widening of the bandOthers, however, believe a revaluationcould arrive scene fairly soon.
“We think the best window ofopportunity in the next 12 to 18months is the first half of 2005,” saysKathleen Stephansen, director of glob-al economic research at Credit SuisseFirst Boston.
There are two major ways theChinese could revalue their currency.The first is to create a currency baskettarget or to simply create a valuationband for the renminbi to fluctuate in vs.the dollar. Because of “technical diffi-culties” surrounding a currency baskettarget, most analysts believe the more
likely scenario would be to create a 3- to5-percent band for the renminbi to floatin.
If this were to occur, it would mostlikely arrive in the form of anannouncement from the Chinese gov-ernment. One morning, currencytraders would simply awaken to thenews that a band had been created. Theinitial announcement, of course, wouldlikely create at least an initial volatilitysurge in the global forex market.
Stephansen does concede, however,that a revaluation of this nature “won’tmean a great deal. Appreciation willbe relatively small.”
Bob Lynch, currency analyst at BNPParibas in New York, called the odds70 to 30 that a revaluation would takeplace in the first half of 2005, and JohnRothsfield, currency strategist at Bankof America, agrees.
“In our view, we think they will give
in and do a reval in the first half,” hesays. “We think it will most likely be afirst step.”
Bank of America expects a modestband to form around therenminbi/dollar, which would allowthe renminbi to appreciate to the8.03/dollar area.
Nonetheless, Rothsfield also admitsthat a 3-percent band “would prettymuch be symbolic. It wouldn’t havemuch of an economic impact.”However, he believes “China is buyinginto the idea they need to bear some ofthe burden to keep the global situationstable, in relation to the dollar’s lossesvs. the Euro.”
Alan Ruskin, research director at4Cast Inc., is another analyst whobelieves in the possibility of a near-term revaluation.
“At some point in the first half of
this year, we will get some kind ofadjustment,” he says. “China will atsome stage adjust the exchange ratemoderately.”
He believes a 5- to 10-percent bandaround the dollar would be the mostlikely scenario. While such a move“would open the door to Asian currencyflexibility, an adjustment [of that type]would be too small to make a difference.
“It will usher in a new era,” he con-cludes. “But, I don’t think that new erawill start with a bang.”
The “reval” trade:Sell Euro, buy AsiaThe bottom line for currency traders,of course, is what the impact will be inthe global currency markets if a reval-uation occurs. Thomson Financial’sRogers says a revaluation could mean“the end of the dollar sell-off againstthe European currencies.” In fact, he
says the big play would be to sellEurope and buy Asian currencies.
“There will be a big asset shift inthat direction,” he says.
Analysts agree a Chinese revalua-tion would likely result in the appreci-ation of a number of other Asian cur-rencies, including those from Japan,Singapore, South Korea and Thailand.
Cairns says a revaluation wouldlikely “trigger a fresh wave of specula-tive inflow into the Asian currencies —at the expense of the dollar. Asia,rather than Europe, should bear thebrunt of such an adjustment, sincemany Asian economies have beenattempting to target their currenciesagainst the Chinese renminbi ratherthan the dollar. We feel this would turnthe Euro/yen rate lower — a reversalof price action over the last two years.”
Rothsfield agreed that a big play offa reval scenario could be to sell theEuro and buy the Japanese yen.
The bottom line is that China will bethe leader for other Asian nations.
“The region as a whole will revaluebased on what China does,” Dolan says.
Given the huge long-term implica-tions of this scenario, forex traders willneed to keep their eyes and ears openin 2005 and be prepared to adjust to anasset-allocation shift away fromEurope and into Asia. �
Key meetingsGlobal currency markets will likelysee positioning around these keymeetings in 2005 as traders watchfor news or signals about potentialvaluation shifts:
G7 Finance Minister and CentralBank Governors Meetings
The information does NOT constitute trade signals. It is intended only to provide a brief synopsis of each market’sliquidity, direction and levels of momentum and volatility. See the legend for explanations of the different fields.
Note: Contracts marked with * or ** have both pit-traded and electronic contracts that are traded through the CME's Globex electronic platform. In these cases,we listed the contract with the highest volume -- * indicates the pit-traded contract had larger volume; ** indicates the electronic contract had larger volume.
CURRENCY FUTURES
This information is for educational purposes only. Currency Trader provides this data in good faith, but cannot guarantee its accuracy or timeliness. Currency Trader assumesno responsibility for the use of this information. Currency Trader does not recommend buying or selling any market, nor does it solicit orders to buy or sell any market. There isa high level of risk in trading, especially for traders who use leverage. The reader assumes all responsibility for his or her actions in the market.
LEGEND:Sym: Ticker symbol.Vol: 30-day average daily volume, in thousands.OI: Open interest, in thousands.10-day move: The percentage price move from theclose 10 days ago to today’s close.20-day move: The percentage price move from theclose 20 days ago to today’s close.60-day move: The percentage price move from theclose 60 days ago to today’s close.
The “% Rank” fields for each time window (10-daymoves, 20-day moves, etc.) show the percentile rank ofthe most recent move to a certain number of the previ-ous moves of the same size and in the same direction.For example, the “% Rank” for 10-day move shows howthe most recent 10-day move compares to the pasttwenty 10-day moves; for the 20-day move, the “%Rank” field shows how the most recent 20-day movecompares to the past sixty 20-day moves; for the 60-day move, the “% Rank” field shows how the mostrecent 60-day move compares to the past one-hundred-twenty 60-day moves. A reading of 100% means the
current reading is larger than all the past readings, whilea reading of 0% means the current reading is lowerthan the previous readings. These figures provide per-spective for determining how relatively large or small themost recent price move is compared to past pricemoves.Volatility ratio/rank: The ratio is the short-term volatility(10-day standard deviation of prices) divided by thelong-term volatility (100-day standard deviation ofprices). The rank is the percentile rank of the volatilityratio over the past 60 days.
The Chicago Mercantile Ex-change (CME) said 2004marked the fifth consecutive
year that volume on futures transac-tions reached record levels, with elec-tronic trading and currency contractsplaying a significant part in thegrowth.
The nation’s largest futuresexchange posted annual volume ofmore than 787 million contracts, withaverage daily volume up 26 percentyear-over-year to more than 3.1 mil-lion contracts. Volume on the CMEGlobex electronic trading platformsurged 71 percent on the year to morethan 451 million contracts, with aver-age daily volume of nearly 1.8 mil-lion.
In a statement, the CME said it setannual volume records in all majorgroups. Average daily volume in itsinterest rate products hit more than 1.7
million contracts, up 38 percent fromlast year. Eurodollar trading on CMEGlobex grew from 150,000 contractsper day during the first quarter to855,000 per day during the fourthquarter — representing 72 percent oftotal CME Eurodollar volume.
“The continued growth in electronictrading — which reached 67 percent oftotal volume during the fourth quarter— plus our expansion overseasthrough the successful execution of anumber of strategic initiatives, havemade our markets more accessibleglobally to a broader range of marketusers,” said Chicago MercantileChairman Terry Duffy in a statement.“What we accomplished in 2004demonstrates the effectiveness of ourgrowth strategy and lays the ground-work for further progress in 2005.”
Despite the normal year-end slow-down, the CME said overall fourth-
quarter trading activity remainedstrong, with average daily volume ofalmost 3.1 million contracts, up 33 per-cent from the same period in 2003.Leading the increase was a 79 percentrise in foreign exchange trading, aver-aging 252,000 contracts per day, and a42 percent jump in interest rate prod-ucts, averaging more than 1.65 millioncontracts per day.
Average daily volume for Decemberwas more than 2.8 million contracts, up27 percent from year-ago levels. CMEforeign exchange products had thehighest volume month ever, with morethan 312,000 contracts per day, up 84percent from December 2003. Interestrate products grew 29 percent andcommodities grew 21 percent com-pared to the same month a year ago.Overall electronic trading on CMEGlobex was up 99 percent in Decembercompared to year-ago levels.�
Currency trading continues to expand
Volume surges in CME products for 2004
CURRENCY FUTURES SNAPSHOT as of 1/28/05
18 February 2005 • CURRENCY TRADER
In a transforming moment, theforeign exchange market isreconsidering what its drivingforces should be. The analysis
emerging over the next few weeks isgoing to color the entire year, and per-haps beyond.
In early February, the Group ofSeven (G7) is going to hold one of itstwo yearly meetings. The G7 host thistime, Great Britain, has invited Chinato attend. Most commentators expectthe G7 to put pressure on China torevalue the renmimbi, which wouldhave a small effect on reducing theU.S. trade deficit with China, but a big-ger effect if other Asian countries fol-lowed suit. But most commentators
also expect China will politely refuse,on the perfectly true grounds that itsfinancial system is not yet big ormature enough to handle free marketinterest rates and exchange rates.
If the G7 were being held while thedollar was still falling, before January3, China’s refusal would have beendollar-negative. After all, the high andrising U.S. trade deficit with China is akey reason the dollar has fallen overthe past year.
But this time it will be different,because our understanding of the U.S.economic situation is undergoing atransformation from seeing the glassas half-empty to seeing it as half-full —even a little more than half-full.
FX Economics 101:Deficits and downtrendsIn a nutshell, the dollar has supposed-ly been on a downtrend for the pastthree years because of what everyonecalls an “unsustainable” currentaccount deficit. If you pointed out that“sustainability” has never beendefined and agreed upon — and a linkbetween the dollar and the deficit hasnot been proven — you were drownedout by solemn voices quoting enor-mous numbers, such as “$600 billion-plus,” the amount of the 2004 deficitwhen all the data finally comes in.
As a result of the deficit, the dollarwas supposed to fall by 20 to 40 per-cent to boost exports and inhibit
THE BIG PICTURE
The Golden Goose Rule (or, why the G7 is irrelevant)
As the perception of the U.S. economic situation undergoes a transformation,
the implications for the dollar and forex exchange as a whole are enormous.
Traders should prepare themselves for several scenarios.
BY BARBARA ROCKEFELLER
CURRENCY TRADER • February 2005 19
imports, which would bring the deficitback down to an acceptable level, say$300 billion, or 3 percent of GDPinstead of 6 percent. Meanwhile, for-eign capital inflows into the U.S.would be discouraged by the fallingdollar, creating a shortfall, whichwould in turn trigger a crisis thatwould force the Fed to print money orraise interest rates at an acceleratedpace, or both.
Raising rates to lure foreign capital
would have the side effect of slowingdomestic growth, possibly to near-recession levels, which would becounter-productive — foreignexporters would get a higher rate ofreturn on their money, but they wouldbe turning off the spigot of U.S.demand for their exports. Therefore,foreigners should not kill the goosethat lays the golden egg; they shouldcontinue to reinvest their export pro-ceeds in U.S. markets.
Critics say the U.S. is vulnerable toforeigners, especially important cen-tral banks in Japan, China, SouthKorea, and Taiwan, which might losetheir taste for U.S. paper as the dollartrends downward. Fed Chairman AlanGreenspan voiced doubt about thesustainability of the foreign appetitefor U.S. portfolio assets. But in prac-tice, the one with the power is thebiggest debtor, not the creditor — justask Donald Trump, who can all butname his terms to the big banks everytime he goes bankrupt.
The U.S. government still wants thedollar to decline to promote itsexports, not only in industrial prod-ucts but in the one area the U.S. has atremendous competitive advantage —agriculture. Last year will be the firstin more than 60 years the U.S. did notrun a surplus on agricultural products.Agriculture is like a touchstone for the
trade balance. Autos, airplanes, hightech — they can wax and wane, but inagriculture the U.S. dollar has to be ata level to sustain a net export balance.
The foreign exchange market isstarting to operate on this new under-standing: If exporter nations don’trecycle their dollars back to the U.S. asequilibrating capital inflow, they willkill the goose that is laying the goldenegg. And yet, the U.S. officially wantsthe dollar to stay in a downtrend so the
underlying cause of the trade imbal-ance is rectified, at least somewhat.Surplus countries that are recyclingtheir dollars back into U.S. paper haveto accept the currency downtrend; inreturn, the U.S. will give them a betterreal rate of return than they can getelsewhere, and a rising rate of return,to boot.
FX Economics 102: Capitalflows and feeding the gooseIn “Trends, retracements and news inforeign exchange” (Currency Trader,January 2005), I wrote that the month-ly net capital inflow is the single mostimportant piece of data in the FX mar-ket today.
When the capital flow reportshowed a shortfall in December (forthe month of October), the marketrushed to sell dollars. When theJanuary report came out — showing abig surplus — the dollar was alreadyrising.
The latest TICS (TreasuryInternational Capital System) reportfell on receptive ears. It showed netportfolio investment rose to $81 billionin November from a revised $48.3 bil-lion in October and $61.1 billion inSeptember. Net portfolio flows into theU.S. have averaged $68.5 billion permonth in 2004, compared to $57 billionin 2003 and $47.9 billion in 2002. The
total net inflow of portfolio investmentinto the U.S. during the first elevenmonths of 2004 increased to $753.6 bil-lion in 2004 from $683.6 billion duringthe first eleven months of 2003, or a 10percent increase.
The U.S. can clearly attract the capi-tal to fund the current account deficiteven with a falling dollar and a yielddifferential over the closest big com-petitor (Germany) in the 10-year noteof only around 50 basis points.
We call this new understanding the“Golden Goose” rule. It’s differentfrom the “too big to fail” argument,which implies the creditor accepts araw deal for the sake of getting anydeal at all. The Golden Goose rulemeans the surplus countries “stuck”with U.S. paper are actually gettingsomething well worth having.
In fact (to mix up the bird metaphora little), they are killing two birds withone stone. First, they are keeping theircitizens employed making products toexport to the U.S., which is not a negli-gible benefit in places where ordinaryworkers are still saving up for indoorplumbing. Second, they are getting agood real rate of return on their port-folio investments — better than theycould in Japan or in Europe, if lessthan in the U.K., Canada, andAustralia.
Not only is it a good real rate ofreturn, it’s a rising rate of return. Theyknow that because Mr. Greenspanpromised it to them, rate increases willoccur at a “measured pace” for anadditional 1 percent or more over thenext six months. There is nothingunpleasant or involuntary about thisdeal.
There is one hard-to-swallow — andpotentially dangerous — aspect to this,though. The Fed has done its job too
continued on p. 20
Power belongs to the biggest debtor, not the creditor — just ask Donald Trump,
who can all but name his terms to the big banks every time he goes bankrupt.
well: The bond market is not pricing ininflation to the yield on the longermaturity paper, such as the 10-yearnote. In fact, the yield has fallen pro-gressively lower since the Fed startedraising rates in June 2004.
Because we must assume foreigninvestors are rational, we must alsoassume they are parking their dollarsin shorter-term accounts and instru-ments. By definition, money that canbe withdrawn on a moment’s notice(i.e., 30, 60, or 90 days) is “hot money.”Therefore, the U.S. is vulnerable to arapid and punishing withdrawal in theevent of another shock like WorldTrade Center attacks.
This is controllable, in that the Fedcan suspend withdrawals, althoughthat would be a last-resort measure.Still, it’s something to keep in the backof your mind. Hot money is associatedwith banana republics, not with themightiest industrial and militarypower on the planet.
Some people just don’t get itNot everyone sees it this way — yet.The conventional thinking — that the
U.S. is in trouble, rather than in the cat-bird seat, because of the deficit — isstill embraced by many. A London out-fit named Central Banking Publicationshas just published its first annualreview of central bank managementpractices, named Reserve ManagementTrends 2005 (http://www.centralbank-ing.co.uk/). The report surveys over 60
managers who control $1.7 trillion inreserves. It found that “Central banksare stockpiling reserves at an unprece-dented rate. Their war-chest of foreignexchange, now worth almost $4 tril-lion, has risen by 65 percent in the lastfour years alone.” The 65 central banksthat participated control 45 percent ofglobal reserves, with “up to $250 bil-lion under management,” meaningneither China nor Japan were part of
the survey. Some of the main findings:
At the end of 2003, centralbanks held 70 percent ofreserves in dollar-denominat-ed assets, financing over 80percent of the currentaccount deficit that year.However, “The U.S. cannottake support for the dollar forgranted…Central banks’enthusiasm for the dollarseems to be cooling off,”according to the survey.
Nearly half said reservesgrowth will slow from therecent torrid pace to onlyabout 20 percent over thenext four years. Because theincome from reserves isimportant to just about all ofthem, the dollar’s declinemakes it less attractive on atotal yield basis, and in somecases, the drop has led tonegative real returns. The
conclusion is that the central bankswill increasingly prefer a stable curren-cy like the euro.
But wait a minute. If the dollar isunstable, why is the euro not equallyunstable? After all, unless you arelooking at one of the trade-weighteddollar indices, we measure the leveland the volatility of the dollar in terms
of the euro, which by definition hasvaried exactly as much as the dollar.
Also, it’s questionable whether thecentral bank managers really do careabout the net income they receive ontheir dollar investments. Since when isa central bank a “profit center” withina government? In practice, centralbanks tend to be profitable, but theyare also extremely risk-averse.Reserves are a nation’s net savings,
THE BIG PICTURE continued
The Golden Goose rule means the surplus
countries “stuck” with U.S. paper are actually getting
something well worth having.
Euro (EUR), monthly
2000 2001 2002 2003 2004 2005 2006
1.45
1.40
1.35
1.30
1.25
1.20
1.15
1.10
1.05
1.00
0.95
0.90
0.85
0.80
0.75
The blue lines are a linear regression channel defining the euro/dollar (EUR/USD) rate’slong-term uptrend. The horizontal lines depict a potential trading range.
and it’s hard to think of central bankmanagers leaping from an ultra-con-servative management style intohedge fund-type activities.
This is not to say the central banksare not diversifying. But to imaginethat central bank diversification isgoing to have a big effect on the day-to-day movements of the FX market isto exaggerate for the sake of sensation-alism.
Meanwhile, something else is goingon that constitutes a vote on the sus-tainability of the U.S. economy and therelative irrelevance of the short-termlevel of the dollar. Foreign directinvestment (FDI), which is almostexclusively from the private sector, ison the rise again. According to a new
United Nations report, through thefirst three quarters of 2004, FDI rose 6percent from 2003 to $612 billion, thefirst gain in four years.
As we would expect, developingcountries got the biggest chunk, up 48percent from the year before to $255billion, of which Asia got $166 billion.Of that, China took in $62 billion (andthat’s only what’s reported). Together,China and Hong Kong got 60 percent
of overall FDI in Asia. Foreign direct investment in indus-
trialized countries fell 16 percent to$321 billion, with FDI into Europedown 46 percent to $165 billion. FDI inthe U.K. climbed 160 percent to $55 bil-lion, while the U.S. enjoyed a 400-per-cent gain (to $121 billion dollars) in
foreign direct investment, outstrippingChina to regain the status of the topFDI recipient. Japan, despite efforts toattract investment, saw only a 17 per-cent rise and only $7 billion.
Balancing the argumentsOne theory says the dollar must fallbecause of the current account deficit.A different theory says the dollar does-n’t have to fall as long as foreigners are
willing to recycle their export proceedsback into dollar paper (something theyjust demonstrated their willingness todo in the latest capital flow report).
Meanwhile, interest rates are rising,which can only keep the capital inflowgoing. This is an equilibrium situation.Traders, of course, hate equilibrium. It
deprives them of profitopportunity. They will becasting around for reasons(read: excuses) to push themarket one way or the other.Possible “factors” include theprice of oil, political turmoil,and statements from impor-tant government officials,especially the Fed, disclosingwhat they want. Does theU.S. government really wanta lower dollar? It may bepressed to the wall to say so.
Introducing a technicalconstraintIf equilibrium is what we areabout to see in the FX market,we have to ask what shape itwill take on the chart. Lastsummer traders witnessed aprolonged sideways tradingrange. That could happenagain for a large part of thisyear, too. The FX market isnot always in trending mode.
continued on p. 22
Euro (EUR), monthly
23.6%
38.2%
50.0%
61.8%
2001 2002 2003 2004 2005
1.35
1.30
1.25
1.20
1.15
1.10
1.05
1.00
0.95
0.90
0.85
0.80
Calculating Fibonacci retracement levels of the uptrend from Figure 1 forecasts a 50-per-cent retracement to around 109.50.
FIGURE 2 — RETRACEMENT SCENARIO 1
Source: Meta Stock
In the first three quarters of 2004, the U.S. experienced a 400-percent
gain in foreign direct investment, outstripping China to regain the status
of the top FDI recipient.
22 February 2005 • CURRENCY TRADER
But before that happens,we need a resolution of thethinking on the current priceaction. The general feeling isthe euro rose over threeyears, and is now correctingdownward on less-negativefeelings about the dollar andthe U.S. place in the globaleconomy.
Figure 1 shows the big-pic-ture euro/dollar (EUR/USD)rise from the October 2000low of 82.50. The normalhigh-low range over severalmonths tends to be .20. Wewould have to see a down-side breakout below 1.2590(the bottom of the range pro-jected by the regression chan-nel — dotted lines) at mid-year to be convinced the eurouptrend is over; it’s just aseasy to envision a move to1.4560 (the top of the channelextension). The middle line is the lin-ear regression, which extends to 1.3570at the end of June 2005. So whatwould a sideways movement look likeand where would it start? If we areunlucky, it could look like the horizon-tal lines in Figure 1, which would be areplay of 2001.
In the FX market, a high percentageof analysts like the Elliott Wave theoryof price development, and many alsolike the Fibonacci number sequence as aguide to counting the depth of correc-
tive waves. Everyone can see that pricemoves look like waves, but I’ve neverhad much luck counting waves.
Somewhat more impressive is theFibonacci retracement concept, whichimplies after a big impulse wave in onedirection, the price will retrace part ofits move in the other direction. Theretracement will be 23.6 percent, 38.2percent, 50 percent, or 61.8 percent ofthe original move. The problem isdeciding when the original move starts.
Applying standard Fibonacciretracement lines forecasts a 50-per-cent retracement of the trend shown inFigure 1 to 109.50 or so (Figure 2). Thismove would not be a new trend, just aretracement. If you are an economist ora very long-term investor (WarrenBuffett, perhaps) you might be willingto consider a move from 1.36 to 1.10 asonly a “retracement.” But if you are amere mortal or an actual trader, itwould certainly feel like somethingelse.
Now consider Figure 3. This appliesthe retracement concept to the trendstarting at the late-August 2004 low.
This chart is a different kettle of fish.On this version, a 50-percent retrace-ment produces a downside target of1.2638, whereupon (if the euro uptrendis still in place) we expect the tempo-rary, “corrective” dollar rally to end.There are a dozen other ways to showretracement levels. If and when we doget a return to the euro up move, youcan bet that you will see analystsclaiming to have picked the rightretracement level all along.
This kind of chart work is why yousee euro forecasts of 1.05 rubbingelbows with forecasts of 1.45. Both canbe found on the charts using widely-used charting methods. We tend tothink the Golden Goose rule is a power-ful concept and that it will throw dust inthe face of all the retracement crowds.
If the Golden Goose rule is right,and the market is coming to toleratethe global imbalance, we will get thesideways range-trading market shownin Figure 1. Trading the currency mar-ket is about to get very difficult. �
For information on the author see p. 8.
THE BIG PICTURE continued
Related reading
“The great global imbalancehoax,” by Barbara Rockefeller.Currency Trader, December 2004.
“The current account deficit’simpact on the U.S. dollar”
The information on this page is subject to change. CurrencyTrader is not responsible for the accuracy of calendar dates beyond press time.
CPI: Consumer Price Index
ECB: European CentralBank
FOMC: Federal Open MarketCommittee
GDP: Gross DomesticProduct
ISM: Institute for Supply Management
PPI: Producer Price Index
Legend
Monday Tuesday Wednesday Thursday Friday Saturday
GLOBAL ECONOMIC CALENDAR FEBRUARY
24U.S.: Durablegoods
28Canada: GDP
Australia: International reserves and foreign currency liquidity
Italy: International reserves and foreigncurrency liquidity
25U.S.: GDP
Canada:Employment;Balance of internationalpayments
21Canada: Retailtrade
26
4U.S.: Employmentreport
Germany: Ordersreceived andmanufacturingturnover
24 February 2005 • CURRENCY TRADER
CURRENCY STRATEGIES
BY KATHY LIEN
V olatility-based trading approaches have tra-ditionally been popular among hedge funds,commodity trading advisors, and other pro-fessional traders. There are many ways to
gauge volatility (see “Related reading”) and incorporate itin a trading strategy. Of the different ways to characterizeand trade volatility, the best are based on the tendency ofvolatility to “revert to the mean.”
The premise behind volatility mean reversion isthat periods of extraordinarily high volatility shouldbe followed by periods of lower, more normalizedvolatility. Similarly, periods of extraordinary lowvolatility should be followed by periods of higher,more normalized volatility. This tendency is reflect-ed by the familiar progression of a market thatmeanders in a narrow trading range (a low-volatili-ty condition), only to explode out of the consolida-tion and embark on a strong price trend (a high-volatility condition). Eventually, the price moveexhausts itself, at which point volatility will againfall to a lower level.
We’ll analyze the two simple methods for tradingvolatility in the forex market: inside days and short-term/long-term volatility comparisons.
Consecutive inside barsAn inside bar is a bar whose range is containedwithin the prior bar’s range — that is, the bar’s highand low do not exceed the previous bar’s high andlow (see Figure 1). They are easy to identify visuallyand should be one of the basic patterns tradersshould notice immediately.
Inside bars by definition have lower volatility —that is, less price movement — than their precedingbars, and successive inside bars reflect progressively
shrinking volatility. Per themean-reversion theory, themore inside bars, the higherlikelihood of a volatilitysurge or a breakout scenario.
The following volatilitytrade can be implemented
U.S. dollar/ Canadian dollar (USD/CAD), daily
Go long above highof 2nd inside bar
Stop-and-reverse order
11 12 14 15 16 17 18 19 22 23 25 26 29 30 Jan. 2
1.580
1.578
1.576
1.574
1.572
1.570
1.568
1.566
1.564
1.562
1.560
1.558
1.556
1.554
1.552
1.550
1.548
A long trade is initiated and is placed above the high of the mostrecent inside bar, while the stop is placed below the low of themost recent inside bar.
FIGURE 2 — LONG TRADE
Source: FXCM (www.fxcm.com)
Because they have lowerhighs and higher lows,inside bars by definitionhave lower volatility —i.e., less price movement— than the bars that precede them.
FIGURE 1 — INSIDE BAR
Lower high
Higher low
Volatility-basedcurrency tradingMarket volatility can be a complex subject, but understanding a few
basic principles can help you implement strategies to capitalize on
after at least two consecutive insidebars have formed. This type of strategyis best employed on daily charts; thelonger the time frame, the more signif-icant the potential breakout.
The strategy works for both longs orshorts. Although entry orders can beplaced on both sides of the market,traders should use other tools to deter-mine the bias for a particular trade. Forexample, if the inside days occur with-in a bullish chart pattern, such as adeveloping ascending triangle, thisincreases the likelihood of an upsidebreakout. On the other hand, if theinside days are developing within adescending triangle formation, thisincreases the likelihood of a downsidebreakout. Here are the rules for a longtrade setup:
1. Buy above the high of the mostrecent inside bar.
2. Place a stop-and-reverse (SAR)order a few pips (approximately 5 to10 pips, depending on the bid-askspread) below the low of the mostrecent inside bar. The purpose of theSAR order is to reverse the position ifthe initial move turns out to be a falsebreakout.
3. If the position moves higher bythe risk amount (the differencebetween the entry price and the stop price), sell half the position andreplace the SAR order with a trailingstop.
4. If the SAR order is triggered afterthe entry, place a stop a few pips abovethe high of the most recent inside bar.
Short trades: For a short trade, therules are the same except that youenter below the low of the most recentinside day and place an SAR order a
few pips above the high of the mostrecent inside day.
Figure 2 shows two consecutiveinside bars in the U.S.dollar/Canadian dollar (USD/CAD)rate. Applying the strategy, a buyorder is placed above the high of themost recent inside bar, while a stop isplaced below the low of the mostrecent inside bar. The long order istriggered and a 200-pip rally ensueswith virtually no retracement.
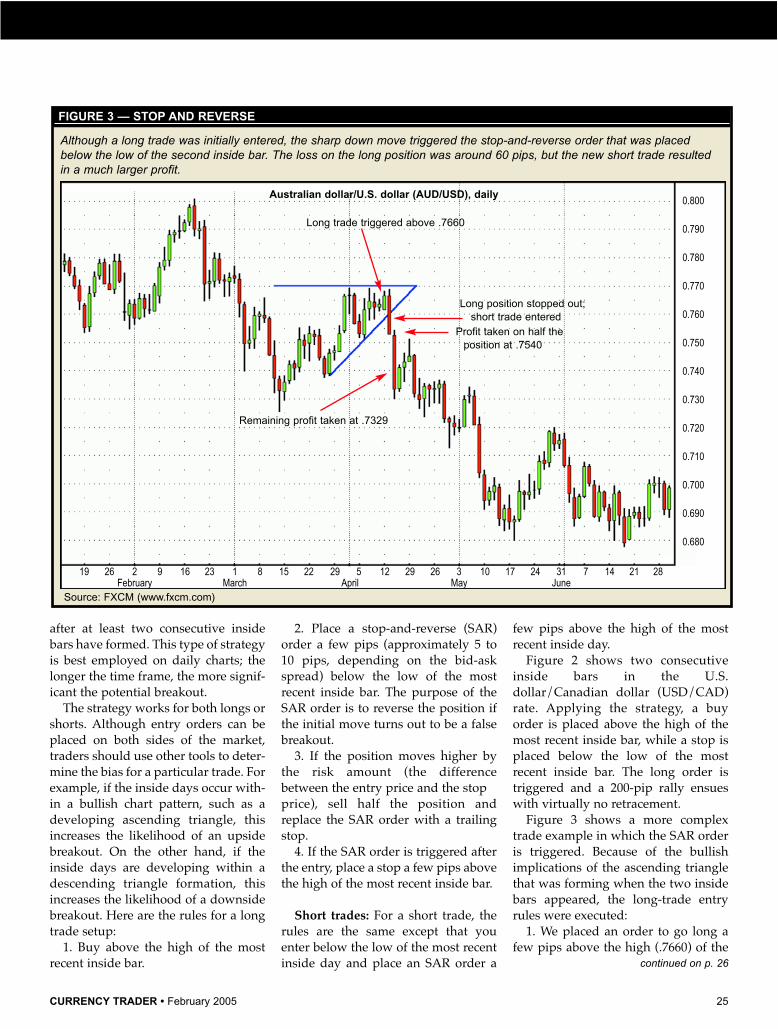
Figure 3 shows a more complextrade example in which the SAR orderis triggered. Because of the bullishimplications of the ascending trianglethat was forming when the two insidebars appeared, the long-trade entryrules were executed:
1. We placed an order to go long afew pips above the high (.7660) of the
continued on p. 26
Australian dollar/U.S. dollar (AUD/USD), daily
19 26 2 9 16 23 1 8 15 22 29 5 12 29 26 3 10 17 24 31 7 14 21 28February March April May June
0.800
0.790
0.780
0.770
0.760
0.750
0.740
0.730
0.720
0.710
0.700
0.690
0.680
Although a long trade was initially entered, the sharp down move triggered the stop-and-reverse order that was placedbelow the low of the second inside bar. The loss on the long position was around 60 pips, but the new short trade resultedin a much larger profit.
“Getting a lift from the carrytrade,” Currency Trader, October 2004.
“Forex trading: Understandingthe currency market,” ActiveTrader, July 2004.
You can purchase and downloadpast Active Trader articles atwww.activetradermag.com/pur-chase_articles.htm.
Other Currency Traderarticles:
“True range” An analysis of true range andaverage true range, which aresimple volatility calculations.
Other Active Trader articles:
“Indicator Insight: Volatility index(VIX),” April 2001, p. 98.A primer on the volatility index.
“Putting volatility to work,” April 2001, p. 42.A discussion of practical volatilityanalysis and trading techniques.
“Indicator Insight: BollingerBands,” July 2003, p. 74.A primer on Bollinger Bands.
“Technical Tool Insight: Insidedays,” January 2003, p. 88.
26 February 2005 • CURRENCY TRADER
most recent inside day. The order wastriggered.
2. We placed an SAR order a fewpips below the low of the most recentinside day at .7600 for a risk of approx-imately 60 pips. The SAR was trig-gered when the market broke out ofthe bottom of the triangle, and we soldthe original long position and enteredinto a new short position.
3. When the market moved lower bythe risk amount (60 pips), we sold halfthe position (at .7540). We then used a30-pip trailing stop on the remainingposition.
The low on April 14, 2004 was .7299,and we exited the remaining half ofthe position at .7329.
Volatility comparisonCurrency option volatilities measurethe rate and magnitude of the past andpotential future changes in a curren-cy’s price, and they can be a useful tool
for timing currency movements. Implied option volatilities, which
are reflected in option premiums, arethe market’s current estimate of thefuture fluctuation of a currency’sprice. Historical (or statistical) volatili-ty, which reflects past price move-ment, is typically measured by calcu-lating the annualized standard devia-tion of price changes over a given peri-od (e.g., 20 days, 100 days).
Figure 4 shows only current optionimplied volatilities (which are basedupon a survey of interbank sources).Traders implementing this strategywould need to keep a journal trackinghistorical implied volatilities. One-month and three-month impliedvolatilities are two of the most com-monly benchmarked time frames.
When option volatilities are low,traders should look for potentialbreakouts. Current implied volatilityshould be at least 25 percent lowerthan historical implied volatility. (It is
CURRENCY STRATEGIES continued
These current option implied volatilities (which represent percentages) arebased upon a survey of interbank forex sources. When the current impliedvolatility is low relative to past benchmarks (e.g. one- and three-month impliedvolatilities), the odds of a volatility surge increase.
best to measure against actual histori-cal volatility, but that data is notalways readily available.) Conversely,when option volatilities are high,traders should look for range tradingopportunities.
Typically, when a currency trades ina range, its option volatility willdecline, because by definition rangetrading means lack of movement.When option volatilities make a pro-nounced down move, it is usually asign of a significant potential pricemove and upcoming trade opportuni-ty.
This characteristic is very importantfor both range and breakout traders.Traders who usually sell at the tops ofranges and buy at the bottoms can usethis approach to predict when theirstrategy could potentially stop work-ing, because if volatility becomes very
low, the likelihood of continued rangetrading decreases.
On the other hand, breakout traderscan monitor option volatilities to makesure that they are not buying or sellinginto false breakouts. If volatility is ataverage levels, the likelihood of a falsebreakout increases. Alternatively, ifvolatility is very low, the probability ofa real breakout is higher. However,traders must be careful because volatil-ities can have long downward trends,as they did between June and October2002. Therefore, declining volatilitiescan sometimes be misleading. Whattraders need to look for is a sharp movein volatility, rather than a gradual one.
Figure 5 shows an example in theU.S. dollar/Swiss franc rate(USD/CHF). The blue line is price, thegreen line is the one-month (or short-term) volatility, and the red line is
three-month (or longer-term) volatili-ty. For most of December 2003 the one-month volatility was below the three-month volatility, which coincided withthe development of sharp downmoves in USD/CHF. Between Feb. 24,2004 and March 9, 2004, the one-monthvolatility spiked above the three-month volatility, which coincided witha period of range trading.
All shapes and sizesVolatility is expressed many ways —on different time frames and in termsof option prices and past price fluctua-tions in an underlying market.Understanding some simple volatilityprinciples, such as mean reversion, canhelp you time trades when a volatilityshift is likely to occur.�
For information on the author see p. 8
Because implied volatilities can have long downward trends, traders should look for sharp volatility moves, not gradualones. Here, the one-month volatility was below the three-month volatility for most of December 2003, which coincided withthe development of sharp down moves in USD/CHF. But between Feb. 24 and March 9, 2004 the one-month volatilityspiked above the three-month volatility, which coincided with a period of range trading.
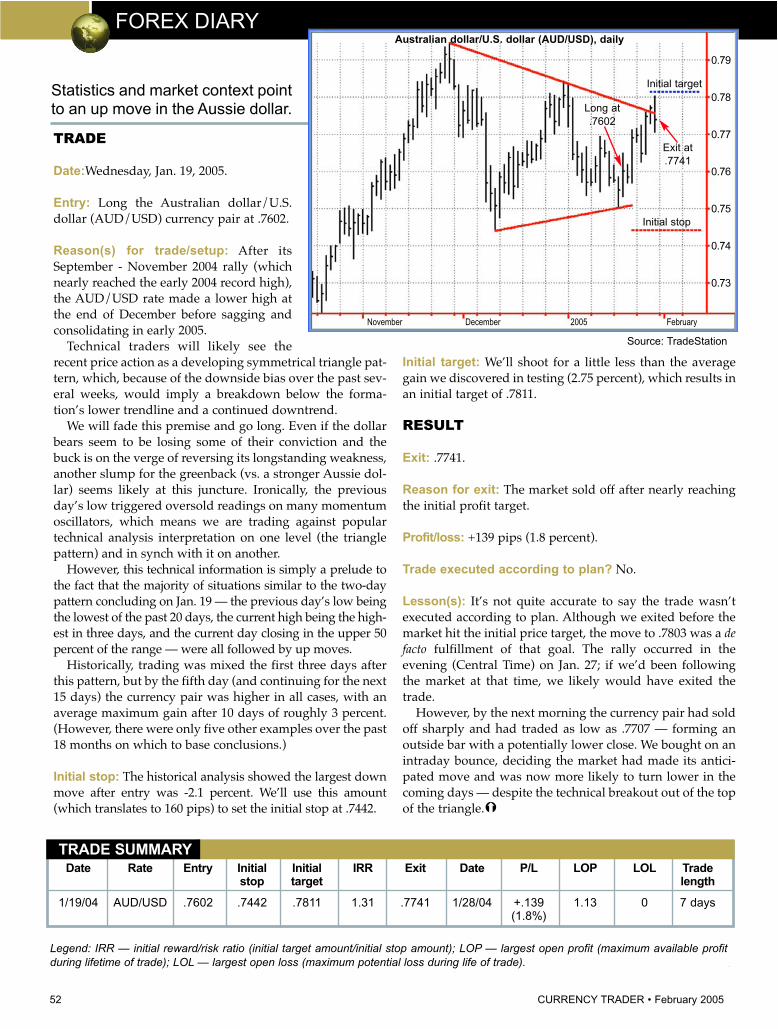
T rade setups confirmedby independent tech-niques or tools — orthose that occur simulta-
neously on different time frames —naturally carry more weight than thosesignaled by a single input. The tradeexamples outlined here combine pivotpoints with candlestick patterns to bet-ter pinpoint forex trade opportunities.
Pivot point analysis is based onmathematical calculations used todetermine future support and resist-ance levels. The pivot point value isderived from the high, low and closingprices of the previous price bar, and isthen added to and subtracted from theprevious bar’s reference points todetermine support and resistance lev-els for future trading. The pivot point(PP) formula is:
1. PP = (H + L + C)/32. First resistance level (R1) = (PP*2) - L3. Second resistance level (R2) = PP + (H - L)4. First support level (S1) = (PP*2) - H 5. Second support level (S2) = PP - (H - L)
There is some debate about which value should be usedfor the closing price in the virtually 24-hour forex market. In
forex, all trades must be settled within two business days,which is established at the close of banking business at 5p.m. ET. As a result, this is the time typically used for theclosing price.
Using pivot pointsSome traders use the pivot numbers to estimate the upcom-ing high or low, or to simply identify a level at which a mar-ket might change direction on an intraday basis.
A popular pivot-point approach is to cover any shortpositions and go long at either of the two support levels, or
CURRENCY STRATEGIES
Candlesticks reflecting upward and downward momentum are shown alongsidetheir bar chart counterparts.
FIGURE 1 — CANDLESTICKS
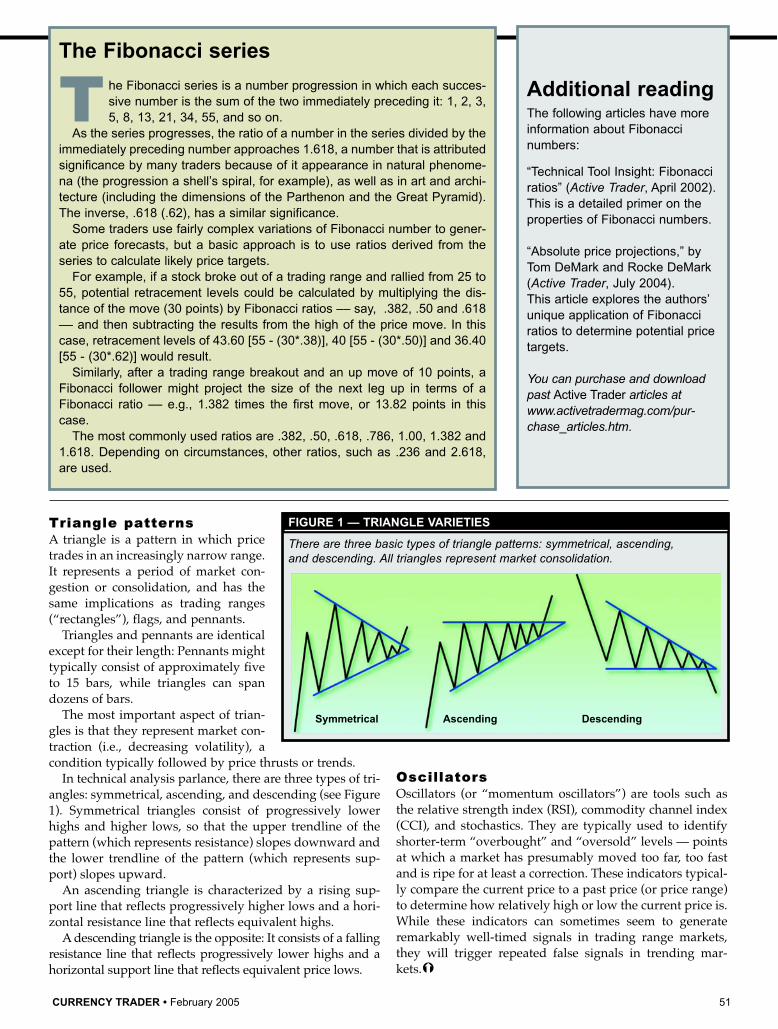
Pivot points and candlesticks
Augmenting pivot point analysis with candlestick formations helps determine
potential turning points in the forex market.
BY JOHN PERSON
Close
Close
Close
Close
CloseOpen
Open
Open
Open
Open
Low
LowLow Low
Upper shadow
Real body
Lower shadow
High
Low
High
HighHigh High
B
C
E
D
A
CURRENCY TRADER • February 2005 29
sell any long positions and go short at the projected resist-ance levels. Accordingly, while these price levels providepoints at which to enter or exit the market, they also indi-cate where not to make trades. For example, you should notbuy just below either of the resistance levels.
It is beneficial to use multiple time frames — e.g., month-ly, weekly, and daily — to identify multiple pivot pointsupport and resistance levels. A particular level has moresignificance when pivot points on two or more time framescoincide.
Combing pivot point levels with the price moves impliedby candlestick patterns improves your odds of identifyingfavorable trade points.
CandlesticksThe components of a candlestick are derived from the sameopen, high, low, and close data that make up standard barcharts. The main component we are concerned with here isthe relationship between the open and close of a session,which is called the candle’s “body” or “real body.” Thecolor of a candlestick does not indicate whether it closedhigher or lower than the preceding candle; rather, it reflectswhere the candle closed relative to the open.
In Figure 1, the trading period’s high and low are repre-sented by the highest and lowest points of the candlestick,while the session’s open and close are represented by thetop and bottom of the wider part of the candlestick. Thethin lines at the tops and bottoms are called “shadows” (orwicks), and the wider parts are the real bodies. The candleis typically white (or hollow, or green) if the close wasabove the open and black (or red) if the close was below theopen. Candle A closed higher than the open and candle Bclosed below the open. Candle C closed above the open —the open was the low price of the day, and the close was thehigh price of the day. Candle D illustrates the opposite con-dition. Finally, candle E opened and closed at the same priceand is identical to its bar-chart equivalent.
Doji-based patterns: Indecision and reversalCandlesticks are designed to make bullish and bearishmomentum more evident on a price chart. This can high-light certain patterns, such as the high-close doji, that helpdetermine a change in market direction or reversal.
A doji is a candle that opens and closes at (or very near)the same price — look again at Candle E in Figure 1. Suchcandles indicate indecision or uncertainty. Both buyers andsellers have lost confidence from the time the market opens,
as price has pushed bothhigher and lower, only toend up where it started. In-decision is the last thingyou want to see in a trend-ing market. Rejection orfailure from a high or lowis a sign potential changesin the market are on thehorizon.
In a strong downtrend, amarket will usually closenear its low as highly-cap-italized traders hold oradd to short positionsovernight. If these big-money traders are not con-fident the market will closelower, the market mayhave the tendency to closeback near the open.
Dojis sometimes appearas part of more reliabletwo- and three-candle for-mations, such as the morn-ing star pattern, that high-
light reversals. The basic morning star is a three-candle, bot-tom reversal pattern. When the pattern’s middle candle is adoji, it is called a morning doji star, as shown in Figure 2.
The first candle has a long, black real body (a lower closethan open); the second candle has a small body that gapsbelow the first candle’s body. The third candle is a whitecandle (a higher close than open), and closes above themidpoint of the first candle’s real body. The third candle’sbody may sometimes gap higher than the second candle’sbody, as is the case in Figure 2.
There are several variations to this textbook description.For example, the initial black candle might have a small realbody and the real body of the long white candle mightentirely engulf the long dark candle or simply just partiallypenetrate its real body. The most important thing to noticeis what happens after the doji candle. A candle after a dojithat closes above the doji’s high confirms a directionalchange has occurred.
When either a morning doji star or simply a doji developsafter a downtrend — especially if it is near an important tar-
continued on p. 30
A doji (middle candle) represents indecision. In the
morning doji star pattern,this indecision marks the
change from down move toup move.
FIGURE 2 — THE MORNING DOJI STAR
30 February 2005 • CURRENCY TRADER
get, such as a pivot point support level — it is likely if thenext candle closes above the doji’s high, a reversal of therecent trend will occur. To trigger an entry, it is importantfor price to close above the doji’s high. This confirms thebreakout and positive momentum should develop within afew bars.
Trade examples: Combining pivots and dojisLining up the pivot points on your screen before the begin-ning of a trading session prepares you for when a setup likea doji or morning doji star pattern develops.
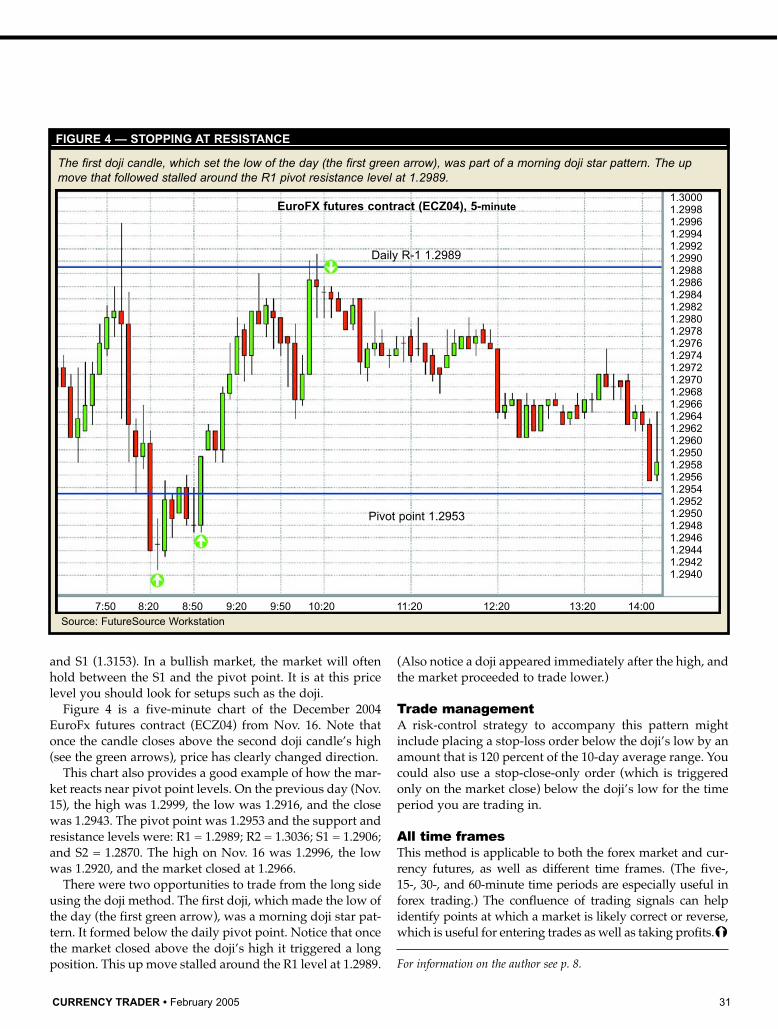
Figure 3 is a 15-minute chart of the Euro/U.S. dollar rate(EUR/USD). On Dec. 10 (a Friday) the high was 1.3318, the
low was 1.3148, and the close was 1.3241. The resulting pivotpoint levels for the following trading day (Dec. 13) are:
On Dec. 13 the high turned out to be 1.3325, the low was1.3192, and the close was 1.3313. The market did not pre-cisely hit the S1 target number, but the low occurred almostexactly at the midpoint (1.3194) of the pivot point (1.3236)
Although price didn’t precisely hit the S1 level, the low occurred almost exactly at the midpoint (1.3194) of the pivot point(1.3236) and S1 (1.3153). If a market is bullish, it often holds between the S1 and the pivot point. This is the price level atwhich to look for a reversal setup such as a doji pattern.
FIGURE 3 — PIVOT POINT SUPPORT AND RESISTANCE LEVELS
Source: FutureSource Workstation
Combing pivot point levels with the price moves implied by candlestick
patterns improves your odds of identifying favorable trade points.
CURRENCY TRADER • February 2005 31
and S1 (1.3153). In a bullish market, the market will oftenhold between the S1 and the pivot point. It is at this pricelevel you should look for setups such as the doji.
Figure 4 is a five-minute chart of the December 2004EuroFx futures contract (ECZ04) from Nov. 16. Note thatonce the candle closes above the second doji candle’s high(see the green arrows), price has clearly changed direction.
This chart also provides a good example of how the mar-ket reacts near pivot point levels. On the previous day (Nov.15), the high was 1.2999, the low was 1.2916, and the closewas 1.2943. The pivot point was 1.2953 and the support andresistance levels were: R1 = 1.2989; R2 = 1.3036; S1 = 1.2906;and S2 = 1.2870. The high on Nov. 16 was 1.2996, the lowwas 1.2920, and the market closed at 1.2966.
There were two opportunities to trade from the long sideusing the doji method. The first doji, which made the low ofthe day (the first green arrow), was a morning doji star pat-tern. It formed below the daily pivot point. Notice that oncethe market closed above the doji’s high it triggered a longposition. This up move stalled around the R1 level at 1.2989.
(Also notice a doji appeared immediately after the high, andthe market proceeded to trade lower.)
Trade managementA risk-control strategy to accompany this pattern mightinclude placing a stop-loss order below the doji’s low by anamount that is 120 percent of the 10-day average range. Youcould also use a stop-close-only order (which is triggeredonly on the market close) below the doji’s low for the timeperiod you are trading in.
All time framesThis method is applicable to both the forex market and cur-rency futures, as well as different time frames. (The five-,15-, 30-, and 60-minute time periods are especially useful inforex trading.) The confluence of trading signals can helpidentify points at which a market is likely correct or reverse,which is useful for entering trades as well as taking profits.�
The first doji candle, which set the low of the day (the first green arrow), was part of a morning doji star pattern. The upmove that followed stalled around the R1 pivot resistance level at 1.2989.
FIGURE 4 — STOPPING AT RESISTANCE
Source: FutureSource Workstation
Pivot point 1.2953
Daily R-1 1.2989
32 February 2005 • CURRENCY TRADER
O ver the past threeyears, the U.S. currentaccount balance andthe U.S. government’s
annual budget have hit record deficitlevels, and since these twin deficits arecrucial to the U.S. dollar’s value, econ-omists can’t stop worrying about howthese debts may continue to affect thebuck.
The current account not only tracksthe U.S. trade balance, or the differ-ence between U.S. imports andexports, but also includes income from
foreign investments and payments toforeign investors. Therefore, it’s thebest measure of how much the U.S.now owes foreign countries.
While the current account has beenat a deficit over much of the past 25years, this figure has more than dou-bled to -$608.7 billion since 1999, or 5.3percent of the Gross Domestic Product(GDP), according to Deutsche Bankestimates. Most economists agreethese unprecedented levels can’t con-tinue indefinitely without furtherdamaging the U.S. dollar.
The following analysis, however,focuses on short-term patterns (i.e.,less than three months) in the dollarsurrounding the quarterly currentaccount balance report, officially titled“U.S. International Transactions.” (Foran explanation of the report and howthe current account is calculated, see“What is the Current AccountBalance?”)
In addition to analyzing how theU.S. dollar fared before and after all 43quarterly releases since June 1994, wealso studied the dollar’s response to
CURRENCY CHARACTERISTICS
Annual current account surplus/deficit vs. nominal U.S. dollar major currencies index (1973 to 2004)
Annu
al c
urre
nt a
ccou
nt s
urpl
us/d
efic
it (in
billi
ons)
1973
1974
1975
1976
1977
1978
1979
1980
1981
1982
1983
1984
1985
1986
1987
1988
1989
1990
1991
1992
1993
1994
1995
1996
1997
1998
1999
2000
2001
2002
2003
2004
*
Year
Source: Bureau of Economic Analysis (BEA), Federal Reserve * 2004 current account estimate from Deutsche Bank
Nom
inal U.S. dollar currencies index
140.00
130.00
120.00
110.00
100.00
90.00
80.00
50
-50
-150
-250
-350
-450
-550
-650
Annual current account surplus/deficit (left scale)
Nominal U.S. dollar major currencies index (right scale)
This figure compares the annual current account balance to the Fed's U.S. dollar major currencies index over the past 31years, and shows several key patterns. First, the dollar's rally from 1980 to 1984 occurred either during a surplus or only atthe beginning of significant deficits. Also, the U.S. dollar's two steep multi-year declines (1984 to 1987 and 2001 to 2004)began as the deficit grew to record levels. However, the dollar's climb from 1995 to 2001 is an exception to this rule.
FIGURE 1 — CURRENT ACCOUNT SURPLUS/DEFICIT VS. U.S. DOLLAR, 1973 TO 2004
The current account deficit’simpact on the U.S. dollar
In many traders’ minds, the growing U.S. account deficit is tied to the U.S. dollar’s long-term slide.
Find out how the dollar has behaved surrounding quarterly current account releases since 1994.
BY DAVID BUKEY
CURRENCY TRADER • February 2005 33
rising and dropping current accountdeficits as well as its behavior follow-ing larger- and smaller-than-expecteddeficit numbers.
The study used both the FederalReserve’s nominal U.S. dollar majorcurrencies index as a proxy for thedollar and the New York Board ofTrade’s (NYBOT) U.S. dollar indexcontinuous futures contract (DX).While the indices’ price moves aren’tidentical because they use differentweighting schemes, our comparisonshows only minor differencesbetween them.
Overall, the U.S. dollar tended torise from the beginning of the quarterto the announcement, which theBureau of Economic Analysis (BEA)releases roughly two weeks before thequarter’s end, and then fall in the fol-lowing month. Surprisingly, the dollardropped more after news of shrinkingdeficits than growing ones. However,the dollar initially gained ground aftersmaller-than-expected deficits com-pared to hefty losses following larger-than-expected deficit figures.
The big picture:1973 to 2004Figure 1 compares the annualcurrent account surplus ordeficit (in billions, left scale) tothe Federal Reserve’s nominalU.S. dollar major currenciesindex (right scale) from 1973 to2004. The current account bal-ance was tiny between 1973 and1982, ranging from an $18.1 bil-lion surplus to a -$14.3 billiondeficit. In 1983, however, thedeficit began to increase, reach-ing -$160.7 billion by 1987.
Over the next four years, thecurrent account deficit shrankand even posted a slight surplusin 1991, but it has grown dra-matically larger over the past 13years.
The dollar’s sharpest rallycontinued on p. 34
What is the Current Account Balance?
The quarterly U.S. International Transactions report is the ultimatemeasure of how much the U.S. is now in debt to foreign countries.The release tracks trade in goods and services, foreign investment
income and payments, foreign aid, private and government-owned foreignassets (equities, bonds, currencies held as reserves, etc.), and the invest-ments other countries hold in U.S. dollars or securities.
The report’s three main sections include the current, capital, and finan-cial account balances. Traders focus on the current account because ittracks the gaping trade deficit, or the difference between the value ofgoods and services the U.S. imports (including income payments to foreigninvestors) and the value of exports (including dividends and interestreceived from investments abroad). The current account also shows foreignaid.
The capital account is relatively small and lists fairly rare transactions,such the assets of recent expatriates. The financial account breaks down allU.S.-owned securities and currencies as well as foreign-owned assets.
The Bureau of Economic Analysis (BEA) releases this data for the priorquarter at 8:30 a.m. (ET) roughly two weeks before the current quarter’send. The report tracks changes on a quarterly basis.
Although the report is quite extensive, its quarterly release means thatmuch of its relevant data comes from previously released reports such asthe BEA’s monthly International Trade in Goods and Services announcement.
The BEA collects investment data from the U.S. Treasury and both pub-licly traded and private companies; travel information typically comes fromsurveys filled out by people traveling abroad.
Source: Bernard Baumohl’s The Secrets of Economic Indicators: Hidden Clues to FutureEconomic Trends and Investment Opportunities (2005, Wharton School Publishing).
Average U.S. dollar performance surrounding quarterly currentaccout announcements (Q2 1994 to Q3 2004)
Aver
age
gain
/loss
(%)
Start of quarter to day Day before announcement Full quarterbefore announcement to quarter’s end
(between 7 and 17 days, or12 days, on average)
Source: Bureau of Economic Analysis (BEA), Federal Reserve
0.40
0.20
0.00
-0.20
-0.40
-0.60
-0.80
Federal Reserve nominal U.S.dollar major currencies Index
NYBOT U.S. dollar continuousfutures contract (DX)
This figure compares the average performances of the Fed's nominal U.S. dollar majorcurrencies index to the NYBOT's U.S. dollar index futures contract around the currentaccount's quarterly release. Both indices headed higher prior to this announcementbefore dropping at least 0.46 percent, on average, from its release to the quarter's end(roughly 12 days).
FIGURE 2 — QUARTERLY ANNOUNCEMENTS AND THE U.S. DOLLAR, 1994 TO 2004
34 February 2005 • CURRENCY TRADER
(35.9 percent from 1980 to 1984)occurred while the current accountdeficit went from being mostly
insignificant to ballooning to nearly -$100 million. The dollar’s largest sell-off (-38.92 percent from 1985 to 1987)
erased those gains as the deficit con-tinued to grow.
Many economists view today’ssurging account deficit as one of theprincipal factors behind the dollar’s29.4 percent slide over the past threeyears, which seems to parallel its steepdrop in the late 80s. However, the dol-lar’s 28.5 percent climb from 1995 to2001 is an important exception to thisrule, because the current accountdeficit tripled from -$109.5 billion to-$385.7 billion during this period.
Quarterly reports:1994 to 2004The analysis of quarterly currentaccount reports spanned 43 quartersfrom the first quarter of 1994 to thethird quarter of 2004. The currentaccount carried a deficit throughoutthis entire period, increasing from theprevious quarter 30 times, shrinking12 times and remaining the same once.
Figure 2 compares the average per-formances of the Fed’s U.S. dollarindex to the U.S. dollar index futures
CURRENCY CHARACTERISTICS continued
This table shows average and median returns for 11 periods surrounding quarterly current account announcements. "Day -1"and "Day 1" represent the prior day and announcement day, respectively; "Day -20 to -1" shows the dollar's performance fromtwenty days before the announcement to the prior day, and "Day -1 to 20" shows its reaction from the prior day to twentydays following it. The final three categories list each report type: growing deficits, shrinking deficits, and same as prior month.
TABLE 2 — CURRENT ACCOUNT REPORT BREAKDOWN
Close Day -20 Day -15 Day -10 Day -5 Day -1 Day 1 Day -1 Day -1 Day -1 Day -1 Day -1 location to -1 to -1 to -1 to -1 to 5 to 10 to 15 to 20 to 40
Sources: Bureau of Economic Analysis (BEA), Federal Reserve, New York Board of Trade (NYBOT)
Overall, the Fed's nominal U.S. dollar major currencies index moved in line withthe NYBOT's U.S. dollar index futures contract. While this table's comparison ofaverage and median values shows that these announcements don't affect quar-terly performance as much as Figure 2 suggests, the dollar's sell-off fromannouncement day to the quarter's end is fairly reliable.
TABLE 1 — QUARTERLY STATISTICS, 1994 TO 2004
Quarter's Day before release Full begin to day to quarter's end Quarter
before (between 7 and 17 days,release or 12 days, on average)
Federal Reserve nominal U.S. Dollar Major Currencies Index
Sources: Bureau of Economic Analysis (BEA), Federal Reserve,New York Board of Trade (NYBOT)
CURRENCY TRADER • February 2005 35
contract during three time intervals:from the quarter’s start to the daybefore each announcement, from theday before each announcement to thequarter’s end, and the full quarter (51,12, and 63 days, on average, respec-tively).
Although the U.S. dollar indexfutures contract was more volatilethan the Fed index (i.e., rising higherbefore the report and dropping moreafter it), both indices followed a clearpattern, climbing an average of at least0.23 percent before reports and drop-ping at least 0.46 percent fromannouncement day to the quarter’send.
Figure 2 also shows that the dollar’ssell-off following current accountreleases seems to have had a dramaticeffect on average quarterly perform-ance. While both indices posted solidaverage gains before these announce-ments, the dollar’s slide in the subse-quent 12 days led to an average quar-terly loss of at least 0.23 percent.
Table 1 compares both indices’ aver-age and median values for each of thethree periods shown in Figure 2. Thetable also shows the percentage of pos-itive moves for each period (Pct. > 0),as well as the indices’ quarterly bench-marks, which are the average 60-dayprice moves over the past 10 years.
Both the Fed index’s and U.S. dollarindex futures contract’s average and
median moves are out of sync — theaverage moves are negative while themedian moves are positive — for thefull-quarter period, which suggests thedollar’s average move has beenskewed lower by a few large losses.(For a more detailed explanation ofthese statistics, see “Average andmedian.”) The specific pre- and post-announcement periods show consis-tent positive and negative returns,respectively (albeit of different magni-tudes).
Short-term price movesThe study also analyzed the U.S. dollarindex futures contract’s price moves inthe 20 days before and 40 days after allcurrent account reports to see if short-
er-term patterns existed.The analysis measured the gain or
loss from the close 20, 15, 10, and fivedays before each announcement to theclose on the day prior to its release, aswell as the gain or loss from the closeof the day prior to each report to theclose five, 10, 15, 20, and 40 days afterthem. Figure 3 shows the results for all43 current account reports from June21, 1994 to Dec. 16, 2004 and comparesthem to the average same-length pricemoves during this period. For exam-ple, “Day -5 to -1” represents the dol-lar’s average gain or loss from the fifthday before reports to the day beforethem; “Day -1 to 5” is the performancefrom the day before reports to the fifth
Average and median
The mean (or average) of a set of values is the sum of the valuesdivided by the number of values in the set. If a set consists of 10numbers, add them and divide by 10 to get the mean.
A statistical weakness of the mean is that it can be distorted by excep-tionally large or small values. For example, the mean of 1, 2, 3, 4, 5, 6, 7,and 200 is 28.5 (228/8). Take away 200, and the mean of the remainingseven numbers is 4, which is much more representative of the numbers inthis set than 28.5.
The median can help gauge how representative a mean really is. Themedian of a data set is its middle value (when the set has an odd numberof elements) or the mean of the middle two elements (when the set has aneven number of elements). The median is less susceptible than the mean todistortion from extreme, non-representative values. The median of 1, 2, 3,4, 5, 6, 7, and 200 is 4.5 ((4+5)/2), which is much more in line with themajority of numbers in the set.
Average NYBOT U.S. dollar index futures performance surrounding current account releases vs. benchmark(Q2 1994 to Q3 2004)
Aver
age
gain
/loss
(%)
Day -20 Day -15 Day -10 Day -5 Day -1 Day 1 Day -1 Day -1 Day -1 Day -1 Day -1to -1 to -1 to -1 to -1 to 5 to 10 to 15 to 20 to 40
Period before and after announcement (Day 1)
Source: Bureau of Economic Analysis (BEA), New York Board of Trade (NYBOT)
0.00
-0.25
-0.50
-0.75
Period before and after current account release
10-year benchmark
The U.S. dollar dropped both before and after quarterly current account releases, but it sold off more dramatically in themonth following them.
FIGURE 3 — AVERAGE NYBOT U.S. DOLLAR INDEX PRICE MOVES: ALL QUARTERLY REPORTS
continued on p. 36
36 February 2005 • CURRENCY TRADER
day after them, and so on. “Day -1”and “Day 1” show the moves on theday before announcements andannouncement day, respectively.
Overall, the U.S. dollar was flat orposted small average losses before cur-rent account releases, but then sankconsistently in the following month —a pattern that reinforces Table 1’s sta-tistics. The dollar traded sideways inthe 20- and 15-day periods precedingannouncement days, and then fell an
average of 0.37 percent in the 10-dayperiod before reports. The dollar paredits losses in the final pre-announce-ment week before sliding 0.07 percentthe day before reports.
The dollar declined an average 0.13percent on announcement day andcontinued to drop in subsequentweeks, culminating in a 0.70-percentloss by day 20. By day 40, it recoveredroughly half these losses.
Current account changesTable 2 compares the U.S. dollar indexfutures contract’s average gains andlosses shown in Figure 3 to its medianvalues, and breaks down currentaccount deficit reports by whether thedeficit increased, declined, orremained the same from the priorquarter. Each period’s benchmarkmove and percentage of gains are alsoshown for each category.
The first column shows where thedollar index futures closed onannouncement day relative to itsdaily range. For example, if thedollar closed at the midpointbetween its intraday high andlow, the “Close location” is 50; ifit closed at its low, the value is 0,and so on.
The table’s overall median andaverage moves are relatively con-sistent, which confirms Figure 3’spatterns. Nine of the 11 periodsalso have a better chance of lossesthan gains, including a 65-percentprobability of losses onannouncement day.
The dollar seemed to anticipateshrinking deficits by rising 0.12and 0.36 percent in the fourth andthird weeks before currentaccount releases, but these gainsturned to losses as the releasedate approached.
Figure 3 also reveals a surpris-
CURRENCY CHARACTERISTICS continued
Average NYBOT U.S. dollar index performance after current account announcement(larger- vs. smaller-than-expected deficits vs. overall), March 2000 to December 2004
Aver
age
gain
/loss
(%)
Day 1 Day -1 to 5 Day -1 to 10 Day -1 to 15 Day -1 to 20 Day -1 to 40Periods after announcement (Day 1)
Source: Bureau of Economic Analysis (BEA), New York Board of Trade (NYBOT), and Briefing.com
0.75
0.25
-0.25
-0.75
-1.25
-1.75
Overall (20 instances)
Larger-than-expected current account deficit (12 instances)
Smaller-than-expected current account deficit (8 instances)
The U.S. dollar index's only average gains appeared in the week after smaller-than-expected quarterly current account deficits. The dollar sank following larger-than-expected deficits, culminating in an average 1.60 drop by the 20th day.
FIGURE 5 — SURPRISE REPORTS — MARCH 2000 TO DECEMBER 2004
Average NYBOT U.S. dollar index futures performance surrounding quarterly current account releases
(deficit increases vs. decreases vs. overall), 1994 to 2004
Aver
age
gain
/loss
(%)
Day -20 Day -15 Day -10 Day -5 Day -1 Day 1 Day -1 Day -1 Day -1 Day -1 Day -1to -1 to -1 to -1 to -1 to 5 to 10 to 15 to 20 to 40
Period before and after announcement (Day 1)
Source: Bureau of Economic Analysis (BEA), New York Board of Trade (NYBOT)
0.600.400.200.00
-0.20-0.40-0.60-0.80-1.00
Overall
Deficit increases
Deficit decreases
This figure shows average U.S. dollar moves surrounding all current account reports and compares them to deficit increas-es and declines. The dollar's performance is mixed prior to these releases, but it tends to drop further after news of shrink-ing deficits than following growing ones.
FIGURE 4 — CURRENT ACCOUNT DEFICIT CHANGES
ing twist: The dollar posted its steepestaverage drop (0.30 percent) upon newsof smaller deficits, and it continued todecline over the following 15 days.Figure 4 shows the average perform-ance of the table’s three main cate-gories (overall, deficit increases, anddecreases) and confirms that the dollarinitially dropped further after news ofshrinking deficits than growing ones.However, these price moves are basedon a relatively small sample size (12).
Catching economists off-guard: 2000 to 2004To find out whether the dollar indexfutures contract performed differentlywhen the current account numbermissed analyst expectations, we com-pared actual quarterly current accountdeficits to economists’ forecasts com-plied by Briefing.com over the pastfive years.
Of the 20 times the BEA releasedquarterly current account reports sinceMarch 15, 2000, the deficit was larger
than expected 12 times and smallerthan expected eight times. Figure 5shows the dollar welcomed smaller-than-expected deficits and rose in thefirst five days following them. In con-trast, it declined 0.67 percent by thefifth day following larger-than-expect-ed deficits.
Although the dollar fell over thenext six weeks, its losses were milderafter smaller-than-expected deficits. Itslipped just 0.28 percent by the 40thday after smaller-than-expecteddeficits, but it dropped 1.19 percentfurther following surprisingly largeones.
ConclusionGiven the anxiety surrounding the bal-looning current account deficit, thedollar’s drop in the weeks (andmonths) after its quarterly releasemakes sense, yet its steep decline fol-lowing shrinking deficits seems coun-terintuitive. However, the dollarbehaved as expected and lost much
more ground when reports disap-pointed economists.
These historical patterns are certain-ly compelling, but current market con-ditions, including the dollar’s tenden-cy to trend over long periods, shouldalways take precedence when makingtrading decisions. �
Related reading“The dollar and the deficit,”Currency Trader, November 2004,p. 22.An overview of how the currentaccount and trade deficits affectthe U.S. dollar.
“Elections and the U.S. dollar,”Currency Trader, November 2004,p. 34.An analysis of how the U.S. dollarfared surrounding U.S. electionssince 1973.
For more information call 1.877.212.1112.*$9.95 per 100 thousand dollar increment, fee scales up and down based on trade size.
Utilizes the trading technology of MBTX. MBTX is a smart order route that intelligently scans themarket for liquidity routes for the best available price for each order. Forex trading involves risk andis not suitable for all investors. Investors should only engage in trading forex after considering their
financial situation, trading experience, and tolerance for loss of trading capital.
• *9.95 Flat ticket fee• No fixed spreads • True bids and offers from multiple banks• No deal desk between you and your execution• Stop limit orders for entry and exit• Trailing stops• Conditional orders• Coming in March!
T rue range (TR) is a measure of pricemovement that accounts for the gapsthat occur between price bars. The truerange calculation was developed by
Welles Wilder and discussed in his book New Conceptsin Technical Trading Systems (Trend Research, 1978).
CalculationTrue range can be calculated on any time frame or pricebar — five-minute, hourly, daily, weekly, etc. The fol-lowing discussion uses daily price bars for simplicity.
True range is the greatest (absolute) distance of thefollowing:
1. Today’s high and today’s low.2. Today’s high and yesterday’s close.3. Today’s low and yesterday’s close.
Average true range (ATR) is simply a moving aver-age of the true range over a certain time period. Forexample, the five-day ATR would be the average of thetrue range calculations over the last five days.
Key points True range is a simple volatility calculation — it reflectsthe degree of price movement over a given period bymeasuring the total price change from one price bar tothe next. The higher the TR or ATR value, the greaterthe price movement.
Figure 1 shows how standard range and true rangecompare over a six-day period. Notice that the standard(high minus low) range of each of the first three price barsis five points and, accordingly, the average range for thesethree days is five points, suggesting the price volatility overthis period is neither increasing nor decreasing.
However, the true range calculation for the second day is8 points, because it factors in the gap between the first andsecond bars, calculating the range as the distance betweenthe close of bar 1 and the high of bar 2. Similar discrepan-cies occur between the standard range and true range cal-culations for the subsequent days. This relationship is fur-ther reflected in the average standard range and averagetrue range figures for days four through seven.
The difference is obvious: The standard range calculation
only tells you about the price movement for each individualbar. The true range numbers accurately reflect the pricemovement you would have experienced had you been inthis market from one day to the next.
Figure 2 shows a daily bar chart with the 30-day ATR plot-ted below the price. As the market continued to trade side-ways through an extended trading range, the ATR steadilydropped, reflecting the declining volatility. When the curren-cy pair embarked on an uptrend, the ATR moved back up.
Figure 3 is a weekly chart with 12-week ATR. Notice thedramatic increase in ATR/volatility in the GBP/USD thatbegan at the beginning of 2004 — on the heels of a verysmooth uptrend from September to December 2003, duringwhich the ATR actually declined.
INDICATOR BASICS
The true range calculation shows much price has actuallymoved over a multi-bar period by incorporating the gaps thatoccur between bars. By comparison, the standard range calcu-lation (high minus low) only tells about the price movementthat occurred for an individual price bar.
FIGURE 1 — TRUE RANGE
True range
1 2 3 4 5 6 7
70
65
60
55
50
45
40
Day1234567
High50576058565348
Low45526554545143
Close49556358555348
Range5554225
True range
8109445
3-day averagerange
5.004.673.672.673.00
3-day averagetrue range
9.007.675.676.00
True range
BY CURRENCY TRADER STAFF
True range provides a more accurate reflection of the size of a price move over a given period than
the standard range calculation, which is simply the high of a price bar minus the low of a price bar.
CURRENCY TRADER • February 2005 41
Interpretation and usesBy increasing or decreasing the num-ber of days in the average, you can usethe ATR to monitor volatility onlonger- or shorter-term time frames.For example, a five-day ATR wouldreflect the recent, short-term volatility,while a 50-day ATR would reflectintermediate- to longer-term volatility.
Because it represents the level ofprice movement in a market, truerange can alert you to the trend ofvolatility (whether it is increasing ordecreasing) as well as to when marketsare at volatility extremes and might belikely to make significant moves orenter stagnant periods.
Comparing shorter-term ATR tolonger-term ATR is one way to do this.For example, a 100-bar ATR providesan indication of a market’s longer-termvolatility; a 10-bar ATR gives an indi-cation of the short-term volatility.When the short-term ATR becomesvery low or high relative to the longer-term ATR, it can suggest a volatilityextreme.
For instance, you could test if anynoticeable price patterns occur whenthe short-term ATR falls below a cer-tain percentage (say, 50 percent) of thelonger-term ATR. This is simply a wayof quantifying the market conditionsthat exist when a market enters a verynarrow consolidation and the resultingbreakouts that can result.
Figure 4 shows a 15-minute chartwith a line below it that represents thefive-bar ATR divided by the 100-barATR. Notice the two lowest ATR ratiovalues corresponded with very tightconsolidations, both of which were fol-lowed by strong price moves.Naturally, these examples were chosento demonstrate a point, but the rela-tionships they represent can be quanti-fied, researched and tested.
True range also can be used to esti-mate the placement of stop orders orexits. For example, if the five-day ATR is 10 points and yourtypical trade lasts five days, a stop-loss order that is onlyone point away runs a high risk of being hit since it fallswell within the natural level of fluctuation the market hasrecently exhibited.
Similarly, in a strongly trending market, you might set alarger profit target — say, two or three times the ATR — totake advantage of the directional market conditions.However, in a market that is not trending, a smaller profit
continued on p. 42
Euro/U.S. dollar (EUR/USD), daily
May June July Aug. Sept. Oct. Nov. Dec. 2005
Consolidation
Trend
ATR rises as trend progresses
ATR declines as market consolidation continues
Average True Range (30-bar)
1.36
1.34
1.32
1.30
1.28
1.26
1.24
1.22
1.20
0.0130
0.0115
0.0100
Average true range (ATR) is a commonly used market volatility measure. As themarket stagnates in a consolidation, the 30-day ATR declines; when pricebreaks out of the consolidation and embarks on an uptrend, the ATR climbs —a reflection of the increased price volatility.
FIGURE 2 — AVERAGE TRUE RANGE
Source: TradeStation
British pound/U.S. dollar (GBP/USD), weekly
Oct. 2003 Apr. July Oct. 2004 Apr. July Oct. 2005
Average True Range (12-week)
1.95
1.90
1.85
1.80
1.75
1.70
1.65
1.60
1.55
0.05
0.04
0.03
The 12-week ATR calculation surged in early 2004 as volatility increased and along-term uptrend came to a close.
FIGURE 3 — WEEKLY AVERAGE TRUE RANGE
Source: TradeStation
target — say, 1 to 1.5 times the ATR —might be more appropriate, given thatthe market is not indicating it will fol-low through in any particular direc-tion. (For an example of this kind ofapproach, see “Doubly adaptive prof-it targets,” Active Trader, December2000, p. 78.)
Bottom lineTrue range more accurately reflectsprice movement than the standardrange calculation because it includesgaps that may occur between pricebars. True range and average truerange are volatility calculations thatcan be used in a variety of trading sit-uations — to measure the level ofvolatility in a market and determinewhere to place stops and price targets.The shorter the ATR calculation, theshorter-term the volatility it reflects;the longer the calculation, the longer-term the volatility it tracks. �
Dividing the five-bar ATR by the 100-bar ATR creates a ratio that shows whenthe short-term volatility is high or low relative to the long-term volatility. The twotimes the ratio dropped below .30 (which means the five-bar ATR was less than30 percent of the 100-bar ATR) preceded price thrusts.
FIGURE 4 — AVERAGE TRUE RANGE RATIO
Source: TradeStation
Search for articles by • Subject • Author • Article Name • Issue
Pay by credit card and download direct to your computer — no waiting!
$4.95Shopping made easy!
and less
Purchase past Active Trader articles!Purchase and download back articles
directly from the Active Trader Web site.
Check out "Article Download of the Week" feature for special discounts on select articles.
� A computer error caused Canada to re-releaseits trade surplus numbers for November, as the originaltotal of more than $7 billion (Canadian) was wrong. The realfigure was $5.4 billion (Canadian), an increase of only $200million from October. The U.S. has said it may need to re-release GDP estimates because of Canada’s error.
� The Bank of Canada’s Monetary Policy Report Updateindicated the Canadian economy is expected to operate a lit-tle further below its full production capacity in 2005 than wasanticipated when the last report was issued in October. Thisexpectation largely reflects the effects of the Canadian dollarrising in value. Growth is projected to gain just more thanthree percent in 2006, assuming the economy will return toproduction capacity in the second half of 2005 and core infla-tion can again be contained to two percent by the end of 2006.
� Brazil’s jobless rate rose 0.1 percent to 10.6 percent inNovember compared to the previous month, but remainedunchanged from the same month in 2003.
� Restrained spending and increased tax revenue allowedBrazil to meet a budget target set by the InternationalMonetary Fund. The budget surplus was 81.11 billion reais(more than $30 billion), easily besting the 71.5 billion reais tar-get set by the IMF as part of a $40 billion loan given the com-pany.
� Mexico’s foreign currency credit rating was raised byS&P in late January, a move that sent prices on the IPC stockmarket to all-time highs and helped the peso gain value. It isthe second credit-rating boost by a rating agency this year.
� Mexico’s annual GDP in 2004 grew 4.2 percent, accordingto preliminary estimates.
� The United Kingdom’s economy grew 3 per-cent compared to the same quarter a year earlier and 0.4 per-cent compared to Q2, primarily spurred by retail and whole-sale increases.
� The United Kingdom’s unemployment rate of 4.7 percentfrom September through November didn’t change comparedto the previous three-month period, but it dropped 0.2 per-cent when compared to the same three-month period in 2003.
� France’s jobless rate remained stable at 9.9 percent inNovember compared to year-to-year and previous monthpercentages.
� Unemployment in Germany rose 0.5 percent from theprevious month to 10.8 percent and 0.4 percent compared toDecember 2003. However, according to a press release fromGermany’s Federal Statistical Office, “The service sector as awhole (trade, hotel and restaurant services, transport andother services) recorded job gains in 2004, which more thanoffset the job losses in other industries."
EUROPE
� India’s Q2 GDP (not seasonally adjusted) rose4.5 percent compared to Q2 2003 and 1.4 percent comparedto the previous quarter.
� Australia’s jobless rate dropped 0.1 percent to 5.1 percentcompared to November and 0.7 percent compared toDecember 2003.
� Unemployment in Hong Kong fell 0.2 percent to 6.5 percent— a 35-month low — compared to the previous month anddropped 0.9 percent from the same month in 2003, according topreliminary data. "The overall atmosphere of the labor marketcontinued to improve, as evidenced by the high level of vacan-cy and job placement figures recorded by the LaborDepartment," said a government spokesman in a press release."New initiatives to speed up the urban renewal process andimprove the maintenance and management of old buildings willcreate employment opportunities for the construction, propertymanagement and related industries in the next few years."
� Japan’s jobless rate fell 0.2 percent to 4.5 percent com-pared to October and decreased 0.4 percent compared toNovember 2003.
� With the Group of Seven meeting looming in earlyFebruary, China announced in late January it was in no hurryto change its foreign currency policy, where the yuan ispegged to the U.S. dollar (the currency of most other countriesis floating, meaning it changes based on fluctuations in theeconomy). Chinese officials said currency reform is inevitable,but the country is going to do things at its own pace.
ASIA & THE SOUTH PACIFIC
* All GDP is real, at current prices and seasonally adjusted unless other-wise stated.
* GDP is expressed as a growth/loss percentage and not as an exact rate.
* Unemployment rates refer to Q3 2004 or December 2004 numbers, unlessotherwise stated.
AMERICAS
� The World Bank is considering charging fees for coun-tries seeking its advice as the need for developing coun-tries to take out loans with the Bank is dwindling, saidPeter Woicke, who is retiring as executive vice president ofthe bank’s International Finance Corp. Woicke said theBank will need to find alternative means of revenue assmaller, middle-income countries in Asia and EasternEurope are becoming increasingly wealthy.
• • • • • •GOING GLOBAL• • • • • •
44 February 2005 • CURRENCY TRADER
CURRENCY SYSTEM ANALYSIS
Australian dollar/U.S. dollar(AUD/USD), daily
Sell
Sell
Sell
Buy BuyBuy
5-day SMA of highs
5-day SMA of lows
28-day EMA of closes
September 2004 October 2004 November 2004 December 2004
This trend-following system didn’t perform very well when the AUD/USD lackeda clear trend in early September 2004, but it caught most of the currency pair’ssubsequent up move from October to December.
This equity curve shows the system is profitable, but also quite volatile.
FIGURE 2 — EQUITY CURVE
Moving average trend-following system
Source for all figures: Wealth-Lab Inc. (www.wealth-lab.com)
System concept: This trend-follow-ing breakout system attempts to con-firm market conditions and then tradesin the direction of the trend.
The system defines the current trendby determining if the 5-day simplemoving average (SMA) of intradayhighs is above the 28-day exponentialmoving average (EMA) of closingprices (uptrend), or if the 5-day SMA ofintraday lows is below the 28-day EMAof the closes (downtrend). Using highand low prices (instead of closingprices) to calculate the SMA helps thesystem to react to trend changes quick-er.
Figure 1 shows several of the sys-tem’s sample trades in the AUD/USDcurrency pair, and demonstrates that itssignals produce more profitable tradesduring longer-term trends, such as thepair’s rise from late September to lateNovember 2004, than in consolidatingmarkets.
Rules:Enter long and exit short on the nextday’s open if the trend is bullish, whichmeans the 5-day SMA of highs crossesabove the 28-day EMA of closing prices,the latest close is above the 5-day SMAof highs, and the 5-day moving aver-age’s current value is also higher thanits value the prior day. Enter short and exit long on the nextday’s open if the trend is bearish, whichmeans the 5-day SMA of lows crossesbelow the 28-day EMA of closingprices, the latest close is below the 5-day SMA of lows, and the 5-day SMAmoving average’s current value is alsobelow the previous day’s value.Exit any trade if there is a trend changeor if a position loses 20 percent.
Money Management: Risk 2 per-cent of total capital for every trade.
Starting equity: $1,000,000. Deduct4 pips (0.0004) round-turn commissionfor every 100,000 units traded in thebase currency and 1 pip (0.0001) slip-page per 100,000 units when enteringand closing a position.
Test data: The system was tested ondaily FX data in the following currency
pairs: Australian dollar/U.S. dollar(AUD/USD), Euro/U.S. dollar(EUR/USD), British pound /U.S. dollar(GBP/USD), U.S. dollar/Swiss franc(USD/CHF), U.S. dollar/Japanese yen(USD/JPY), and U.S. dollar/Brazilianreal (USD/BRL).
Note: Currency pairs for which theU.S. dollar is the base currency (e.g.,USD/JPY) were inverted (e.g., JPY/USD)to enable portfolio testing in terms of dol-lars. Data source: Comstock/FXtrek(www.fxtrek.com).
Test period: December 1994 to Dec-ember 2004 (except the Brazilian real,which spanned December 1999 toDecember 2004).
Test results: Figure 2’s equity curveshows the system’s volatile nature, andFigure 3’s drawdown curve, which fea-tured a 40-percent drawdown inNovember 2004, confirms this trait.
The system’s drawback, as with mosttrend-following systems based on mov-ing averages, is that it’s only effectiveduring long-term trends. The system lostground in sideways markets. Trend-fol-lowing systems tend to create manysmall losing trades, and require largewinners to offset these. Figure 4’s
STRATEGY SUMMARY
Profitabilty Trade statisticsNet profit ($): 2,928,280.85 No. trades: 396Net profit (%): 292.83 Win/loss (%): 38.89Exposure (%): 9.51 Avg. gain/loss ($): 0.55Profit factor: 1.35 Avg. hold time (days): 32.37Payoff ratio: 2.48 Avg. winner (%): 3.89Recovery factor: 1.41 Avg. hold time (winners): 56.52Drawdown Avg. loser (%): -1.57Max. DD (%): -39.73 Avg. hold time (losers): 17Longest flat days: 484 Avg. consec. win/loss: 9/19
The system experienced several large drawdowns over the past three years, anddidn’t recover from its 40-percent drawdown in the test period’s final month.
FIGURE 3 — DRAWDOWN CURVE
continued on p. 46
LEGEND: Net profit — Profit at end of test period, less commission • Exposure —The area of the equity curve exposed to long or short positions, as opposed to cash •Profit factor — Gross profit divided by gross loss • Payoff ratio — Average prof-it of winning trades divided by average loss of losing trades • Recovery factor —Net profit divided by max. drawdown • Max. DD (%) — Largest percentagedecline in equity • Longest flat days — Longest period, in days, the system isbetween two equity highs • No. trades — Number of trades generated by the sys-tem • Win/loss (%) — the percentage of trades that were profitable • Avg. trade— The average profit/loss for all trades • Avg. winner — The average profit forwinning trades • Avg. loser — The average loss for losing trades • Avg. holdtime — The average holding period for all trades •Avg. hold time (winners) —The average holding time for winning trades • Avg. hold time (losers) — Theaverage holding time for losing trades • Avg. consec. win/loss — The maximumnumber of consecutive winning and losing trades
Currency System Analysis strategies are tested on a portfolio basis(unless otherwise noted) using Wealth-Lab Inc.’s testing platform.
If you have a system you’d like to see tested, please send the trading and money-management rules to [email protected].
Disclaimer: Currency System Analysis is intended for educational purposes onlyto provide a perspective on different market concepts. It is not meant to recom-mend or promote any trading system or approach. Traders are advised to do theirown research and testing to determine the validity of a trading idea. Past perform-ance does not guarantee future results; historical testing may not reflect a sys-tem’s behavior in real-time trading.
LEGEND: Avg. return — The average percentage for the period • Sharpe ratio —Average return divided by standard deviation of returns (annualized) • Best return— Best return for the period • Worst return — Worst return for the period •Percentage profitable periods — The percentage of periods that were profitable •Max. consec. profitable — The largest number of consecutive profitable periods •Max. consec. unprofitable — The largest number of consecutive unprofitable periods
PERIODIC RETURNS
% Max. Max. Avg. Sharpe Best Worst profitable consec. consec.
Maximum Favorable Excursion (MFE)chart shows that many losing tradesbegan as winners, which indicates that it’sa good idea to add a stop to lock in prof-its at a certain point. However, stops mustbe loose enough to allow big winningtrades to develop.
Figure 5 shows the system’s profit dis-tribution and confirms that more thanhalf of all trades (210 of 396) were verysmall losses.
The original 20-percent stop was practi-cally worthless since none of six testedpairs reached that point during the testperiod. We applied a few random stop-loss percentages as well as several profit-taking stops after the initial results werecalculated, but every change diminishedprofits and failed to reduce the draw-down.
Table 1 shows the results of the portfo-lio test as well as retests of each of the sixindividual currency pairs (under the sameconditions) to see which approach wasmore efficient. Single currency pairs hadmuch lower drawdowns than the originaltest, but their annual profits were muchsmaller. The original portfolio approach was able to smoothout losses, which is what we wanted it to do.
Bottom line: This system was profitable, but its largedrawdowns make it hard to recommend to traders whowant to avoid volatility. Experimenting with tighter stop-loss rules or using profit-taking stops may improve this sys-tem’s performance.
Overall, basing trades on moving average crossovers pro-
vides good entry points, but it’s sheer luck whether themarket will continue to trend after this breakout, andwhether that trend will be profitable enough to overcomeall the system’s small losses.
Idea submitted by Antonio Martinez from Karlsruhe, Germany.
TABLE 1 — PORTFOLIO VS. INDIVIDUAL CURRENCY PAIRS
CURRENCY SYSTEM ANALYSIS continued
––Michael Schneider of Wealth-Lab
This table compares the system’s annual performance and maximum drawdown to a retest of the six individual currency pairs. Overall, the portfolio had larger profits, but also had higher drawdowns than each currency pair.
Portfolio System USD/JPY GBP/USD EUR/USD USD/CHF USD/BRL AUD/USD
Period % % Max % % Max % % Max % % Max % % Max % % Max % n % Max Starting Return DD Return DD Return DD Return DD Return DD Return DD Retur DD
Share Currency Trader with a friend Every month Currency Trader delivers an in-depth look at the forex market, complete with currency strategies,industry news, roundup of the global numbers, system analysis and much more.
You can share the wealth by sharing Currency Trader with a friend!
Follow the four simple steps below to invite your friends and colleagues to download a free copy of Currency Trader magazine.
1. Go to www.currencytradermag.com/refer.htm.
2. In the form that appears, enter the name and e-mail address of each person with whom you’d like to share Currency Trader.
3. Add a personal message if you’d like.
4. Click Submit. We’ll send an email with your greeting and simple instructions about how to download a free copy of Currency Trader.
Visit www.currencytradermag.com for more information.
Linear regression line Linear regression is a way to calculate astraight line that most accuratelyreflects the slope, or trend, of pricesover a given time period. Because it ismathematically derived, a regressionline, or “best-fit” line, is not based onsubjective visual analysis, as are stan-dard trendlines.
Figure 1 shows a group of five clos-ing prices on a price chart. A straightline that goes through the “middle” ofthose five prices — a line for which thedifference between it and each of thezigzagging prices is as small as possible— is a regression line.
Calculation: A regression line is cal-culated using the “least squares”method, which refers to finding theminimum squared (x*x, or x2) differences between pricepoints and a straight line. For example, if two closing pricesare 2 and 3 points away (the distance being calculated verti-cally) from a straight line, the squared differences betweenthe points and the line are 4 and 9, respectively.
Why are the squared differences used, instead of just thedifferences? Figure 1 shows that some differences are nega-tive (for points below the line) and others are positive (forpoints above the line). Squaring the differences creates allpositive values and makes it possible to calculate a formulafor the straight line.
The best-fit line is the line for which the sum of thesquared differences between each price and the straight lineare minimized.
The formula for a straight line (y) is:y = b + m*xwherex = the “time” of the price (the x-axis value)b = the initial value of the line when “x” equals zero (the
“intercept” value — i.e., the point at which the line inter-cepts the vertical axis);
m = the slope of the line, which is the rate at which theline rises or falls. In other words, b is how much y changesfor a one-unit change in x (e.g., .75 points per day).
As prices change, the slope of the line also changes. Whena market is rising sharply the slope (b) has a high value andthe line will be steep. As the market slows down, the slopevalue decreases and the line will slope upward more gently.When calculating a straight line to N prices, the “best-fit”coefficients b and m can be solved for by:
N Nb = [(4N + 2)/(N2 – N)] ∑p(x) + [6/(N2 – N)]∑x*p(x)
x=1 x=1
N Nm = [12/(N3 –N)] ∑x*p(x) – [6/N2-N)]∑p(x).
x=1 x=1
wherep(x) is the price at point x. N is the number of prices used to calculate the coefficients— e.g., N = 5 for a five-day regression calculation. In thiscase, the first day p(1) in the price series is 1 and the lastprice p(N) in the series is 5.
is the sum the prices for p(1) through p(N). Forexample, if N = 5 and the prices for days 1 and 2 are10, 11, 12, 13 and 14, respectively, the sum is 60.
is the sum of the products of time (x) and price (p).For example, the products of the prices used in theprevious calculation are 10 (1*10), 22 (2*11), 36(3*12), 52 (4*13), and 70 (5*14), and the sum of those products is 190.
Figure 2 shows the calculations and chart of three five-day regression lines calculated at different points over a 10-day period: Line A covers days 1 through 5; line B repre-sents days 4 through 8; and line C is days 6 through 10. Thelinear regression estimates for the slopes (b) and interceptvalues (a) are listed in the third and fourth columns. Thevalues for each of the five points that make up regressionlines A, B and C are in the final three columns.
The slope for line A (days 1-5), which accompanies anupward trend, is 0.60. Price continued to rally higher indays 6 through 8, but at a slower rate, which resulted in aslope of .43 for line B. For line C, when price moved side-ways to lower, the slope was -0.07.
KEY CONCEPTS AND DEFINITIONS
48 February 2005 • CURRENCY TRADER
1 2 3 4 5
20
18
16
14
12
10
8
A regression or “best-fit” line is calculated to minimize the difference between pricepoints and the line. In doing so, the line approximates the slope (trend) of the prices.
FIGURE 1 — FITTING A STRAIGHT LINE TO PRICES
Price
Straight line
Differences
N∑x*p(x)x=1
N∑p(x)x=1
Definitions and formulas for some of the tools referenced in this issue of Currency Trader.
CURRENCY TRADER • February 2005 49
Standard error channel (linear regression line)
The linear regression line is astraight line that minimizes the dis-tance between itself and every datapoint in the series you are workingwith. A standard error measures thevariance from the linear regression.Subtracting the standard error fromthe linear regression line yields the bot-tom of the standard error channel, andadding it to the linear regression valuegives you the top of the channel.
The standard error channel is a par-allel concept to Bollinger bands, whichuse the standard deviation calculationto set boundaries above and below amoving average to capture varianceaway from the average. Because themoving average is a wavy line, theBollinger bands are wavy, too, and alsowiden or narrow as variability rises orfalls. The standard error does the samething, only with straight lines.
The critical difference is that youdon't need to choose a starting and ending point forBollinger bands, because they track a moving average thatconstantly discards old data and refreshes itself with newdata. To construct a useful linear regression channel, how-ever, you have to pick reasonable starting and ending
points. It's still "mathematics" and thus a better way to drawa trendline than using your eye alone, but your choice ofstarting and ending points is inherently judgmental. Mostpractitioners chose an obvious lowest low or highesthigh.�
Y=22.28+0.43*X
Price
A
BC
Y=24.02-0.07*X
Y=19.90+0.60*X
1 2 3 4 5 6 7 8 9 10
25.00
24.50
24.00
23.50
23.00
22.50
22.00
21.50
21.00
20.50
20.00
The following calculations resulted in the three different five-day regression lineson the chart below.
FIGURE 2 — REGRESSION LINES
Day Price Slope (m) Intercept (b) Line A Line B Line C1 21.25 20.502 20.50 21.103 21.00 21.704 22.50 22.30 22.715 23.25 0.60 19.90 22.90 23.146 24.20 23.57 23.957 23.25 24.00 23.898 24.66 0.43 22.28 24.44 23.829 23.00 23.76
10 24.00 -0.07 24.02 23.69
Elliott Wave basics
E lliott Wave is a descriptive form of technicalanalysis based on the concept that price actionunfolds in identifiable, structured waves thatdefine both trend and countertrend moves.
Ralph Nelson Elliott (1871-1948) introduced his ideasthrough a series of letters to Charles J. Collins, who helpElliott published The Wave Principle in 1938. Also withCollins’ aid, Elliott published a series of articles in FinancialWorld magazine in 1939.
Today, Elliott Wave theory is probably best knownthrough the work of Robert R. Prechter Jr., who in 1978 coau-thored with A.J. Frost the book, Elliott Wave Principle: Key toStock Market Profits (John Wiley & Sons, 10th edition, 2001).
Waves and fractalsElliott Wave theory contains elements of a mathematicalconcept known as a fractal, which is an object or shape that
has self-similarity on different scales.Fractals are found in a variety of phenomena. For exam-
ple, if you look at a mountain from a distance you see apeak with relatively smooth sides leading up to it. As youmove closer, you begin to see how the sides of the mountainare actually made up of smaller sub-peaks and sides, whichconsist of even smaller peaks and sides, all sharing a simi-lar basic structure or pattern.
Similarly, part of wave theory is the idea that any wavecycle is part of a larger wave cycle that adheres to the samerules, and is also composed of smaller wave cycles with thesame structure.
Many devotees of Elliott Wave consider price action to bea natural phenomena driven by human emotion, whichmakes the fractal aspect of wave patterns an effective wayto understand and describe the price movement.
BY ACTIVE TRADER STAFF
continued on p. 50
50 February 2005 • CURRENCY TRADER
KEY CONCEPTS continued
Types of waves: Impulses and correctionsBecause Elliott Wave is a descriptive, rather than quantita-tive, analytical approach, it is really a type of visual patternrecognition. Figure 1 shows the basic Elliott Wave count,which consists of two phases: The first consists of num-bered price moves, or waves, while the second contains let-tered price waves. Numbered phases are “impulse” ortrending waves; the lettered phases are called “corrective”or countertrend waves.
Impulse moves are composed of five waves (1 to 5), withwaves 1, 3 and 5 in the direction the dominant trend, andwaves 2 and 4 against the trend. A basic rule of wave iden-tification is the bottom of wave 4 cannot overlap the top ofwave 1.
Corrective moves consist of three waves, labeled a, b, andc. A five-wave impulse move followed by a three-wave cor-rective move completes one wave cycle.
Figure 2 , which shows how wave patterns are subdivid-ed into smaller-degree patterns or expanded into patterns ofa higher degree, illustrates the fractal aspect of Elliott Wave.
The following examples are described in terms of anuptrend, but the same patterns are used if the trend isdown.
Interpreting wavesThere are psychological and practical interpretations asso-ciated with the wave patterns shown in Figures 1 and 2. Forexample, Wave 1 is the first advance in a trend move andusually will be driven by short covering and professionalbuying, indicating a turn from bearishness to bullishness.
Wave 2, which corrects wave 1, is often accompanied bya high degree of pessimism. For example, if this wave countwas occurring on a weekly chart of the stock market, awave-2 bottom might coincide with dire forecasts aboutboth the economy and the stock market.
Following the wave-2 low (which must be above the
wave 1 low), a rally above the peak of wave 1 (signaling awave-3 advance) will be considered a very bullish event,most likely occurring in tandem with news that has sud-denly turned favorable. At this point, investor sentimentwill be optimistic.
Wave 4 corrects wave 3. Now, the mood of the marketwill likely remain stable. Wave 5 can be considered the lasthurrah, a peak in optimism immediately before a declinethat corrects the entire five-wave impulse advance. Thetypical target for the subsequent a-b-c corrective phase isthe wave-4 low. Sometimes wave 5 will take the form of anupward diagonal triangle.
Regarding impulse waves: Wave 3 can never be theshortest impulse wave in a valid wave pattern, but eitherwave 1 or 5 can be longer than the other.
Regarding the relationship between corrective waves 2and 4 within an impulse move: According to Elliott Wavetheory, if corrective wave 2 was long and complex, correc-tive wave 4 should be simple and swift, and vice-versa –– aconcept referred to as “alternation.”
The Fibonacci connectionFibonacci ratios (i.e., 38.2 percent, 61.8 percent, 138 percent,and so on) play an import role in Elliott Wave analysis. (See“The Fibonacci series,” for an explanation of Fibonaccinumbers.)
In Elliott analysis, one price wave should typically beable to be described in terms of a Fibonacci relationship toanother wave –– for example, the length of wave 3 might be138.2 percent of the length of wave 1, or wave 2 could bot-tom at the 61.8-percent retracement level of wave 1.�
This material was excerpted from the article, “The Elliott Wavechallenge,” from the March 2004 issue of Active Trader magazine.
The impulse (trend) move consists of waves 1 to 5. The corrective (countertrend) move consists of waves a, b, and c.
FIGURE 1 — THE BASIC WAVE COUNT This chart shows how any wave consists of subwaves withthe same structure. For example, wave 1, which is the firstupwave in an impulse wave, is made up of five smallerimpulse waves.
1v
2
3v
4
(1)5v
a
i
i
i
ii
ii
ii
iii
iv
iv
iv
iii
iii
b
c(2)
1
2
3
4
5
a
b
c
FIGURE 2 — SUBWAVES: THE “FRACTAL” NATURE OF ELLIOT WAVE
CURRENCY TRADER • February 2005 51
The Fibonacci series
T he Fibonacci series is a number progression in which each succes-sive number is the sum of the two immediately preceding it: 1, 2, 3,5, 8, 13, 21, 34, 55, and so on.
As the series progresses, the ratio of a number in the series divided by theimmediately preceding number approaches 1.618, a number that is attributedsignificance by many traders because of it appearance in natural phenome-na (the progression a shell’s spiral, for example), as well as in art and archi-tecture (including the dimensions of the Parthenon and the Great Pyramid).The inverse, .618 (.62), has a similar significance.
Some traders use fairly complex variations of Fibonacci number to gener-ate price forecasts, but a basic approach is to use ratios derived from theseries to calculate likely price targets.
For example, if a stock broke out of a trading range and rallied from 25 to55, potential retracement levels could be calculated by multiplying the dis-tance of the move (30 points) by Fibonacci ratios –– say, .382, .50 and .618–– and then subtracting the results from the high of the price move. In thiscase, retracement levels of 43.60 [55 - (30*.38)], 40 [55 - (30*.50)] and 36.40[55 - (30*.62)] would result.
Similarly, after a trading range breakout and an up move of 10 points, aFibonacci follower might project the size of the next leg up in terms of aFibonacci ratio –– e.g., 1.382 times the first move, or 13.82 points in thiscase.
The most commonly used ratios are .382, .50, .618, .786, 1.00, 1.382 and1.618. Depending on circumstances, other ratios, such as .236 and 2.618,are used.
Additional readingThe following articles have moreinformation about Fibonacci numbers:
“Technical Tool Insight: Fibonacciratios” (Active Trader, April 2002). This is a detailed primer on theproperties of Fibonacci numbers.
“Absolute price projections,” byTom DeMark and Rocke DeMark(Active Trader, July 2004). This article explores the authors’unique application of Fibonacciratios to determine potential pricetargets.
You can purchase and downloadpast Active Trader articles atwww.activetradermag.com/pur-chase_articles.htm.
Triangle patternsA triangle is a pattern in which pricetrades in an increasingly narrow range.It represents a period of market con-gestion or consolidation, and has thesame implications as trading ranges(“rectangles”), flags, and pennants.
Triangles and pennants are identicalexcept for their length: Pennants mighttypically consist of approximately fiveto 15 bars, while triangles can spandozens of bars.
The most important aspect of trian-gles is that they represent market con-traction (i.e., decreasing volatility), acondition typically followed by price thrusts or trends.
In technical analysis parlance, there are three types of tri-angles: symmetrical, ascending, and descending (see Figure1). Symmetrical triangles consist of progressively lowerhighs and higher lows, so that the upper trendline of thepattern (which represents resistance) slopes downward andthe lower trendline of the pattern (which represents sup-port) slopes upward.
An ascending triangle is characterized by a rising sup-port line that reflects progressively higher lows and a hori-zontal resistance line that reflects equivalent highs.
A descending triangle is the opposite: It consists of a fallingresistance line that reflects progressively lower highs and ahorizontal support line that reflects equivalent price lows.
OscillatorsOscillators (or “momentum oscillators”) are tools such asthe relative strength index (RSI), commodity channel index(CCI), and stochastics. They are typically used to identifyshorter-term “overbought” and “oversold” levels — pointsat which a market has presumably moved too far, too fastand is ripe for at least a correction. These indicators typical-ly compare the current price to a past price (or price range)to determine how relatively high or low the current price is.While these indicators can sometimes seem to generateremarkably well-timed signals in trading range markets,they will trigger repeated false signals in trending mar-kets.�
There are three basic types of triangle patterns: symmetrical, ascending, and descending. All triangles represent market consolidation.
Legend: IRR — initial reward/risk ratio (initial target amount/initial stop amount); LOP — largest open profit (maximum available profitduring lifetime of trade); LOL — largest open loss (maximum potential loss during life of trade).
FOREX DIARY
Statistics and market context pointto an up move in the Aussie dollar.
TRADE
Date:Wednesday, Jan. 19, 2005.
Entry: Long the Australian dollar/U.S.dollar (AUD/USD) currency pair at .7602.
Reason(s) for trade/setup: After itsSeptember - November 2004 rally (whichnearly reached the early 2004 record high),the AUD/USD rate made a lower high atthe end of December before sagging andconsolidating in early 2005.
Technical traders will likely see therecent price action as a developing symmetrical triangle pat-tern, which, because of the downside bias over the past sev-eral weeks, would imply a breakdown below the forma-tion’s lower trendline and a continued downtrend.
We will fade this premise and go long. Even if the dollarbears seem to be losing some of their conviction and thebuck is on the verge of reversing its longstanding weakness,another slump for the greenback (vs. a stronger Aussie dol-lar) seems likely at this juncture. Ironically, the previousday’s low triggered oversold readings on many momentumoscillators, which means we are trading against populartechnical analysis interpretation on one level (the trianglepattern) and in synch with it on another.
However, this technical information is simply a prelude tothe fact that the majority of situations similar to the two-daypattern concluding on Jan. 19 — the previous day’s low beingthe lowest of the past 20 days, the current high being the high-est in three days, and the current day closing in the upper 50percent of the range — were all followed by up moves.
Historically, trading was mixed the first three days afterthis pattern, but by the fifth day (and continuing for the next15 days) the currency pair was higher in all cases, with anaverage maximum gain after 10 days of roughly 3 percent.(However, there were only five other examples over the past18 months on which to base conclusions.)
Initial stop: The historical analysis showed the largest downmove after entry was -2.1 percent. We’ll use this amount(which translates to 160 pips) to set the initial stop at .7442.
Initial target: We’ll shoot for a little less than the averagegain we discovered in testing (2.75 percent), which results inan initial target of .7811.
RESULT
Exit: .7741.
Reason for exit: The market sold off after nearly reachingthe initial profit target.
Profit/loss: +139 pips (1.8 percent).
Trade executed according to plan? No.
Lesson(s): It’s not quite accurate to say the trade wasn’texecuted according to plan. Although we exited before themarket hit the initial price target, the move to .7803 was a defacto fulfillment of that goal. The rally occurred in theevening (Central Time) on Jan. 27; if we’d been followingthe market at that time, we likely would have exited thetrade.
However, by the next morning the currency pair had soldoff sharply and had traded as low as .7707 — forming anoutside bar with a potentially lower close. We bought on anintraday bounce, deciding the market had made its antici-pated move and was now more likely to turn lower in thecoming days — despite the technical breakout out of the topof the triangle.�