Page 1
DROP-OUT RATE AT PRIMARY LEVEL: A NOTE BASED ON DISE 2003-04 & 2004-05 DATA
ARUN C. MEHTA Fellow
(E-mail: [email protected] )
National Institute of Educational Planning and Administration
17-B, Sri Aurobindo Marg, New Delhi – 110016 (INDIA)
Page 2
Drop-out Rate at Primary Level: A Note based on DISE 2003-
04 & 2004-05 Data*
ARUN C. MEHTA
Fellow National institute of Educational Planning and Administration
17-B, Sri Aurobindo Marg, New Delhi – 110016 (INDIA) Background Free and compulsory education to all children up to the age of fourteen years is our
Constitutional commitment. The Government of India has initiated a number of
programmes to achieve the goal of Universalisation of Elementary Education (UEE)
among which the Sarva Shiksha Abhiyan (SSA) is the most recent one. It aims at
achieving universal primary education by 2007 and universal elementary education by
2010. Achieving universalisation means achieving universal access, universal enrolment,
universal retention and universal quality of education. Though indicators to monitor
progress towards universal access, enrolment and quality are well defined but the general
perception about same is not clear in case of indicators of universal retention. In simple
terms, universal retention at primary level means every child enter into the system
through Grade I should retain in the system up to Grade V. Universal retention under
Sarva Shiksha Abhiyan by 2007 means that all children enrolled in Grade I in 2002-03
should retain in the system and move up to Grade V in 2007. Depending upon the
availability of data and understanding of concept of drop-out, indicators of drop-out are
computed and analysed.
* District Information System for Education is a joint initiative of Government of India,
UNICEF and NIEPA, New Delhi towards strengthening EMIS in the country.
1
Page 3
Keeping in view availability of data, an attempt has been made in the present note to
discuss computation procedure of a variety of drop-out and survival rates. Since recent
grade-specific enrolment and repeaters data are available only from DISE, the same is
used to construct indicators of drop-out. Broadly the following methods have been
discussed in the present note:
1. Retention/Survival Rate
2. Grade-to-Grade Transition Rate: Promotion, Repetition and Drop-out Rate
3. Average (Overall) Promotion, Repetition and Drop-out Rate
4. Re-constructed Cohort Method: For calculating Cohort Drop-out/Survival Rate
and indicators of Internal Efficiency of Education system
5. Transition from Primary to Upper Primary Level of Education
In view of availability of enrolment and repeaters data, a particular method for assessing
drop-out and retention is applied. However, it is the True Cohort Method which
presents true picture of retaining capacity of the system. A number of states have initiated
child-tracking studies across the country but in view of resource and time constraints the
same is not an easy task to undertake True Cohort Method annually. Each and every
enrolled child in a school is tracked/monitored over a period of five years or till a child
remains in the system. The research studies undertaken in the recent past tracked child for
five years to measure completion rate; thus presents percentage of children those who
completed primary level exactly in five years. This presents incomplete completion rate
as a number of children still remain in the system even after five years because of
repetition. The system should be monitored till the last child remains in the system. If
resources are available, child-tracking is the only way through which drop-out, retention,
survival and completion rates should be analysed. School registers for five years are used
to track a group of children those who enter into the system together. A few states have
designed their own formats and even developed software for the purpose. If tracked for
different cohorts and separately for boys and girls, the same can help in monitoring
progress towards retaining capacity of the system as well as assessing completion rate.
2
Page 4
Retention/Survival Rate
There are a number of ways through which drop-out and retention rates can be measured.
In the most commonly used method of assessing the retaining capacity of the system,
enrolment in Grade V is linked to enrolment in Grade I four years back. Hundred minus
retention rate is termed as drop-out rate which can be computed both at the primary as
well as upper primary level of education. If number of repeaters is not considered in
calculation, the rate obtained is known as Gross Retention Rate and corresponding drop-
out rate, the Gross Drop-out Rate. Retention rate is also known as Survival Rate. This
rate has been used in India for assessing retaining capacity of system as well as quantum
of drop-out over last more than 40 years. However, the calculation procedure fails to take
notice of enrolment in other grades i.e. Grade II, III and IV and also repeaters in these
grades.
Depending upon the requirement, the retention as well as drop-out rate can be worked-out
at different levels such as block, district, state and national levels. Within these levels, the
same should also be analyzed separately for rural and urban areas as well separately for
boys and girls. The following data set is required for measuring retention rate at the
primary level of education:
• Enrolment of Grade V in an year, say ‘t’
• Repeaters in Grade V in year ‘t + 4’ and
• Enrolment in Grade I in year ‘t’.
The formula for calculating retention rate is given below. Retention rate, if subtracted
from 100 gives drop-out rate at primary level.
Enrolment in Grade V in Year t+4 – Repeaters in Grade V in Year t+4
RR (t+4) = -----------------------------------------------------------------------------------------
Enrolment in Grade I in Year‘t’
3
Page 5
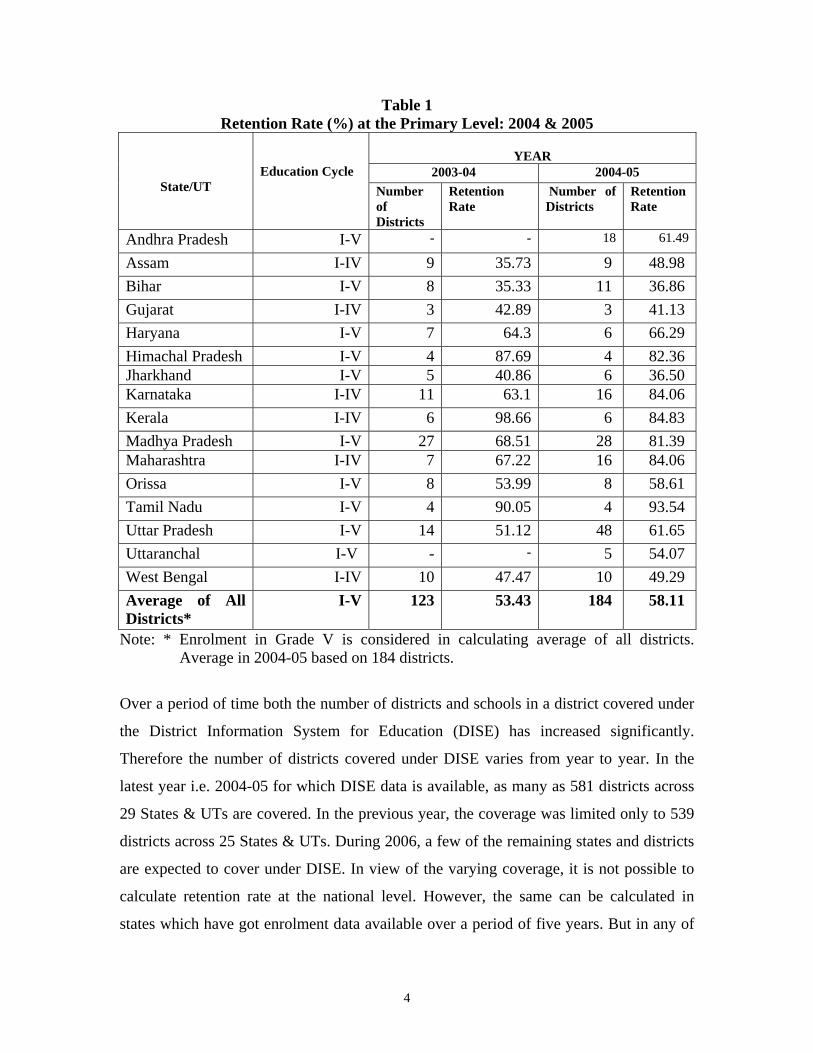
Table 1 Retention Rate (%) at the Primary Level: 2004 & 2005
YEAR
2003-04 2004-05
State/UT
Education Cycle
Number of Districts
Retention Rate
Number of Districts
Retention Rate
Andhra Pradesh I-V - - 18 61.49
Assam I-IV 9 35.73 9 48.98 Bihar I-V 8 35.33 11 36.86 Gujarat I-IV 3 42.89 3 41.13 Haryana I-V 7 64.3 6 66.29 Himachal Pradesh I-V 4 87.69 4 82.36 Jharkhand I-V 5 40.86 6 36.50 Karnataka I-IV 11 63.1 16 84.06 Kerala I-IV 6 98.66 6 84.83 Madhya Pradesh I-V 27 68.51 28 81.39 Maharashtra I-IV 7 67.22 16 84.06 Orissa I-V 8 53.99 8 58.61 Tamil Nadu I-V 4 90.05 4 93.54 Uttar Pradesh I-V 14 51.12 48 61.65 Uttaranchal I-V - - 5 54.07 West Bengal I-IV 10 47.47 10 49.29 Average of All Districts*
I-V 123 53.43 184 58.11
Note: * Enrolment in Grade V is considered in calculating average of all districts. Average in 2004-05 based on 184 districts.
Over a period of time both the number of districts and schools in a district covered under
the District Information System for Education (DISE) has increased significantly.
Therefore the number of districts covered under DISE varies from year to year. In the
latest year i.e. 2004-05 for which DISE data is available, as many as 581 districts across
29 States & UTs are covered. In the previous year, the coverage was limited only to 539
districts across 25 States & UTs. During 2006, a few of the remaining states and districts
are expected to cover under DISE. In view of the varying coverage, it is not possible to
calculate retention rate at the national level. However, the same can be calculated in
states which have got enrolment data available over a period of five years. But in any of
4
Page 6
the 29 states covered under DISE, enrolment data is not available over a period of five
years for the entire state. However, there are a few districts in each state which has got
grade-specific enrolment data over five years. Based on the data of these districts,
retention rate at the primary level of education is calculated and the same is presented in
the Table 1. The retention rate presented does not imply to the entire state/country but
fairly indicate the retaining capacity of primary education system in a state. Most of these
states are the DPEP states.
The retention rate for years 2003-04 and 2004-05 presented in Table 1 is based upon the
enrolment data of 123 and 184 districts. For the latest 2004-05, it is based upon the data
of every third district of the country. The average retention rate shows improvement
(58.11 per cent) in 2004-05 over the previous year (53.43 per cent). Though retention rate
shows an improvement of about 5 percentage points but still it is too low to achieve goal
of universal elementary education. A retention rate of 58 per cent indicates that about 42
per cent children dropped-out from the system before reaching Grade V. However, a few
states have much higher retention rate than the average (58.11 per cent) of 184 districts.
Tamil Nadu (93.54 per cent), Kerala (84.83 per cent), Himachal Pradesh (82.36 per cent)
and Madhya Pradesh (81.39 per cent) are such states. Though retention rate in these states
is not based on the entire state data but as it seems that with a little more effort, these
states can easily move towards achieving goal of universal retention at the primary level
of education. But the situation in rest of the states included in the analysis is not
encouraging. In Bihar and Jharkhand, it is low at 36 per cent compared to 54 per cent in
Uttaranchal, 62 per cent in Uttar Pradesh, 49 per cent in Assam and West Bengal and 61
per cent in Andhra Pradesh. Without much improvement, neither these states nor country
as a whole can achieve the goal of universal retention. Clearer picture will emerge when
more consistent enrolment data over a period of five years for the entire country becomes
available.
Grade-to-Grade Flow Rates
The retention rate presents retaining capacity of the system but fails to identify the
problem in the system. Therefore, it would be better to analyse grade-to-grade flow rates
5
Page 7
between the primary grades. If calculated separately for boys and girls at disaggregated
levels, such as block, the same would help in identifying block and grades where there is
problem of high incidence of repetition and drop-out. With the help of enrolment and
repeaters, first number of promotees, repeaters and drop-outs across primary grades is
obtained which in turn is linked to enrolment in previous year, to obtain transition rates,
such as, promotion, repetition and drop-out rates. If number of repeaters is not
considered, promotion rate is termed as grade ratio and is treated as crude indicator. Flow
rates, also known as transition rates, can answer a variety of typical questions, such as, at
which grade in the cycle is the repetition or dropout rate highest? who tends to drop-out
and repeat more frequently, boys or girls? and what is the total accumulated loss of
students through drop-out?. The answer of these questions can be obtained, if flow rates
for different target groups and for each grade are computed. The following set of data is
required for calculating flow rates at primary level:
• Grade-specific enrolment for Grades I, II, III, IV, V and VI (for 2005 only) for
at least two consecutive years, say 2004 and 2005
• Grade-specific repeaters for Grades I, II, III, IV, V and VI in the latest year, say 2005.
The rates can be computed by using the following formulae: Promotion Rate: Number of students promoted to grade `g+1' in year `t+1' = x 100 Total number of students in grade `g' in year `t' In notations, it is expressed by the following equation: t +1
P t g+1 ( p ) = x 100 g t E g
6
Page 8
Repetition Rate: Number of Repeaters in Grade `g' in Year `t+1' = x 100 t E g t+1 R t g ( r ) = x 100
g t E g
Drop-out Rate: Number of student’s dropping-out from grade `g' in year ‘t’ = x 100 t E g t D t g ( d ) = x 100 g t E g By using two year’s data not only grade-to-grade repetition, drop-out and promotion rates
can be obtained but average of these rates at primary level of education can also be
worked-out. The average indicates the value of these rates during the intermediary period
i.e. between two years on the basis of which grade-to-grade rates are worked out. The
average rates are also known as overall rates. The computational procedure is presented
below:
Let enrolment and repeaters in Grade I, II, III, IV, V and VI in an year is denoted by E1,
E2, E3, E4, E5 and E6 and R1, R2, R3, R4, R5 and R6 respectively (see Table 2). The
7
Page 9
promotees in a grade are obtained by subtracting repeaters from the enrolment in
subsequent grade the following year. Number of drop-out children is obtained by
subtracting repeaters and promotees from enrolment of a particular grade. Number of
promotees and drop-outs is obtained for all the grades in an education cycle, say primary
level. Similarly, grade-specific promotion (PR), repetition (RR) and drop-out (DR) rates
in year ‘t’ (say 2004) is denoted and the following formulae are used to compute average
of these rates.
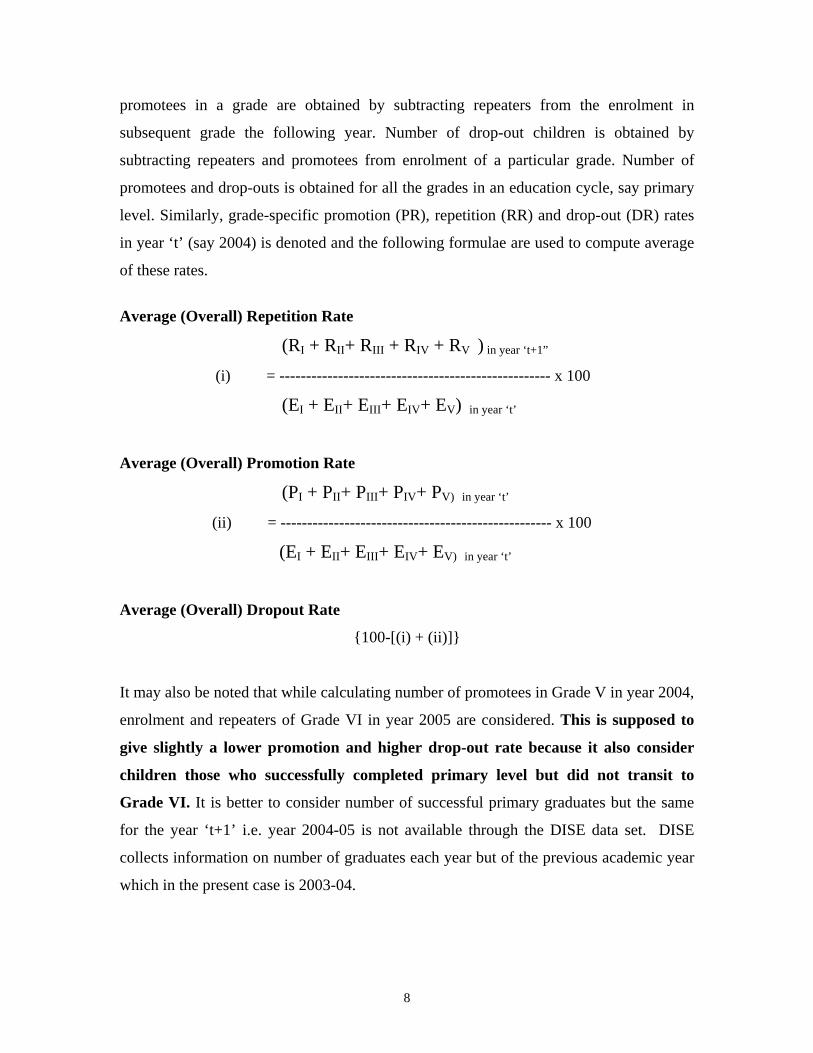
Average (Overall) Repetition Rate
(RI + RII+ RIII + RIV + RV ) in year ‘t+1”
(i) = --------------------------------------------------- x 100
(EI + EII+ EIII+ EIV+ EV) in year ‘t’
Average (Overall) Promotion Rate
(PI + PII+ PIII+ PIV+ PV) in year ‘t’
(ii) = --------------------------------------------------- x 100 (EI + EII+ EIII+ EIV+ EV) in year ‘t’
Average (Overall) Dropout Rate
{100-[(i) + (ii)]}
It may also be noted that while calculating number of promotees in Grade V in year 2004,
enrolment and repeaters of Grade VI in year 2005 are considered. This is supposed to
give slightly a lower promotion and higher drop-out rate because it also consider
children those who successfully completed primary level but did not transit to
Grade VI. It is better to consider number of successful primary graduates but the same
for the year ‘t+1’ i.e. year 2004-05 is not available through the DISE data set. DISE
collects information on number of graduates each year but of the previous academic year
which in the present case is 2003-04.
8
Page 10
Table 2 Denotations: Calculation of Average Floe Rates
Parameter GRADES
Enrolment in first
year ‘t’, say 2004 EI EII EIIII EIV EV EVI
Enrolment in second
year ‘t+1’ say 2005 EI EII EIIII EIV EV EVI
Number of
Repeaters in year
‘t+1’, say 2005
RI RII RIIII RIV RV RVI
Number of students
Promoted, in year
‘t’, 2004
PI PII PIIII PIV PV PVI
Number of Drop-out
children in year ‘t’,
2004
DI DII DIIII DIV DV DVI
One of the major limitations of the DISE enrolment data is its inconsistency. As has
already been mentioned that over a period of time the number of schools covered under
DISE has increased significantly. Not only new schools joined DISE during 2004-05 but
at the same time a few schools covered during 2003-04 couldn’t be covered in 2004-05
because of the one or other reason. Therefore, in the present exercise grade-specific flow
rates, such as promotion, drop-out and repetition as well as averages of these rates are
calculated based upon the grade-specific enrolment and repeaters of common schools.
Common schools are the schools which have been covered both in years 2003-04 and
2004-05 and also submitted enrolment and repeaters data during these years. The number
of common schools and percentage of such schools is presented in Table 3 which
suggests that more than 83 per cent of the total schools are common i.e. the supplied data
for both years.
9
Page 11
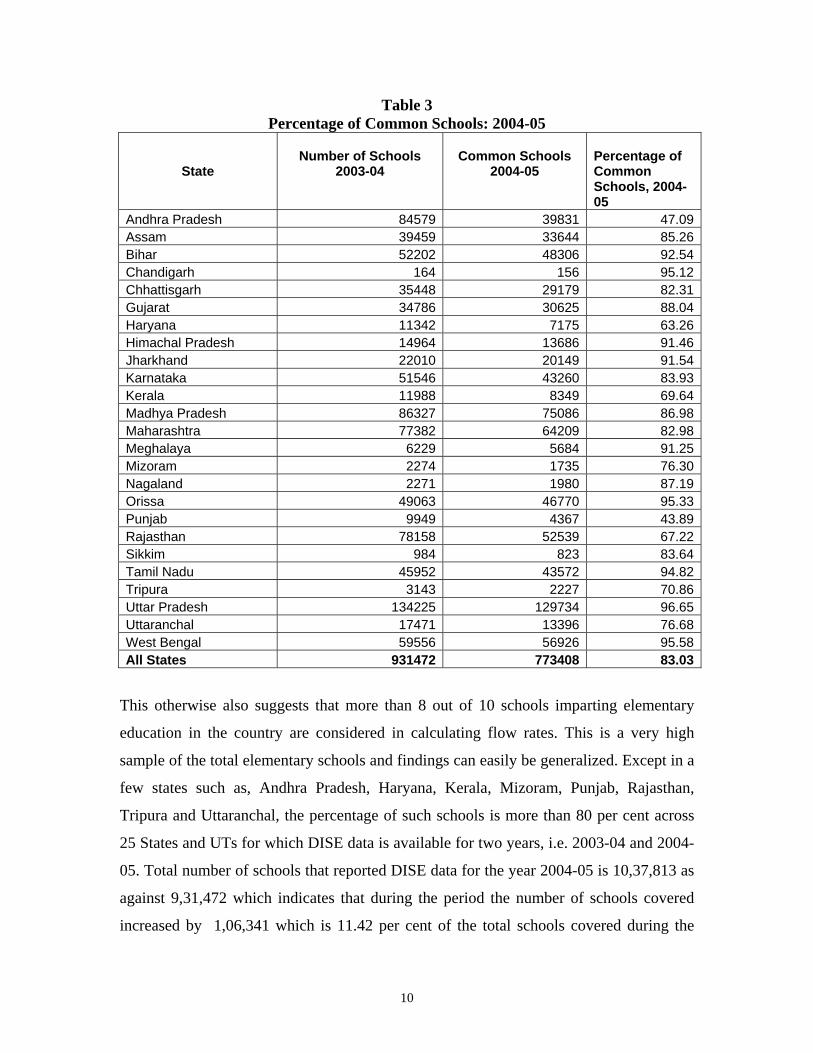
Table 3 Percentage of Common Schools: 2004-05
State
Number of Schools
2003-04
Common Schools
2004-05
Percentage of Common Schools, 2004-05
Andhra Pradesh 84579 39831 47.09Assam 39459 33644 85.26Bihar 52202 48306 92.54Chandigarh 164 156 95.12Chhattisgarh 35448 29179 82.31Gujarat 34786 30625 88.04Haryana 11342 7175 63.26Himachal Pradesh 14964 13686 91.46Jharkhand 22010 20149 91.54Karnataka 51546 43260 83.93Kerala 11988 8349 69.64Madhya Pradesh 86327 75086 86.98Maharashtra 77382 64209 82.98Meghalaya 6229 5684 91.25Mizoram 2274 1735 76.30Nagaland 2271 1980 87.19Orissa 49063 46770 95.33Punjab 9949 4367 43.89Rajasthan 78158 52539 67.22Sikkim 984 823 83.64Tamil Nadu 45952 43572 94.82Tripura 3143 2227 70.86Uttar Pradesh 134225 129734 96.65Uttaranchal 17471 13396 76.68West Bengal 59556 56926 95.58All States 931472 773408 83.03
This otherwise also suggests that more than 8 out of 10 schools imparting elementary
education in the country are considered in calculating flow rates. This is a very high
sample of the total elementary schools and findings can easily be generalized. Except in a
few states such as, Andhra Pradesh, Haryana, Kerala, Mizoram, Punjab, Rajasthan,
Tripura and Uttaranchal, the percentage of such schools is more than 80 per cent across
25 States and UTs for which DISE data is available for two years, i.e. 2003-04 and 2004-
05. Total number of schools that reported DISE data for the year 2004-05 is 10,37,813 as
against 9,31,472 which indicates that during the period the number of schools covered
increased by 1,06,341 which is 11.42 per cent of the total schools covered during the
10
Page 12
previous year. Thus, of the 1,58,064 uncommon schools observed during 2004-05, as
many as 1,06,341 schools (67.28 per cent) are the new schools added during 2004-05.
Hence, as it seems that only 51,723 schools are uncommon in both the years which is
below 5 per cent of the total schools that impart elementary education in the country.
Efforts are being made to ensure consistency in coverage of schools across the country.
States are advised to update and prepare complete list of all recognised schools at
disaggregated levels, such as cluster, block, district and state levels. In addition, CRC
Coordinators are being made accountable to ensure coverage and consistency of DISE
data.
Analysis of Flow Rates
The state-specific promotion, repetition and drop-out rates for cohort 2003-04 have been
presented in Tables 4, 5 and 6.
Promotion Rate
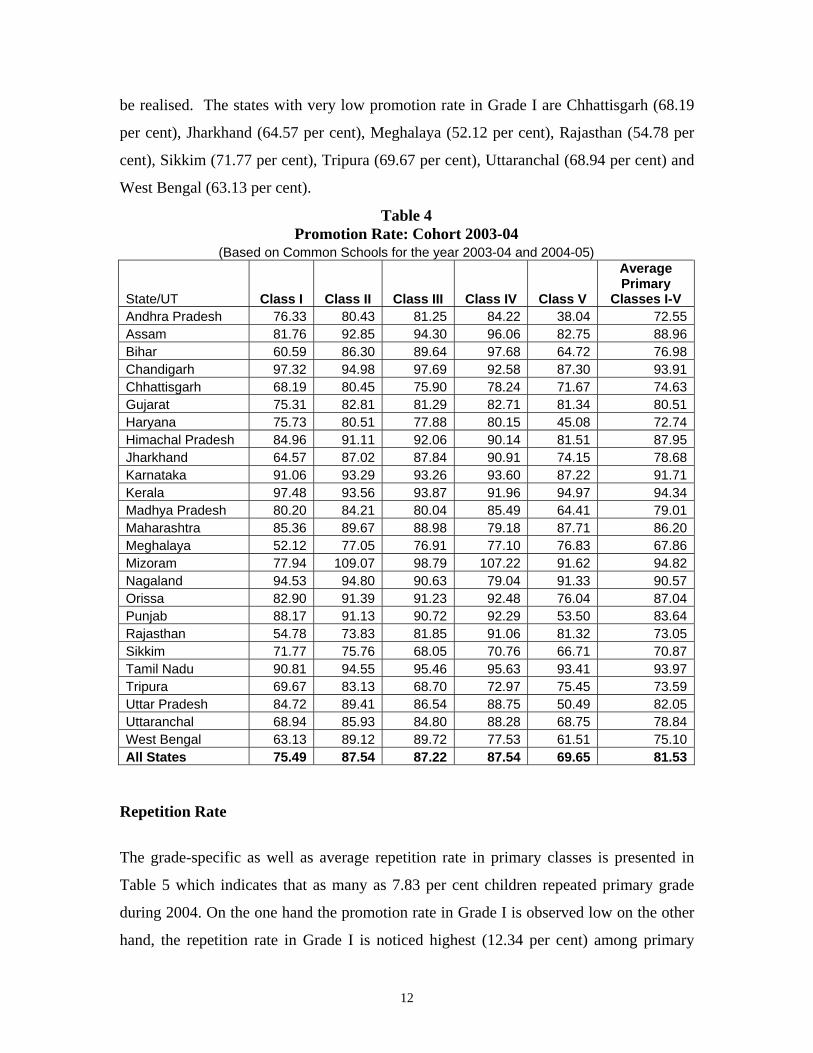
Table 4 indicates an average promotion rate of 81.53 per cent in primary classes.
However, a few states have lower than the average of all states. Andhra Pradesh (72.55
per cent), Bihar (76.98 per cent), Chhattisgarh (74.63 per cent), Haryana (72.74 per cent),
Jharkhand (78.68 per cent), Madhya Pradesh (79.01 per cent), Rajasthan (73.05 per cent),
Uttaranchal (78.84 per cent) and West Bengal (75.10 per cent) are such states. The lowest
67.86 per cent is noticed in Meghalaya followed by 70.87 per cent in case of Sikkim both
of which are from the north-eastern part of the country. Further, it is observed that only
75.49 per cent children in Grade I were promoted to next grade compared to only 69.65
per cent in case of Grade V. Low promotion rate in Grade V may be because of Grade
VI enrolment considered in calculating flow rates instead of number of graduates which
is not available through the DISE data. Rest of the primary grades has above 87 per cent
promotion rate. The low promotion rate is despite the policy of no detention generally
being followed across the country. Very low promotion rate in Grade I in a number of
states need careful examination. Without improving promotion rate in Grade I efforts
being made through SSA in attaining goal of universal primary education are not likely to
11
Page 13
be realised. The states with very low promotion rate in Grade I are Chhattisgarh (68.19
per cent), Jharkhand (64.57 per cent), Meghalaya (52.12 per cent), Rajasthan (54.78 per
cent), Sikkim (71.77 per cent), Tripura (69.67 per cent), Uttaranchal (68.94 per cent) and
West Bengal (63.13 per cent).
Table 4 Promotion Rate: Cohort 2003-04
(Based on Common Schools for the year 2003-04 and 2004-05)
State/UT Class I Class II Class III Class IV Class V
Average Primary
Classes I-V Andhra Pradesh 76.33 80.43 81.25 84.22 38.04 72.55Assam 81.76 92.85 94.30 96.06 82.75 88.96Bihar 60.59 86.30 89.64 97.68 64.72 76.98Chandigarh 97.32 94.98 97.69 92.58 87.30 93.91Chhattisgarh 68.19 80.45 75.90 78.24 71.67 74.63Gujarat 75.31 82.81 81.29 82.71 81.34 80.51Haryana 75.73 80.51 77.88 80.15 45.08 72.74Himachal Pradesh 84.96 91.11 92.06 90.14 81.51 87.95Jharkhand 64.57 87.02 87.84 90.91 74.15 78.68Karnataka 91.06 93.29 93.26 93.60 87.22 91.71Kerala 97.48 93.56 93.87 91.96 94.97 94.34Madhya Pradesh 80.20 84.21 80.04 85.49 64.41 79.01Maharashtra 85.36 89.67 88.98 79.18 87.71 86.20Meghalaya 52.12 77.05 76.91 77.10 76.83 67.86Mizoram 77.94 109.07 98.79 107.22 91.62 94.82Nagaland 94.53 94.80 90.63 79.04 91.33 90.57Orissa 82.90 91.39 91.23 92.48 76.04 87.04Punjab 88.17 91.13 90.72 92.29 53.50 83.64Rajasthan 54.78 73.83 81.85 91.06 81.32 73.05Sikkim 71.77 75.76 68.05 70.76 66.71 70.87Tamil Nadu 90.81 94.55 95.46 95.63 93.41 93.97Tripura 69.67 83.13 68.70 72.97 75.45 73.59Uttar Pradesh 84.72 89.41 86.54 88.75 50.49 82.05Uttaranchal 68.94 85.93 84.80 88.28 68.75 78.84West Bengal 63.13 89.12 89.72 77.53 61.51 75.10All States 75.49 87.54 87.22 87.54 69.65 81.53
Repetition Rate
The grade-specific as well as average repetition rate in primary classes is presented in
Table 5 which indicates that as many as 7.83 per cent children repeated primary grade
during 2004. On the one hand the promotion rate in Grade I is observed low on the other
hand, the repetition rate in Grade I is noticed highest (12.34 per cent) among primary
12
Page 14
grades. In rest of the primary grades, repetition rate varies between 5 to 7 per cent. The
average repetition rate in a few states, such as, Chhattisgarh (16.68 per cent), Gujarat
Table 5
Repetition Rate: Cohort 2003-04 (Based on Common Schools for the year 2003-04 and 2004-05)
State Class I Class
II Class
III Class IV Class
V Grade
VI
Average Primary
Classes I-V
Andhra Pradesh 11.32 4.50 3.60 2.77 2.81 2.44 5.02Assam 4.88 2.62 2.44 1.87 7.62 6.23 3.81Bihar 24.97 9.86 7.62 6.19 5.11 3.95 13.66Chandigarh 4.01 3.49 3.58 3.82 7.37 9.21 4.48Chhattisgarh 22.28 15.33 17.08 14.83 11.21 16.01 16.68Gujarat 18.90 14.24 15.03 12.08 12.34 9.74 14.72Haryana 9.18 12.12 16.77 15.29 10.23 13.67 12.67Himachal Pradesh 10.27 6.75 6.05 6.96 2.69 11.53 6.60Jharkhand 26.16 10.71 8.18 6.77 5.81 5.92 14.33Karnataka 2.66 2.47 2.59 2.47 3.21 2.75 2.68Kerala 0.34 3.99 3.96 4.12 4.29 4.80 3.36Madhya Pradesh 11.74 8.89 10.33 10.16 13.18 8.73 10.86Maharashtra 9.28 7.07 7.36 5.52 7.61 7.16 7.42Meghalaya 37.75 13.37 13.66 14.60 11.36 8.16 9.84Mizoram 6.39 2.81 3.67 2.42 2.82 2.52 3.95Nagaland 7.44 7.22 7.44 6.76 7.04 6.57 7.21Orissa 1.89 1.07 0.93 0.81 0.74 0.48 1.15Punjab 11.93 10.13 10.30 9.38 8.09 7.22 10.02Rajasthan 20.25 14.14 7.94 4.21 3.08 9.28 11.93Sikkim 21.16 24.21 27.66 26.83 25.48 30.70 24.87Tamil Nadu 3.41 2.68 2.73 2.71 2.76 6.61 2.86Tripura 22.97 16.00 27.78 22.33 16.48 26.45 21.55Uttar Pradesh 3.65 2.25 2.24 1.84 1.60 1.37 2.45Uttaranchal 16.69 8.87 7.95 5.56 1.73 7.43 9.10West Bengal 18.63 7.13 5.94 6.26 25.02 20.85 13.12All States 12.34 6.45 6.03 5.18 7.47 7.59 7.83
(14.72 per cent), Jharkhand (14.33 per cent), Sikkim (24.87 per cent) and Tripura (21.55
per cent) is observed to be very high and above national average (7.83 per cent); hence
need immediate attention. High repetition rate among primary grades in these states is
because of very high repetition rate in Grade I. Most of the major states have reasonably
lower repetition rate in primary grades.
13
Page 15
Drop-out Rate
The drop-out rate presented in Table 6 indicates an average drop-out of 10.64 per cent
among primary grades. This shows that during the intermediary years 2004 and 2005, as
many as 10.64 per cent children enrolled in Grades I to V dropped out from the system
before completion of a primary grade against 11.27 per cent during intermediary years
2002-03 and 2003-04. This is average of all the grades during 2004 and 2005 and is
different than the drop-out/retention rate presented above based on the enrolment data of
five years. As mentioned above the grade-wise drop-out rate as well as average drop-out
rate is based on enrolment data of only 2 years and not 5 years used in calculating
retention rate. While calculating retention rate the focus centered around a group of
children (cohort) those who enter education system together in a year. This group of
children (from the same cohort) is then observed over a period of time to see how many
of them reach Grade V and also how many drops out before reaching Grade V. Unlike
this, as mentioned above the grade-wise drop out rate is based on enrolment data of only
2 years; thus indicating that children in Grade I, II, III, IV and V are from different
cohorts and they enter into the education system 1, 2, 3, 4 or more than 5 years back.
These rates fail to provide any indication about the retaining capacity of the system but
shows number of children in each primary grade those who dropped out from the system
before completion of a primary grade. An average drop-out rate of 10.64 per cent in
primary grades during intermediary years i.e. 2003-04 and 2004-05 indirectly indicates a
high drop-out rate at primary level over a period of five year.
A cursory look at grade-specific drop-out rate indicate that about 12.17 per cent children
enrolled in Grade I in 2003-04 dropped out before completion of Grade I between 2003-
04 and 2004-05. In many states, drop-out rate in Grade I is noticed to be alarmingly high
all which need careful examination and appropriate strategies to check drop-out rate. In a
few states, drop-out rate even comes out negative which is largely because of the
inconsistent enrolment data. Among major states, Rajasthan has a very high (24.97 per
cent) drop-out rate in Grade I. Bihar (14.44 per cent), Haryana (15.08 per cent),
Meghalaya (37.75 per cent), Orissa (15.21 per cent), Uttaranchal (14.38 per cent) and
West Bengal (18.24 per cent) also have very high drop-out rate in Grade I. Unlike Grade
14
Page 16
I, Grade II, III and IV have lower drop-out rate and the same varies between 6 to 7 per
cent. However, a few states, such as, Andhra Pradesh (Grades II, III and IV), Meghalaya
(Grades II, III and IV), Rajasthan (Grade II and III), Uttar Pradesh (Grade III),
Maharashtra (Grade IV) and West Bengal (Grade IV) reported high drop-out rates even
in rest of the primary grades.
Table 6 Drop-out Rate: Cohort 2003-04
(Based on Common Schools for the year 2003-04 and 2004-05)
State Class I Class II Class
III Class IV Class V
Average Primary
Classes I-V Andhra Pradesh 12.34 15.06 15.15 13.01 59.15 22.43Assam 13.37 4.53 3.26 2.07 9.63 7.22Bihar 14.44 3.84 2.75 -3.86 30.17 9.36Chandigarh -1.33 1.52 -1.27 3.60 5.33 1.61Chhattisgarh 9.53 4.23 7.02 6.93 17.12 8.69Gujarat 5.79 2.95 3.68 5.20 6.32 4.77Haryana 15.08 7.37 5.35 4.56 44.69 14.60Himachal Pradesh 4.77 2.15 1.89 2.90 15.80 5.44Jharkhand 9.27 2.28 3.98 2.33 20.04 6.99Karnataka 6.28 4.24 4.14 3.93 9.56 5.61Kerala 2.18 2.45 2.18 3.91 0.75 2.30Madhya Pradesh 8.06 6.90 9.64 4.36 22.41 10.13Maharashtra 5.36 3.27 3.65 15.30 4.68 6.38Meghalaya 37.75 13.37 13.66 14.60 11.36 22.29Mizoram 15.67 -11.88 -2.46 -9.64 5.56 1.23Nagaland -1.97 -2.02 1.94 14.20 1.63 2.22Orissa 15.21 7.54 7.84 6.72 23.22 11.80Punjab -0.11 -1.27 -1.02 -1.68 38.40 6.33Rajasthan 24.97 12.03 10.21 4.74 15.60 15.02Sikkim 7.07 0.03 4.29 2.41 7.81 4.26Tamil Nadu 5.78 2.77 1.82 1.66 3.82 3.17Tripura 7.36 0.87 3.51 4.71 8.07 4.86Uttar Pradesh 11.63 8.34 11.22 9.41 47.91 15.50Uttaranchal 14.38 5.19 7.25 6.16 29.52 12.06West Bengal 18.24 3.75 4.34 16.20 13.47 11.78All States 12.17 6.01 6.76 7.27 22.87 10.64
Note: States showing negative drop-out rates indicate inconsistent grade-specific enrolment data.
15
Page 17
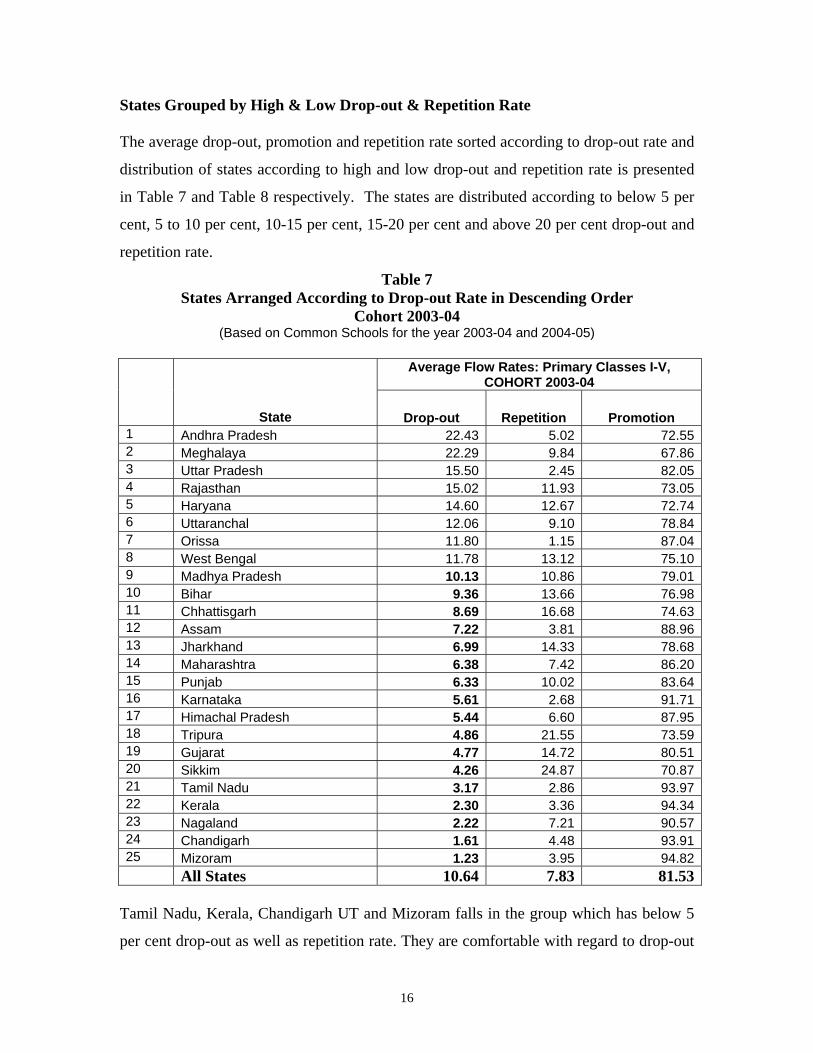
States Grouped by High & Low Drop-out & Repetition Rate The average drop-out, promotion and repetition rate sorted according to drop-out rate and
distribution of states according to high and low drop-out and repetition rate is presented
in Table 7 and Table 8 respectively. The states are distributed according to below 5 per
cent, 5 to 10 per cent, 10-15 per cent, 15-20 per cent and above 20 per cent drop-out and
repetition rate.
Table 7 States Arranged According to Drop-out Rate in Descending Order
Cohort 2003-04 (Based on Common Schools for the year 2003-04 and 2004-05)
Average Flow Rates: Primary Classes I-V,
COHORT 2003-04
State Drop-out Repetition Promotion 1 Andhra Pradesh 22.43 5.02 72.552 Meghalaya 22.29 9.84 67.863 Uttar Pradesh 15.50 2.45 82.054 Rajasthan 15.02 11.93 73.055 Haryana 14.60 12.67 72.746 Uttaranchal 12.06 9.10 78.847 Orissa 11.80 1.15 87.048 West Bengal 11.78 13.12 75.109 Madhya Pradesh 10.13 10.86 79.0110 Bihar 9.36 13.66 76.9811 Chhattisgarh 8.69 16.68 74.6312 Assam 7.22 3.81 88.9613 Jharkhand 6.99 14.33 78.6814 Maharashtra 6.38 7.42 86.2015 Punjab 6.33 10.02 83.6416 Karnataka 5.61 2.68 91.7117 Himachal Pradesh 5.44 6.60 87.9518 Tripura 4.86 21.55 73.5919 Gujarat 4.77 14.72 80.5120 Sikkim 4.26 24.87 70.8721 Tamil Nadu 3.17 2.86 93.9722 Kerala 2.30 3.36 94.3423 Nagaland 2.22 7.21 90.5724 Chandigarh 1.61 4.48 93.9125 Mizoram 1.23 3.95 94.82 All States 10.64 7.83 81.53
Tamil Nadu, Kerala, Chandigarh UT and Mizoram falls in the group which has below 5
per cent drop-out as well as repetition rate. They are comfortable with regard to drop-out
16
Page 18
rate in primary grades during the intermediary period (2004 and 2005) which is also
reflected in retention rate presented in Table 1. These states required to sustain their
efforts as both repetition as well as drop-out rate is quite satisfactory. On the other hand a
few states, namely Nagaland, Gujarat, Tripura and Sikkim too have below 5 per cent
drop-out rate in primary grades but repetition rate in these states is above 5 per cent.
Tripura and Sikkim even reported above 20 per cent repetition rate.
Table 8 Distribution of States by Drop-out and Repetition Rate: Cohort 2004
Drop-out Rate Repetition Rate Below 5 % 5 to 10% 10-15% 15-20% Above 20% Below 5% Tamil Nadu
Kerala
Chandigarh
Mizoram
Assam
Karnataka
Orissa Uttar
Pradesh
5 to 10% Nagaland Maharashtra
Himachal
Pradesh
Uttaranchal Andhra Pradesh
Meghalaya
10-15 %
Gujarat Bihar
Jharkhand
Punjab
Haryana
West
Bengal
Madhya
Pradesh
Rajasthan
15 -20% Chhattisgarh
Above 20% Tripura
Sikkim
A number of other states have average drop-out rate between 5 to 10 per cent and also
have repetition rate below 5 per cent or between 5 to 10 per cent. Assam and Karnataka
and Maharashtra and Himachal Pradesh fall under this category. Whereas Bihar,
Jharkhand and Punjab have drop-out rate below 10 per cent but at the same time
repetition rate in these states varies between 10 to 15 per cent. Chhattisgarh in this
category has even a repetition rate of 16.68 per cent. In rest of the states, Orissa,
17
Page 19
Uttaranchal, Haryana, West Bengal and Madhya Pradesh have drop-out rate in primary
classes between 10-15 per cent. Orissa too have a low repetition rate of below 5 per cent
compared to 9.10 per cent in Uttaranchal. The remaining states in this category have high
repetition rate between 10 to 15 per cent.
Out of 25 states covered, only four states have an average drop-out rate of above 15 per
cent in primary classes. The states are Uttar Pradesh, Rajasthan, Andhra Pradesh and
Meghalaya. However, Uttar Pradesh has a low repetition rate of 2.45 per cent, the second
lowest in the country. Unless the promotion rate in Uttar Pradesh is improved, the
repetition rate will continue to remain high. Perhaps, it is Rajasthan that need immediate
attention as both the average drop-out and repetition rate is quite high. The drop-out rate
in Rajasthan is as high as 15.02 per cent compared to11.93 per cent repetition rate. Not
only it need to check repetition rate in Grade I (20.25 per cent) but also need to develop
appropriate strategies to check high drop-out rate in Grade I (24.97 per cent). Without
significant improvement overall drop-out rate in primary classes in Rajasthan is not
expected to improve. There are only two states, namely Andhra Pradesh and Meghalaya
which have above 20 per cent average drop-out rate in Primary classes. These states also
have a repetition rate of 5.02 and 9.84 per cent respectively. Andhra Pradesh needs to
improve promotion rate which is low at 72.55 per cent.
While preparing Annual Work Plan and Budget under SSA, the states should thoroughly
analyse reasons of low promotion and high repetition and drop-out rate and adopt
appropriate strategies. On the one hand, a large number of children are getting enrolled
and on the other hand 10 out of 100 children enrolled drop-out before completing a
primary grade all of which need serious interventions. This is despite SSA interventions
and mid-day meal across the country. However, more clearer picture of drop-out rate will
emerge when the entire country is covered under DISE and consistency of enrolment data
is also improved.
Internal Efficiency of Primary Education System The flow rates presented above fails to produce any information about the internal
efficiency of the educational system. In simple terms, efficiency can be defined as an
18
Page 20
optimal relationship between the input and the output. The best system is one which has
both the input and output exactly the same, which is known as a perfect efficient system.
If a child remains in the system for two years then it is considered that the system has
invested two student years on that child. On the other hand, every successful completer of
a particular cycle is termed as the output, which is also known as the `graduate'.
Table 9
Indicators of Internal Efficiency: Cohort 2003 & 2004 (Based on Common Schools for the year 2003-04 and 2004-05)
Co-efficient of Efficiency
Years Input per Graduate Input-Output Ratio
State 2003/04 2004/05 2003/04 2004/05 2003/04 2004/05 Andhra Pradesh 67.6 - 7.4 - 1.48 - Assam 82.9 80.7 6.0 7.4 1.20 1.48 Bihar 48.8 61.0 10.3 9.8 2.06 1.96 Chandigarh - 88.2 - 6.8 - 1.36 Chhattisgarh 77.6 59.6 6.4 1.28 Gujarat - 73.7 - 8.1 - 1.62 Haryana - 41.1 - 14.6 - 2.93 Himachal Pradesh 88.9 75.8 5.6 7.9 1.12 1.58 Jharkhand 101.8 66.5 4.9 9.0 0.98 1.8 Karnataka 93.7 82.4 5.3 7.3 1.06 1.46 Kerala 101.1 90.9 4.9 6.6 0.98 1.32 Madhya Pradesh 76.3 59.9 6.6 10.0 1.32 2.0 Maharashtra - 74.9 - 8.0 - 1.6 Meghalaya - 52.7 - 11.4 - 2.28 Mizoram - 99.6 - 6.0 - 1.2 Nagaland - 81.7 - 7.3 - 1.46 Orissa 92.0 67.3 5.4 8.9 1.08 1.78 Punjab - 53.9 - 10.4 - 2.08 Rajasthan 45.1 59.5 11.1 10.1 2.22 2.02 Tamil Nadu 89.1 89.5 5.6 6.7 1.12 1.34 Tripura - 64.7 - 9.3 - 1.86 Uttar Pradesh. 96.1 44.3 5.2 9.7 1.04 1.94 Uttaranchal 81.2 57.5 6.2 10.4 1.24 2.08 West Bengal 68.3 57.7 7.3 10.4 1.46 2.08 All States Together 76.9 87.8 6.5 6.8 1.30 1.36
19
Page 21
By using the following assumptions, the Reconstructed Cohort method is used to obtain
indicators of internal efficiency of education system. Input-Output Ratio, Coefficient of
Efficiency and Input per Graduate (in terms of years), have been presented in case of all
the 25 states for which 2 years enrolment and repeaters data is available. Coefficient of
Efficiency is defined as the ratio of actual number of pupil years to the ideal number of
pupil-years. Ratio closer to one means the better internal efficiency. The input-output
ratio is simply the inverse of coefficient of efficiency, and is equal to years input per
graduate divided by five which is length of the primary cycle. The assumptions used are
as follows:
♦ The promotion, repetition and dropout rates presented above (based on DISE 2004
and 2005 data) would remain constant throughout the evolution of the cohort;
♦ A student would not be allowed to continue in the system after he/she has repeated
for three times; thereafter, he/she will either leave the system or would be promoted
to the next higher grade; and
♦ No student other than the original ones would be allowed to enter the cycle in
between the system.
The coefficient of efficiency presented above reveals that primary education system is
efficient to the tune of only 87.8 per cent. There is good scope of further improvement as
12.2 per cent of the total resources have gone waste. In Bihar (48.8) and Rajasthan
(59.5), the coefficient of efficiency obtained is much lower than the average of all states.
Much of the resources in these states are going waste. Kerala, as it seems, that the
primary education system is an efficient one. On an average a primary graduate is taking
6.8 years to become graduate compared to ideal 5 years. Students in Bihar are taking 9.8
years compared to 10.1 years in Rajasthan which clearly shows that the primary
education systems in these states are highly inefficient ones. This is also reflected in the
input-output ratio which means a student is taking double time resources in tese states to
become primary school graduate. Had there been no wastage in the system, a ratio of one
is considered to be the ideal one. Most of the states have the ratio well above one. Unless
the efficiency of education system is improved, the goal of UPE in these states may not
be realized in the near future. Clearer picture of efficiency will emerge next year when
20
Page 22
enrolment data of other states over a two-year period will be available and consistency of
data also improved.
Transition Rate One of the important indicators on which the expansion of upper primary education
depends is transition rate from primary to upper primary level of education. Two years’
grade-specific enrolment data is required to work out transition rate which is defined as
follows:
New Entrants into Grade VI in Year `t+1' Transition Rate = x 100 Enrolment in Grade V in Year `t' t+1 E g+1 = x 100 t E g
Table 10 Transition Rate (%) from Primary (V) to Upper Primary
(VI) Level of Education Cohorts: 2003 & 2004
COHORT
Number of Districts
Boys Girls Total
2003 461 76.01 71.98 74.15
2004 539 79.96 75.78 78.01
It may be noted that two year’s grade-specific enrolment data is not available through
DISE in case of all the 29 States & UTs covered in 2005. However, enrolment data along
with grade-specific repeaters is available for two years in case of 539 districts across 25
states (except Punjab because of incomplete data in 2003-04) all of which supplied DISE
data for the year 2004 too. Repeaters subtracted from enrolment in Grade VI or V, as the
21
Page 23
case may be, in 2005, is divided by enrolment in Grade V or IV in the previous year
(2004) and is then multiplied by 100 to obtain the transition rate for cohort 2004. This has
been obtained separately in case of boys, girls and all children together and presented in
Table 10 and Table 11.
Table 11
State-specific Transition Rate from Primary (IV/V) to Upper Primary (V/VI)*
Level of Education: Cohort 2004 State BOYS GIRLS TOTAL
Andhra Pradesh 91.64 87.47 89.59 Assam** 102.98 100.25 101.66 Bihar 68.21 61.61 65.56 Chandigarh 84.19 85.08 84.57 Chhattisgarh 75.51 66.82 71.38 Gujarat 84.79 80.29 82.74 Haryana 65.12 66.69 65.86 Himachal Pradesh 92.65 88.6 90.71 Jharkhand 73.26 68.71 71.31 Karnataka 90.63 88.73 89.72 Kerala 87.08 86.11 86.6 Madhya Pradesh 73.82 64.37 89.47 Maharashtra 75.65 73.61 74.68 Meghalaya 97.83 100.38 99.15 Mizoram** 112.3 111.56 111.94 Nagaland 79.93 81.26 80.57 Orissa 78.16 76.02 77.17 Rajasthan 98.62 83.27 92.4 Sikkim 68.61 72.4 70.58 Tamil Nadu** 102.24 98.99 100.67 Tripura 76.96 77.06 77.01 Uttar Pradesh 59.24 55.74 57.62 Uttaranchal 90.58 88.63 89.63 West Bengal 80.95 77.22 79.09 All States 79.96 75.78 78.01
*: As the case may be
**: Technically more than 100 transition rate is not possible.
22
Page 24
The transition rate presented in Table 10 shows improvement over the previous year i.e.
2003 based on data of 461 districts. The average of 539 districts suggests that more than
78.01 per cent children in 2004 transited from primary to upper primary level of
education against 74.15 per cent during the previous year. No significant difference in
transition rate is noticed in case of boys and girls. Separately, transition rate in case of
boys and girls both shows improvement in 2004 over the previous year. Against 79.96
per cent boys, about 75.78 per cent girls transited from primary to upper primary level of
education in 2004 against 76.01 per cent boys and 71.98 per cent girls during the
previous year i.e. 2003. Though transition rate from primary to upper primary level
shows improvement but still about 22 per cent children drop-out in transition which may
play significant role towards moving goal of universalisation of elementary education.
Further, a significant deviation is noticed when state-specific transition rates are analysed
which is presented in Table 11. As against a low transition rate of 57.62 per cent in Uttar
Pradesh, the same is very high in case of a few states such as Himachal Pradesh, Assam,
Kerala, Mizoram, Rajasthan, Tamil Nadu, Uttaranchal and Andhra Pradesh. In Uttar
Pradesh only 59.24 per cent boys and 55.74 per cent girls transited from primary to upper
primary level of education in 2004. Bihar too has a low 65.56 per cent transition rate. The
other major states that need immediate attention is Chhattisgarh (71.38 per cent), Haryana
(65.86 per cent), Jharkhand (71.31 per cent), Madhya Pradesh (69.47 per cent),
Maharashtra (74.88 per cent), Orissa (77.17 per cent), West Bengal (79.09 per cent) etc.
As it seems that the goal of universal elementary education in these states may not be
realised in the near future if transition rates are not improved significantly. By conducting
studies, the states should know reasons of low transition, which should be followed by
incorporation of reason-specific strategies in the Annual Work Plan and Budget. In a few
states such as Chhattisgarh, Madhya Pradesh and Rajasthan, significant difference is
noticed in case of transition rate of boys and girls. In Rajasthan only 83.27 per cent girls
transited from primary to upper primary level against 98.62 per cent boys; thus showing a
gap of about 15 percentage points.
23
Page 25
Concluding Observations
Depending upon availability of data, an indicator to measure drop-out rate should be
developed. If resources available, true-cohort study where each and every enrolled child
is tracked should be undertaken which can be used for both assessing drop-out as well as
completion rate. If resources are not available and data available, retention rate by using
enrolment and repeaters data over a period of five years should only be utilized to assess
retaining capacity of an education system. The retention rate so obtained is subtracted
from 100 to obtain drop-out rate at an educational level. To know real cause of low
retention/high drop-out rate, it is essential that the same be calculated and analysed at
disaggregated levels and if data available, separately for boys and girls, rural and urban
areas and for SC and ST children.
The root cause of high drop-outs can be identified by calculating grade-to-grade flow
rates such as, promotion, drop-out and repetition rate. This will help a district/state in
identifying in which grade there is high incidence of drop-out and repetition and also in
knowing whether the same is because of boys/girls SC/ST children. The grade-to-grade
drop-out rates can also be used in assessing average drop-out and repetition during
intermediary year. The average indicate quantum of drop-out during intermediary year in
relation to total enrolment in primary grades. Average drop-out rate can also be used to
examine trends in drop-out and repetition rate over a period of time but the same is
different than the retention rate which is based upon enrolment data over a period of five
years where as average drop-out rate is simply based upon enrolment and repeaters data
of only two years. As has been demonstrated in this note, grade-to-grade transition rates
can also be used to do construct indicators of internal efficiency of education system.
By just quantifying drop-out rate, the situation will not improve automatically for that
purpose the first major exercise is to know reasons of low promotion and high drop-out
and repetition. This should necessarily follow by reason and area specific strategies
without which no improvement is expected. This should form part of Annual Work Plan
and Budget under SSA and the Project Approval Board should rigorously monitor it.
Year 2010 is approaching fast and we cannot sit hoping that situation (with regard to
drop-out) will improve automatically. Still we have more than four years to more
24
Page 26
optimally and rigorously utilize provisions made under Sarva Shiksha Abhiyan to work
towards achieving universal elementary education.
Further Reading
District-wise Drop-out Rates: Concept, Methods of Calculation and Cohort Drop-out
Rates derived by Reconstructed Cohort Method, Research, Evaluation and Studies Unit,
TSG, Educational Consultants India Limited, NOIDA, UP, 2005
Indicators of Educational Development: Concept and Definitions, Arun C. Mehta,
National Institute of Educational Planning and Administration, New Delhi, 2003
25