Numerous studies have been done to determine the particle’s behavior, motion and flow pattern in a pipeline or small channel. Fundamentally, the particle motion is constant in all circumstances of mass particularly in room temperature, however as the temperature of the particle’s surroundings is increased, the kinetic energy and the speed rate of particle will increase (Lai et al. 2006). In contrast, as the temperature of the particle’s environment reaches a very low level, the particles will move in the form of fixed vibration condition. It is because the particles motion in the liquid phase does not have consistent movement, hence the resulting movement is random (Xu 1997).
The particle’s behavior and motion are observed to occur regularly from large to micro scale, mainly as fluid is aqueous and thus of low viscosity. Normally, suspended particles tend to migrate in a pressure-driven flow at the finite-inertia conditions; that called tubular a pinch phenomenon. It was known as a successfully described by a theory for a point particle limit in the channel and tube geometries (Segre et al. 1962 and Dong et al. 2004). Recently, researchers become attracted to study the particle behavior in a micro scale size (Gwo-Bin et al. 2006; Kim et al. 2008; Choi et al. 2011; Othman et al. 2012 and Othman et al. 2015). Generally, the length of microchannel is in the order up to several hundred microns. Due to this condition, the transported particles are in order of less than 10 µm. Nowadays, the particle behavior
JK Bab 7.indd 47 5/28/2018 11:53:09 AM
48
in a micro scale can be utilized in a widespread range of application for example, as used of separating biological particles or focusing on DNAs in case of capillary-based microchannels with the dilute suspension flows. Thus, the concept of inertial particles migration in much type of the channel geometries and condition has been demonstrated (Othman et al. 2013 and Othman et al. 2015).
Historically, Analytical Fluid Dynamics (AFD) and Experimental Fluid Dynamics (EFD) were often used to study the particle motion in the microchannel (Oddy et al. 2001). The behavior and flow pattern of the particle motion in a microchannel is significant in order to enhance the mixing and optimization process. Due to the AFD and EFD technique constraint is limited in terms of time, equipment and expenses, thus the computational or numerical technique, computational fluid dynamic (CFD) is introduced to assess the optimization level by specifying particles motion in the microchannels (Lohner 2008). Nowadays, the research’s interest essentially involves looking at the catalytic micro-reactors, fuel processing/fuel cell system, multi-scale optimizations, multi-scale modeling and process control. Hence, essentially to look at models for various small scale systems and basically uses of computers in order to get results numerically from these systems. One of the most important aspects is using these numerical methods within a computer framework in order to understand, how the actual systems behave in the real life.
The CFD technique has become feasible due to the advent of high speed digital computers. The objective of CFD is to model the continuous fluids with Partial Differential Equations (PDEs) and discretize PDEs into an algebra problem (Taylor series), solve it, validate it and achieve the simulation based design (Lohner 2008 and Iglberger et al. 2008). The CFD technique offers the solution in order to simplify the job and it is compatible with home and business types of computers. The application of the CFD techniques have been used in the weather forecasting patterns that requires solving very large scale differential equations and it requires really fast computing with appropriate numerical technique.
The understanding on the numerical technique is important in order to see what kind of the properties they have and how they behave. Basically, it is based on the use of computers to solve these problems by step wise, repeated and iterative solution methods; therefore, the solution methods are essentially going to be repeated. The numerous advantages of these numerical techniques are; (1) extremely powerful problem solving tools, (2) the commercial software’s and packages are nowadays readily available, which are suitable for certain type of industrial applications, (3) can provide additional insights into various engineering problems (Suhas et al. 1980). In addition, the numerical methods allow the researchers to explore the experimental work in various possibility in order to understand the system behaving in a particular way while allowing a better analysis of the experimental results.
Lots of simulations are studied and reported in the particle distribution in the microchannels, and although the success of
In this study, there are two phases involved in a mixing; polystyrene as particle phase and water as the liquid phase which are feed through the inlet A and inlet B. The properties of the polystyrene particle and water are listed in Table 1. The pressure exerted in the microchannel is assumed to be at 1 atm, while the temperature is set at 25ºC. Assuming there is no change in the pressure and temperature and the heat transfer between two fluids is not involved during the process. The initial flow rate of inlet A and B are set up in a range between 0.005 to 0.0025 mL/s. The particle diameter is 10 µm with
JK Bab 7.indd 48 5/28/2018 11:53:11 AM
49
the mean particle velocity of between 0.02 to 0.08 m/s were feed at the inlet A and B. The polystyrene particle solution is diluted in the deionized water with the initial concentration of particle at the inlet A and B is between 0.2 to 1.0 % w/w. These parameters were manipulated in order to determine the optimum mixing condition and the particle distribution is visualized at two different inlets area.
TABLE 1. Properties of water and polystyrene
Properties Water Polystyrene
Density (kg/m3) 998.2 1040Viscosity (kg/ms) 0.001003 0.056
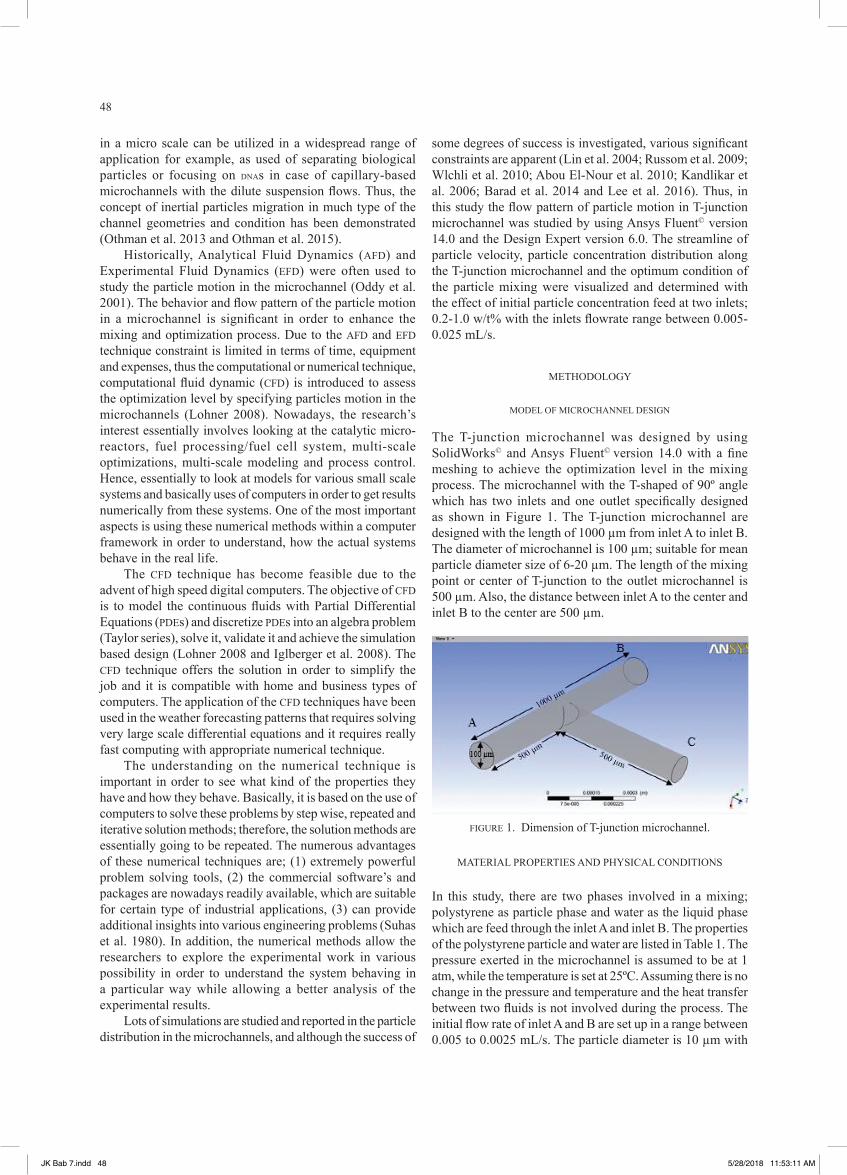
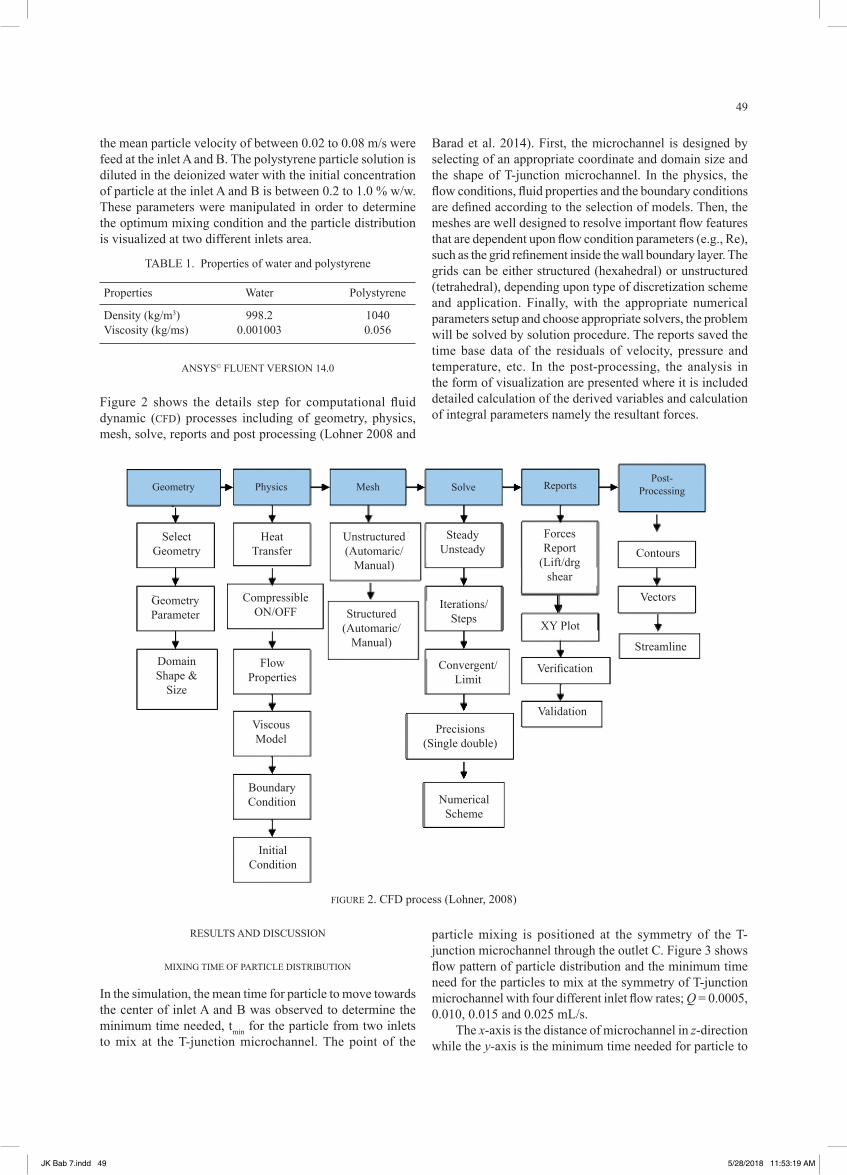
Figure 2 shows the details step for computational fluid dynamic (CFD) processes including of geometry, physics, mesh, solve, reports and post processing (Lohner 2008 and
Barad et al. 2014). First, the microchannel is designed by selecting of an appropriate coordinate and domain size and the shape of T-junction microchannel. In the physics, the flow conditions, fluid properties and the boundary conditions are defined according to the selection of models. Then, the meshes are well designed to resolve important flow features that are dependent upon flow condition parameters (e.g., Re), such as the grid refinement inside the wall boundary layer. The grids can be either structured (hexahedral) or unstructured (tetrahedral), depending upon type of discretization scheme and application. Finally, with the appropriate numerical parameters setup and choose appropriate solvers, the problem will be solved by solution procedure. The reports saved the time base data of the residuals of velocity, pressure and temperature, etc. In the post-processing, the analysis in the form of visualization are presented where it is included detailed calculation of the derived variables and calculation of integral parameters namely the resultant forces.
FIGURE 2. CFD process (Lohner, 2008)
Geometry Physics Mesh Solve ReportsPost-
Processing
Iterations/Steps
Convergent/Limit
Precisions(Single double)
NumericalScheme
SelectGeometry
GeometryParameter
DomainShape &
Size
HeatTransfer
CompressibleON/OFF
FlowProperties
ViscousModel
BoundaryCondition
InitialCondition
Unstructured(Automaric/
Manual)
Structured(Automaric/
Manual)
SteadyUnsteady
Validation
Verification
XY Plot
Vectors
Streamline
ContoursForcesReport
(Lift/drgshear
RESULTS AND DISCUSSION
MIXING TIME OF PARTICLE DISTRIBUTION
In the simulation, the mean time for particle to move towards the center of inlet A and B was observed to determine the minimum time needed, tmin for the particle from two inlets to mix at the T-junction microchannel. The point of the
particle mixing is positioned at the symmetry of the T-junction microchannel through the outlet C. Figure 3 shows flow pattern of particle distribution and the minimum time need for the particles to mix at the symmetry of T-junction microchannel with four different inlet flow rates; Q = 0.0005, 0.010, 0.015 and 0.025 mL/s.
The x-axis is the distance of microchannel in z-direction while the y-axis is the minimum time needed for particle to
JK Bab 7.indd 49 5/28/2018 11:53:19 AM
50
reach and mixed at the symmetry of T-junction microchannel. From the results, it was observed that as the inlets flow rate is increased, the less time needed for the particle to reach at the center of the T-junction microchannel. The minimum time needed for particle to mix at the center of microchannel are tmin=8.75 µs, 2.5 µs, 1.65 µs and 1.0 µs for Q = 0.0005, 0.01,
0.015 and 0.025 mL/s, respectively. It can be concluded that, various flow patterns of particle concentration distribution were visualized at different flow rate where at the low inlet flow rate, the plug and wavy flow were observed while at the high inlet flow rate, the slug and annular flow were observed (Wlchli et al. 2010; Abou El-Nour et al. 2010 and Barad et al. 2014).
PARTICLE VELOCITY
The initial particle velocity at the inlet A; VA and B; VB were manipulated in order to determine the optimum particle velocity for mixing process at near the outlet C. The initial particle velocity, Vi between 0.02 to 0.1 m/s was feed through inlets A and B, and the velocity of particle mixing at near the outlet C was observed along the T-junction microchannel as shown in the Figure 4. The color bar showed the range of particle velocity, where the blue color indicated the low velocity while the red color indicated the high velocity. From the results, it was observed that the particle velocity slowly increased as the particle moving through the corner of the T-junction microchannel (indicate with red color) due to some friction between the wall and shear force effect (Sundararaj et al. 2013 and Ralph et al. 2009).
PARTICLE CONCENTRATION DISTRIBUTION
The polystyrene particle diluted in the deionized water was feed through the inlet A and B at different initial particle concentration; Ci = 0.4 to 2.0% w/w. Figure 5 shows the
FIGURE 3. Minimum time need for particle to mix at symmetry of T-junction microchannel with four inlet flow rates; Q = 0.0005, 0.010, 0.015 and 0.025 mL/s. (from left to right, upper to below direction).
pattern of particle concentration distribution along the T-junction microchannel with the effect of various Ci. The color bar showed the range of particle concentration distribution, where the blue color indicated that the dilute particle concentration, while the red color indicated the dense particle concentration. From the results, the dense particle concentration distribution was observed at the center of T-junction microchannel at near the channel outlet, C.
In the low aspect ratio, the particles flow in the T-junction microchannel wall will experienced undergoing lift and shear force either through the top or bottom wall (Ralf et al. 2011 and Xinyu et al. 2015). These lift forces, shear forces Fs and lift wall force, Fw involved during the particle motion in the flow. Moreover, the particles remained in the migration process through the center of the channel having a lift round FΩ, where collisions between the particles happened. Due to the fact that the momentum rate of particles, depends on the bonding strength, the strong bond of particles ties will be completely involved in the two stages of migration process and balance position of center of smaller particles (Thomas et al. 2008). The T-junction microchannel is designed such that it has a channel width and a speed that are appropriate to facilitate the particle motions through the migrating process
JK Bab 7.indd 50 5/28/2018 11:53:26 AM
FIGURE 4. Particle velocity; Vi 0.02 to 0.10 m/s along T-junction microchannel.
from one position to the another position, until the particle mixing achieved at an optimum level.
Figure 6 shows the time-averaged of the particle concentration distribution at the downstream cross-section; near the outlet C. The particle concentration kept increasing as the particle moved along the T-junction microchannel. It was shown that the particle migration has occurred during the particle motion from two inlets areas moving towards the outlet microchannel.
CONCLUSION
This study simulated and visualized the particle behaviour and the particle’s flow pattern in the T-junction microchannel with various effect on the particle concentration distribution. The results shown that the optimization level achieved as the
flow rate of 0.025 mL/s with the mixing process occurred within 1.6 seconds and the velocity of two inlets, VA= 0.02 m/s, VB= 0.04 m/s, where the particle experienced less lift shear and compressive forces near the outlet which make mixing process become efficiently.
ACKNOWLEDGEMENT
The authors would like to thank the Ministry of Higher Education Malaysia and Universiti Kebangsaan Malaysia for their financial support under the grant the research grant DPP-2015-FKAB and GGPM-2014-039.
JK Bab 7.indd 51 5/28/2018 11:53:33 AM
52
FIGURE 5. Particle concentration distribution along T-junction microchannel
FIGURE 6. Particle concentration distribution at downstream cross-section; near outlet C
JK Bab 7.indd 52 5/28/2018 11:53:42 AM
53
REFERENCES
Abou El-Nour, K. M. M., Eftaiha, A., Al-Warthan, A. & Ammar, R. A. A. 2010. Synthesis and applications of silver nanoparticles. Arabian Journal of Chemistry 3(3): 135-140.
Alvin, C.K. L. & Fangzhi C. 2006. Modeling particle deposition and distribution in a chamber with a two-equation Reynolds-averaged Navier – Stokes model. Journal of Aerosol Science 37(12): 1770-1780.
Barad, S. V & Makwana, P. M. N. 2014. Numerical investigation of single phase fluid flow and heat transfer in rectangular micro channel using nanofluids as a cooling liquid. Journal of Engineering Research and Applications 4(4): 133-137.
Choi, Y. S., Seo, K. W. & Lee, S. J. 2011. Lateral and cross-lateral focusing of spherical particles in a square microchannel. Lab on a Chip, 11(3): 460-465.
Iglberger, K., Thürey, N. & Rüde, U. 2008. Simulation of moving particles in 3D with the Lattice Boltzmann method. Computers and Mathematics with Applications 55(7): 1461-1468.
Kandlikar, S. G., Garimella, S., Li, D., Colin, S. & King, M. R. 2006. Heat Transfer and Fluid Flow in Minichannels and Microchannels. Elsevier Science & Technology, Elsevier Science Ltd.
Kim, W. & Yo, Y. 2008. The lateral migration of neutrally-buoyant spheres transported through square microchannels. Journal of Micromechanics and Microengineering 18(6): 065015.
Lee, G.B., Chang, C.C., Huang, S.B. & Yang, R.J. 2006. The hydrodynamic focusing effect inside rectangular microchannels. Journal of Micromechanics and Microengineering 16(5): 1024-1032.
Lee, W.-L., Tsai, M.-H., Yang, C.-H., Juang, J.-R. & Su, J.-Y. 2016. V3DM+: BIM interactive collaboration system for facility management. Visualization in Engineering 4(5): 1-15.
Lin, H., Storey, B. D., Oddy, M. H., Chen, C. H. & Santiago, J. G. 2004. Instability of electrokinetic microchannel flows with conductivity gradients. Physics of Fluids 16(6): 1922-1935.
Liu, D. & Garimella, S.V. 2004. Investigation of Liquid Flow in Microchannels. Journal of Thermophysics and Heat Transfer 18(1): 65-72.
Oddy, M. H., Santiago, J. G. & Mikkelsen. J. C. 2001. Electrokinetic instability micromixing. Anal. Chem. 73(24): 5822-5832.
Othman, N. T. A. & Takei, M. 2015. Application of electrical capacitance tomography for dense cross-sectional particle migration in a microchannel. Jurnal Teknologi 77(17): 85-90.
Othman, N. T. A., Obara, H. & Takei, M. 2013. Measurement of fine particles concentration in microchannel using capacitance measurement method. Japanese Journal of Multiphase Flow 27(2): 152-159.
Othman, N. T. A., Choi, J.-E., Obara, H. & Takei, M. 2012. Temporally transitional cross-sectional capacitance measurement of micro particles concentration in liquid
channel flow near the microchannel wall. Japanese Journal of Multiphase Flow 25(5): 423-434.
Rainald, L. 2008. Applied CFD Techniques: An Introduction Based on Finite Element Methods. Second edition. John Wiley & Sons Ltd.
Ralf S., Martin B., Thomas, P. & Stephan, H. 2011. Droplet based microfluidics. Reports on Progress in Physics 75 (1): 016601.
Ralph, L., Massimiliano, R., Sebastian, G. & Jerry, W. 2009. Micro-Particle Image Velocimetry (µPIV): Recent developments, applications, and guidelines. Lab on Chip 9(17): 2551-2567.
Russom, A., Gupta, A. K., Nagrath, S., Carlo, D. Di, Edd, J. F. & Toner, M. 2009. Differential inertial focusing of particles in curved low-aspect-ratio microchannels. New Journal of Physics 11(7): 075025.
Segre, G. & Silberberg, A. 1962. Behavior of Macroscopic Rigid Spheres in Poiseuille Flow: Part 1. Determination of local concentration by statistical analysis of particle passage through crossed light beams. Journal Fluid Mechanics 14(1): 115-135.
Suhas, V. P. 1980. Numerical Heat Transfer and Fluid Flow. Hemisphere Publishing Corporation.
Sundararaj, M. & Elangovan, S. 2013. Computational analysis of mixing characteristics of jets from rectangular nozzle with internal grooves. Indian Journal of Science and Technology 6(5): 4543-4548.
Thomas, A., Franke, & Achim, W. 2008. Microfluidics for miniaturized laboratories on a chip. ChemPhysChem 9(15): 2140-2156.
Wlchli, R., Brunschwiler, T., Michel, B. & Poulikakos, D. 2010. Combined local microchannel- scale CFD modeling and global chip scale network modeling for electronics cooling design. International Journal of Heat and Mass Transfer 53(5-6): 1004-1014.
Xinyu, L. & Xiangchun, X. 2015. Continuous microfluidic particle separation via elasto-inertial pinched flow fractionation. Anal. Chem. 87(12): 6389-6396.
Xu, B.H. & Yu, A.B. 1997. Numerical simulation of the gas-solid flow in a fluidized bed by combining discrete particle method with computational fluid dynamics. Chemical Engineering Science 52(16): 2785-2809
*Nur Tantiyani Ali Othman1,2, An-Najmi Bin Mohd Farid2
1 Research Centre for Sustainable Process Technology (CESPRO), 2 Programme of Chemical Engineering,Faculty of Engineering and Built Environment,Universiti Kebangsaan Malaysia, 43600, Bangi UKM, Selangor, Malaysia