132
DROUGHT MANAGEMENT PLAN REPORT Technical Report - 2008 - 023 Including Agricultural, Drought Indicators and Climate Change Aspects Water Scarcity and Droughts Expert Network

DROUGHT MANAGEMENT PLAN REPORT
Technical Report - 2008 - 023
Including Agricultural, Drought Indicators
and Climate Change Aspects Water Scarcity and Droughts Expert Network

A great deal of additional information on the European Union is available on the Internet.It can be accessed through the Europa server (http://ec.europa.eu).
Luxembourg: Office for Official Publications of the European Communities, 2007
© European Communities, 2007Reproduction is authorised provided the source is acknowledged.
Europe Direct is a service to help you find answers to your questions about the European Union
New freephone number:00 800 6 7 8 9 10 11
November 2007
Water Scarcity and Droughts Expert Network
DROUGHT MANAGEMENT PLAN REPORT
Including Agricultural, Drought Indicators and Climate Change Aspects

EXECUTIVE SUMMARY
1. PREAMBLE
Drought is a major issue for water management and environmental protection. Unsustainable water management, including water over-consumption and water pollution, as well as predicted climate change effects in droughts, could result in severe impacts on nature and society.
Inefficient management of drought and water resources could put aquatic ecosystems under higher stress. The lack of adequate water use planning leads to heavy overexploitation of rivers and reservoirs in case of drought, which jeopardizes the survival of associated fauna and flora. It is therefore essential to establish and develop measures to minimize socio-economic and environmental impacts, of drought effects in the context of the WFD. In addition to adequate measures included in the Programme of Measures of the River Basin Management Plan (RBMP) and when and where needed, a specific “Drought Management (sub) Plan-DMP-” should be developed (article 13.5 WFD) by Member States.
This report presents general guidelines to develop a Drought Management Plan, which while not an obligation to Member States, can be a powerful tool to alleviate drought impacts. The application of a DMP must in any case comply with WFD environmental objectives.
In agreement with the work previously developed by the Water Scarcity Drafting Group, the report summarizes the main items needed to develop a Drought Management Plan:
• Indicators and thresholds establishing onset, ending, and severity levels of the exceptional circumstances (prolonged drought).
• Measures to be taken in each drought phase in order to prevent deterioration of water status and to mitigate negative drought effects.
• Organizational framework to deal with drought and subsequent revision and updating of the existing drought management plan
A DMP should also include a section dedicated to 'prolonged drought' as defined in article 4.6 of WFD, which includes the following requirements:
• Prevention and restoration steps and measures for water bodies
• Measures to be taken in case of prolonged drought
• Indicators for prolonged drought
• Annual Review of the effects of prolonged droughts
Additional information on prolonged droughts will be developed under “Exemptions to the Environmental Objectives under the Water Framework Directive, Article 4(4), 4(5), and 4(6)” paper.
Two other specific chapters are dedicated to Agriculture and Groundwater and Climate Change aspects related to drought, as agriculture is the main water resources pressure in

Mediterranean countries and climate change scenarios forecasts show that global warming may worsen drought effects in Europe.
Annexes of the report compile drought measures, recent European case studies on drought management planning and indicators, research needs, agricultural saving practices and CAP principles.
2. DEFINITIONS AND CONCEPTS RELATED TO DROUGHT
Definitions
While the terms ‘water scarcity’ and ‘drought’ are commonly used interchangeably, they are quite different phenomena affected water management practices and natural causes respectively.
Water scarcity is defined as a situation where insufficient water resources are available to satisfy long-term average requirements. It refers to long-term water imbalances, where the availability is low compared to the demand for water, and means that water demand exceeds the water resources exploitable under sustainable conditions (definition stated in the Communication on water scarcity and droughts)
Droughts, on the other hand, represent relevant temporary decrease of the average water availability, refer to important deviations from the average levels of natural water availability and are considered natural phenomena. The assessment carried out in the past thirty years reveals that drought events have regularly occurred. However the duration of each event and the area and population affected have varied throughout this period.
It is not possible to control the occurrence of droughts although the resulting impacts may be mitigated to a certain degree, namely through appropriate surveillance and management strategies previously planned in a DMP.
To determine the onset of a drought event, operational definitions usually specify the degree of departure from average of the climatic variable under consideration over some time period. This is done by comparing the current situation to the historical average, often based on a 30-year record period. Operational definitions can also be used to analyse drought frequency, severity, and duration for a given historical period.
Drought is caused by a deficiency of precipitation due to different natural causes including global climatic variability and high pressure resulting in lower relative humidity and less precipitation. Drought differs from other natural disasters in its slowness of onset and its commonly lengthy duration and possible spatial difference between the deficiency of precipitation itself and the occurrence of drought. Although it is a natural hazard, drought is likely to be aggravated by Climate Change.
From crisis management to drought planning
Analysis of the drought management policies in many countries indicates that decision-makers have react to drought episodes mainly through a crisis-management approach by declaring a national or regional drought emergency programme to alleviate drought impacts,

rather than on developing comprehensive, long-term drought preparedness policies and plans of actions that may significantly reduce the risks and vulnerabilities to extreme weather events. However, in last years there are signs that drought planning is moving from a crisis management to risk management based approach.
A drought plan should provide a dynamic framework for an ongoing set of actions to prepare for, and effectively respond to drought, including: periodic reviews of the achievements and priorities; readjustment of goals, means and resources; as well as strengthening institutional arrangements, planning, and policy-making mechanisms for drought mitigation.
3. OVERVIEW OF EXISTING INDICATORS FOR DROUGHTS AND ASSOCIATED IMPACTS
The current work undertaken by the Expert Network on water scarcity and drought shows that it is complex to establish common European indicators to describe droughts and define “prolonged drought”. Due to the complexity of drought variability according to climatic and geographic conditions, it seems appropriate to work on different parameters to be included in local or national indicators, that could be calibrated and compared, when sufficient data is available. The presence or not of these parameters in local indicators will depend on their local relevance.
A first common understanding of prolonged droughts
A background information on prolonged droughts is provided in a separate document to be annexed to the “Exemptions to the Environmental Objectives under the Water Framework Directive, Article 4(4), 4(5), and 4(6)” paper. This document includes the following aspects: a first common understanding of a prolonged drought, management of a prolonged drought, drought impacts on ecology and other water uses, indicators and measures to address prolonged droughts.
As the WFD indicates in Article 4.6, the river basin authority may declare a “temporary derogation” to GES, after the following conditions have taken place:
• It is a result of natural causes or force majeure which are exceptional or which could not reasonably be foreseen and which are reviewed periodically (eg in the RBMP)
• All Practicable steps are taken to avoid further deterioration (Article 4.6(a)); • Measures taken during the prolonged drought do not compromise the recovery of
the water body after the prolonged drought and are included in the PoM (Article 4.6(c));
• Measures to restore the water body are taken as soon as reasonably practicable and are included in the next update of the River Basin Management Plan; (Article 4.6(c) and 4.6(d))
• A summary of effects of the prolonged droughts is included within the RBMP (Article 4.6(e)).
The fact that the time dimension has to be taken on board when identifying a “prolonged drought” could be explicitly shown by the word “prolonged”. However, the return period of the event should also be considered. The return period of a drought is related to the severity of the impacts. Determining the beginning, ending and affected area might become a difficult task that can be achieved by establishing adapted indicators and thresholds

In order to avoid drought effects, it is recommended that river basin authorities establish an appropriate indicator system that allows identifying the different extreme phenomenon phases, predicts possible impacts, and establishes associated measures to apply.
Examples of existing indicators used by Member States to identify and manage droughts
UK, Spain, Portugal, Finland, Italy, Netherlands and France have presented drought indicators, which could help in the future setting indicators to describe droughts and identify prolonged drought.
According to these examples, there are two main types of indicators, those that are used to prepare for an event and those, which make it possible to characterize the event when it happens. Each Member State uses the first, the second or a combination of both, according to its needs. Examples on the use of different indicators from the different Member States are reflected in Annex 3 of the DMP document.
All indicators require a complex combination of different parameters and numerous samplings and monitoring systems. They often include information on the stored volume in reservoirs, piezometric levels in aquifers, fluvial total discharge of natural precipitation patterns in representative pluviometric stations, among other variables. However, some of them look at impacts both on environmental and social terms.
These examples clearly show that drought remains a very complex phenomenon hard to evaluate and define, since it is only after a drought is over that the duration and extent of its impacts can be assessed. In addition, it occurs gradually and impacts can last for a long period of time. There is then a need for a good and complete indicator system to compare and define droughts. It is obvious that no two droughts would be the same, and their impacts will depend on their duration, intensity and location
The parameters included in this indicator system may vary from one country to another in order to integrate the specifics of different climatic and geographic conditions. The examples provided by the member states show that it is often not possible to use the single “rainfall” factor in order to identify and manage a drought.
Impacts of prolonged drought
If a “prolonged drought” allows for “temporary deterioration”, it is due to the potential impacts it can have on not reaching the Good Ecological Status (GES). This temporary failure to reach GES will influence both environmental and economic uses. When a prolonged drought is identified, temporary exemption will usually be needed. However, at the same time all possible measures to avoid damages will have to be applied. When the prolonged drought occurs, it would be important to evaluate its impacts on both environmental and socio-economic uses. This evaluation will help to determine when it will be possible to reach again the GES at local scale. Environmental impacts are very important to evaluate the failure of reaching the GES. In case of a prolonged drought, it might be impossible to completely stop all water uses, even if some restrictions are undertaken. In these cases, a clear prioritisation

of main uses should be established1 in advance. For this objective, it could be useful to have some impacts indicators such as:
• Impact on drinking water supply • Environmental impacts
mortality of fish species impacts on river banks and biodiversity (flora) loss of biodiversity in terrestrial areas depending on the aquatic system Impacts on wetlands (Natura 2000 sites) Forest fires risk ecological status
• Impacts on socio-economic uses industrial uses power production agriculture (short and long terms) tourism water rights transport
A first conclusion: the need to continue the work on indicators
A first common understanding of prolonged droughts will be addressed in a separate document to be annexed to the “Exemptions to the Environmental Objectives under the Water Framework Directive, Article 4(4), 4(5), and 4(6)” paper. Due to the state of the art today, additional work on indicators to define prolonged drought would be needed within the Water Scarcity and Droughts expert network.
4. DROUGHT MANAGEMENT PLAN FRAMEWORK
Basis and framework of Drought Management Plans
Drought management is an essential element of water resources policy and strategies in EU but especially in drought prone areas, for instance in Mediterranean basins. Drought Management Plans (DMP) should be prepared in advance before they are needed, based on relevant country specific legislation and after careful studies are carried out concerning the characterization of the drought in the basin, its effect and the mitigation measures.
DMP are closely linked with Water Framework Directive (WFD) criteria and objectives. The purpose of the WFD is to enhance the protection of water bodies and the status of aquatic ecosystems by promoting sustainable water use. The WFD places the integrity of freshwater ecosystems at the core of water management. Measures to prevent and alleviate drought consequences and water scarcity are thereby entirely appropriate within its context.
The scale for applying the DMP within the WFD framework should be the river basin or a sub-basin that makes a management system. In agreement with this, the appropriate entity to promote this plan is the one in charge of the river basin.
1 See also the Communication 'Addressing the challenge of water scarcity and droughts in the European Union' (COM(2007) 414)

Drought management in transboundary basins
Drought management plans should include cross-border coordination in transboundary basins with public participation decision processes. Regarding transboundary basins, the defined system should be coherent with those indicators established for the affected basins, and compatible with management practices included in international agreements and established exemption conditions.
Drought management plans objectives
The main objective of drought management plans is to minimize the adverse impacts on the economy, social life and environment when drought appears. It also aims at extending WFD criteria and objectives to realize drought management.
This general objective can be developed through a series of specific objectives that might include:
• Guarantee water availability in sufficient quantities to meet essential human needs to ensure population’s health and life.
• Avoid or minimize negative drought impacts on the status of water bodies, especially on ecological flows and quantitative status for groundwater and in particular, in case of prolonged drought, as stated in article 4.6. of the WFD.
• Minimize negative effects on economic activities, according to the priority given to established uses in the River Basin Management Plans, in the linked plans and strategies (e.g. land use planning).
Multilevel approach
Drought planning should be developed at different levels and linked to the River Basin Management Plan (RBMP):
At national level, focus should be put in policy, legal and institutional aspects, as well as in funding aspects to mitigate extreme drought effects. National level measures should determine drought on-set conditions through a network of global indices and indicators at the national or regional level global basin indices/indicators network, which for instance can activate drought decrees for emergency measures with legal constraints or specific budget application.
Drought Management Plans (DMP) at river basin level are contingency management plans supplementary to River Basin Management Plans. DMPs are mainly targeted to identify and schedule on-set activation tactical measures to delay and mitigate the impacts of drought. River Basin Management Plans have to include a summary of the programmes of measures in order to achieve the environmental objectives (article 4 of WFD) and may be supplemented by the production of more detailed programmes and management plans (e.g. DMPs) for issues dealing with particular aspects of water management.
At local level, tactical and response measures to meet and guarantee essential public water supply as well as awareness measures are the main issues.

This document mainly deals with Drought Management Plans (DMP) at the river basin level, but local and national measures might be necessary depending on the Member State affected by drought episodes, and in any case, the coordination of the different competent authorities at all levels will be needed to guarantee its objectives.
Possible basic elements and content of drought management plans
In order to achieve the specific DMP objectives, three basic elements should support a DMP: 1) a drought early warning system, 2) drought indicators correlation with thresholds for different stages of drought as it intensifies and recedes and 3) measures to achieve specific objectives in each drought phase. In the development of the DMP, it is necessary to ensure transparency and public participation.
A possible content for the documents integrating the DMP may include
• General basin characterisation under drought conditions
• The river basin’s experience on historical droughts
• Characterization of droughts within the basin
• Drought warning system implementation
• Program of measures for preventing and mitigating droughts linked to indicators systems.
• Organizational structure of the DMP (identification of competent entity, committee or working group to identify drought impacts and propose management measures)
• Update and follow-up of the DMP
• Public supply specific plans
• Prolonged drought management. Where appropriate, a section should be dedicated to 'prolonged drought' as required in article 4.6.
The degree of development of the above-mentioned contents will depend on the specificities of the basin (or sub-basin) and on the information provided and its degree of development within the river basin management plan. In addition to the DMP, a strategic environmental assessment (SEA) may be necessary to complement the DMP.
The content of drought management plans must in any case respect all WFD requirements including all conditions set in articles 4.4, 4.5, 4.6, 4.7 and 9.
Early warning Indicators system and thresholds definition
One of the main objectives of the DMP is establishing a reliable early warning system based on hydrological indicators, easy to obtain and representative of the spatial and temporal situation of drought that allows drought on-set identification, control and assess their severity.
It is convenient that the indicators system is hydrological, so it can characterize hydrological droughts, because DMP deals with the decision making process regarding the river basin water resources management under drought conditions.

Some of the indicators that can be used to identify and manage droughts are combinations of:
• Stored surface reservoir volumes
• Aquifer water levels
• River flows
• Reservoir outflows
• Precipitation (in representative control points)
• Snow reserves (for areas in which these are significant)
• Indicators from quality and environmental networks
To obtain an indicators system and determine representative indicators, it is necessary to select, aggregate and weight basic indicators based on the associated resources and demands. Finally, the calibration of indicators through historical series, allows adjusting the weights given to each indicator, and obtaining an aggregated group of indicators, suitable for and representative of the basin. Summary global basin indicators can also serve to establish national indicator systems, since they are representative of the each basin situation.
Indicators could be normalised in an appropriate threshold, e.g. from 0 to 1, to allow easy comparisons among different kind of indicators and the classification among severity drought categories. This classification, and colour association, can be for example: Normal status (green), Pre-alert status (yellow), Alert status (orange), Emergency or extreme status (red).
The selection of threshold values for this classification should take into account that its main objective will be to progressively integrate measures and actions during drought events.
Regarding transboundary basins, the defined system should be coherent with those indicators established for the affected basins, and compatible with management practices included in international agreements and established exemption conditions.
The definition of an indicator for all the EU countries necessarily implies reaching a common measuring system, built up on available data and representing a simple concept. In the case of droughts, precipitation can be an easily applicable indicator. In order to be representative of each European region, moving average precipitation could be tried and adjusted to Member States natural systems.
5. PROGRAMME OF MEASURES ASSOCIATED TO THE DROUGHT MANAGEMENT PLAN
Classification of mitigation measures
Measures to be taken during hydrological droughts can be grouped as follows:

Preventative or strategic measures are developed and used under the normal status. They belong to the hydrological planning domain and their main objective is reinforcing the structural system to increase its response capacity (to meet supply guarantees and environmental requirements) towards droughts. These are measures to be taken in RBMP.
Operational (tactical) measures, are those that are typically applied when droughts occur (during pre-alert and alert statuses). These are mainly control and information measures in pre-alert and conservation resources measures. If the drought is prolonged excessively, the status of water resources can deteriorate to a point in which emergency operational measures might be needed, consisting essentially of applying water restrictions. Severe Water conservation measures and restrictions, to be adopted if drought worsens to extreme status, should be ranked according to parameters such as: priorities among different uses, environmental requirements, status of drought etc.
Organizational measures, establish competent agents and an appropriate organization to develop and follow-up the DMP; create coordination protocols among administrations and public and private entities directly linked to the problem, in particular to those entities in charge of public supply
Follow-up measures serve in the process of watching out for the compliance and application of the DMP and its effects.
Finally, restoration or exit drought measures include the deactivation of adopted measures and the activation of restoration ones over the water resources effects and the aquatic ecosystem.
Identification and structure of program of measures according to indicators status
The program of measures should be adapted according to the drought status obtained through the indicators system. For example, under the 4-stage classification below:
• Normal status: this phase should be seen as the hydrological planning one, in which strategic and long-term measures are applied. These measures concern water demand management (water efficiency measures) and might include hydraulic infrastructures for improving the storage and regulation capacity of the river basin, infrastructures that promote the use of non-conventional resources (e.g. treatment and reuse facilities) and any other measures that might need extended time frames to be implemented.
• Pre-alert status: the objective is to prevent the deterioration of water bodies while ensuring the activation of specific drought management measures, and continuing to meet water demands. These are mainly informative and control measures, as well as voluntary water saving measures.
• Alert status: it is an intensification of the pre-alert status, since drought progresses as well as measures to apply. It is a priority to continue preventing the deterioration of water bodies status. These types of measures should be focused on saving water. Demand restrictions might be applied, depending on the socio-economic impacts, and by consensus of the affected stakeholders. Areas with high ecological value should be monitored more intensively to prevent their deterioration,
• Emergency or extreme status: when all previous prevention measures have been applied, but the drought situation prevails to a critical status, when no water

resources are sufficient for the essential demands (even affecting and restricting public supply), additional measures might be used to minimize impacts on water bodies and ecological impacts.
From this status to the normal one, during drought recovery, measures should be applied to ensure a restoration of water ecosystems as quickly as possible. Effects of prolonged droughts might cause the possibility of applying temporary derogations of WFD’s requirements.
6. DROUGHT PLAN MONITORING
A critical component within drought management is the continuous observation and evaluation of the development of a drought event. In fact, in order to detect the onset of a drought, crucial variables of the basin’s water balance should be permanently monitored, not only within a drought situation.
Proper water resources management needs permanent collection, storing and processing of data related to precipitation, river flows, dam inflows and outflows, change of water levels in dams reservoirs and aquifers, evaporation, hydro chemical and biological elements.
The monitoring programmes set up by Member States according to WFD requirements should be used to provide data for the management of drought.
A continuous forecast of the expected water resources, evaluation of water demands and improving the effectiveness of water use and mitigation measures will be essential to develop the DMP. Monitoring mechanisms should be used to decide, if the drought response plan is having its intended effect, and to provide the required information needed to evaluate the performance of the drought management plan in alleviating the effects of drought.
7. STRATEGIC ENVIRONMENTAL ASSESSMENT
Convenience of DMP SEA
Drought Management Plans fall within the scope of the SEA Directive if they can adversely affect Natura 2000 sites. Other significant effects on the environment are temporary water status deterioration under prolonged drought. Therefore, as drought is a major cause of stress for natural habitats and can be responsible of temporary water status deterioration, and as active public participation, an inherent task of SEA process, is desirable in DMP approval, it may be convenient to carry out a SEA of Drought Management Plans.
The objective of the Strategic Environmental Assessment (SEA) is to assess possible significant effects on the environment that can occur when a DMP is applied. The SEA process is used in order to achieve an environmental integration, taking into account its objectives and the territorial scope.
Environmental vulnerable elements identification and monitoring

During drought, a decrease in water inputs might endanger the minimum flows needed to preserve valuable natural areas and their ecosystems. In addition, the decrease in water flows can translate into lower quality also affecting associated biological elements. It is recommended that actions and measures that guarantee minimum flows are established, with specific physic-chemical characteristics, to ensure the survival of flora and fauna in these areas.
Once high ecological value areas have been identified, associated water bodies could be identified to facilitate the follow-up of their status. To achieve this assessment, variables evolution can be measured, such as river flows, physico-chemical parameters, and biological indicators.
Environmental mitigation measures and monitoring
As a general criterion, environmental objectives and limitations included in the River Basin Management Plan should be respected. These may include ecological flows, groundwater inputs to wetlands, maximum aquifer abstractions, aquifer and reservoir levels of maintenance, or volumes flowing to the sea. In accordance with this, a surveillance plan should be established to monitor these ecosystems, and to develop water characteristics condition control for flows and quality. This is the objective of the monitoring system promoted by the WFD. In the case of ecosystems linked to surface water, the surveillance plan should allow controlling the ecological and quantitative status through different variables such as: river flows, physic-chemical parameters, and biological indicators.
The surveillance plan can produce a better control and follow-up of those water bodies linked to especially vulnerable areas, and assess the effects on associated ecosystems during droughts.
Public information and Active public participation
Public information and consultation strategies need to be considered as public participation processes, to transmit the planning and mitigation measures considered in a DMP. It is important as well, to foster public participation during the elaboration of the plan to obtain different stakeholders opinions, prior to the decision-making process, being able to influence in the final decision process.
Active participation processes represent an opportunity to achieve the involvement of all necessary stakeholders for the appropriate functioning of the participation process and solve differences between interested parties early enough in the DMP process. These processes contribute to achieving the optimum sustainable equilibrium, considering social, economic and environmental aspects and facilitating the continuation, in the long-term, of the decision-making by consensus.
8. RELATED ISSUES: AGRICULTURE AND GROUNDWATER
Half of the European Union's land is farmed. This fact alone highlights the importance of farming for EU environment. Furthermore, agriculture is the most water-demanding sector: total water abstraction for irrigation in Europe is around 105.000 Hm3/year (about 55%), while the total water use for public water supply purpose is about 53.000 Hm3/year (27%) and the water use for industry is about 34.000 Hm3/year. The high rate of abstraction and

consumption means that agriculture is heavily affected by the variation of surface water and groundwater availability. On one hand, agriculture is a Driving Force: the high water demand for irrigation contributes significantly to determine water imbalances, especially in the southern/Mediterranean Regions. On the other hand, agriculture can be seriously affected by prolonged or frequent drought events, which can determine high economic impacts due to losses in yields, insect infestations, plant diseases and wind erosion.
The strong link between water quantity issues and agriculture, especially in areas affected by drought and/or water imbalances, requires a deep investigation and a complete characterisation of the problem, in order to define a common and integrated baseline between agricultural policies and water scarcity management.
CAP and water quantity management
CAP offers a variety of instruments, which can be used to counterbalance adverse climate effects although the CAP is primarily designed to support farmers' income or structural change in the agriculture sector and the broader rural economy.
Rural development policy in particular offers a number of measures related directly or indirectly to water issues, such as support to irrigation plans, infrastructure modernisation and incentives for water savings, or preventive measures and restoration after natural disasters. While climate change is not their primary driver, these measures could help to reduce vulnerability and facilitate adaptation to climate change.
Funding through the CAP rural development policy has been applied in a number of ways to help address drought and water scarcity issues. National examples from Cyprus, Finland, Slovenia, Italy, France, Spain and Portugal focussed on maintaining and improving security of supply (including enhancing efficiency) and, more specifically, reducing pressures on water supplies.
A number of Member States (including Cyprus and Portugal) note that, while rural development measures are valuable, they cannot solve all the problems. These funds are not focused on water scarcity and droughts. Member States themselves have numerous priorities and do not always address water demand management measures first. In addition, payments are often under the second (optional) funding pillar of CAP and are dependent on uptake by farmers and other stakeholders.
Programme of measures and rural development programmes
European policies on water and agriculture foresee two different implementation programmes: the Programme of Measures (for the water resources management, requested under WFD art. 11) and the Rural Development Programme (for the CAP). The achievement of a good water quality requires coordination between the two programmes in order to create synergies between the proposed measures.
Supply-side measures may include the preservation of the functioning of natural catchments and aquifers, the restoration and improvement of existing water infrastructures (substitution of gravity irrigation systems with pressure ones, for example) and the setting up of conditions which need to be respected prior to water uses.
Demand-side measures may include the promotion of subsidies (this measures shall be strictly coordinated with CAP), the reduction of leakages in water networks, the improvement

of agricultural management, the use of appropriate pricing policies and the promotion of educational campaigns.
In order to support the definition of agricultural measures aimed to maximise water use efficiency and to support their inclusion in PoMs and Contingency Plans, a list of “Potential Measures” could be appropriate. These measures should address the objective of improving the efficiency of water resource management for agriculture, assuring water and energy saving and hydrogeologic protection of the territory, also through the adaptation and the modernization of infrastructures for irrigation, and the reduction of the environmental impact as much as possible. These measures shall be coordinated with the measures designed to reduce water pollution from agricultural activities.
Groundwater
Groundwater resources represent more than 21% of total renewable resources in Mediterranean countries, and agriculture is by far the largest user of groundwater in the region.
Drought impacts on groundwater, both direct and indirect, are generally less evident than impacts on surface waters but not necessarily less damaging. Direct drought direct impacts on groundwater include, among others: less effective rainfall intensity and less river discharge. These result in indirect impacts, including less groundwater recharge and possibility of seawater intrusion in coastal aquifers.
Aquifers can be considered potential seasonal and/or long-term storage reservoirs, along with serving as conveyance media. Groundwater storage can be one of the best ways of making up for seasonal and long-term deficits in surface water. The storage capacity of a groundwater reservoir basin is analogous to the storage capacity of a surface reservoir, without or with minor loss of water evaporation. Groundwater can be pumped locally, irrespective of the recharge locations. Therefore, groundwater can be considered as a basic aid to increase water availability under drought.
It is important to make an appropriate groundwater monitoring during the periods of normality in order to study the capacity of recovery of the aquifers and the possible affections to the quality of groundwater,
To make the role of groundwater efficient along with ensuring its sustainability, especially under drought conditions, appropriate studies should be developed including: an updated assessment of groundwater potential under normal and drought conditions, inventory of groundwater vulnerability to pollution, a set of strategies for groundwater augmentation, including recharge with conventional and non-conventional water, based on the results of experimental plots, predictions concerning the impact of groundwater management strategies on the environment, including other water bodies, changes in groundwater quality, cost of water and social acceptance of low quality water. In any case, the definition of available groundwater resources of the WFD (article 2) needs to be taken into account and the compliance with the environmental objectives should be met.
9. RELATED ISSUES: CLIMATE CHANGE
Effects of climate change on droughts and their inter-relation

The IPCC (Intergovernmental Panel on Climate Change) Working Group in its forth evaluation inform, document for Europe and the Green Paper “Adapting to climate change in Europe – options for EU action” of the EC from 2007 affirms that climate change effects in Europe and Arctic region are already significant and measurable.
Regarding factors directly related to drought and its management it is expected that hydrological stress will increase in centre and southern Europe, the volume of certain rivers may diminish up to 80% during summer seasons and reservoirs will lose resources due to the decrease of rainfall. Additional predicted impacts include reductions in the hydroelectric potential of Europe, migration of beaches towards the continent, with losses of coastal wetlands and reduce availability of habitats for many species. Similarly, coastal aquifers will be greatly affected due to marine intrusion. In addition, numerous ephemeral aquatic ecosystems in the Mediterranean region will disappear and permanent ones will reduce in size.
Adaptation actions and strategies will need to be taken to face predicted impacts. An example of adaptation related to droughts would be the use of more tolerant or dry-conditions adapted crops. Likewise, there is a need to consider climatic change in hydrological planning strategies and assess its direct effects on demands, available water resources and ecological status of water bodies.

DROUGHT MANAGEMENT PLAN REPORT
_____________________________________________________________________
Table of Contents MAIN ACRONYMS USED IN THE REPORT ..........................................................................1
1. PREAMBLE .........................................................................................................................2
2. DEFINITIONS AND CONCEPTS RELATED TO DROUGHT..............................................4
2.1. DROUGHT DEFINITIONS....................................................................................................4
2.2. DROUGHT NATURAL CAUSES............................................................................................5
2.3. DROUGHT EFFECTS DUE TO GLOBAL CLIMATE CHANGE......................................................6
2.4. TEMPORARY WATER DEFICIENCY, NOT LONG-TERM IMBALANCES .......................................6
2.5. FROM CRISIS MANAGEMENT TO DROUGHT PLANNING.........................................................8
3. OVERVIEW OF EXISTING INDICATORS FOR DROUGHTS AND ASSOCIATED IMPACTS .................................................................................................................................9
3.1 COMMON UNDERSTANDING OF PROLONGED DROUGHTS.....................................................9
3.2 INDICATORS RELATED “PROLONGED DROUGHTS” .............................................................10
3.3.2 Examples of parameters used by Member States to identify and manage droughts.......... 12
3.3.3 Research Program............................................................................................................... 16
3.4 ENVIRONMENTAL AND SOCIO-ECONOMIC IMPACTS OF “PROLONGED DROUGHT”.................17
4. DROUGHT MANAGEMENT PLAN FRAMEWORK ..........................................................19
4.1. BASIS AND FRAMEWORK OF DROUGHT MANAGEMENT PLANS..........................................19
4.2. DROUGHT MANAGEMENT IN TRANSBOUNDARY BASINS.....................................................20
4.3. DROUGHT MANAGEMENT PLANS OBJECTIVES AND APPLICATION LEVELS...........................22
4.4. CONTENT OF DROUGHT MANAGEMENT PLANS.................................................................23

4.5. BASIN AND ENVIRONMENTAL ELEMENTS CHARACTERIZATION...........................................24
4.6. BASIN’S EXPERIENCE ON HISTORICAL DROUGHTS ...........................................................25
4.7. BASIN’S DROUGHTS CHARACTERIZATION ........................................................................25
4.8. DROUGHT WARNING SYSTEMS .......................................................................................26
4.9. PUBLIC SUPPLY SYSTEMS VULNERABLE TO DROUGHTS ...................................................27
5. PROGRAM OF MEASURES ASSOCIATED WITH THE DROUGHT MANAGEMENT PLAN......................................................................................................................................28
5.1. CLASSIFICATION OF MITIGATION MEASURES....................................................................28
5.2. IDENTIFICATION AND STRUCTURE OF PROGRAM OF MEASURES ACCORDING TO INDICATORS STATUS................................................................................................................................30
6. DROUGHT PLAN MONITORING ......................................................................................31
6.1. ESTABLISHMENT OF DROUGHT MANAGEMENT ORGANISATIONAL STRUCTURE .................31
6.2. CONTINUOUS MONITORING OF WATER STATUS AND DMP APPLICATION............................31
6.3. CONTINUOUS FORECAST OF THE EXPECTED WATER RESOURCES ....................................32
6.4. CONTINUOUS EVALUATION OF WATER DEMANDS .............................................................32
6.5. IMPROVING THE EFFECTIVENESS OF WATER USE AND MITIGATION MEASURES ..................33
7. STRATEGIC ENVIRONMENTAL ASSESSMENT ............................................................33
7.1. LEGAL FRAMEWORK ......................................................................................................33
7.2. SEA OBJECTIVES AND ENVIRONMENTAL REPORT CONTENT ............................................34
7.3. ENVIRONMENTAL VULNERABLE ELEMENTS IDENTIFICATION..............................................35
7.4. ENVIRONMENTAL MITIGATION AND MONITORING MEASURES.............................................37
7.5. ENVIRONMENTAL MONITORING.......................................................................................38
7.6. PUBLIC INFORMATION ....................................................................................................39
7.7. ACTIVE PUBLIC PARTICIPATION.......................................................................................39
8. RELATED ISSUES: AGRICULTURE AND GROUNDWATER.........................................40
8.1. INTRODUCTION..............................................................................................................40
8.2. CAP AND WATER QUANTITY MANAGEMENT .....................................................................41
8.3. PROGRAMME OF MEASURES AND RURAL DEVELOPMENT PROGRAMMES ...........................42
8.4. POTENTIAL MEASURES CATALOGUE................................................................................43
8.5 GROUNDWATER .............................................................................................................47
9. RELATED ISSUES: CLIMATE CHANGE .........................................................................49
10. MAIN CONCLUSIONS.....................................................................................................52
REFERENCES.......................................................................................................................57
ANNEXES..............................................................................................................................59
A 1.TABLE OF MEASURES TO CONSIDER IN A DMP................................................................59
A 2. DROUGHT MANAGEMENT PLANS IN MEMBER STATES .....................................................63
Drought management in Spain ..................................................................................................... 63
Drought planning in England and Wales ...................................................................................... 65
Drought Management in Portugal................................................................................................. 68
Other experiences......................................................................................................................... 72
A 3. EXAMPLES ON DROUGHT INDICATORS SYSTEMS .............................................................73
UK Experience.............................................................................................................................. 73
Spanish Experience...................................................................................................................... 76
Portuguese Experience ................................................................................................................ 79
French Experience........................................................................................................................ 83
Finnish Experience ....................................................................................................................... 87
Experience of the Netherlands ..................................................................................................... 89
Italian Experience ......................................................................................................................... 92
A.4. NEED FOR ADVANCES IN DROUGHT RESEARCH...............................................................97
A.5. FUNDING THROUGH CAP...............................................................................................99

A.6. CASE STUDIES ON AGRICULTURAL MEASURES ..............................................................100
A.7 GROUND WATER SYSTEM MANAGEMENT CASE STUDY....................................................105
A.8. LIST OF MEMBERS OF THE WATER SCARCITY AND DROUGHTS EXPERT NETWORK.........107
DISCLAIMER
This technical document has been developed through a collaborative programme involving the European Commission, all the Member States, the Accession Countries, Norway and other stakeholders and Non-Governmental Organisations. The document should be regarded as presenting an informal consensus position on best practice agreed by all partners. However, the document does not necessarily represent the official, formal position of any of the partners. Hence, the views expressed in the document do not necessarily represent the views of the European Commission.

DROUGHT MANAGEMENT PLAN REPORT
1
Main acronyms used in the report CAP Common Agricultural Policy DMP Drought Management Report EUWI Water Initiative of the European Union GES Good Ecological Status IPCC Intergovernmental Panel on Climate Change IWRM Integrated Water Resources Management MED JP Mediterranean Joint Process PoM Program of Measures (of the River Basin Management Plan) RBMP River Basin Management Plan RBA River Basin Authority RD Rural Development SEA Strategic Environmental Assessment WFD Water Framework Directive WRMS Water Resources Management Systems

DROUGHT MANAGEMENT PLAN REPORT
2
1. PREAMBLE
Drought is a major issue for water management and environmental protection. Unsustainable water management, including water over-consumption and water pollution, as well as predicted climate change effects in droughts, could result in severe impacts on nature and society.
The environmental objectives of the Water Framework Directive (WFD) are the core of the EU legislation providing for a long-term sustainable water management based on a high level of protection of the aquatic environment. The stated goal in the WFD is aiming to achieve the environmental objectives by 2015, including the achievement of “good ecological status” (GES) in all European water bodies. Drought episodes can greatly affect the availability of water resources and impact the status of water bodies and associated ecosystems, which needs to be avoided by all means.
Analyses of drought management policies in some countries today indicate that decision-makers usually react to drought episodes through a crisis-management approach by declaring a national or regional drought emergency programme to alleviate drought impacts, rather than developing comprehensive, long-term drought preparedness policies and plans of actions that may significantly reduce the vulnerabilities to extreme weather events. Drought planning is nowadays evolving to risk management and a new approach to drought management is needed.
Inefficient management of drought and water resources put aquatic ecosystems under higher stress. The lack of adequate water use planning leads to heavy overexploitation of rivers and reservoirs in case of drought, which jeopardizes the survival of associated fauna and flora. It is therefore essential to establish and develop measures to minimize socio-economic and environmental impacts, prevent and alleviate drought effects in the context of the WFD. Therefore, in addition to adequate measures included in the Programme of Measures of the River Basin Management Plan (RBMP) and when and where needed, a specific “Drought Management (sub) Plan (DMP)” should be developed (article 13.5 WFD) by Member States.
This report presents general guidelines to develop a Drought Management Plan, which while not an obligation to Member States, can be a powerful tool to alleviate drought impacts. The application of a DMP must, in any case, comply with WFD environmental objectives.
This report will identify ways to address drought episodes mainly based on the following principles:
• Developing comprehensive long-term water resources policies and action plans may significantly decrease the risks associated with extreme weather events, reducing vulnerability and increasing resilience to drought
• Developing strategies that include both prevention measures – to reduce the risk and effects of uncertainty- and mitigation measures strategies - to limit the

DROUGHT MANAGEMENT PLAN REPORT
3
adverse impacts of hazards-
• Requiring a proactive management by developing actions planned in advance, which involve modification of infrastructures, laws and institutional agreements and the improvement of public awareness
• Including, within the management strategy, sufficient capacity for contingency planning before the onset of drought, and appropriate policies to reduce vulnerability and increase resilience to drought. Effective information and early warning systems are the foundation for effective drought plans, as well as effective networking and coordination between competent authorities in water management
• Achieving a water management strategy which aims to reduce likelihood of adverse inputs of droughts
There is also a need to coordinate drought-related activities, such as forecasting, monitoring, impact assessment, response and recovery estimation and planning. Water policies should incorporate incentives for all drought-prone regions to develop plans that promote a more proactive, anticipatory approach to drought management. Lessons learnt from previous drought response attempts need to be documented, evaluated and shared at all levels of government through post-drought reports.
The WFD provides the legislative framework to develop these policies. Therefore, DMPs should address drought impacts and establish clear and objective thresholds to implement exceptional circumstances related to indicator systems. As the WFD dictates in article 4 paragraph 6, “temporary deterioration in the status of water bodies shall not be in breach of the requirements of the Directive when resulting from natural or force majeure cause, or in case of a reasonably unpredictable event such as “exceptional floods” or “prolonged droughts”, or due to reasonably unforeseeable accidents, when all of the established WFD conditions have been met”. The conditions under which circumstances are exceptional or could not reasonably have been foreseen, have to be stated including the adoption of the appropriate indicators and included in the RBMP. These aspects will be further discussed in Chapter 2, but already indicate the importance of identifying, managing and anticipating droughts.
Key elements of the DMP approach include the following:
• Establish pre-planned measures, as a strategy to mitigate negative drought effects. The plan should include appropriate indicators and establish thresholds to progressively initiate the actions.
• Link Plans to WFD objectives and incorporate them into RBMPs as sub-parts or complementary plans.
The DMP should include:

DROUGHT MANAGEMENT PLAN REPORT
4
o Indicators and thresholds establishing onset, ending, and severity levels of exceptional circumstances (prolonged droughts), and definitions of drought status (e.g. normal, pre-alert, alert and emergency). In addition, thresholds of statuses should be defined.
o Measures to be taken in each drought phase in order to prevent deterioration of water status.
o Summary of effects and measures taken and subsequent revision and updating of the existing drought management plan
A section dedicated to 'prolonged drought' as defined in article 4.6 of the WFD which includes its requirement (more details on this issue are provided in the Exemptions Paper currently under preparation): Prevention and restoration steps and measures for water bodies; Measures to be taken in case of prolonged drought; Indicators for prolonged drought; Annual review of the effects of prolonged droughts
A Drought Management Plan should have an integrated approach and should answer the question of how the available water should be allocated among the different uses during droughts. The public should be consulted on this plan along the same lines as for the RBMP.
The following chapters, in agreement with the work previously developed by the Water Scarcity Drafting Group, summarize the main items and actions needed to develop a Drought Management Plan by relevant water competent authorities.
2. DEFINITIONS AND CONCEPTS RELATED TO DROUGHT
2.1. Drought definitions
While water scarcity and droughts are commonly used interchangeably, they are quite different phenomena affected by water management practices and natural causes respectively.
Water scarcity is defined as a situation where insufficient water resources are available to satisfy long-term average requirements. It refers to long-term water imbalances, where the availability of water is low compared to the demand for water, and means that water demand exceeds the water resources exploitable under sustainable conditions.
Droughts, on the other hand, represent relevant temporary decrease of the average water availability, and are considered natural phenomena. The assessment carried out in the past thirty years reveals that drought events have regularly occurred. However, the duration of each event, the area and population affected, and the extent to which that population is affected, have varied throughout this period.

DROUGHT MANAGEMENT PLAN REPORT
5
In this context, hydrological drought refers to deficiencies in surface and groundwater water supplies, and it is determined from measurements of stream flows and lake, reservoir, and groundwater levels. There is a time lag between the lack of precipitation and decreased water levels in streams, rivers, lakes, and reservoirs; accordingly, hydrological measurements are not the first indicators of a drought event. However, they reflect the consequences of reduced precipitation over an extended period of time, taking into account the effects on soil and vegetation. As another consequence, the end of a hydrological drought might be lagging behind the end of the corresponding meteorological drought, as considerable quantities of precipitation are required to restore river and lake levels back to their normal conditions.
To determine the onset of a drought event, operational definitions usually specify the degree of departure from average of the climatic variable under consideration over some time period. This is done by comparing the current situation to the historical average; it can be based, for example, on a 30-year record period. Operational definitions can also be used to analyse drought frequency, severity, and duration for a given historical period.
Since it is in a hydrological drought, where variations in managed water systems can be clearly identified, its characterization is taken as the basis to develop a comprehensive DMP.
2.2. Drought natural causes
Drought differs from other natural disasters in its slowness of onset, its commonly lengthy duration and possible spatial differences between the deficiency of precipitation itself and the occurrence of a drought. Drought is caused by a deficiency of precipitation due to different natural causes including global climatic variability and high pressure, which inhibits cloud formation and results in lower relative humidity and less precipitation. Extended droughts occur when large-scale anomalies in atmospheric circulation patterns persist for months, seasons, or even longer. An attempt to establish a common understanding of this concept is later stated in Chapter 3.
Other natural causes that characterize droughts are localized dry wind subsidence areas, induced by mountain barriers or other physiographic features, and known as the rain shadow effect, absence of rainmaking disturbances as cyclonic disturbances that bring the rains of winter or absence of humid airstreams.
Precipitation anomalies are a naturally recurring feature of the global weather, being altered by climate change effects, and can affect various components of the hydrological cycle to produce a drought. Climatologies of precipitation, temperature, and atmospheric moisture provide an indication of the frequency and intensity of precipitation, the correlation of precipitation and temperature, and the atmospheric drying that occurs during droughts.
Shifts in atmospheric circulation, which cause drought, may extend for time scales of a month, a season, several years or even a century. The latter might be termed as a climatic shift, but the effect on humans and their environment is equally great. Because of the economic and environmental importance of droughts, determined efforts are being made to solve the problem of predicting the atmospheric circulation patterns that produce them. Empirical studies conducted over the past century have shown that meteorological drought is never the result of a single cause but the result of many, often synergistic in nature.
DROUGHT MANAGEMENT PLAN REPORT
6
2.3. Drought effects due to global climate change
There is a great deal of debate regarding global climate change and its expected results. Patterns and trends show that its effects will ultimately affect water resources availability and thus have an impact on water ecosystems.
The consensus is that the effect will accentuate the extremes with more pronounced droughts and more severe flooding. If it persists, climatic zones are likely to migrate, leaving the climate of some regions dryer, others wetter, and all more variable and unpredictable (Schaer et al. 2004). Certain regions dependent on water (e.g. major farming areas, or large population centres) will experience more water scarcity, while others will become more humid. It is an open question what the net effect on water supply will be, but in any case there will be transitional and frictional costs in regions that will become drier.
The observed changes in precipitation rates over Europe in the 20th century follow the general hemispheric trend of increasing precipitation at mid and high latitudes and decreasing precipitation in the subtropics. The observations show a strong decadal variation in drought frequency. Analyses show that the anthropogenic influence on projected temperature changes tends to be more significantly different from natural variations than the anthropogenic influence on precipitation changes.
General inputs from different studies on climate change and its impacts on water resources and droughts are later summarized on Chapter 9.
2.4. Temporary water deficiency, not long-term imbalances
Drought is a naturally occurring phenomenon and a normal part of variability of the usual meteorological conditions, according with the climate characteristics. As a natural hazard, the consequences for drought vary between different countries according to their degree of exposure to aridity, and their drought management policies.
Nevertheless, nothing can be done to reduce the recurrence of drought events in a region. Therefore, drought management should not be regarded as managing a temporary crisis. Rather, it should be seen as a risk management process that places emphasis on monitoring and managing emerging stress conditions and other hazards associated with climate variability in the focus region, within a framework of long term water resources management planning.
Permanent water deficiencies are related, in accordance to Vlachos (1983), with natural aridity or desertification if aridity is aggravated by human pressure, while temporary water imbalances deals with natural drought or with water shortages when drought drifts worse due to human impacts as reflected in figure 1.

DROUGHT MANAGEMENT PLAN REPORT
7
Drought Aridity(and Deserts)
Man
–mad
eN
atur
al
PRO
CES
S (e
nvir
onm
enta
ltra
nsfo
rmat
ion)
PermanentDeficiencies
TemporaryWater Imbalances
CONTEXT
Water Shortages Desertification
Drought Aridity(and Deserts)
Man
–mad
eN
atur
al
PRO
CES
S (e
nvir
onm
enta
ltra
nsfo
rmat
ion)
PermanentDeficiencies
TemporaryWater Imbalances
CONTEXT
Water Shortages DesertificationWater Shortages Desertification
Figure 1: Typology of water stress condition (Vlachos, 1983)
It is also important to differentiate between transitory or temporary periods of water deficiency, a cause of exceptional droughts, and long-term imbalances of available water resources and demands, as reflected in figure 2.
Figure 2: Permanent or temporary water deficit
When it is said that a Water Resources Management System (WRMS) is able to meet a set

DROUGHT MANAGEMENT PLAN REPORT
8
of demands, according to defined reliability criteria, we are implicitly accepting a certain probability of failure to satisfy fully the total water supply that is theoretically required. The margin of accepted failure is limited by guaranteed criteria. When this happens, it is necessary to carry out transitory measures as defined in Drought Management Plans. In other cases, the WRMS cannot be considered as sufficient and produces a permanent deficit presenting water scarcity. Hence, it is necessary to balance the offer of available resources and water demands on a medium- or long- term basis. Further description on water scarcity and droughts, and their impact on the EU can be found on the interim report developed by the CE “Water Scarcity and Drought In-depth Assessment, Second Interim Report” validated by the Water Directors on June 2006,
Drought is a complex phenomenon that involves social, economic and environmental aspects, and water managers can encounter essential problems as how to define the phenomenon’s phases and severity, or how to establish appropriate indicators that point out which measures should be applied. This report focuses on drought management in the context of water resources planning, and the use of Drought Management Plans with specific measures as essential tools to cope with drought impacts. Therefore, it provides general recommendations, based on existing experiences from Member States, but specificities, e.g. river basin characteristics, or climatic variations, will need to be taken into account to better adapt the DMP to each case.
2.5. From crisis management to drought planning
Analysis of drought management policies indicates that often decision-makers react to drought episodes mainly through a crisis-management approach, rather than on developing comprehensive, long-term drought preparedness policies and plans. Drought planning requires a focus on risk management to reduce socio-economic and environmental impacts, and DMPs can represent important instruments to achieve this.
A DMP should provide a dynamic framework for an ongoing set of actions to prepare for, and effectively respond to drought, including: periodic reviews of the achievements and priorities, readjustment of goals, means and resources, as well as strengthening institutional arrangements, planning, and policy-making mechanisms for drought mitigation.
Effective information, early warning systems and drought risk maps are the foundation for effective drought policies and plans, as well as effective networking and coordination between competent authorities in water management at different levels.
In addition to an effective early warning system, the drought management strategy should include sufficient capacity for contingency planning before the onset of drought, and appropriate policies to reduce vulnerability and increase resilience to drought.
When working towards a long-term drought management strategy, Member States will need to establish the institutional capacity to assess the frequency, severity and localisation of droughts; and their various effects and impacts on crops, livestock, the environment and specific drought impacts on populations.

DROUGHT MANAGEMENT PLAN REPORT
9
3. OVERVIEW OF EXISTING INDICATORS FOR DROUGHTS AND ASSOCIATED IMPACTS
Current works show that it is complex to establish European common indicators to describe droughts and define “prolonged drought”. Due to the complexity of drought variability according to climatic and geographic conditions, it seems appropriate to work on different parameters to be included in local or national indicators that can be calibrated and compared, when sufficient data is available. The presence or not of these parameters in local indicators will depend on their local relevance.
The purpose of this chapter is to sum up the common understanding on "prolonged droughts", describe the different types of indicators to identify and manage droughts and provide examples of indicators currently used by Member States in this respect. It tries to integrate the duration of the event and of its associated impacts. It finally presents an overview of both environmental and socio-economic impacts associated to prolonged drought events.
3.1 Common understanding of prolonged droughts
Article 4.6 allows for temporary deterioration in the status of water bodies as a result of “prolonged drought” among others. It is understandable that lack of water for essential uses (e.g. human supply) can hamper, at least temporarily, the achievement of GES. As seen in Chapter 2, there are various types and definitions of droughts. In addition, “Prolonged droughts” are only mentioned in the Water Framework Directive (WFD), and therefore their definition, or at least a common understanding of the phenomenon, is needed, in order to determine its impacts on water resources. Defining a prolonged drought, taking into account WFD principles, is a complex task, especially when duration, return period and impacts of droughts can vary as much from country to country and between regions within a country, and there are as many variables involved.
A background information on prolonged droughts is provided in a separate document to be annexed to the “Exemptions to the Environmental Objectives under the Water Framework Directive, Article 4(4), 4(5), and 4(6)” paper. This document will include the following aspects: identification of a prolonged drought, management of a prolonged drought, drought impacts on ecology and other water uses, indicators and measures to address prolonged droughts
As the WFD indicates in Article 4.6, the river basin authority may declare a “temporary derogation” to GES, after the following conditions have taken place:
• It is a result of natural causes or force majeure which are exceptional or which could not reasonably be foreseen and which are reviewed periodically (article 4.6)
• All Practicable steps are taken to avoid further deterioration (Article 4.6(a)); • Measures taken during the prolonged drought do not compromise the recovery of
the water body after the prolonged drought and are included in the PoM (Article 4.6(c));
• Measures to restore the water body are taken as soon as reasonably practicable and are included in the next update of the River Basin Management Plan; (Article 4.6(c) and 4.6(d))
• A summary of effects of the prolonged droughts is included within the RBMP (Article 4.6(e)).
DROUGHT MANAGEMENT PLAN REPORT
10
The adoption of appropriate indicators should be included in the river basin management plan in order to identify the different extreme phenomenon phases, predict possible impacts and establish associated measures to apply. It will be further explained in section 4.8 of this report. Drought status phases can be considered for example: “normal”, “pre-alert”, “alert” and “emergency”.
Measures to be taken in case of prolonged droughts as mentioned in 4.6(c) cannot affect negatively other water bodies (see Article 4.8 WFD) and must ensure that the objectives set by other Community legislation are not compromised (see Article 4.9 WFD).
A broader description of types of measures and possible implementation strategies are described in detail in Chapter 5.
3.2 Indicators related “prolonged droughts”
Three types of indicators can be identified in relation to prolonged droughts:
(1) Indicators to identify and demonstrate the occurrence of a prolonged drought: natural indicators based on precipitation as the main underlying (necessary) parameter (including (evapotranspiration) and with statistical series) to indicate that it is a 'natural cause or force majeure', and that the circumstances are exceptional or could have not reasonably been foreseen.
(2) Indicators to prove that the prolonged drought has resulted in a temporary deterioration of one (or several) water body(-ies) as an integral part of the monitoring programmes established under Article 8 and Annex V WFD (these are indicators related to environmental impacts)
(3) Indicators to illustrate the socio-economic impacts of the prolonged droughts (drinking water supply, agriculture, industry, etc)
The first and second types of indicators should be used to prove the occurrence of a prolonged droughts and the associated temporary deterioration of water bodies.
The second and third types of indicators should be used:
- To take the appropriate measures in order to mitigate the impacts of the prolonged droughts and recover the quality of the water bodies, according to 4.6 (c) and (d),
- To draft the annual review of the effects of the prolonged droughts (4.6(d))
- To draft the summary of the effects (4.6(e))
All indicators should be used to inform the water users and the public about the occurrence of droughts, their effects and the management results.
The next section provides an overview of national indicators related to droughts. The

DROUGHT MANAGEMENT PLAN REPORT
11
development of such indicators to be used on EU level and the specification on which indicators are consistent for applying the exemption related to “prolonged droughts” will be subject of further work carried out by the European Commission, the European Environment Agency and Member States. In all cases, it is required that when applying an exemption and the related indicators that they are submitted to a transparent and open process through the public participation (cf. Article 14 WFD).
3.3 Examples of existing current indicators used by the member states to identify and manage drought
UK, Spain, Portugal, Finland, Italy, Netherlands and France have presented drought indicators within the Water Scarcity and Droughts Expert Network that could help in the future setting indicators to identify prolonged drought. This chapter presents a preliminary list of available indicators, currently used by the member states, which could be adapted to the needs set out by the Water Framework Directive and the strategy set out in the recent Commission Communication on water scarcity and droughts.
According to these examples, there are two main types of indicators, those that are used to prepare for an event and those, which make it possible to characterize the event when it happens. Each Member State uses the first, the second or a combination of both, according to its needs. Examples on the use of different indicators from the different Member States are reflected in Annex 3.
All indicators require a complex combination of different parameters and numerous samplings and monitoring systems. They often include information on the stored volume in reservoirs, piezometric levels in aquifers, fluvial total discharge of natural precipitation patterns in representative pluviometric stations, among other variables. However, some of them look at impacts both on environmental and social terms.
These examples clearly show that drought remains a very complex phenomenon hard to evaluate and define, since it is only after a drought is over that the duration and extent of its impacts can be assessed. In addition, it occurs gradually and impacts can last for a long period of time. There is then a need for a good and complete indicator system to compare and define droughts. It is obvious that no two droughts would be the same, and their impacts will depend on their duration, intensity and location.
3.3.1 Intensity and duration indicators
According to the examples on the use of indicators provided from different Member States and to international research studies, it seems that currently no single indicator can be broadly applied at the European level, and further work on this line is needed. Different indicators are able to adequately reflect the intensity and duration of drought and its potential impacts on a diverse group of users.
A significant number of scientific works were carried out throughout 20th century, mainly in the USA, for the implementation of a certain number of indicators allowing managing drought and water supply assessment.

DROUGHT MANAGEMENT PLAN REPORT
12
The fact that time dimension has to be taken on board when identifying a “prolonged drought” could be explicitly shown by the word “prolonged”. However, intensity should be also taken into account.
Prolonged droughts, which consequences are important for different uses, should be able to be compared with other events. Drought severity is a posteriori measurement or judgment, and severity is in itself function of its intensity and its duration. The intensity of a drought event could be independent of its duration. A long event with low intensity may have very few consequences, whereas an event of high intensity can have strong effect on uses. In general, data for high-intensity extreme events are specified by three variables namely: frequency, duration and intensity.
The examples provided by MS show that the effects of a prolonged drought could greatly vary depending on the existing measures and infrastructures: basins with storing aquifers directly linked to the water body system, and/or regulating infrastructures (e.g. reservoirs) could be less vulnerable to impacts, while basins without storing capacity could be more rapidly affected. Other factors will undoubtedly influence drought impacts, such as demands and uses of the area.
3.3.2 Examples of parameters used by Member States to identify and manage droughts
a) Rainfall and precipitation indexes
Many indicators used by MS are mainly focused on precipitation, which actually affects river flow and recharges waters: effective precipitation (precipitation minus evapotranspiration, P-ETP). When monitoring rainfall, the relevant hydrological year (e.g. September of year 1 to August of the following year) should be used instead of the calendar year. The annual distribution of precipitation-linked inflow to environments is a very important factor to identify a drought. The basic annual average is quite simplistic and should therefore not be used as it conceals temporal distribution. Indeed, if there is heavy rainfall in winter and low rainfall in summer, and there are no reserves, the environment is put under stress despite posting a correct annual average. Water availability should be in line with existing demands (drinking water, crops…). Precipitation should be transformed in available waters (rainfall transformed into surface flow waters and rainfall transformed in stored volume for groundwater and reservoirs). The topography, the natural storage capacity of soils and the length of rivers, are important factors to be taken on board when evaluating water availability. In the end, this availability should be compared with a so-called “normal” situation.
Rivers react very quickly to precipitation unlike groundwater, which reaction time can range from several hours for rivers to several months for the aquifers, without mentioning fossil groundwater. The time lapse between precipitation and the observation of the consequences of the inflow or non-inflow of water should therefore be taken into account. This time lapse should be determined on a case-by-case basis (see the BRGM study for France). Mapping of response times needs to be produced, so that predictive models can be implemented. The predicted water levels should be compared with predetermined thresholds (flow and piezometry of objectives, minimum biological flows, historic thresholds etc.)
There is also the problem of connections between groundwater and surface water, with them

DROUGHT MANAGEMENT PLAN REPORT
13
draining into each other. In a given year, low groundwater levels mean may reflect that the aquifer can no longer supply surface bodies, although rainfall is normal. The expected theoretical water flow and drought levels would be distorted due to the groundwater being recharged. Flux monitoring requires the implementation of a management model. This can be done within the framework of each RBMP, which should be published in draft by December 2008 and final form in December 2009.
From a meteorological point of view, drought is defined mainly by the contribution of precipitation cumulated over a given period (month, season, year) and its relationship to an average or a value having a probability of occurrence chosen in advance. For instance, for a given place or an area given, there should be access to chronicles of sufficiently long observations (30 years for the estimate of an average, much more if we are interested in an event, which occurs only once every 20 years). It is the type of information, which the media might use to affirm for “This past spring was particularly dry”.
Shortage of rainfalls is the difference between the observation and the long-term climatologic mean. This limited index of drought is not especially informative since the importance of the anomaly depends on climate (a monthly deficit of 1 cm is substantially more significant to a desert ecosystem than to a forest one). Cumulative precipitation anomaly depends upon its magnitude in relation to normal conditions. The instant at which a drought begins is critical for the computation of the cumulative anomaly. This can only be established by looking back in time.
If these average or normal annual values are solid bases for the classification of climates, their use in certain zones as the Mediterranean zone region for example, is hardly relevant. Annual accumulative of 1500 mm (2 times more than the average) can indeed be observed even for years with summer drought. From the point of view of ecosystems functioning, the accumulation of rain over the period of growth of the vegetation (May-August) is a quite relevant descriptor of the extent of the summer drought.
In France, for example, for the Beauce groundwater body, it is not possible to use the single “rainfall” factor since to identify a drought. The example provided shows that the knowledge of the rainfall series cannot describe by themselves the observed phenomenon drought (storage, soil moisture, transfer with groundwater, etc), for the following reasons:
• A delay can be observed between occurrence of the rain and the response to the groundwater level (some years), by relocating information “rain”, we can approach the answer of the groundwater (see figure 3);
• A delay and modification can be observed of the response by rolling.
A groundwater is comparable to a flow together with a stock. The recharge of groundwater is influenced very little by a summer drought, thus rainfall information might not suffice as an indicator to identify and manage drought.

DROUGHT MANAGEMENT PLAN REPORT
14
Figure 3: Beauce aquifer levels (FR)
Some indices may not be applicable in different regions because the meteorological conditions that result during droughts greatly vary around the world. Climatologic statistics alone fail to give a sufficient accurate conception either of the duration or intensity of drought. Duration and area of coverage are very important in drought phenomena.
The analysis of index series makes it possible to determine the beginning, ending and severity of droughts periods. The drought severity for a month depends on the monthly situation and on the drought severity for the previous and subsequent months. For example, a shortage of snowfall may not manifest itself as depressed runoff until, for example, six months later. Determining the beginning, ending and affected area might become a difficult task that can be achieved by establishing adapted indicators and thresholds.
A drought presents temporary decrease of the average water availability. However, if drought is interrupted by a year with streamflow above the average, it is questionable if they should be considered two separate drought events. Although the second is the commonly accepted definition, the impact of the first period should not be negligible.
b) Flow in rivers
The presence of water in rivers is directly linked to rainfall, as response times are short. This statement should be qualified in the case of surface water, which has been re-supplied. It is important to focus on the average flow, at the return period. In other systems, control through reservoirs or channels might reduce lack of precipitation effects, but in any case, the lack of water will produce overall impacts in the management units.
Dried-out riverbeds might be a direct consequence of droughts. This can be observed visually and can be measured using the km of dried-out waterway or be related to the total dried-out area in a given river basin. Qualitative indicators can be graded, e.g. reduced but

DROUGHT MANAGEMENT PLAN REPORT
15
visible flow, non-visible flow, dried-out.
As an example, in France, the average flow over several days is compared to the QMNA5 flow (low water flow occurring only once every five years – with a 1/5 probability of it not being reached each year). The number of days during which the flow is lower than the reference level, for example QMNA5, should be counted. This corresponds to the number of days during which there is insufficient dilution. In the frame of master plans (SDAGE of 1992 water act), flows “of dry season” have been established, above this value there is no “competition” between environmental functions and economic uses related to water. A “crisis flow” has also been established in which drinking water service cannot be provided safely and aquatic species are in danger. These flows are established at a local level throughout a participative process involving local actors, water agencies, industries, ecologists, and farmers, among others. For aquifers, thresholds are proposed based on piezometric devices. For instance for the Beauce aquifer, 4 piezometric thresholds (from 110 to 113m, it represents the deepness at which water can be found) have been established. Water intakes are progressively restricted each time a new threshold is reached.
c) Artificial reserves
As part of city and countryside planning, some regions have set up artificial storage areas. These areas may carry out several functions: for example, they may enable transfer from one basin to another, electricity to be produced, rivers to be re-supplied or act as a support during periods of low-water levels.
The availability of water in these reserves should be incorporated into availability forecasts for an area. The filling level (reservoir) can be compared with historical data (management scenarios compared with a background level). Depending on uses, there could be a major competition for instance between the electricity production for the peak of consumption in winter, and supporting water flows (with the help of reservoirs) during summer.
d) Soil moisture content
Soil moisture content is an important factor for agriculture. It is measured over the first soil metre. Humidity can be observed deeper down in the ground (5-10m), with monitoring ground movements. Drought can have an important impact on this parameter and largely influence the crops yield. Difference between moisture supply and moisture demand is also important.
e) Environmental indicators
The number of fish species and individuals, in each section can be counted and compared with statistics on the section, or the number of dead fish. Some environmental indicators that could be used include:
- The reduction of wetlands area, - The increase of concentrations of specific chemical substances, harmful for aquatic
environment

DROUGHT MANAGEMENT PLAN REPORT
16
Moreover:
• Length Duration of the drought (in days): number of consecutive days above an important temperature, and specific timescales (months, weeks or days)
• Area of coverage • Potential evapotranspiration • Recharge, reservoir storage, reservoirs levels, groundwater measurements of
aquifer status • Wind intensity • Snowpack and potential moisture stored in snowpack
Some indicators are only related to droughts while some others can express a combination of water scarcity and droughts (e.g. artificial reserves, flows in rivers).
3.3.3 Research Program
For 50 years, definitions of droughts have varied, and parameters to describe the phenomena had been different. In general, studies have used advanced statistical approaches to describe phenomena.
Understanding the drought phenomenon, and particularly determining its frequency and severity as it affects various water users, constitutes the basic information necessary for sound planning and management of control measures to mitigate the impacts of drought.
A significant number of scientific works were carried out throughout 20th century, mainly in the USA, these research where using a certain number of indicators allowing predict and manage a drought. These experiences could be useful in the setting of EU indicators
It is expected that the Directorate General for Environment of the EC, the Joint Research Centre and Member States will assess in the coming years European resources and climate information, to establish EU drought indicators and early warning system based on existing ones and to be-established incorporating specificities of the Member States.
The category of drought magnitude could be:
• Abnormally dry • Drought moderate • Drought severe • Drought extreme • Drought exceptional
Each category will be associated with its percentile chance of happening in any given year out of 100 year.
A severity of event should be defined through expert criteria (e.g. severity= intensity * duration), which will make it possible to characterize the prolonged drought. Further work is necessary, which can give access to the exemptions at the European level to develop appropriate and harmonised drought indicators and to provide guidance on how Member

DROUGHT MANAGEMENT PLAN REPORT
17
States can apply such indicators in the context of the WFD implementation, e.g. to identify "prolonged droughts". The European Commission the European Environment Agency and Member States will continue such work over the coming.
The European Commission and the European Environment Agency, jointly with Member States and stakeholders, will work on agreed criteria to be applied on water scarcity and drought indicators in the European context.
3.4 Environmental and socio-economic impacts of “prolonged drought”
If a “prolonged drought” allows for “temporary deterioration”, it is due to the potential impacts it can have on not reaching the Good Ecological Status (GES). This temporary failure to reach GES will influence both environmental and economic uses. When a prolonged drought is identified, and temporary exemption will be needed. However, at the same time all possible measures to avoid damages will have to be applied. When the prolonged drought occurs, it would be important to evaluate its impacts on both environmental and socio-economic uses. This evaluation will help to determine when it will be possible to reach again the GES at local scale. Environmental impacts are very important to evaluate the failure of reaching the GES. In case of prolonged drought, it might be impossible to completely stop all water uses, even if some restrictions are undertaken. In these cases, a clear prioritisation of main uses should be established2 in advance. For this objective, it could be useful to have some impacts indicators such as:
Impact on drinking water supply
• Environmental impacts mortality of fish species impacts on river banks and biodiversity (flora) loss of biodiversity in terrestrial areas depending on the aquatic system Impacts on wetlands (Natura 2000 sites) Forest fires risk ecological status
• Impacts on socio-economic uses industrial uses power production agriculture (short and long terms) tourism water rights transport
Drinking water supply is the priority usage in most EU countries, and a minimum volume should be provided to the population whatever the climatic conditions are. This priority could become an aggravating factor for drought during summer seasons. Its importance compared to drought issues should be evaluated on the following factors: number of inhabitants supplied, volume, amount of abstraction from surface waters as part of total drinking water abstraction etc.
2 See also the Communication 'Addressing the challenge of water scarcity and droughts in the European Union' (COM(2007) 414)

DROUGHT MANAGEMENT PLAN REPORT
18
Regarding environmental uses, low river levels and high water temperature may cause changes in fish development and cause a greater among of deaths than during normal statuses. Some periods of the year are highly critical for fish, such as the reproduction and migration periods, and droughts during this timing can have a greater impact on the species. This is a highly valuable qualitative criterion. Low river levels and high water temperature may also cause algae to develop, but as for fish life, this parameter can be difficult to implement since eutrophication can also be caused by nutrients increase.
Authorising discharges into rivers, e.g. from water treatment plants or industrial usage, is determined in relation to optimum levels (qualitative objectives, number of days over the average, treatment costs etc.).The lack of water in water bodies caused by prolonged droughts can increase the need to restrict discharges.
Within the framework of a management plan, it is necessary to find a balance between the consequences of a lack of water availability for human uses during a period of prolonged drought and the quality standards imposed by the good ecological status objectives. Necessary measures need to be applied progressively to minimize impacts and avoid GES compromising. It is then not a question of systematically derogating as soon as the slightest rainfall incident occurs and during long periods of good status Thus, the different potential impacts caused by droughts should be assessed or, at least estimated, in advance, preferably as part of a drought management plan. Such assessment should consider economic, social and environmental impacts in order to inform the necessary decision-making. Such an assessment should take into account transboundary impacts, disparities between different Member States and distortions of competition between them, which stem from restricting or stopping certain uses.
3. 5 Some proposals to deal with prolonged droughts When and where necessary, mitigation measures can be presented in advance as part of the Drought Management Plan (complementing the river basin management plan). Acting on a prolonged drought, requires a rapid adoption of measures, for which the course of action should also be reflected in the RBMP or directly within the specific DMP. These measures need to be taken to avoid further deterioration and to restore the water body status as soon as reasonably practicable. Measures to be taken in case of prolonged droughts as mentioned in 4.6(c) cannot affect negatively other water bodies (see Article 4.8 WFD) and must ensure that the objectives set by other Community legislation are not compromised (see Article 4.9 WFD).
A broader description of types of measures and possible implementation strategies are described in detail in Chapter 5.
Some examples of measures could be the following: • develop early warning system and public information • implement preventive measures • promote water saving • take all practicable measures to prevent further deterioration • implement specific mitigation and adaptation measures of article 11 (basic and
supplementary) in water management sector as well as in other water dependant sectors (agriculture, energy, tourism, transport, urban development, industry)
• propose additional measures after the annual review of the effects of circumstances that are exceptional or could not have reasonably been foreseen (Article 4.6(d))

DROUGHT MANAGEMENT PLAN REPORT
19
4. DROUGHT MANAGEMENT PLAN FRAMEWORK
4.1. Basis and framework of Drought Management Plans
Nowadays, there is increasing recognition among decision-makers about the necessity to move to a more proactive approach in drought management. Because of the close relationship between water resources and drought, drought management is an essential element of national water resources policy and strategies.
Drought Management Plans (DMP) should be prepared in advance before they are needed, based on relevant country specific legislation and after careful studies are carried out concerning the characterization of the drought in the basin, its effect and the mitigation measures.
DMP are directly linked to Water Framework Directive (WFD) criteria and objectives, and the RBMP. The purpose of the WFD is to enhance the protection of water bodies and the status of aquatic ecosystems by promoting sustainable water use. The WFD places the integrity of freshwater ecosystems at the core of water management. Measures to prevent and alleviate drought consequences and water scarcity are thereby entirely appropriate within its context.
Although the WFD is not directly designed to tackle quantitative issues, its purposes include contributing to the mitigation of drought effects (art. 1. e) and the promotion of sustainable water use (art 1.b) and its environmental objectives include ensuring a balance between abstraction and recharge of groundwater (art 4.1(b)ii). Furthermore, water quantity can have a strong impact on water quality and therefore on good ecological and chemical status. In this respect, the Directive can be an instrument for addressing drought and water scarcity management.
RBMP have to include a summary of the programmes of measures in order to achieve environmental objectives (art. 4) and may be supplemented by the production of more detailed programmes and management plans for issues dealing with particular aspects of water management. For instance, DMP can be considered Sub-plans supplementing the RBMP, which should be defined in order to establish objective thresholds supporting the selection of specific measures related to an indicators system. In addition, DMP are already used as management tools in water policy in certain EU countries, which can serve as examples.
The scale for applying the DMP within the WFD framework should be the river basin or a sub-basin that makes a management system. In agreement with this, the appropriate entity to promote this plan should be the one in charge of the river basin. In the case of international river basins, it should be encouraged that sharing countries establish a common Plan.
Examples of Drought Management Plans already developed in Member States are included in Annex 2.

DROUGHT MANAGEMENT PLAN REPORT
20
4.2. Drought management in transboundary basins
In the EU, 40 of the 110 existing river basins are international, representing more than 60% of the Union territory as reflected in the following figure (EC, DG Environment; March 2007).
Figure 4. Transboundary basins. Map produced by WRc, UK on behalf of EC, DG Environment, March 2007.
Water management in transboundary basins may generate tensions on the use of this resource, which makes it necessary to reach agreements in the form of treaties or agreements to promote a joint management, which ensures equilibrium between environmental protection and water resources use (DGA, Spain, 2007. Los planes en cuencas transfronterizas de España y Portugal). As general criteria, treaties should include, inter alia:
• Global perspective of cooperation and respect
• Coordination of resources planning and management
• Common waters protection improvement

DROUGHT MANAGEMENT PLAN REPORT
21
• Contribution to the control of problems of transboundary character related to the water: e.g. prevention of risks with common plans.
• Determining and protecting shared ecosystems
These criteria should be applicable during the management of droughts. Water volumes in “bordering sections" should be used in mutual benefit, without damaging any of the affected Member States and avoiding any environmental damage downstream. In addition, projected works and infrastructures to construct on bordering areas should be previously consulted and agreed by all affected countries.
Programs of Measures and environmental requirements should be coordinated for the whole international river basin. In order to achieve this objective, existing structures and committees derived from international agreements can be used as examples (Emergency Situation and Water Framework Directive Working Group, Albufeira Agreement, 2006)
A fluent exchange of generated documents and data should be ensured between countries sharing waters, causing an interaction in the accomplishment of the proposed works. It is highly recommended to establish coordination before, during and after the accomplishment of the common actions or plans. It is therefore considered essential to find the balance in the collaboration degree, promoting the elaboration of a common Drought Management Plan in shared river basins, promoting the need of making joint studies on droughts and defining the measures to mitigate its effects, and the requirement to define criteria and indicators of the exceptional regime and the measures to adopt.
DMPs should be developed by countries covering international basins, active participation of interested parties of affected areas should be ensured throughout their development process and measures implementation. Some recommendations to improve this process include making compatible modelling systems databases and their formats to facilitate the exchange of information, agree in measures to prevent and mitigate drought effects, and commonly define the nature of the exemptions in relation to the general flow regime. In addition, there should be a general consensus on the definition of indicators to characterize drought statuses, actions to stimulate water savings, specific management regulations of infrastructures with significant water storage capacity, stricter policies on spills, abstractions, and dams regulations.
More specifically, it should be necessary to commonly:
• Propose specific volume regime for each river basin during drought episodes, depending on the severity of the phenomenon and according to agreed indicators.
• Establish a monitoring system, alerts and actions for drought scenarios, to face these situations in useful time.
• Evaluate the operation regime of hydroelectric uses, considering possible existing agreements, as well as the environmental conditions of the river.

DROUGHT MANAGEMENT PLAN REPORT
22
• Establish the regime of volumes in the river mouth, considering the corresponding environmental effects.
Member States should strengthen cooperation and communication during drought episodes, and promote the establishment of common DMPs, to minimize impacts and prevent damages on supply and ecosystems downstream.
4.3. Drought management plans objectives and application levels
The main objective of drought management plans is to minimize the adverse impacts on the economy, social life and environment when drought appears. It also aims at extending WFD criteria and objectives to realize drought management.
This general objective can be developed through a series of specific objectives that should include:
• Guarantee water availability in sufficient quantities to meet essential human needs to ensure population’s health and life.
• Avoid or minimize negative drought impacts, by all available means, on the status of water bodies, especially on ecological flows and quantitative status for groundwater and in particular, in case of prolonged drought, as stated in article 4.6. of the WFD.
• Minimize negative effects on economic activities, according to the priority given to established uses in the River Basin Management Plans, in the linked plans and strategies (e.g. land use planning).
Simultaneously, and in order to achieve the specific objectives, it is convenient to established operational or instrumental actions:
• Define mechanisms for predicting and detecting droughts.
• Establish thresholds for different stages of drought as it intensifies and recedes.
• Define measures to achieve specific objectives in each drought phase.
• Ensure transparency and public participation in the development of the drought plans.
Regarding exemptions to WFD goals, “prolonged droughts” are introduced in the WFD as “force majeure” events that may hamper achieving the good status of water bodies. The conditions under which exceptional circumstances are or could be considered have to be stated through the adoption of appropriate indicators. If exemptions are necessary, drought management plans can face them and provide clear guidelines on how to cope with them, in line with the requirements of the WFD. Further information on the issue of “prolonged droughts” and the application of exemptions will be provided by the “Exemptions to the Environmental Objectives under the Water Framework Directive, Article 4(4), 4(5) and 4(6)” paper.

DROUGHT MANAGEMENT PLAN REPORT
23
Drought planning should be developed at different levels and linked to the River Basin Management Plan (RBMP):
• National level
At national level focus should be put in policy, legal and institutional aspects, as well as in funding aspects to mitigate extreme drought effects. These are strategic measures. General long-term measures are the focus of national level measures as well as transboundary measures, but not exclusively; these types of measures should also be developed at RBMP level. In connection with river basin or local levels, national level measures should determine drought on-set conditions through a network of global indices and indicators at the national or regional level global basin indices/indicators network, which for instance can activate drought decrees for emergency measures with legal constraints or specific budget application.
• River basin level
Drought Management Plans (DMP) at river basin level are contingency management plans supplementary to River Basin Management Plans. DMPs are mainly targeted to identify and schedule on-set activation tactical measures to delay and mitigate the impacts of drought. Therefore, measures involved are mainly water demand or water conservation measures and WFD environmental objectives. In this sense, River Basin Management Plans have to include a summary of the PoM in order to achieve the environmental objectives (article 4 of WFD) and may be supplemented by the production of more detailed programmes and management plans (e.g. DMPs) for issues dealing with particular aspects of water management.
• Local level
At local level, tactical and response measures to meet and guarantee essential public water supply as well as awareness measures are the main issues.
This document mainly deals with Drought Management Plans (DMP) at the river basin level, but local and national measures might be necessarily applied depending on the Member State affected by drought episodes, and in any case, the coordination of the different competent authorities at all levels will be needed to guarantee its objectives.
4.4. Content of drought management plans
A possible content for the documents integrating the DMP can adjust to the following general areas:
• Introduction and DMP objectives
• General basin characterisation and elements for the environmental assessment
• The river basin’s experience on historical droughts
• Characterization of droughts within the basin
• Drought warning system implementation with establishment of indicators for adequate

DROUGHT MANAGEMENT PLAN REPORT
24
drought management under WFD criteria
• Program of measures for preventing and mitigating droughts linked to indicators systems.
• Organizational scheme of the DMP
• Update and follow-up of the DMP
• Public supply measures
• Where appropriate, a section can be dedicated to 'prolonged drought' as required in article 4.6.
The degree of development of the above mentioned contents will depend on the specificities of the basin (or sub-basin) and on the information provided and its degree of development within the river basin management plan. In addition to the DMP, a strategic environmental assessment (SEA) may be necessary to complement the DMP (Chapter 6 provides more detail on the subject).
The content of Drought Management Plans must in any case respect all WFD requirements including all conditions set in article 4.4, 4.5, 4.6 and 4.7 as well as article 9.
4.5. Basin and environmental elements characterization
The usual way to try to understand drought patterns and its effects is to study past documented historical events in the same region, but lessons learned during ongoing droughts are too rarely documented, critically analysed, and shared with other regions. Therefore, it is convenient to characterize the basin in order to identify relevant elements about environmental impacts due to drought.
This characterization will be essential to determine the management systems fragility towards droughts, their capacity to be forced during extreme phenomena, and to identify associated ecosystems that might be impacted.
The characterization might include:
• Water resources patterns and their quality
• Demand evolution
• Use and management rules
• Coupled relations between supply and demand
• Evolution of surface and groundwater reserves
• Actions taken to mitigate drought effects and impact assessments
• Environmental elements and vulnerable water bodies
• Environmental assessment of drought impacts (ecological flows, water quality impacts, drought effects on associated flora and fauna).
• Possible conflicts among elements and identified measures.
DROUGHT MANAGEMENT PLAN REPORT
25
• Criteria and objectives for environmental control
• Economic assessment of historical droughts
4.6. Basin’s experience on historical droughts
Previous experience on managing historical droughts can be very useful to assess water resources systems vulnerability, to estimate drought impacts, the usefulness of applied measures and to identify possible mitigation actions.
The study of historical droughts can include, among others:
• Drought recurrence and severity
• Socio-economic and environmental impacts
• Management systems and water bodies vulnerability
• Water supply vulnerable areas identification
• Identification of sensitive agricultural demand units
• Identification of supply shortage
• Resources conservation measures and demand management
• Drought infrastructures: available and on study
• Selection of measures to increase water availability
• Maximum temporal capacity to drought resistance
4.7. Basin’s droughts characterization
In order to establish patterns, temporal and spatial drought distribution within a basin or sub-basin, it is essential to characterize meteorological and hydrological droughts from available meteorological data series and indices.
The study of meteorological drought can provide guidelines on drought events (duration, intensity, recurrence, distribution, associated meteorological events...). This study can be done by taking into account temporal and spatial evolution of precipitation, temperature and evapotranspiration potential, all of which can have significant cause-effect relations.
The study of hydrological drought has as a main objective the establishment of patterns of water availability during droughts (duration, intensity, recurrence, distribution, lag with the meteorological drought, water availability evolution...). In order to achieve this study, a basin hydrological simulation is commonly used. This helps in determining the hydraulic system response in terms of guarantee, demands and environmental requirements.
Response failures of the system arise precisely when there are years or periods of precipitation scarcity -droughts-. These failures indicate if the system can answer to prefixed guarantees, or if it will need complements to achieve them to minimize drought impacts, e.g. complementary measures to those already established in the RBMP. These complementary measures are the essence of Drought Management Plans.

DROUGHT MANAGEMENT PLAN REPORT
26
4.8. Drought warning systems
One of the main objectives of the DMP is establishing a reliable indicators system, easy to obtain and representative of the spatial and temporal situation of drought that allows predicting the phenomenon’s status and assess its severity.
It is convenient that the indicators system is hydrologically based, so it can characterize hydrological droughts. The system will be useful and essential in the decision making process regarding the river basin water resources management.
Some of the indicators that can be used are combinations of the following:
• Stored surface reservoir volumes
• Piezometric aquifer levels
• River flows gauges
• Reservoir outflows
• Precipitation (in representative control points)
• Snow reserves (for areas in which these are significant)
• Indicators from quality and environmental networks
It is important to determine the most appropriate indicators or combination of them according to the specificities of the river basin affected by a drought. Similarly, it is necessary to determine which indicator, and under which circumstances, might reflect water scarcity situations or direct impacts from droughts.
The indicators chosen and used will depend on the specifics of each basin, and the availability of reliable data sources. To obtain an indicators system and determine representative indicators, it is necessary to select, aggregate and weight basic indicators based on the associated resources and demands. Finally, the calibration of indicators through historical series, allows adjusting the weights given to each indicator, and obtaining an aggregated group of indicators, suitable for and representative of the basin.
The validation and establishment of thresholds can be developed as follows:
a. By using and comparing historical droughts and checking the indicator’s accuracy
b. By contrasting simulation models of the basin with the indicator’s evolution
These indicators can in turn serve to establish national indicator systems, since they represent and are adapted to management systems or basins.
Indicators could be normalised in an appropriate threshold, e.g. from 0 to 1, to ease the comparison and classification among severity drought categories. This classification, and colour association, can be for example (Spanish Drought Management Plans, MAM/698/2007):
DROUGHT MANAGEMENT PLAN REPORT
27
1. Normal status (green)
2. Pre-alert status (yellow)
3. Alert status (orange)
4. Emergency or extreme status (red)
The selection of threshold values for this classification should take into account the requirements of the WFD and that its main objective will be to progressively integrate measures and actions during drought events. In addition, it is important to establish temporal persistence of these indicators to define the conditions of beginning and ending of each of the statuses.
To facilitate the general view of the temporal drought indicators evolution, it is convenient to develop periodical reports on the drought status with graphs showing the temporal evolution of indicators (single, aggregated and global).
Regarding transboundary basins, the defined system should be coherent with those indicators established for the affected basins, and compatible with management practices included in international agreements and established exemption conditions as mentioned on section 4.2.
4.9. Public supply systems vulnerable to droughts
In many Member States public supply plans are independent of drought plans, since in many cases the competent authority in charge of developing each of these is different. However, DMP should incorporate public supply problems and establish conditions for the development and coordination of both types of plans.
This coordination among authorities, and the needed fluid communication, is essential for the appropriate drought management and the establishment of the beginning and ending of each of the drought status and types of planning measures.
It is then important to identify and characterize public supply systems vulnerable to droughts. Insufficient temporal availability of water resources can affect supply demands or decrease the water quality due to the drought.
To identify and characterize vulnerable supply systems it is necessary to describe the parameters that define this type of system:
• Water resources origin: supply sources, monthly used volumes in a regular hydrological year, expected volumes during droughts.
• Demands: supplied amounts during a representative year, expected demands during drought episodes, categorization of essential demands and associated economic activities.
• Intake, regulation and transport infrastructures: types, characteristics, capacities, schemes of distribution networks
• Different kinds of urban demands

DROUGHT MANAGEMENT PLAN REPORT
28
• Priorities
• Indicators for giving priorities
• Threshold levels for the several urban demands (under which water availability is not enough)
Supply plans or actions should quantify supply volume as the minimum volume that ensures basic needs for the population and the economic activity of the supplied area. Member States should prioritize water uses, but it is clear that public water supply should always be the overriding priority to ensure access to adequate water provision. It is important also to coordinate coherence and correlation among drought indicators and thresholds for both types of plans, DMP and supply.
The consideration of any additional water supply infrastructure should in any case respect all WFD requirements (including articles 4.7 and 9). Its inclusion in a drought management plan does not exempt from respecting these obligations.
According to the Communication on water scarcity and droughts adopted on 18 July 2007, this option should be selected where all prevention measures have been implemented according to the water hierarchy (from water saving to water pricing policy and alternative solutions) and taking due account of the cost-benefit dimension.
5. PROGRAM OF MEASURES ASSOCIATED WITH THE DROUGHT MANAGEMENT PLAN
5.1. Classification of mitigation measures
Measures to be taken during hydrological droughts can be grouped in different categories:
a) Preventative or strategic measures
b) Operational measures (tactic or emergency)
c) Organizational measures
d) Follow-up measures
e) Restoration measures
Preventative or strategic measures are developed and used under the normal status. They belong to the hydrological planning domain, and their main objective is reinforcing the structural system to increase its response capacity (to meet supply guarantees and environmental requirements) towards droughts.
Operational measures or tactic, are those that are typically applied when droughts occur (during pre-alert and alert statuses). These are mainly control and information measures in pre-alert and conservation resources measures. If the drought is prolonged, the status of water resources can deteriorate to a point in which operational measures might be needed, consisting essentially of applying water restrictions on use and abstraction.

DROUGHT MANAGEMENT PLAN REPORT
29
Water conservation measures and restrictions should be ranked according to parameters such as, priorities among different uses, environmental requirements, status of drought etc.
Some criteria to take into account when selecting measures might include:
• Legal support
• Technical viability
• Cost-effectiveness and cost-benefits analyses
• Compatibility with other measures
• Environmental impact
• Time frame available to achieve effectiveness
If a further classification of measures is needed, these can be grouped in:
• Measures to rationalize water demand (infrastructure improvement and modernization, foster saving, reuse and recycling). These measures should be the priority.
• Measures that address water demand with infrastructures (regulation, intake, desalination, transport, interconnection etc.). These measures should be considered as an option when the previous measures have been exhausted, including effective water pricing policy and cost-effective alternatives. They remain in any case subject to EU legislation, in particular to all WFD requirements.
• Environmental protection actions especially oriented to safeguard aquatic ecosystems.
In addition to operational measures, organizational ones might be needed for:
• Establishing competent agents and an appropriate organization to develop and follow-up the DMP.
• Creating coordination protocols among administrations and public and private entities directly linked to the problem, in particular to those entities in charge of public supply.
Follow-up measures serve in the process of watching out for the compliance and application of the DMP and its effects.
Finally, restoration or exit drought solutions include the deactivation of adopted measures and the activation of restoration ones over the water resources effects and the aquatic ecosystem.
In summary, in addition to prevention measures developed under the normal status, there are some common features of the DMP measures:
• These are mainly management measures, usually not including the development of hydraulic works, except for eventual actions, in respect of EU legislation and when other options have been exhausted.
• They are considered temporary measures to apply during drought situations and when the phenomenon is ending, until the restoration of water resources and

DROUGHT MANAGEMENT PLAN REPORT
30
dependent ecosystems is achieved.
• They are mitigation measures that are progressively applied, by establishing application thresholds according to the drought episode status.
A table in Annex 1 summarizes the main categories of measures and the best period for their application.
5.2. Identification and structure of program of measures according to indicators status
The program of measures should be adapted according to the drought status obtained through the indicators system. The types of measures that might be used in each category of drought are set out below, using the Spanish classification of drought (section 4.8) as a model.
Normal status: this phase should be seen as the hydrological planning one, in which strategic and long-term measures are applied. These measures concern water demand management (water efficiency measures) and might include hydraulic infrastructures for improving the storage and regulation capacity of the river basin, infrastructures that promote the use of non-conventional resources (e.g. treatment and reuse facilities) and any other measures that might need extended time frames to be implemented. These measures should be included within the River Basin Management Plan as part of the WFD program of measures that promote a sustainable use of the water resources, the supply of reasonable demands, and the achievement of good ecological status of water bodies. All these, are in turn, measures that will delay drought effects and tougher scenarios (pre-alert, alert and emergency or extreme) and will help in minimizing the negative impacts of drought. All these measures should respect a water hierarchy. Water saving and water efficiency measures should be the priority and all possibilities should be explored. As previously mentioned, additional water supply infrastructures should be considered as an option when other options have been exhausted, including effective water pricing policy and cost-effective alternatives. They must in any case respect EU legislation including all WFD requirements.
Pre-alert status: the objective is to prevent the deterioration of water bodies while ensuring the activation of specific drought management measures, and continuing to meet water demands. These are considered informative and control measures.
Alert status: it is an intensification of the pre-alert status, since drought progresses as well as measures to apply. It is a priority to continue preventing the deterioration of water bodies status. These types of measures should be focused on saving water. Demand restrictions might be applied, depending on the socio-economic impacts, and by consensus of the affected stakeholders. Areas with high ecological value should be monitored more intensively to prevent their deterioration.
Emergency or extreme status: when all previous preventative measures have been applied, but the drought situation prevails to a critical status when no water resources are sufficient for the minimum demands (even affecting and restricting public supply), additional ones will need to be used to minimize impacts on water bodies and on mitigating ecological impacts, and public supply impacts. No measures that can prevent achievement of the WFD objectives should be taken, unless there is clarity about the existence of a prolonged drought.
DROUGHT MANAGEMENT PLAN REPORT
31
From this status to the normal one, measures should be applied to ensure a restoration of water ecosystems as quickly as possible.
The definition of an indicator for all the EU countries necessarily implies reaching a common measuring system, built up on available data and representing a simple concept. In the case of droughts, precipitation can be an easily applicable indicator. In order to be representative of each European region, moving average precipitation index from 1 to 4 seasons could be a consistent indicator reflecting natural or induced system memory due to aquifer or reservoir effects.
In any case, a general adapted indicator, which gives similar results to the more complex indicator systems, may be used at national or European scale in order to facilitate comparison of drought impacts. However, River basins will need to establish indicators that suit their specificities, match their characteristic historical series and differentiate between drought and water scarcity impacts. The European Commission and the EEA together with the Member States will continue their work on this issue.
6. DROUGHT PLAN MONITORING
6.1. Establishment of Drought Management Organisational Structure
In the development of a Drought mitigation plan, it is recommended to establish a competent entity, committee or working group to identify drought impacts affecting the river basin and propose management measures. In addition, the coordination among competent authorities and entities related to water management, and the participation of appropriate stakeholders should be ensured to achieve a participatory approach and a responsible reaction from society. Experts and stakeholders should establish the necessity of applying a DMP.
Drought plans should identify the organisational arrangements and allocation of roles and responsibilities that need to be in place when a drought is being managed. In particular, they need to identify who has responsibilities regarding:
• Monitoring the development of the drought
• Imposing measures required by the plan as the drought develops and recedes
• Monitoring the effects of drought measures
• Reporting to the appropriate authorities
6.2. Continuous monitoring of water status and DMP application
A critical component within drought management is the continuous observation and evaluation of the development of a drought event. In fact, in order to detect the onset of a drought, crucial variables of the basin’s water balance should be permanently monitored, not only within a drought situation.
Proper water resources management needs permanent collection, storing and processing of

DROUGHT MANAGEMENT PLAN REPORT
32
data related to precipitation, river flows, dam inflows and outflows, change of water levels in dams reservoirs and aquifers, evaporation, hydro chemical and biological elements.
The monitoring programmes set up by Member States according to WFD requirements should be used to provide data for the management of drought. In case of severe episodes with serious environmental and ecological impacts, additional sampling might be used to determine, for instance, effects on water levels or impacts on aquatic species. For this purpose, special drought oriented information monitoring points might be added to the monitoring networks, adding essential information for the drought follow-up, in addition to the regularly obtained data according to WFD criteria.
In addition to control networks, the DMP might include a follow-up program to ensure its own functioning, and check the use of measures and their results. This might be done by setting indicators in accordance to the type of measures that the DMP can include.
These indicators could be grouped in:
• Preventing indicators: such as stored volumes in reservoirs, flows, piezometric levels (see comments related to relevant indicators in section 4.8) or precipitation.
• Operative indicators: indicators linked to the demand or the increase of supply, or linked to the environmental protection.
• Management and organizational indicators: to check the application phases of the DMP and check its advances.
In accordance to these, additional indicators might be used to inform of the following:
• Development of entities for management and follow-up
• Appointment of staff and material
• Establishment of functioning protocols and rules
• Writing of post-drought reports
• Application of measures planned for post-drought environmental recovery
• Coordination between competent authorities
6.3. Continuous forecast of the expected water resources
An appropriate body, ideally with clear links to the competent body for the river basin, should continuously forecast expected available water resources scenarios for the coming months and years under drought events in order to select the input of proper measures according to DMP. Current available data on precipitation, river flows, reservoirs and aquifers levels have to be statistically analyzed in proper stochastic simulation in order to prepare estimates of water resources availability with their probability occurrence.
6.4. Continuous evaluation of water demands
Water demand for domestic, industrial, irrigation and other needs should be continuously recorded and evaluated to establish actual needs and effectiveness, estimating water losses

DROUGHT MANAGEMENT PLAN REPORT
33
or unaccounted and wasted water. Minimum limits for each category of use might be able to be established and agreed before drought event onset between the different users in the framework of DMP approval.
Water supply priorities change under drought conditions based on environmental, population health needs, strategic, economic, national and social criteria are part of DMP.
A DMP should reflect the fact that normal balance between social, environmental and economic factors that underpins water allocations will vary as a drought develops, and that water supply priorities will also change.
6.5. Improving the effectiveness of water use and mitigation measures
Potential measures for the improvement of water use efficiency can be divided into those that aim to improve the performance of water distribution entities and those that aim to improve water use efficiency at the stakeholder level. Measures can be further divided into those dealing with the improvement of existing infrastructure and those related to the non-structural aspects of water demand (e.g. improvement of organisation and management, improvement of knowledge about water losses, establishment of information systems, improvement in determination of crop demand and adjustment of water allocations, optimisation of timing, promotion of user initiatives for improvements, and tariff systems).
Finally, monitoring mechanisms should be used to decide, if the drought response plan is having its intended effect. Monitoring also provides the required information needed to evaluate the performance of the drought management plan in alleviating the effects of drought. Such evaluation is normally performed as an ex-post analysis of every drought event in order to assess the achievements of the drought plan and to learn from the experience by recommending the necessary corrections for future plan revisions.
This monitoring mechanism should also include the assessment of the economic impacts of drought episodes.
7. STRATEGIC ENVIRONMENTAL ASSESSMENT
7.1. Legal framework
EU Directive on the assessment of the effects of certain plans and programmes on the environment (2001/42/EC), commonly known as Strategic Environmental Assessment Directive (SEA) is intended to apply to all strategic plans that have been prepared by any Planning Authority, so that the impact of the plan on the environment can be assessed before the plan is developed. Before its entry into force, an environmental assessment must be carried out of certain plans and programmes, which are likely to have significant effects on the environment.
According to Article 3 an environmental assessment, in accordance with Articles 4 to 9, shall be carried out for plans and programmes: a) which are prepared for agriculture, forestry,

DROUGHT MANAGEMENT PLAN REPORT
34
fisheries, energy, industry, transport, waste management, water management, telecommunications, tourism, town and country planning or land use and which set the framework for future development consent of projects listed in Annexes I and II to Directive 85/337/EEC, or (b) which, in view of the likely effect on sites, have been determined to require an assessment pursuant to Article 6 or 7 of Directive 92/43/EEC.
Section 5.2 specifies that some of the measures of the DMP might include water supply measures such as hydraulic infrastructures. If the case, these measures related to the development of water management might be subject to SEA provisions and to the EIA-provisions when in the project stage. Specific effects of such new measures on the water status also need to be assessed according to Article 4.7 of the Water Framework Directive.
However, drought measures can also affect in a significant way natural habitats and may therefore be subject to SEA.
Article 6 of the EU Habitats Directive (92/43/EEC) requires Member States to establish conservation measures corresponding to the ecological requirements of the natural habitats in the affected area. Action must be taken to avoid damage to and deterioration of natural habitats and disturbance of species for which areas have been designated. Part 3 of this Article requires that appropriate assessments be undertaken of the implications of the plan for the site’s conservation objectives.
The overall interpretation of these directives is that Drought Management Plans fall within the scope of the SEA Directive if they can affect in a significant way the environment.
Nevertheless, as drought is a major cause of stress for natural habitats, and active public participation is, an inherent task of SEA process, it may be convenient to carry out a SEA of Drought Management Plans.
7.2. SEA objectives and Environmental Report content
The objective of the Strategic Environmental Assessment (SEA) and the environmental report is indicating, describing and evaluating possible significant effects on the environment that can occur when a DMP is applied. The SEA process is used in order to achieve an environmental integration, taking into account is objectives and the territorial scope.
The Environmental Report is one of the documents that can be used in the process, which describes in detailed the SEA, and that can be used in the application of the DMP. Not only it can facilitate the SEA process and the integration of environmental aspects, but it can also foster public participation throughout the whole DMP development process.
The main objectives of the SEA process can be summarized as:
• Elaborating a diagnosis of the environmental impacts of applying a DMP, which can allow the decision taking on its acceptability
• Proposal of measures and recommendations to integrated environmental dimensions in an active way in the DMP design

DROUGHT MANAGEMENT PLAN REPORT
35
• Verifying that the DMP includes a follow-up system for the compliance of its objectives and measures, and that can allow adopting complementary measures if needed.
• Verifying the transparency of the public participation process through the DMP elaboration
To achieve these objectives the assessment should be developed within each of the elaboration and content phases of the Plan, in accordance to the following process:
• Draft plan. It can include a description of the Plan contents, the main objectives of the environmental assessment, and the links with other plans or programs.
• Evaluation of the environmental and territorial diagnosis, where environmental and territorial affected elements can be identified, characterized and prioritized. It may also include a description of what would happen to these elements in the absence of the DMP.
• Evaluation of the Plan objectives, in accordance to national and international environmental protection objectives
• Evaluation of the program of measures, including proposed alternatives, the program of measures (coherence, certainty), significant effects of measures on environmental and territorial elements, in addition to related planning strategies, the certainty of measures and their territorial and sectoral coherence.
• Assessment of the management system, taking into account the operativity of the system, the coherence of measures to apply and the identification of responsible agents for the application of the Plan
• Analysis of the program for follow-up, which might includes the analysis of an effective follow up of the main problems, environmental variables and indicator system.
• Recommendations for the environmental integration of the Plan
• Summary of the Environmental report for public dissemination and information
• Report on the economic viability of the measures
These are indicative contents and their detailed development will depend on the river basin characteristics and its vulnerability to droughts.
7.3. Environmental vulnerable elements identification
Surface water bodies may be associated with ecosystems of high ecological value. The functioning of these ecosystems might depend upon a flow of optimum water quality flow. Similarly, groundwater feeds wetlands and springs. As it is known, the main aim of the Water Framework Directive is to achieve good status for all water bodies, including groundwater.
Water uses and discharges may alter natural conditions, affecting the associated ecosystems. It is therefore necessary to establish some criteria and general rules – in line with WFD requirements - to make sure that water use is consistent with minimum

DROUGHT MANAGEMENT PLAN REPORT
36
environmental flows, which ensure protection for the associated flora and fauna.
Areas with high ecological value are designated by the habitat and species protection trough, for example, the Habitats and Wild Birds Directives, and can be especially vulnerable to decreases in hydraulic inputs. The vulnerability and the impacts felt by these areas will ultimately depend on their inter-linkage with water resources systems. By determining the characteristics of the vulnerable areas and their dependence on water, it will be possible to establish minimum and required water inputs for the maintenance and conservation of habitats and species. These minimum inputs could be defined within each DMP through indicators as ecological flows regime, minimum water volumes in surface water, maximum abstractions etc. As a reminder, the WFD requires the prevention of further deterioration, protect and enhance the status of aquatic ecosystems and, with regard to their water needs, terrestrial ecosystems and wetlands directly depending on the aquatic ecosystems. The introduction of any other minimum input could therefore not replace the obligations of the WFD but should support the implementation of the already set objectives of the WFD.
The maintenance of ecological flows might be necessary when the following circumstances occur:
• Protected species or habitats through national or regional legislation
• Species or habitats included in Annex I or II of Directive 92/43/EEC on habitat, wild flora and fauna conservation
• Natural valuable areas designated by the environmental competent authority, which might include riparian zones
• Wetlands, marshes or river reaches of environmental relevance
• Species that have a management or fishery-related interest
• Water bodies designated to protect aquatic species according to Directive 78/659/EEC
• Areas designated as drinking water protected areas under the WFD itself
Natural areas linked to water systems can present vulnerability to drought episodes. They can include:
• Plain areas that have a high evapotranspiration in the absence of water inputs
• Lowlands near coastal areas easily invaded by marine waters with alterations in the ecosystems equilibrium
• Geological areas dependent on groundwater springs.
• Areas linked to ephemeral or intermittent flows (surface inputs).
• Natural systems very close to the saturated level, and highly sensitive to variations in water levels
These natural areas linked to water systems usually present valuable functions:
• High biomass production
• Rich biodiversity

DROUGHT MANAGEMENT PLAN REPORT
37
• Positive effects on water cycles: water storage and mitigation of flood effects, nutrient retention, water filtering, micro-climate maintenance (precipitation and temperature)
• Economic value to local population
During drought, a decrease in water inputs might endanger the minimum flows needed to preserve valuable natural areas and their ecosystems. In addition, the decrease in water flows can translate into lower quality also affecting associated biological elements. It is required that actions and measures that guarantee minimum flows are established, with specific physic-chemical characteristics, to ensure the survival of flora and fauna in these areas, in accordance with the WFD requirements, which include an obligation of no deterioration of the status of all water bodies.
Once high ecological value areas have been identified, associated water bodies could be identified to facilitate the follow-up of their status. To achieve this assessment, variables evolution can be measured, such as river flows, physic-chemical parameters, and biological indicators.
7.4. Environmental mitigation and monitoring measures
As a general criterion, environmental objectives and limitations included in the River Basin Management Plan should be respected. These may include ecological flows, groundwater inputs to wetlands, maximum aquifer abstractions, aquifer and reservoir levels maintenance or volumes flowing to the sea.
In accordance with this, existing monitoring networks and programmes should allow for more intensively control these ecosystems during droughts events, providing detailed information on water characteristics, flow and quality conditions control and follow-up. This is should be covered by the WFD monitoring programmes.
In the case of ecosystems dependent on surface water, the surveillance plan should control and follow-up the ecological and quantitative status through different variables (river flows, physic-chemical parameters, and biological indicators).
For groundwater, intensive abstraction, that can reduce inputs that feed wetlands, could provoke water level decreases, variations in water quality and alterations to associated flora and fauna. It is recommended to use a follow-up plan that measures piezometric levels of water bodies that feed wetlands, and an environmental follow-up of these ecological areas to identify possible impacts.
Similarly, heavily modified water bodies, e.g. reservoirs, can suffer drought impacts such as reduced storage volume, water quality alterations (eutrophication), and ultimate damage in existing ecosystems. However, for heavily modified water bodies good ecological potential and good chemical status have to be achieved, and these water bodies should include a surveillance plan to control the inputs and quality of stored water.
The surveillance plan can produce data to better control and follow-up of those water bodies linked to highly vulnerable areas, and assess the effects on associated ecosystems during

DROUGHT MANAGEMENT PLAN REPORT
38
droughts. These actions can be developed by existing hydro-chemical, biological, or other control networks within the river basin, and provide more detailed status and follow-up reports.
Fish and amphibious species can also be affected by drought episodes, although the latter ones present higher adaptability to water variations. Fish species however, require a minimum quality and quantity flow to survive. Specific measures could be taken to prevent damage to fish species. These might include: relocation of fish, species selection criteria (ecological value, abundance, deficient health, hybrid species, invasive or exotic ones…), the creation of saving areas (river shaded areas) or even the use of groundwater to maintain the minimum survival flow of species or the injection of oxygen in affected areas.
When reaching the emergency or extreme status (severe drought episode) it might be necessary to intensify the surveillance plan increasing monitoring sampling and reporting in the most affected areas.
During the emergency or extreme status however, a group of integrated environmental protection measures to ensure acceptable water quantity and quality in water bodies and associated ecosystems. In these cases strengthening of other measures such as the use of “water police”, enforcing sanctions for the misuse of water resources, increase of specific samplings methods or river flow data exchange in real time, might be needed. In addition, supporting technical and administrative services of the River Basin authority for checking measures and testing the follow-up plan can be of help.
All measures of monitoring or surveillance included in DMP need to be consistent with and embedded in the monitoring programmes of the WFD.
7.5. Environmental monitoring
Environmental elements can be affected by DMP measures when they are vulnerable to decrease in water inputs (linked to river reaches that can fluctuate due to droughts, or for instance, linked to aquifers that might be overexploited).
River basin management plans (RBMP) define qualitative and quantitative environmental objectives depending on the environmental vulnerability of the elements being protected over decreases of water inputs.
Quantitative elements include: minimum flow regimes in rivers, minimum discharges from reservoirs to rivers, minimum storage volumes in reservoirs for environmental reasons, maximum abstraction volumes from aquifers, maximum lowering of water tables or minimum levels and gradients to support wetlands associated to aquifers. Physic-chemical and ecological objectives are also set up in the RBMP.
All previous indicators can be used as direct indicators in the environmental protection during drought situations in vulnerable areas.

DROUGHT MANAGEMENT PLAN REPORT
39
7.6. Public information
As indicated by the WFD information supply should be ensured during its implementation.
Public information and consultation strategies need to be considered as public participation processes, to transmit the planning and mitigation measures considered in a DMP. It is important as well, to foster public participation during the elaboration of the plan to obtain different stakeholders opinions, prior to the decision-making process, being able to influence in the final decision process. Public information and consultation can follow regulated or legislated procedures (e.g., official bulletins) or broad and easily accessible publications and electronic means of information, being the later more commonly used by society.
It is recommended that Water Authorities develop instruments to facilitate and make information on DMPs more available. River Basin Authorities should determine contact points for making the information accessible, and ensure that drafts and final plans are available to the public. In addition, it is recommended that the DMP process is announced in advance, and discussed during its implementation through open and public workshops or conferences to fully reach interested parties.
7.7. Active public participation
Most communities that have suffered impacts from past droughts affirm they could have been better prepared, including those communities that had prepared contingency plans dealing with emergency water shortages
Active participation processes represent an opportunity to achieve the involvement of all necessary stakeholders for the appropriate functioning of the participation process and solve differences between interested parties early enough in the DMP process. These processes contribute to achieving the optimum sustainable equilibrium, considering social, economic and environmental aspects and facilitating the continuation, in the long-term, of the decision-making by consensus.
It is then recommended to establish working groups or fora that gather identified interested parties, experienced and recognized experts in the water field that can advice and consult during the DMP development process.
To ensure an active participation, specific working groups made up of interested parties and experts that can provide advice during the process can be established. In addition, sectoral tables where discussions can be more fluent, and small groups of stakeholders can gather, can be considered as useful tools to promote public participation.
Different formulas can be used depending on the drought situation, and the degree of development of the DMP. However, it is important that in any public participation strategy the following points are considered:
• Identifying the participation process objectives and its scope
• Determining key aspects and interested parties

DROUGHT MANAGEMENT PLAN REPORT
40
• Development of a communication plan with the involved stakeholders
• Identifying participative techniques to use in each phase of the process, taking into account the needs of each affected group
• Obtaining and assessing the results
In addition, and to include interested parties, and provide opportunities for participation in the decision-making process it is recommended to:
• Specify how results will be incorporated into the decision-making process.
• Identify the most-likely affected interested parties by the decision taken of the DMP.
• Obtain participation methods that can have different aims for public interest and diverse participants.
The achieved results should be compared to the established objectives so their link to decision making can be ensured. Adopted decisions or changes made in specific actions or measures of the DMP resulting from the participation process should be made public.
The analysis of the whole process, stating objectively the different opinions and sides should be reflected through a synthesis report or similar tool. This report should be made public and accessible to all interested parties that previously participated in the consultation and information process.
8. RELATED ISSUES: AGRICULTURE AND GROUNDWATER
8.1. Introduction
In the past six years, both water and agricultural European policies have faced challenging developments, following different objectives and identifying implementation tools not fully integrated. Nevertheless, a specific activity on WFD and agriculture linkages at EU level has been undertaken in the CIS context since 2005. This activity has covered several important issues to establish a link between the CAP and the WFD.
Half of the European Union's land is farmed. This fact alone highlights the importance of farming for the EU environment. Furthermore, agriculture is the most water demanding sector: total water abstraction for irrigation in Europe is about 105.000 Hm3/year (about 55%), while the total water use for public water supply purposes is over 53.000 Hm3/year (27%) and the water use for industry is close to 34.000 Hm3/year. The high rate of abstraction and consumption means that agriculture is heavily affected by the variation of surface water and groundwater availability. On one hand, agriculture is a driving force: the high water demand for irrigation contributes significantly to determine water imbalances, especially in the southern/Mediterranean regions. On the other hand, agriculture can be seriously affected by prolonged or frequent drought events, which can determine high economic impacts due to losses in yields, insect infestations, plant diseases and wind erosion.

DROUGHT MANAGEMENT PLAN REPORT
41
As indicated in section 2.1 water scarcity and droughts are two different phenomena which must be addressed with different approaches. The strong link between water quantity issues and agriculture, especially in areas affected by drought and/or water imbalances, requires a deep investigation and a complete characterisation of the problem, in order to define a common and integrated baseline between agricultural policies and water scarcity management.
Figure 5 Regional water abstraction rates for agriculture (million m³/year) during 2000 - source: EEA, 2005 (agriculture and the environment in EU-15 – the IRENA indicator report)
8.2. CAP and water quantity management
The Agenda 2000 CAP reform introduced the requirement for Member States to take the appropriate environmental measures linked to the situation of the agricultural land used or the production concerned. This requirement, together with the introduction of decoupling payment, can be an opportunity for the implementation of measures aimed at the protection of European Waters. In these regards, the Rural Development (RD) Programmes can play an important role in achieving the WFD objectives, even if it should be considered that water protection is only one of several goals in EU rural development policy.
The CAP offers a variety of instruments, which can be used to counterbalance adverse climate effects although this policy is primarily designed to support farmers' income or structural change in the agriculture sector and the broader rural economy.
Rural development policy in particular offers a number of measures related directly or

DROUGHT MANAGEMENT PLAN REPORT
42
indirectly to water issues, such as support to irrigation plans, infrastructure modernisation and incentives for water savings, or preventive measures and restoration after natural disasters. While climate change is not their primary driver, these measures could help to reduce vulnerability and facilitate adaptation to climate change.
In addition, the regulation underpinning future EU rural development policy in 2007–2013 already contains explicit references to the EU water policy and targets for the mitigation of climate change, as well as the need to anticipate the likely effects of climate change on agriculture production and policy.
According to the subsidiarity principle, in their rural development programmes, Member States and regions can include the combination of measures most appropriate to their objectives, thus leading to a great diversity of strategies and levels of intervention. Mediterranean countries have usually devoted substantial investments and support to irrigation systems. Irrigation infrastructure may occasionally help to offset seasonal droughts, but it is mostly intended to solve the uneven distribution of rains over time and territories, with a view to ensure regularity in supply and higher added value for agriculture production. In light of the limited RD budget and of the issues addressed by the Communication on water scarcity and droughts, RD programmes should put priority on improving the efficiency of existing irrigation networks rather than supporting the development of new irrigation systems.
Funding through the CAP rural development policy has been applied in a number of ways to help address drought and water scarcity issues. A number of studied examples from Member States, provided in Annex 5, are focussed on maintaining and improving security of supply (including enhancing efficiency) and, more specifically, reducing pressures on water supplies.
A number of Member States (including Cyprus and Portugal) note that, while rural development measures are valuable, they cannot solve all the problems. These funds are not focused on water scarcity and droughts. Member States themselves have numerous priorities and do not always address water demand management measures first. In addition, payments are often under the second (optional) funding pillar of CAP and are dependent on uptake by farmers and other stakeholders.
8.3. Programme of measures and rural development programmes
European policies on water and agriculture foresee two different implementation programmes:
• The Programme of Measures (for the water resources management, requested under WFD art. 11)
• The Rural Development Programme (for the CAP).
The achievement of a good water quality requires coordination between the two programmes in order to create synergies between the proposed measures.
As regard PoM, the WFD distinguishes between “basic measures” (minimum requirements to be complied with) and “supplementary measures” (designed and implemented in addition to the basic measures). Quantitative water protection measures are introduced both in the basic

DROUGHT MANAGEMENT PLAN REPORT
43
measures (controls over abstractions and impoundment) and in the supplementary ones. In particular, among the supplementary measures the “promotion of adapted agricultural production such as low water crops in areas affected by drought” and “promotion of water-efficient technologies in industry and water saving irrigation techniques” are included. Member States may include these measures, together with other specific measures of the DMP addressing an efficient water use in the agricultural sector, in the basic measures in the way to react to drought situations (see Chapter 5).
Long-term unbalances need Integrated Water Resources Management (IWRM) aimed at granting efficient, sustainable and safe supply of water, in line with the objectives of the WFD, including the ones in Article 9 on recovery costs of water services. In fact, the increasing water demand has been often faced through action aimed to increase water supply, but this approach determined water overexploitation and water stress. In order to implement an IWRM, supply-side measures and demand-side measures should be identified and coordinated in an integrated approach and in respect of the water hierarchy introduced by the Communication on water scarcity and droughts.
Supply-side measures may include the preservation of the functioning of natural catchments and aquifers and the restoration and improvement of existing water infrastructures (substitution of gravity irrigation systems with pressure ones, for example) and the setting up of conditions to be respected prior to water uses.
Demand-side measures may include the promotion of subsidies (this measures should be strictly coordinated with CAP), the reduction of leakages in water networks, the improvement of agricultural management, the use of appropriate pricing policies and the promotion of educational campaigns and the consideration of full decoupling. The Programme of Measures, coordinated by River Basin Authorities, should take into account this distinction.
A close coordination between PoM and competent authorities could be achieved through two different steps: first, the Member states affected by droughts should include the measures addressing water quantity protection foreseen in the PoM and the DMP. Secondly, the summary of the Program should be integrated with the RBMP and the Drought Management Plan, as River Basin Sub-Plan, ensuring coherence to all the measures addressing droughts.
8.4. Potential measures catalogue
In order to support the definition of agricultural measures aimed to maximise water use efficiency and to support their inclusion in PoMs and Contingency Plans, a list of “Potential Measures” could be appropriate. These measures should address the objective of improving the efficiency of water resource management for agriculture, ensuring water and energy saving and hydrogeologic protection of the territory, also through the adaptation and the modernization of infrastructures for irrigation, and reducing the environmental impact as much as possible. These measures should be coordinated with the measures designed to reduce water pollution from agricultural activities.
Measures can be grouped following the Communication from the Commission to the European Parliament and the Council, “Addressing the challenge of water scarcity and droughts in the European Union” (COM (2007), 414 final), or as it is suggested in the Impact Assessment of the Communication (SEC(2007) 993) or in the final report of Ecologic “EU

DROUGHT MANAGEMENT PLAN REPORT
44
Water saving potential”).
In the following associative table a list of agricultural measures is proposed for quantitative and qualitative protection, grouped as proposed above. Several analysed case studies from different Member States linked to these measures, and conclusions on water efficiency, are shown in Annex 6 (the following associative table includes a reference of each case study described in the annex).

DROUGHT MANAGEMENT PLAN REPORT
45
Communication (COM (2007) 414 final) Measures and related cases study
PUTTING THE RIGHT PRICE TAG ON WATER
• instruments for measuring and controlling water consumption (demand-side) • recalibration of tax/contribution systems (supply side) • measurement of water withdrawals from groundwater (demand side) • organization of systems for determination of contribution for irrigation (supply side) (c.s. 38) • improvement of the management and monitoring of irrigation systems (supply side) (c.s. 36)
ALLOCATING WATER AND WATER-RELATED FUNDING MORE EFFICIENTLY
IMPROVING DROUGHT RISK MANAGEMENT
• adoption of systems to forecast requirements for irrigation (supply side)
CONSIDERING ADDITIONAL WATER SUPPLY INFRASTRUCTURES
• rain-water harvesting (supply-side) • conservation of water of good quality (e.g.: groundwater) (demand-side) • wastewater reuse for irrigation (supply-side) (c.s. 9, 22, 30) • small systems for electric power production, tanks for accumulation (demand side) • development of dams for supplying water to irrigation areas once all water demand measures have been
exhausted (supply-side) (c.s. 8, 37)
FOSTERING WATER EFFICIENT TECHNOLOGIES AND PRACTICES
The final report of Ecologic “EU water saving potential” classifies these measures in: improving conveyance efficiency, improving application efficiency, improving irrigation scheduling,
• sealing of canals for irrigation (supply-side) • adoption of techniques oriented to water saving (demand-side) (c.s. 6, 7, 12, 18, 20, 25, 26, 27) • water balance calculation at farm scale (demand-side) (c.s. 3, 7, 11, 13, 17, 18, 19, 23, 26, 28, 31, 33, 39) • increase of the efficiency and optimization of the management of dams (supply-side) (c.s. 8) • improvement of the functionality of irrigation net systems to reduce water losses (demand-side) (c.s. 14, 15) • increase of efficiency of water distribution methods for agriculture (demand-side) (c.s. 1, 2, 4, 5, 9, 10, 11, 12, 14,
15, 16, 21, 32) • water management techniques during cultivation able to limit water losses (demand-side).

DROUGHT MANAGEMENT PLAN REPORT
46
decreasing crops irrigation needs, water saving programmes.
• promotion of agriculture practices compatible with agro-ecosystem (demand-side) (c.s. 25, 27, 29, 32, 34, 35) • maintenance or development of extensive agriculture production (demand-side) • application of the techniques of integrated production (demand-side) • restoring of the natural state of water bodies (demand-side) • biodiversity preservation (demand-side) • use of techniques to control point-source and diffuse pollution and able to increase water availability (demand
side) (c.s. 25, 27, 35) • adaptation of the amounts of supplied water for irrigation: planning irrigation from an irrigation balance, estimation
of the existing cultivations needs, irrigation register, etc. (demand side) (c.s. 3, 6, 7, 11, 12, 13, 17, 18, 19, 20, 23, 26, 28, 31, 33, 39)
• maintenance (ordinary or extraordinary) of infrastructures for irrigation (demand side) • increase of technological level of irrigation systems (demand side) (c.s. 14, 15) • changes in cultivation: less consuming or differently distributed in time (winter cultivations instead of spring ones)
(demand side) • regulation of water consumptions (supply side) • substitution of the conventional ploughing practices conserving the soil (demand side) • reforestations (demand side) • naturalistic engineering for landslip surfaces (demand side) • maintenance of the vegetation along rivers/canals (supply side) • use of buffer zones along channels and rivers • to increment the management of collective irrigation systems (demand side) (c.s. 37) • to give general and technical support to competent administrations (supply side) • information of public administration involved in the performance of measures (supply side)
FOSTERING THE EMERGENCE OF A WATER-SAVING CULTURE IN EUROPE
• recreated and didactic uses • increase the capability of involvement of stakeholders to coordinate the management of critical oncoming
situations (supply side) (c.s. 24)
IMPROVE KNOWLEDGE AND DATA COLLECTION
• introduction of new models for management of water resources (supply side).

DROUGHT MANAGEMENT PLAN REPORT
47
8.5 Groundwater
Drought impacts on groundwater, both direct and indirect, are generally less evident than impacts on surface waters but not necessarily less damaging. Furthermore, the impacts on groundwater vary according to the way of groundwater recharge: more pronounced if the recharge is achieved mainly because of rain and seepage from rivers than if recharge is from surface activities, such as from irrigation return flow etc.
Drought impacts on groundwater include, among others, less effective rainfall intensity and less river discharge. These result in indirect impacts, including: less groundwater recharge and the possibility of sea water intrusion in coastal aquifers.
Aquifers can be considered potential seasonal and/or long-term storage reservoirs, along with serving as conveyance media. Groundwater storage can be one of the best ways of making up for seasonal and long-term deficits in surface water. The storage capacity of a groundwater reservoir basin is analogous to the storage capacity of a surface reservoir, without or with minor loss of water evaporation. Groundwater can be pumped locally, irrespective of the recharge locations. Therefore, groundwater can be considered as a basic aid to increase water availability under drought. This needs to be carried out in respect of WFD requirements (in particular the obligation of no deterioration of the status, including the quantitative status of groundwater bodies).
Groundwater resources represent more than 21% of total renewable resources in Mediterranean countries, with very wide variations from one to another country (from 11% in Syria, 26% in Italy and Spain, 55% in France to more than 80% in Malta, Gaza Strip, Water Bank and Libya).
Agriculture is the largest use of groundwater in the Mediterranean region. Globally, agriculture represents the main sector demand with 75% of total demand. Speaking in terms of groundwater contribution, agriculture withdrawals supply 29% of total demand and represent 58% of total groundwater withdrawals in the Mediterranean countries (MED Joint Process, 2005. Mediterranean Groundwater Report).
Usually the most common aid to save crops and especially woody crop trees under drought is groundwater increase. Therefore, strategic water resources should be allocated as special water reserves, which should be mobilized only under drought conditions.
In some countries, the term "strategic use of groundwater" is applied to the use of groundwater resources during drought periods, even arriving to its temporary overdraft. Once the drought is over, their use ceases to allow water level recovery so that they are under appropriate conditions for its application in future droughts. During droughts, a strict control of pumping should be implemented in order to avoid worsening scenarios.
It is important to make an appropriate groundwater monitoring - embedded in the WFD monitoring programmes - during the periods of normality in order to study the capacity of recovery of the aquifers and the possible effects on the quality of groundwater, so that the conclusions allow more efficient application in future crisis.
In addition, an effective control is required in periods of normality, avoiding that these resources are incorporated to the Water Management System as habitual resources,

DROUGHT MANAGEMENT PLAN REPORT
48
accounting them as extraordinary resources to confront situations of drought. Proper control over abstraction of groundwater is a basic measure under the WFD.
The Drought Management Plan should settle, in accordance with the indicator system, the staggered start and stop of drought wells, their abstraction schedule and modifications due to water quality evolution in all cases of groundwater use. Groundwater management can be achieved through a number of strategies. For drought conditions, the relevant regulation strategy of the groundwater system is the inter-annual. "Inter-annual regulation" involves removal of groundwater from storage to make up for shortages in surface water. This depletion of groundwater storage would continue for a period of a few years (depending on adverse impacts). Recovery of the aquifer would take place during periods of surface water surplus, in such a way that, in the long term, a dynamic equilibrium between groundwater extraction and recharge is maintained. Inter-annual regulation schemes could either stand for themselves (new constructions subject to EU legislation), or could evolve from annual or intra-annual schemes. This can be achieved by increasing the pumping hours or the pumping periods of existing wells in respect of WFD requirements (no deterioration of quantitative status of groundwater in particular)..
The role of groundwater in drought mitigation may be reduced by imposed constraints that are either related to system limitations, or imposed by the developer. Major constraints include: (i) potential recharge; (ii) hydraulic characteristics of the aquifer system; (iii) groundwater quality and vulnerability to pollution (or degradation); (iv) boundary conditions (with water bodies); and (v) economic and socio-economic factors. The total amount of available groundwater depends on the potential recharge to the aquifer (annual and/or long-term). This includes both the deep percolation and groundwater flow from adjacent water bodies.
To make the role of groundwater efficient along with ensuring its sustainability, especially under drought conditions, appropriate plans should be developed including:
1) An updated assessment of groundwater potential under normal and drought conditions.
2) Inventory of groundwater vulnerability to pollution.
3) A set of strategies for groundwater augmentation, including recharge with conventional and non-conventional water, based on the results of experimental plots.
4) Predictions concerning the impact of groundwater management strategies on the environment, including other water bodies, changes in groundwater quality, cost of water and social acceptance of low quality water.
In any case, the concept of available groundwater resource according to the WFD (article 2) must be taken into account even during droughts. “... the long-term annual average rate of overall recharge of the body of groundwater less the long-term annual rate of flow required to achieve the ecological quality objectives for associated surface waters specified under Article 4, to avoid any significant diminution in the ecological status of such waters and to avoid any significant damage to associated terrestrial ecosystems”.

DROUGHT MANAGEMENT PLAN REPORT
49
9. RELATED ISSUES: CLIMATE CHANGE
Effects of climate change on droughts and their inter-relation
The IPCC (Intergovernmental Panel on Climate Change) Working Group in its fourth evaluation information document for Europe, for the very first time presents a wide spectrum of impacts due to recent changes of the current climate.
Observed changes are consistent with projected impacts due to the anthropogenic climatic change, and it is probable that they will magnify existing regional differences in Europe for natural resources and assets, increasing, in general terms, precipitation and run-off in the North and diminishing them in the South.
Predicted climatic change effects, related to hydrological issues, include flooding of coastal areas due to storms, increasing sea levels, extreme precipitation events and flood lightning, and most severely, frequent and prolonged droughts.
Figure 7: Change in recurrence of 100-year droughts, based on comparisons between climate and water use of 1961-90 and simulations for the 2020s and 2070s (ECHAM4 and HadCM3 climate models, emissions scenario
IS92a and a business-as-usual water use scenario). Values calculated with the model WaterGAP 2.1 (Lehner et al., 2005b)
In particular and regarding factors directly related to drought and its management:
• Hydrological stress is expected to increase in central and southern Europe. For the 2070s, the percentage of surface area under conditions of severe water
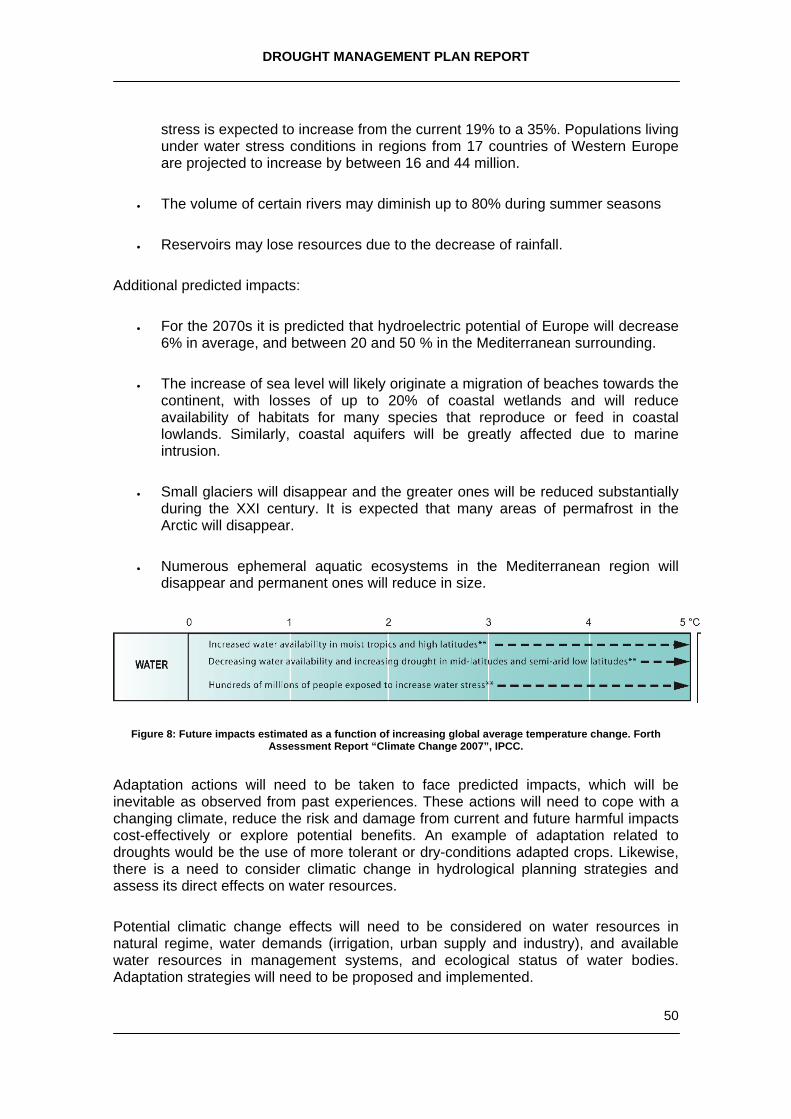
DROUGHT MANAGEMENT PLAN REPORT
50
stress is expected to increase from the current 19% to a 35%. Populations living under water stress conditions in regions from 17 countries of Western Europe are projected to increase by between 16 and 44 million.
• The volume of certain rivers may diminish up to 80% during summer seasons
• Reservoirs may lose resources due to the decrease of rainfall.
Additional predicted impacts:
• For the 2070s it is predicted that hydroelectric potential of Europe will decrease 6% in average, and between 20 and 50 % in the Mediterranean surrounding.
• The increase of sea level will likely originate a migration of beaches towards the continent, with losses of up to 20% of coastal wetlands and will reduce availability of habitats for many species that reproduce or feed in coastal lowlands. Similarly, coastal aquifers will be greatly affected due to marine intrusion.
• Small glaciers will disappear and the greater ones will be reduced substantially during the XXI century. It is expected that many areas of permafrost in the Arctic will disappear.
• Numerous ephemeral aquatic ecosystems in the Mediterranean region will disappear and permanent ones will reduce in size.
Figure 8: Future impacts estimated as a function of increasing global average temperature change. Forth Assessment Report “Climate Change 2007”, IPCC.
Adaptation actions will need to be taken to face predicted impacts, which will be inevitable as observed from past experiences. These actions will need to cope with a changing climate, reduce the risk and damage from current and future harmful impacts cost-effectively or explore potential benefits. An example of adaptation related to droughts would be the use of more tolerant or dry-conditions adapted crops. Likewise, there is a need to consider climatic change in hydrological planning strategies and assess its direct effects on water resources.
Potential climatic change effects will need to be considered on water resources in natural regime, water demands (irrigation, urban supply and industry), and available water resources in management systems, and ecological status of water bodies. Adaptation strategies will need to be proposed and implemented.

DROUGHT MANAGEMENT PLAN REPORT
51
The Green Paper “Adapting to climate change in Europe – options for EU action” of the EC from 2007 affirms, in accordance to the formerly provided data, that climate change effects in Europe and Arctic region are already significant and measurable.
In connection with water management, climate change will further reduce access to safe drinking water. Glacier melt water currently supplies water to over a thousand million people; once it disappears, populations will be under pressure and are likely to migrate to other regions of the world, causing local or even global upheaval and insecurity. Drought-affected areas are likely to increase and could become more frequent across the entire EU, water quality is likely to deteriorate as well, and river flow regimes will be altered due to changed precipitation patterns and in mountain areas due to reduced ice and snow cover.
Europe has warmed by almost 1°C in the last century, faster than the global average. A warmer atmosphere contains more water vapour, but new precipitation patterns differ strongly from one region to another. Rainfall and snowfall has significantly increased in northern Europe, whereas droughts are more frequently observed in southern Europe.
Figure 9: Precipitation percentage change, EC Green Paper 2007
In conclusion, at sight of the presented data, it becomes necessary to adapt drought management to the already measured impacts and the expected ones, by assessing future scenarios that include climatic change as one of the variables related to water management planning. Concrete actions could range widely, covering for example relatively inexpensive measures, as water conservation, changes in crop rotations, sowing dates and use of drought tolerant crops, public planning, and awareness raising campaigns.

DROUGHT MANAGEMENT PLAN REPORT
52
10. MAIN CONCLUSIONS
Common understanding of drought and drought planning
1. Water scarcity, on one hand, and drought, on the other, should be considered different matters. Water scarcity should refer to average water imbalances between supply and demand, while droughts, as a natural phenomenon, should refer to important deviations from the average levels of natural water availability.
2. Droughts can be considered as a temporary decrease of the average water availability and as a normal, recurrent feature of climate. Drought differs from other natural disasters in its slowness of onset and its commonly lengthy duration.
3. Drought Management Plan, while not an obligation on Member States, can be a powerful tool to alleviate drought impacts. The application of a DMP must, in any case, comply with WFD environmental objectives.
4. It is not possible to control the occurrence of droughts although the resulting impacts may be mitigated to a certain degree, namely through appropriate monitoring and management strategies previously planned in a Drought Management Plan (DMP), based on careful studies carried out concerning the characterization of droughts in the basin or region, their effect and mitigation measures applied.
Importance of drought in EU (“Water Scarcity and Drought In-depth Assessment, Second Interim Report”)
5. Drought is an issue affecting all EU countries in different ways: severe events were identified that have affected more than 800.000 km² of the EU’s territory (37%) and at least 100 million inhabitants (20%) in recent years with different degrees of intensity. Austria, Belgium, Cyprus, Finland, France, Germany, Hungary, Italy, Lithuania, Malta, the Netherlands, Norway, Portugal, Spain and the United Kingdom have all been hit, but other European countries have also been severely affected by droughts (e.g. Slovenia, Greece, Romania). As for the economic impacts of drought at the EU level, estimates suggest losses over the past 30 years of 100 billion Euros (€).
Drought causes
6. Drought is caused by a temporary deficiency of precipitation due to different natural causes including global climatic variability and high pressure, which inhibits cloud formation and results in lower relative humidity and less precipitation.

DROUGHT MANAGEMENT PLAN REPORT
53
7. Prolonged droughts occur when lack of precipitation persists for a long period of time, provoking high impacts that can lead to negative effects on the Good Ecological Status of water bodies and important additional measures need to be taken during its duration to avoid permanent deterioration.
8. Although it is a natural hazard, drought can be aggravated by Climate Change, which is expected to accentuate the extremes of climate with more pronounced droughts and more severe flooding.
Prolonged drought and WFD article 4.6 exemptions
9. WFD makes provision for some possible exemptions from achieving the environmental objectives at local scale, when and where necessary. The article 4.6 allows for “temporary derogation” to good ecological status and “temporary deterioration” in the status of water bodies as a result of “prolonged drought”.
10. Specific thresholds in the EU Member States indicator system need to be established in order to identify the achievement of “prolonged drought status” in order to prevent and mitigate its effects on the water status and to eventually declare “temporary derogation” to good ecological status.
Basis and framework of Drought Management Plans
11. The scale for applying the DMP within the WFD framework should be the river basin or a sub-basin that makes a management system. In agreement with this, the appropriate entity to promote this plan should the one in charge of the river basin. In other planning levels, it could be also a region or a State.
12. DMPs can define a specific program of measures to apply by Water Authorities under drought conditions in order to intensify monitoring and manage water resources to guaranty water supplies and their uses. DMPs aim at maintaining at least essential, and ideally reasonable and sustainable, demand for water without impacting the environment.
13. A DMP provides a dynamic framework for an ongoing set of actions to prepare for, and effectively respond to drought. DMP is based on three basic elements: 1) a drought early warning system, 2) a drought stages scale with clear thresholds adjusted to indicators state as drought intensifies and recedes and 3) a program of mitigation measures to achieve specific objectives in each drought stage. In the development of the DMP it is necessary to ensure transparency and public participation.
Drought management coordination in transboundary basins
14. DMPs should include cross-border coordination in transboundary basins: the defined system should be coherent with those indicators established for the affected basins, and compatible with management practices included in

DROUGHT MANAGEMENT PLAN REPORT
54
international agreements and established exemption conditions.
Early warning Indicators system and thresholds definition
15. One of the main operational objectives of the DMP is to establish a reliable early warning system based on hydrological indicators, as simple as possible to obtain and represent the spatial and temporal situation of droughts, allowing drought on-set identification, control and severity assessment.
16. Today no single index has been able to adequately reflect the intensity and severity of drought and its potential impacts on the great diverse group of users. Further works at the EU level are expected to establish a set of common indicators.
17. A general European indicators and monitoring system will help to spot the onset and progress of drought (similarly to the US system). However, every water authority or Member State should have a more detailed system for understanding when specific actions need to be taken through a comprehensive application of indicators adapted to the specificities of the River Basin. The definition of a set of indicators for all the EU countries necessarily implies reaching a common measuring system, built up on available data and representing a simple concept.
18. Any future European Drought Observatory could help in setting the conditions to increase knowledge and improve the preparedness to tackle drought events. This observatory could provide a platform for data collection and research activities, and contribute to a wide exchange of experiences on this issue.
19. Drought indicators and thresholds are important for several reasons: to detect and monitor drought conditions; to determine the timing and level of drought responses; and to characterize and compare drought events. Operationally, they form the linchpin of a drought management plan, tying together levels of drought severity with drought responses.
20. The validation and establishment of thresholds can be developed by using and comparing historical droughts and checking the indicator’s accuracy followed by an adjustment of simulation models results with the indicator’s evolution. River basin simulation models should be calibrated complying with WFD environmental objectives.
Mitigation measures program
21. Measures to apply during droughts can be grouped as: a) Preventative or strategic, b) Operational, c) Organizational, d) Follow-up and e) Restoration measures.
22. Program of measures should be adapted according to the drought status obtained through the indicators system. Initial stages of drought deal with

DROUGHT MANAGEMENT PLAN REPORT
55
control and water saving measures (voluntary ad mandatory), while prolonged drought status implies water supply shortages for different users and that additional measures might be used to guarantee public supply and minimize impacts on water bodies and their ecological status. During drought recovery, measures should be applied to ensure a restoration of water ecosystems as quickly as possible.
Convenience of DMP Strategic Environmental Assessment (SEA)
23. Drought Management Plans are not development plans. However, drought is a major cause of stress for natural habitats and can be responsible of temporary water status deterioration. In addition, as active public participation, is an inherent task of the SEA process and desirable in a DMP approval, it is always convenient to carry out a SEA of Drought Management Plans. The main objective of the SEA is to assess possible significant effects on the environment that can occur when a DMP is applied.
Related issues: agriculture
24. The strong link between water quantity issues and agriculture, especially in areas affected by drought and/or water imbalances, requires a deep investigation and a complete characterisation of the problem. The assessment can help in defining a common and integrated baseline between agricultural policies and water scarcity management.
25. Common Agricultural Policy instruments can be used to counterbalance adverse climate effects, although the CAP is primarily designed to support farmers' income or structural change in the agriculture sector and the broader rural economy.
26. Rural development policy offers a number of measures related directly or indirectly to water issues, such as support to irrigation plans, infrastructure modernisation and incentives for water savings, or preventive measures and restoration after natural disasters. These measures could help to reduce vulnerability and facilitate adaptation to climate change, expected to increase drought severity.
27. European policies on water and agriculture foresee two different implementation programmes: the DMP Programme of Measures and the CAP Rural Development Programme. The achievement of a good water quality requires coordination between the two programmes in order to create synergies between the proposed measures.
Related issues: groundwater
28. Aquifers can be considered potential seasonal and/or long-term storage reservoirs, along with serving as conveyance media. Strategic groundwater resources can be one of the best ways of making up for seasonal and long-term

DROUGHT MANAGEMENT PLAN REPORT
56
deficits in surface water. Groundwater can be considered as a basic aid to increase water availability under drought conditions, allowing for its recovering when the extreme phenomenon is over.
29. The Drought Management Plan could include, in accordance with the indicator system, the staggered start and stop of drought wells, their abstraction schedule and modifications due to water quality evolution.
Related issues: climate change
30. Climate change (CC) is expected to influence the baseline of present drought issues, with potential impacts on water quantity and quality. A link between DMPs and CC and their associated adaptation strategies should be integrated into the implementation of the WFD as much as possible, including the aspects already dealt with in the EC Green Paper on adaptation to climate change in Europe.

DROUGHT MANAGEMENT PLAN REPORT
57
REFERENCES
European Environment Agency Report No 6/2005. Agriculture and environment in EU-15 - the IRENA indicator report
European Commission, 2006. “Water Scarcity and Drought In-depth Assessment, Second Interim Report”. European Commission, 2007. Green Paper from the Commission to the Council, the European Parliament, the European Economic and Social Committee and the Committee of the Regions - Adapting to climate change in Europe – options for EU action {SEC(2007) 849} European Commission, 2007. Communication from the Commission to the European Parliament and the Council, Addressing the challenge of water scarcity and droughts in the European Union. “Exemptions to the Environmental Objectives under the Water Framework Directive, Article 4(4), 4(5), and 4(6)” paper. Convenio 2882. BOE núm. 37 Sábado 12 febrero 2000, 6703. Convenio sobre cooperación para la protección y el aprovechamiento sostenible de las aguas de las cuencas hidrográficas hispano-portuguesas, hecho «ad referendum» en Albufeira el 30 de noviembre de 1998. Heim R., 2002, “a review of 20th century drought indices used in the USA”, bulletin of the American meteorological society, vol 83, n°8, 1149-1165; Intergovernmental Panel on Climate Change, Climate Change 2007: The Physical Science Basis, Contribution of Working Group I to the Fourth Assessment Report of the Intergovernmental Panel on Climate Change. Lehner, B., P. Döll, J. Alcamo, H. Henrichs and F. Kaspar, 2005b: Estimating the impact of global change on flood and drought risks in Europe: a continental, integrated assessment. Climatic Change, 75, 273-299. MED Joint Process WFD/EUWI Water Scarcity Drafting Group, 2006, technical report “Water Scarcity Management in the Context of WFD”.
MED Joint Process WFD/EUWI Water Scarcity Drafting Group, 2005. Mediterranean Groundwater Report; Technical report on groundwater management in the Mediterranean and the Water Framework Directive.
Orden Ministerial, Spain. MAM/698/2007, de 21 de marzo, por la que se aprueban los planes especiales de actuación en situaciones de alerta y eventual sequía en los ámbitos de los planes hidrológicos de cuencas intercomunitarias.

DROUGHT MANAGEMENT PLAN REPORT
58
Schaer C., Vidale, P.L., Luthi, D., Frei, C., Haberli, C., Liniger, M.A. and Appenzeller, C., 2004. The role of increasing temperature variability in European summer heatwaves. Nature, 427 (6972): 332-336 Schéma Directeur d’Aménagement et de Gestion des Eaux - Loi n° 92-3 du 3 janvier 1992. Sur l'eau, France. Vlachos, E.C., 1990. Drought Water Management. Fort Collins: International School for Water Resources, 1990. Policies addressed
Council Directive of 18 July 1978 on the quality of fresh waters needing protection or improvement in order to support fish life (78/659/EEC) Directive 85/337/EEC (as amended by Directive 97/11/EC) Informal Consolidation of Directive 85/337/EEC on the assessment of the effects of certain public and private projects on the environment as amended by Council Directive 97/11/EC Adopted by Council 3 March 1997
Council Directive 92/43/EEC of 21 May 1992 on the conservation of natural habitats and of wild fauna and flora
Directive 2001/42/EC of the European Parliament and of the Council of 27 June 2001
on the assessment of the effects of certain plans and programmes on the environment
Directive 2000/60/EC of the European Parliament and of the Council of 23 October 2000 establishing a framework for Community action in the field of water policy.

DROUGHT MANAGEMENT PLAN REPORT
59
ANNEXES
A 1.Table of Measures to Consider in a DMP
TABLE .- GENERAL MEASURES PROGRAMME
MEASURES STATUS OF APPLICATION
A. REVISION or strategic during normal status
A.1.Preventing drought start
• Validating drought status indicators • Validating thresholds and drought phases
At the approval of the DMP
A.2. Establishing strategic measures
• Development of basic RBMP measures • Development of complementary RBMP measures • Development of operational framework of water
rights exchange Centres • Inventory and operative maintenance of drought
infrastructures • Studies for improving knowledge of eater bodies
• Studies for improving knowledge of hydrological cycles of wetlands
“Normal” status
B. OPERATIVE during “pre-alert”, “alert” and “emergency”
B.1. On demand
• Voluntary water saving campaigns in urban supply, information, and social awareness In “pre-alert”
• Voluntary water saving campaigns for irrigation, refocusing irrigation campaigns In “alert”
• Water volume reduction for irrigation purposes In “alert” and “emergency”
• Prohibiting uses (watering gardens, swimming pools, street cleaning, high water demand crops, golf courses etc.)
In “emergency”
B.2. On supply
• Checking functioning of drought infrastructures In “pre-alert”

DROUGHT MANAGEMENT PLAN REPORT
60
TABLE .- GENERAL MEASURES PROGRAMME
MEASURES STATUS OF APPLICATION
• Finishing infrastructures for planned droughts (drought wells, desalination plants, reuse systems) –when other possibilities have been taken into account and preventative measures have been applied-
In “pre-alert”
• Increasing groundwater abstraction –when future recovering ensured- In “alert” and “emergency”
• Activate and increase waste water potential reuse In “alert” and “emergency”
• Activate and increase the use of desalination plants –already constructed and in-use In “alert” and “emergency”
• Resources transfers within the basin In “alert” and “emergency”
• Activating the water rights Exchange centres for ensuring urban supply In “emergency”
B.3. On the environment
• Ensuring water quality and environmental objectives under WFD criteria During all drought scenarios
• Determining use priorities during droughts situations At the approval of the DMP
• Activating water rights exchange centres to avoid damages on water bodies In “emergency”
• Maintenance, as a general criterion, of hydrological environmental requirements established in the RBMP-first priority is population supply-
In “alert” and “emergency”
• Restrictions on environmental hydrologic requirements, established in the RBMP, when it is necessary to ensure urban and social supply, as far as restrictions do not damage ecosystems, habitats, and vulnerable species to droughts (Natura 2000 Network and RAMSAR)
In “emergency”
• Maintaining outputs equal to inputs in reservoirs that feed aquatic habitats of Natura 2000 Network and RAMSAR wetlands
In “emergency”
• Avoid the direct use of water from wetlands vulnerable to drought situations During all drought scenarios
• Avoid the use of minimum volumes in reservoirs presenting eutrophication or in risk. In “alert” and “emergency”
• Increasing the control for discharges, wastewater treatment plants, agricultural practices and water quality
In “alert” and “emergency”

DROUGHT MANAGEMENT PLAN REPORT
61
TABLE .- GENERAL MEASURES PROGRAMME
MEASURES STATUS OF APPLICATION
• Establishing an environmental watch plan on water bodies of Natura 2000 Networks, RAMSAR wetlands, water bodies feeding vulnerable wetlands and reservoirs
During all drought scenarios but most intensively in “alert” and “emergency”
• Increase Water Police and control of the water public domain to strengthen surveillance, sanctioning procedures and selective monitoring
In “emergency”
• Capture and relocation of endangered fauna and creation of special areas to maintain aquatic species
In “emergency”
C. ORGANIZATIVE or Managing System
C.1. Related to DMP organisation
• Establishing organization, responsible entities and resources to apply and follow-up the DMP At the approval of the DMP
• Follow-up of indicators by the River Basin Authority In normal and drought status
• Activation of a Drought Technical Office or similar structure –when needed- In “pre-alert”
• Preparation, agreements approval, and administrative resolutions In “alert” and “emergency”
• Approval of decrees and drought laws –when needed- In “emergency”
• Establishment of a management drought commission In “emergency”
• Approval of recovering measures by the competent authority When recovering
• Deactivating drought special structures (as the Drought Technical Office) When recovering
C.2. Related to coordination and participation
• Coordination among administrations, public and private entities linked to the DMP In normal status, droughts and
when recovering
• Development of guidelines for special urban supply plans At the DMP approval
• Activation of special urban supply plans or measures. In “pre-alert” and “alert”
• Establishing public participation activities to inform and promote collaboration to ensure DMP measures effectiveness
During the DMP elaboration and implementation

DROUGHT MANAGEMENT PLAN REPORT
62
TABLE .- GENERAL MEASURES PROGRAMME
MEASURES STATUS OF APPLICATION
D.-DMP FOLLOW-UP
• Establishment of follow-up indicators (evolution, effects and efficiency) of the DMP At the DMP approval
• Follow-up of drought status indicators Throughout the whole process
• Control of DMP follow-up indicators During drought and after drought
• Control of DMP measures achievement through post-drought audits After drought
• Upgrade or review of the DMP After drought
E. RECOVERY
• Deactivation of supply measures When recovering
• Stop supply restrictions After drought
• Stop use restrictions After drought
• Activation of necessary and correction measures to recover affected ecosystems, habitats, species After drought

DROUGHT MANAGEMENT PLAN REPORT
63
A 2. Drought Management Plans in Member States
Drought management in Spain
Spanish legal framework specifically refers to drought in the planning process, and determines the way to face the problem for Public Administration and stakeholders.
In the past, exceptional measures were applied during a crisis, but few of them were dealing with preparedness, mitigation and previous planning. The former Water Act (1985) gave certain responsibilities to Reservoir Committees of River Basin Authorities in case of water shortage, in agreement with water rights. The Reservoir Committee submitted proposals to the Basin Authority Chairman with regard to filling and emptying reservoirs and aquifers, according to the rights of the different users and the existing hydrological situation. During unusual droughts, the Government may adopt exceptional measures in order to address the situation, even if concessions (rights of water use under certain conditions) have been granted. Such measures may include the building of emergency infrastructures, as for instance drought wells. The Water Act also described a water use priority list, from first to last in order of importance: water supply in urban areas, irrigation, industrial uses for power generation, other industrial uses, fish farming, recreational uses and navigation.
The experience acquired during the last droughts suffered in the country have shown how this concept was inappropriate and demonstrated the need of new regulations and adequate drought risk management measures.
The new legal framework deals with drought planning and management through modifications introduced in the Water Act. For instance, the Government may authorize the River Basin Authority to set up Water Interchange Centres (Water Banks) to enable user rights to be waived by voluntary agreement (Water Act, article 71). Specific legislation related to drought can be found in National Water Plan Act (Act 10/2001, article 27 “Droughts management”), which states that the Ministry of Environment must establish a global Hydrological Indicators System (HIS), and River Basin Authorities (Confederaciones Hidrográficas) must prepare Drought Plans and submit them to respective River Basin Councils and Environment Ministry for approval. Municipalities should also develop Emergency Plans for urban water supply (for more than 20.000 inhabitants) in order to ensure water services under drought situations.
The HIS was elaborated using different parameters (inflows, outflows and storage in reservoirs, flow river gauges, precipitation and piezometric levels) for each management system. In addition, a General Guidance Document was developed by the Ministry of Environment to facilitate the process of developing Drought Plans,
The bases for the plans were established as:
• Present indicators that will provide a quick drought status early enough to act according to the forecasts of the Plan.
• Provide knowledge of the resources system and its elements’ capability to be strained during scarcity situations

DROUGHT MANAGEMENT PLAN REPORT
64
• Provide knowledge of the demand system and its vulnerability towards droughts, organised by priority degrees
• Present structural and non-structural alternatives to reduce drought impacts, and adaptation according to the status indicator
• Measure the cost of implementing measures
• Adapt the administrative structure for its follow-up and coordination among the different Administrations involved (Ministry, regional governments, municipalities...)
• Discuss Plans, results and follow-ups with all interested parties, ensuring full public participation to avoid social conflicts.
Basin Authorities have been able to elaborate plans according to their specificities, declare the drought status according to the HIS threshold, and initiate measures included in the Plan depending on the gravity of the phenomenon.
The main mitigation measures included in the Plans can be grouped into different categories: structural measures (new pumping wells, new pipes, use of new desalination plants, etc.) and non-structural measures (water savings by applying restrictions to the users, increase in the use of groundwater, etc).
The Directorate General for Water coordinated jointly with the River Basin Authorities (RBA) the elaboration and approval process of Drought Plans, which were finally launched on March 2007 after completing their Strategic Environmental Assessment processes, and are accessible through the Ministry and RBA web sites. Based on the HIS thresholds, monthly maps of the drought situation in the different management units within each Spanish basin are being developed, and can also be found in the Ministry’s web-site since December 2005.
The Drought Plans activate and serve as a reference framework for specific urban supply plans. In this respect, institutions responsible for water supply (for more than 20.000 inhabitants) have to draw up a Drought Emergency Plan and implement it when the state of drought or warning has been declared by the River Basin Authority. These emergency public supply plans have been drafted and are currently under discussion between all competent authorities: regional governments, federation of municipalities and public supply entities.
The main scheme of the Plans elaboration process is reflected in the following figure:

DROUGHT MANAGEMENT PLAN REPORT
65
Drought Management Plans in Spain and their Strategic Environmental Assessment
Aim: to reduce droughts environmental, economic and social impacts
SEA (2001/42/EC)
Stakeholerr consultation
Environmental sustainability
report DMP
zonning
Indicators
Chracterisation
Thresholds
Measures
Figure 1: Drought Management Plan characteristics (Spanish Ministry of Environment)
Drought planning in England and Wales
Institutional arrangements
The roles of the key organisations in times of drought are the following:
The Department for Environment, Food and Rural Affairs (Defra) in England and the Welsh Assembly Government in Wales have policy responsibility for the legislation that governs water resources which includes the law relating to hosepipe bans, drought permits and drought orders works. During drought, it works closely with the Environment Agency and the water companies to ensure that the public water supply is maintained and that the environment does not suffer unduly. The Government’s formal role when water is under stress is to deal with drought order applications made to Ministers.
The Environment Agency is the statutory body that has a duty to manage water resources in England and Wales. The Environment Agency is responsible for

DROUGHT MANAGEMENT PLAN REPORT
66
managing water resources and striking the delicate balance between water for the environment and water for public supply. They plan and manage how much water is taken from rivers and the ground through a system of licences. Its aim is to ensure that the management and future development of our water resources is carried out in a sustainable manner. It may grant short duration drought permits that allow more water abstraction for public water supplies than is normally allowed.
Water Companies - Water companies have the power to impose temporary sprinkler and hosepipe bans that prohibit or restrict the use of hosepipes or similar apparatus for watering private gardens or washing private motor cars. Hosepipe bans do not require the approval of the Government or the Environment Agency.
Drought plans
Drought plans are essential for managing water resources by helping water companies and the Environment Agency make the right decisions at the right time to both ensure essential public supplies and to protect the environment.
Both water companies and the Environment Agency produce drought plans.
Environment Agency drought plans.
These plans:
• Outline how the Agency will manage water resources during a drought and define its role and responsibilities.
• Aim to reconcile the competing interests of the environment, the need for public water supply and other abstractions.
• Show what additional environmental monitoring they carry out.
• Provide a framework for liaison with water companies, awareness campaigns and determination of drought permits.
• Ensure consistency in the way the Environment Agency co-ordinates drought management activities in England and Wales.
• Explain the drought situation in England and Wales so that the Environment Agency can advise senior management and Government on the prospects and possible actions.
There is a hierarchy of plans ranging from high-level plans related to its co-ordinating of drought management activities over England and Wales down to local plan level that set out specific operational activities to be undertaken by the Agency. The Environment
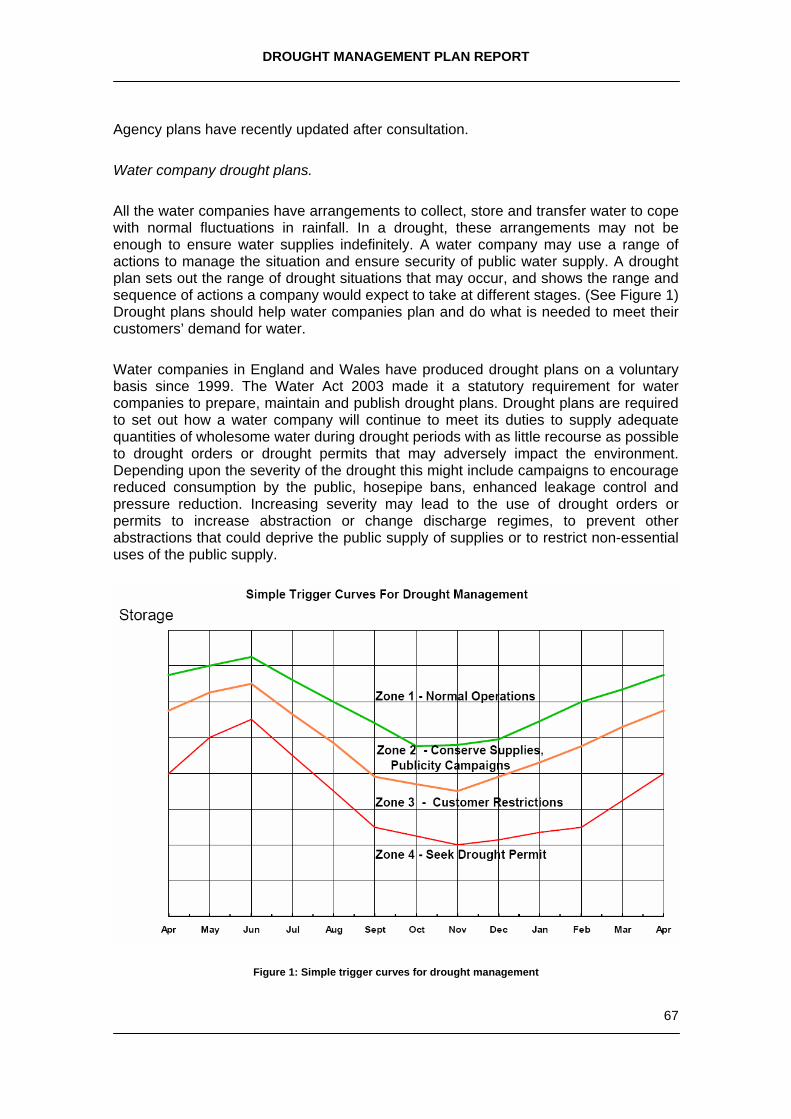
DROUGHT MANAGEMENT PLAN REPORT
67
Agency plans have recently updated after consultation.
Water company drought plans.
All the water companies have arrangements to collect, store and transfer water to cope with normal fluctuations in rainfall. In a drought, these arrangements may not be enough to ensure water supplies indefinitely. A water company may use a range of actions to manage the situation and ensure security of public water supply. A drought plan sets out the range of drought situations that may occur, and shows the range and sequence of actions a company would expect to take at different stages. (See Figure 1) Drought plans should help water companies plan and do what is needed to meet their customers’ demand for water.
Water companies in England and Wales have produced drought plans on a voluntary basis since 1999. The Water Act 2003 made it a statutory requirement for water companies to prepare, maintain and publish drought plans. Drought plans are required to set out how a water company will continue to meet its duties to supply adequate quantities of wholesome water during drought periods with as little recourse as possible to drought orders or drought permits that may adversely impact the environment. Depending upon the severity of the drought this might include campaigns to encourage reduced consumption by the public, hosepipe bans, enhanced leakage control and pressure reduction. Increasing severity may lead to the use of drought orders or permits to increase abstraction or change discharge regimes, to prevent other abstractions that could deprive the public supply of supplies or to restrict non-essential uses of the public supply.
Figure 1: Simple trigger curves for drought management

DROUGHT MANAGEMENT PLAN REPORT
68
Under the Water Act 2003, water companies in England Wales now have a statutory duty to produce and maintain a drought plan. The companies have to submit their plans to the Ministers, which should be produced in accordance with guidelines from the Environment Agency. Draft drought plans must be published and consulted upon before the final plan is completed.
The first set of statutory drought plans were submitted to the Secretary of State at the end of March 2006 and were consulted upon in summer 2006.
Operational use of drought plans
During a drought, the Environment Agency works with water companies to find the best ways of managing supplies and decides whether to issue drought permits that allow water companies to make the most of available supplies or to reject permits, often due to possible environmental damage.
In the 2004-2006 drought in south-east England, the combination of publicity campaigns and banning the use of hosepipes to wash cars and water grades resulted in a 5-15% reduction in demand. In 2006 four water companies were granted drought order powers to restrict non-essential use but only one was actually used (to restrict automatic car washing and watering of sports grounds (e.g. golf courses)).
Drought Management in Portugal
Background
The geography of Portugal is favorable to the occurrence of droughts that should be viewed as a “climatic event of specific frequency”. They have occurred in the past and will occur in the future.
At 2005, a very extreme drought occurred in Portugal. It was the worst meteorological drought from the instrumental record (more than 60 years on a fair gauge density) and its return period as been set to approximately 200 years for the whole of the Portuguese territory (being more severe in its northern part). The work developed to manage this drought has been done with good performance, involving the principal stakeholders and mitigating the main impacts. This text will follows the procedures used in the monitoring and management of the 2005 Drought.
The Water Institute in Portugal (INAG) is the national body that has a duty to manage water resources, where the droughts events are included. Due to the drought complexity, drought management involves all water user sectors, namely, agriculture and forest, industry, tourism, energy and environment.

DROUGHT MANAGEMENT PLAN REPORT
69
Before the Drought
In normal climate situation and before a drought period is detected and declared, both the Portuguese Meteorological Institute and the Water Institute monitor the main climate variables, namely the precipitation, river water flows, reservoirs water levels, groundwater levels and river water quality. The Meteorological drought is evaluated through the application of the Standardized Precipitation Index (SPI), the Palmer Drought Severity Index (PDSI) and the Regional Drought Distribution Model, with monthly data.
When very low precipitation occur and the meteorological drought indicators show a meteorological drought, the Meteorological Institute informs the Commission for Reservoir Management (national permanent commission, including the main users and water state organizations) which analyze the situation, based essentially on the water storage levels in some reservoirs, particularly multi-purpose reservoirs and the imbalance between water available and water demand prediction. If the decision is for the presence of a drought, this Commission proposes to the Government that a state of drought should be declared and a Drought Monitoring and Impact Mitigating Programme should be drawn up.
During the Drought
After the approval of the resolution, it is established and organized an institutional solution for managing the drought. The organizational solution proposed for the last drought event comprises two action levels: the Drought Commission for the political and strategic issues, and the Technical Secretariat for the technical and operational issues.
The main activities of the Drought Commission mission are to:
a) Establish the levels for the drought impact severity; b) Install a communication system, using the WEB pages to contact stakeholders and
population and promote awareness-raising campaign; c) Manage the evolution of the drought via regular analyses and the establishment of
measures to be implemented; d) Identify the entities responsible for implementing of these measures; e) Identify and put forward legislative and budget-related initiatives deemed essential
to the implementation of action; f) Identify a set of specific measures to support the agriculture in affected areas, with
special focus on those linking the water surface and groundwater reserves with the efficiency of the use of water;
g) Identify measures recommended by the National Programme for Efficient Water Use that could be immediately implemented and prepare medium and long-term measures;
h) Identify measures that assist in preventing forest fires, within the framework for this area coordinated by the Ministry for Home Affairs;
i) Establish and propose the use of an extraordinary public works, supply of goods and provision of services to urgently resolve extraordinary situations resulting from the drought.
j) Activate the emergency management group inside the CADC (Commission for the

DROUGHT MANAGEMENT PLAN REPORT
70
Development and Application of Albufeira Convention: organization to manage the river water basins shared with Spain).
The specific missions established for the Technical Secretariat are:
a) Guarantee the provision of a fortnightly report on the evolution of the drought situation;
b) Assess the requests for technical and financial support sent to the different entities forming part of the Drought Commission and provide a draft decision to the entity responsible for making the final decision.
The Drought Commission is composed by the main stakeholders, including the national and regional state organizations and the water users.
The operation of the organizational model is especially focused on the permanent availability of information to all authorities, economic agents and the public in general, using information and communication technology. A page on the internet is set up and manages for this purpose. The members of the Secretariat also use this page to exchange documents for decision-making purposes.
The drought evolution is evaluated at real time with the quantification of the water availability in the rivers, reservoirs and groundwater and the water requested by the different water users and different levels of priority and restrictions.
The water storage in the reservoirs is subject to a detail monitoring during the drought and appropriate measures should be taken. The water storage in aquifers is also subject to special monitoring during the drought. The exploitation of the groundwater sources is encouraged because this source is the main alternative in drought times. Incentives to the issue of permits for the survey and abstraction of water during this period are analyzed.
The secretariat establishes intense contacts with the main users to evaluate the technical and economical measures to mitigate the drought impacts, with particular attention to the urban water supply that could imply the road water transport and their individual distribution in extreme cases.
Exceptional measures, including the building of emergency infrastructures and new wells could be implemented according the needs.
After the Drought
When the meteorological indicators show a normal situation related with precipitation and the reservoir storage levels are near to be normal, the Commission for Reservoir Management should propose the end of Drought. After the approval by the Government, it begins the climate monitoring in normal situation involving the Meteorological Institute and the Water Institute.
The last task of the Drought Commission is the elaboration of the Drought Balance Report, with the main results and lessons obtained.

DROUGHT MANAGEMENT PLAN REPORT
71
Preparation for the next drought and the new Drought Management System
Following the learnings of the last drought management, the 2005 drought balance report proposed, among other issues, the review of the present drought forecasting and management system and development a Drought Management System. This study is underway and the first results should be in place shortly.
This system will permit pass from a crisis management system to a risk management, increasing the activities of preparedness, planning and the definition of the mitigation measures following the drought severity levels.
The Drought Management System is planned to include the institutional arrangements, the drought monitoring and forecasting system and the mitigation plans, including different levels of action: National, River Basin and Local or for specific sector and different levels of drought severity.
The choice of a global drought indicator is in study. This global indicator should include the meteorological and hydrological indicators and drought impact indicators
The early implementation of measures that must be adopted during a drought imply that the measures must be planned and standardized in contingency plans drawn up for every water resource or set of water resources - in practice, this translates into contingency plans by each management entity. The drawing up of contingency plans must be supervised by the Commission for Reservoir Management to ensure that a coordinated approach and common criteria are followed and subject to public consultation.
The establishment of a reliable information system providing data for water availability and water uses on space and time is essential for the drought management and should be implemented. The links with water quality system should be established.

DROUGHT MANAGEMENT PLAN REPORT
72
Other experiences
Development of a decision support system for freshwater management during water shortage periods
Periods of low discharge in the river Meuse can cause serious crises in Dutch and Flemish regions. Until recent, knowledge, understanding and awareness of these events and their consequences have been rather poor. The focus on water-related problems in the Flemish region was mainly on flood prevention until a minor water shortage period during the summer of 2003.
More insight in the effects of these low-discharge events was needed. Therefore, an inventory of relevant water-fluxes and water-users in the, Meuse-dependent, Flemish canal-system was made through literature study, field excursions and measurements and exploration of topographic maps. After selecting relevant water-fluxes, water-users were contacted and questioned through inquiries and interviews about their dependency on Meuse-water, the variability of their water-use and their attitude towards certain measures. A workshop was organised to obtain feedback on the received information and to inform the water-users of the purpose of the study.
Consequently, a water-balance model was developed which integrated all gathered data and info. The water-basin modelling software Mike Basin (DHI), adjusted with Visual Basic modules was used to simulate the network of the water system and the dependent water-chain. Water-use was estimated using daily water-chain values of 2002, while the water-system (Meuse discharge and local meteorology) reflected a historical water shortage period, on a daily time-base. The model evaluates whether the Flemish region fulfils the stipulations of the Flemish-Dutch Meuse treaty at a given Meuse-discharge. If the Flemish water-demand is too high, a low-flow strategy is applied to reduce the Flemish water-use. Different alternative low-flow strategies have been evaluated making use of indicators such as economical damage and the number of days of certain non-quantifiable consequences.
The developed model improved insight into the dependency of the Flemish region on water from the river Meuse and identifies possible measures to lower this dependency during water-shortage periods.

DROUGHT MANAGEMENT PLAN REPORT
73
A 3. Examples on drought indicators systems
UK Experience
UK Drought case studies; Defra and Environment Agency, October 2007
This case study explores the definition of drought in the United Kingdom through a review of historic droughts and summarises the UK approach to drought identification and management.
Droughts can occur in all parts of the UK. The UK climate regime is highly variable, so periods of dry weather can occur at any time of the year. An extended period of dry weather becomes a drought only when there is a significant impact on the environment, people, businesses or agriculture.
1. Historic droughts in the UK
A recent project for the Environment Agency for England and Wales (EA) to identify droughts from the last 200 years looked at long rainfall and river flow records as well as documentary evidence3. In the nineteenth century there were some very long periods of drought. These are reported to have caused serious shortages in water supply to towns and cities, with supplies cut off at night and factories running out of water, as well as agricultural crop failure.
The last notable drought in the UK was in south east England from 2004 to 2006. Two consecutive dry winters led to restrictions on garden watering and car washing for 16 million people. Low groundwater levels and river flows created problems for wildlife and fish, and we estimate that there were around 20% more environmental incidents than in a normal year. These included fish deaths and algal blooms.
Droughts have different impacts depending on their location and duration. Much of south-east England can cope readily with one dry winter even if it is followed by a dry summer, as the storage in the chalk aquifers maintains river flows. In contrast, a dry winter followed by a dry summer and autumn can cause water supply problems in the north and west, where most water supply comes from surface water and reservoirs.
2. Drought identification
There is no single, universally accepted definition of drought in the UK. The historic record shows that no two droughts are the same, and the impact depends on duration, intensity and location. For this reason, there is no legal definition of drought in the UK,
3 Major droughts in England and Wales from 1800 and evidence of impact. Environment Agency Science Report: SC040068/SR1

DROUGHT MANAGEMENT PLAN REPORT
74
although there has been legal provision for drought action since the 1940s. The legislation avoids defining droughts to allow judgments to be made based on a wide range of drought indicators.
In England and Wales, water suppliers are allowed, without further permission, to introduce restrictions on using hosepipes for garden watering and car washing. This is usually the first drought measure that is taken. The EA has the power to restrict or ban agricultural spray irrigation if this is necessary to protect the environment.
Further drought measures require legal permission either from the EA or Ministers. This permission can be given only if there has been an exceptional shortage of rain -the applicant needs to demonstrate that a shortage of rain over a relevant period threatens either the environment or public water supply. The further drought measures that can be taken include restrictions on abstractions and some non-essential uses of water from the public supply. Ultimately in a very severe drought, water companies can apply to restrict water demand by using either standpipes or through rota cuts in supplies. These measures have not been taken for drought purposes since 1976.
This framework of actions allows flexibility to deal with a wide range of droughts, ranging from short, localised intense droughts to wide-scale, long droughts.
3. Drought management In normal conditions, there are no particular drought actions other than monitoring hydrological and environmental conditions. Long-term water resources planning and drought planning are best carried out in normal conditions, but both form part of the continuum of drought management.
A potential drought is signalled by a period of unusually low rainfall, accompanied by river flows and groundwater levels that are below normal. There is no drought impact but continued low rainfall could cause problems. At this stage organisations start to get ready to deal with drought. A drought is not inevitable: a return to normal rainfall would return river flows and groundwater levels to normal and alleviate the pressure on the environment and water availability.
Drought is the stage where the impact of drought can be measured, either on the environment or on water availability. Some droughts can have a very minor impact, while others are extremely serious. The UK does not attempt to define different drought severity: droughts are complex events and there is no benefit in debating the exact stage of a drought. Nor does not it have a particular definition of prolonged drought: different drought durations are important in different locations and for different water use sectors. It is more important to make sure that appropriate actions are taken: these must be proportionate to the potential impact and specific to the drought being experienced. In England and Wales we use a series of different measures to look at drought severity and duration:
• River flows and groundwater levels warn of impending drought; • Accumulated rainfall compared to previous droughts shows potential drought
severity; • Environmental incidents show the impact on the environment;

DROUGHT MANAGEMENT PLAN REPORT
75
• Reservoir levels show the state of water resources.
The EA has developed drought plans to cover different scales of operation and different drought stages. These plans are published on the internet (www.environment-agency.gov.uk/drought) and were subject to public consultation. These are operational plans that set out drought monitoring, the temporary organisational changes that will be made during a drought, and the steps that will be taken to manage the water environment.
Water supply companies also have a responsibility to plan for drought. Drought planning starts in companies’ long-term plans. Each water company has a statutory duty to prepare a 25-year water resources management plan, revised every 5 years. These plans are designed to allow public water supply to continue through a repeat of the worst droughts of the last hundred years with only restrictions on non-essential water use in the worst droughts. They also have to prepare drought plans every 3 years. These show the operational steps that water companies plan to take to manage a developing drought. They identify the triggers for action and the steps that will be taken to make sure that water supply continues while minimising environmental damage.
Both sets of plans undergo public consultation. This means that people have a chance to comment on the actions that water companies plan to take.
Post-drought review
Only after a drought is over can the duration and extent of the drought be identified. Rainfall deficit is an important part of measuring drought duration and intensity, but only tells part of the story. Comparison between droughts is important, but this must be done on a common basis with a consistent and rational start point. We start comparisons at the start of the UK hydrological year in October (Figure 1). Comparing accumulated rainfall with long-term average rainfall is a useful way of comparing different droughts, but it is also important to look at impact.
Figure 1 – Cumulative rainfall plot showing relative severity of different droughts

DROUGHT MANAGEMENT PLAN REPORT
76
Impact must be measured both in environmental and social terms. For example the 2006 drought was similar in rainfall totals to some of the most serious droughts of the twentieth century, but the social impact was relatively small - minor restrictions on car washing and garden watering. On the other hand, there were around 20% more environmental incidents than in a normal year.
Summary
In the UK drought planning is part of the continuum of water resources planning. Long-term water supply plans allow for occasional drought. Drought plans set out the actions that will be taken to manage water supplies and the environment during a drought. Drought management is specific to each drought but takes place within this legislative planning framework. This means that the impact of drought on people and the environment can be planned and minimised.
Spanish Experience
The national or Global Hydrological Indicator System in Spain reflects drought severity through the definition of four drought statuses with and increasing severity degree: normality, pre-alert, alert and emergency (or extreme status) and associated colours. This system constitutes an essential element of the Spanish DMP and provides information on the hydrological status in a series of control points distributed throughout the river basins and the different management systems. It includes information on the stored volume in reservoirs, piezometric levels in aquifers and fluvial total discharge of natural precipitation patterns in representative pluviometric stations, among other variables. The definition of the indicator “threshold values” for characterising drought phases and its severity is based on the analysis of historical droughts and hydrological simulation techniques.
Through the weighting of the indicator value on each point, the global indicator value for the different existing resources management systems (sub-basin scale) can be obtained. The following graph of the Júcar River Basin presents the indicator’s evolution over the past twenty years, reflecting two severe drought episodes.

DROUGHT MANAGEMENT PLAN REPORT
77
Spanish Drought indicator; Júcar River Basin example
The Global Hydrological Indicator System has been developed from the indicator system of the different basins dependent on the Ministry of Environment, and status maps have been elaborated since December 2005. In the following figures, a partial evolution of this Global System indicator status is shown for two months.
July 2007 August 2007
An alternative methodology is based on the suggested pluviometric indicator by the EC for the working group Water Scarcity and Droughts Expert Network. It proposes an improvement over the indicator initially proposed by the EC, which used the direct relationship between each seasonal value and the historical average provided by Eurostat. The methodology here proposed offers noticeable tendencies of the dry and wet periods, closer to the real hydrological patterns. The calculation of the moving average on which the indicator is based, consists in obtaining in each step (or cell, as shown in the following figure) the average value of the corresponding season and values of previous seasons.
0
0,1
0,2
0,3
0,4
0,5
0,6
0,7
0,8
0,9
1
oct-8
5oc
t-86
oct-8
7oc
t-88
oct-8
9oc
t-90
oct-9
1oc
t-92
oct-9
3oc
t-94
oct-9
5oc
t-96
oct-9
7oc
t-98
oct-9
9oc
t-00
oct-0
1oc
t-02
oct-0
3oc
t-04
oct-0
5oc
t-06
Normality
Pre-alert
Alert
Emergency
VALOR ÍNDICE ESTADO INDEX VALUE
ESTADO STATUS
0,75-1,00
0,50-0,75 NORMALIDAD
NORMALITY
0,30-0,50 PREALERTA PRE-WARNING
0,15-0,30 ALERTA ALERT
0,00-0,15 EMERGENCIA EMERGENCY

DROUGHT MANAGEMENT PLAN REPORT
78
∑∑
−
−
= 3i
i
3i
i
(i) Averageion precipitatSeason
(i)ion Precipitati) (Step steps 4 average Moving
The number of elements for calculating the average will depend on the regulation capacity of the river basin (depending on existing reservoirs, their storage volume, and available groundwater resources).
In the provided example, which corresponds to the Júcar River basin, technical experience shows that at least one complete hydrological year is needed (two steps, equivalent to two seasons) to obtain significant tendencies in the variation of dry and wet periods. For instance, for summer 1990 the selected precipitation values would correspond to autumn and winter 1989, and spring and summer 1990. The formula’s denominator is the yearly average precipitation. In low regulation capacity basins, two steps might be selected by expert criteria as drought is reflected in monthly periods instead of annual or inter-annual (case of Mediterranean basins). The following figure shows the result of applying the indicator compared with the more complex indicators normally used in Spain. The table reflects an extract of applying the original indicator (seasonal precipitation divided by Eurostat average for the same season) and the proposed indicator (in this case moving average of four steps).
WET PERIOD
Indicator works adequately with moving average (number of steps depends on basin regulation capacity). Oscillation attenuation and expression of previous stations influence.
Basin specificities must be considered (scarcity affection)
Consider modifying thresholds to accurate results
On Jucar Basin, Drought starts on alertstate, due to scarcity factor
Indicator 1 mmMoving average (4 steps) Ie PES
1986 Spring 0,83 118,51 103,24 0,78 0,251986 Summer 1,01 88,68 113,00 0,86 0,161986 Autumn 1,63 280,93 147,24 1,12 0,381986 Winter 1,36 167,87 164,00 1,24 0,351987 Spring 0,42 59,76 149,31 1,13 0,401987 Summer 0,89 78,18 146,68 1,11 0,341987 Autumn 1,35 232,80 134,65 1,02 0,361987 Winter 1,24 152,31 130,76 0,99 0,461988 Spring 1,15 165,07 157,09 1,19 0,421988 Summer 1,43 126,26 169,11 1,28 0,451988 Autumn 1,12 193,04 159,17 1,21 0,421988 Winter 0,73 89,70 143,52 1,09 0,341989 Spring 1,60 229,15 159,54 1,21 0,411989 Summer 1,00 88,43 150,08 1,14 0,391989 Autumn 1,82 313,99 180,32 1,37 0,381989 Winter 1,57 193,69 206,32 1,57 0,451990 Spring 0,88 126,76 180,72 1,37 0,381990 Summer 1,05 92,81 181,81 1,38 0,341990 Autumn 1,15 197,56 152,70 1,16 0,371990 Winter 1,12 137,96 138,77 1,05 0,321991 Spring 1,11 158,56 146,72 1,11 0,441991 Summer 0,99 87,21 145,32 1,10 0,391991 Autumn 0,78 133,57 129,33 0,98 0,311991 Winter 1,04 128,07 126,85 0,96 0,281992 Spring 0,62 88,56 109,35 0,83 0,311992 Summer 1,66 146,13 124,08 0,94 0,301992 Autumn 0,56 95,64 114,60 0,87 0,221992 Winter 1,19 146,03 119,09 0,90 0,201993 Spring 0,88 125,56 128,34 0,97 0,231993 Summer 0,70 61,85 107,27 0,81 0,181993 Autumn 1,02 175,91 127,34 0,97 0,191993 Winter 0,36 44,50 101,95 0,77 0,171994 Spring 0,63 90,51 93,19 0,71 0,231994 Summer 0,22 19,76 82,67 0,63 0,18 DROUGHT1994 Autumn 1,24 212,87 91,91 0,70 0,21 PERIOD1994 Winter 0,26 31,79 88,73 0,67 0,19 OBSERVED1995 Spring 0,32 45,35 77,44 0,59 0,10 IN DROUGHT1995 Summer 1,28 113,10 100,78 0,76 0,16 PLAN1995 Autumn 0,52 88,88 69,78 0,53 0,201995 Winter 1,79 220,52 116,96 0,89 0,34
DMPIndicator 1 mm
Moving average (4 steps) Ie PES1986 Spring 0,83 118,51 103,24 0,78 0,251986 Summer 1,01 88,68 113,00 0,86 0,161986 Autumn 1,63 280,93 147,24 1,12 0,381986 Winter 1,36 167,87 164,00 1,24 0,351987 Spring 0,42 59,76 149,31 1,13 0,401987 Summer 0,89 78,18 146,68 1,11 0,341987 Autumn 1,35 232,80 134,65 1,02 0,361987 Winter 1,24 152,31 130,76 0,99 0,461988 Spring 1,15 165,07 157,09 1,19 0,421988 Summer 1,43 126,26 169,11 1,28 0,451988 Autumn 1,12 193,04 159,17 1,21 0,421988 Winter 0,73 89,70 143,52 1,09 0,341989 Spring 1,60 229,15 159,54 1,21 0,411989 Summer 1,00 88,43 150,08 1,14 0,391989 Autumn 1,82 313,99 180,32 1,37 0,381989 Winter 1,57 193,69 206,32 1,57 0,451990 Spring 0,88 126,76 180,72 1,37 0,381990 Summer 1,05 92,81 181,81 1,38 0,341990 Autumn 1,15 197,56 152,70 1,16 0,371990 Winter 1,12 137,96 138,77 1,05 0,321991 Spring 1,11 158,56 146,72 1,11 0,441991 Summer 0,99 87,21 145,32 1,10 0,391991 Autumn 0,78 133,57 129,33 0,98 0,311991 Winter 1,04 128,07 126,85 0,96 0,281992 Spring 0,62 88,56 109,35 0,83 0,311992 Summer 1,66 146,13 124,08 0,94 0,301992 Autumn 0,56 95,64 114,60 0,87 0,221992 Winter 1,19 146,03 119,09 0,90 0,201993 Spring 0,88 125,56 128,34 0,97 0,231993 Summer 0,70 61,85 107,27 0,81 0,181993 Autumn 1,02 175,91 127,34 0,97 0,191993 Winter 0,36 44,50 101,95 0,77 0,171994 Spring 0,63 90,51 93,19 0,71 0,231994 Summer 0,22 19,76 82,67 0,63 0,18 DROUGHT1994 Autumn 1,24 212,87 91,91 0,70 0,21 PERIOD1994 Winter 0,26 31,79 88,73 0,67 0,19 OBSERVED1995 Spring 0,32 45,35 77,44 0,59 0,10 IN DROUGHT1995 Summer 1,28 113,10 100,78 0,76 0,16 PLAN1995 Autumn 0,52 88,88 69,78 0,53 0,201995 Winter 1,79 220,52 116,96 0,89 0,34
DMP
Original indicator
PrecipitationMoving average
Proposed indicator
Spanish DMP indicator
DRY PERIOD
The column “Ie DMP” expresses the indicator value for the Spanish DMP for the represented period. The last column shows the periods classified as “historical droughts” by the DMP themselves. The precipitation value has been corrected from the areal precipitation values per basin that are normally used, to correlate them with the

DROUGHT MANAGEMENT PLAN REPORT
79
series obtained through the historical values of Eurostat:
ValueAverageSpanishValueAverageEurostatnecipitatioOriginalnecipitatiodTransforme
____Pr_Pr_ ⋅
=
The graph below shows the proposed indicator, which improves the correspondence between precipitation and drought episodes, in relation with the precipitation value for each season.
0
0,1
0,2
0,3
0,4
0,5
0,6
0,7
0,8
0,9
1
1,1
1,2
1,3
1,4
1,5
1,6
1,7
1,8
1,9
2
1976
1976
1977
1978
1979
1979
1980
1981
1982
1982
1983
1984
1985
1985
1986
1987
1988
1988
1989
1990
1991
1991
1992
1993
1994
1994
1995
1996
1997
1997
1998
1999
2000
2000
2001
2002
2003
2003
2004
2005
2006
2006
Year
Indi
cato
r
Moving average: better distribution parallelism
DMP indicator
Proposed indicator
Original indicator
Drought indicator proposal, Júcar River Basin example
By comparing both methodologies, a higher accuracy is obtained through the Global Hydrological Indicator System used in Spanish DMP. This is because the system considers integrated hydrological management parameters.
The definition of an indicator for all EU Member States necessarily implies reaching a common measuring system, built up on available data, in a simple way and representing a straightforward concept. In the case of droughts, precipitation can then be an easily applicable indicator. The example provided tries to show how such a simple indicator, based on precipitation, could approach the real behaviour of hydrological management systems. By using basic formulations, and applying a simulation that approximates meteorological tendencies to management tendencies, the indicator could be applied in the different affected regions by droughts.
Portuguese Experience
Following the methodology applied during the Drought of 2005, it is presented a brief
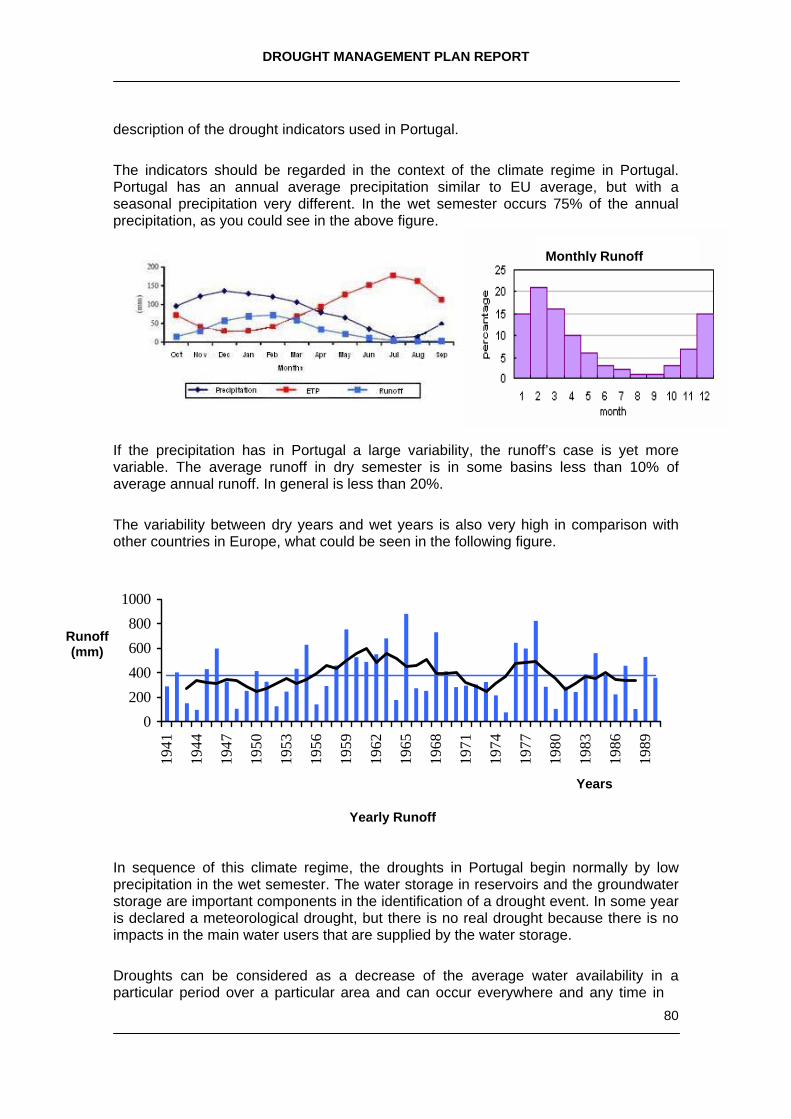
DROUGHT MANAGEMENT PLAN REPORT
80
description of the drought indicators used in Portugal.
The indicators should be regarded in the context of the climate regime in Portugal. Portugal has an annual average precipitation similar to EU average, but with a seasonal precipitation very different. In the wet semester occurs 75% of the annual precipitation, as you could see in the above figure.
If the precipitation has in Portugal a large variability, the runoff’s case is yet more variable. The average runoff in dry semester is in some basins less than 10% of average annual runoff. In general is less than 20%.
The variability between dry years and wet years is also very high in comparison with other countries in Europe, what could be seen in the following figure.
In sequence of this climate regime, the droughts in Portugal begin normally by low precipitation in the wet semester. The water storage in reservoirs and the groundwater storage are important components in the identification of a drought event. In some year is declared a meteorological drought, but there is no real drought because there is no impacts in the main water users that are supplied by the water storage.
Droughts can be considered as a decrease of the average water availability in a particular period over a particular area and can occur everywhere and any time in
Monthly Runoff
0200400600800
1000
1941
1944
1947
1950
1953
1956
1959
1962
1965
1968
1971
1974
1977
1980
1983
1986
1989
Anos
Esco
amen
to (m
m)
Esc. Anual médio Média móvel de 5 anosYearly Runoff
Runoff (mm)
Years

DROUGHT MANAGEMENT PLAN REPORT
81
Portugal. The extreme and severe droughts in Portugal have in general a return of 10-15 years, duration of 1 to 3 years, affecting in general all country.
The main drought events in the last years were:
• 1944-1945: duration 2 years, with impacts on all territory; • 1953-1954: duration 2 years, affecting 50% of the Portuguese territory; • 1975-1976: duration 1,5 years, affecting 40% of Portuguese territory; • 1981-1983: duration 2,5 years, affecting 90% of Portuguese territory; • 1992-1993: duration 2 years, affecting all territory (during 1994 and 1995 there
was a moderate drought); • 2004-2005: duration 1,5 years, affecting all territory.
In the next figure is possible to understand the severity of the Drought of 2005 through the distribution of the Palmer index. The drought affected in general all country with an extreme and severe drought installed during several months.
The increase of the degradation of the river water quality by the drought 2004-2005 is very clear demonstrated by the evolution of the river water quality in Portugal following the monitoring water quality system. The next figure presented the evolution of river water quality by water quality classes.
PDSI
In July 2005 27%
73%

DROUGHT MANAGEMENT PLAN REPORT
82
From 1997 to 2004, we could see the increase of river water quality in Portugal with decrease of the number of stations with bad quality (D&E classes) and the increase of number of stations with better quality (A&B classes). This evolution was ended with the drought of 2004-2005 due the low river flows and the transport of concentrated pollutants provoked by the initial rains and subsequent runoff. Effectively the extreme droughts affect the good status of the water quality in the streams.
In nowadays, the drought monitoring is based in meteorological and hydrological indicators and the expected urban and agriculture demands. There is underway a study to create and calibrate a global indicator to identify droughts, using no only meteorological and hydrological data, but also drought impacts data. The results should in place in next two years.
In normal climate conditions (before to be declared a drought), the Water Institute and Meteorological Institute monitory precipitation, flows in the rivers, water storage in the reservoirs, groundwater levels and water quality. The National Commission for Reservoir Management follows the situation through periodical meetings and regional sub-commissions.
The Meteorological evaluation is done applying the Standardized Precipitation Index (SPI), the Palmer Drought Severity Index (PDSI) and the Regional Drought Distribution Model, with monthly precipitation data.
The SPI and PDSI are calculated to single points, using monthly data. The spatial distribution of the indicator results is done applying the traditional spatial analysis using Geographic Information System Software. The spatial distribution of the drought indicators are classified by drought classes (extreme, severe, moderate, mild, normal and above normal), see above figure about PDSI index.
The Regional Drought Distribution Model reaches the similar results using a statistical model to calculate the spatial distribution of droughts associated with the risk of their
Rat
e of
sta
tions
Years
D+E classes

DROUGHT MANAGEMENT PLAN REPORT
83
occurrence. The final objective is to compare the drought intensity with severity-area-frequency curves and estimate the return period of regional drought.
The hydrological indicators are calculated from the data collected by Water Institute: piezometric levels, river flows, reservoir water levels and water quality, using the existent network stations. These indicators are defined by a percentile of long-term monthly average data and are online on SNIRH web: www.snirh.pt. The reservoir water storage is calculated by river basins and by reservoir.
When the meteorological indicators begin to show in all country or a specific part of the country the existence of a potential drought and the water storages in the reservoirs are low (down certain threshold) and the economic and social impacts of the water availability to satisfy the water demand are excepted, the Water Institute proposed to Government that a state of drought should be declared and a Drought Monitoring and Impact Mitigating Programme be drawn up.
When the results of drought monitoring results show the drought’s end, it is declared the end of the drought and the situation of the normal climate control begins.
French Experience
Every month, a hydrological follow-up compares, since the beginning of the hydrological year (October), cumulative of rainfall and of rainfall minus evapotranspiration with inter-annual averages or with situations of references (1976 for the north of France).
1975-1976
2002-2003

DROUGHT MANAGEMENT PLAN REPORT
84
2004-2005
2006-2007
Cumulative of rainfall minus evapotranspiration in January for hydrological years 1975-1976, 2002-2003, 2004-2005 and 2006-2007: four years and four droughts!
1975-1976: The period is characterized by a very long dry period from December 1975 to August 1976. The absence of effective precipitations in winter has strongly affected the groundwater (it was a “hydrological” drought), especially in the northern half of France.
2002-2003: the period from March to August 2003 is presented in the form of a long drought of spring and summer during which the groundwater do not undergo important impact. Nevertheless, the effects of the heat wave were very important on the individuals and the ecosystems.
2004-2005: after an autumn and a particularly dry winter, the rains were important from April at July. At September the 1st, the majority of the groundwater reserves were low and some of them reached their lower level of the year.
2006-2007: after an autumn and a particularly dry winter, the crisis could have been compared to the one of 2004-2005. However, the important rains which started since April strongly modified the situation, except for aquifers with strong inertia (plurianual recharge).
In the spring, the precipitation situations were quite similar for all the following years: 1975-1976, 2002-2003, 2004-2005 and 2006-2007, but it was 2002-2003 that the most important impacts of drought happened in France.
1976 is the drought reference. We can compare cumulative rainfall with chronicles.

DROUGHT MANAGEMENT PLAN REPORT
85
Even if 1976 is French drought reference, in 2006, after a particularly rainy spring, a quarter of the territory presented administrative measurements of restriction of the uses. 10 departments were in very important crisis.
Every week, we can compare cumulative rainfall from the beginning of the hydrological year and administrative measurements of restriction of the uses.
cumulative of rainfall
-30 m
-25 m
-20 m
-15 m
-10 m
-5 m
0 m
janv m ars mai jui l se pt nov
maxi mum 2,007moye nne 2,006mini mum
-30
-25
-20
-15
-10
-5
0
1976
1978
1980
1982
1984
1986
1988
1990
1992
1994
1996
1998
2000
2002
2004
2006
2008
Prof
onde
ur e
n m
/sol
ST-MARTIN-DE-CHENNETRON (02603X0009)
Calcaire de ChampignyIle-de-France
Source : BRGM Ile-de-France
piezometry of champigny groundwater body.

DROUGHT MANAGEMENT PLAN REPORT
86
It term of rainfalls 2006-2007 seems to be a good hydrological year. The temperatures were relatively high. The share of rainfalls taking part in the river flows and aquifer level was weak. Around Paris, the majority of the departments are in crisis since weeks. Groundwater, which provides a majority of drinking water for Paris and its suburbs, reaches very low levels (e.g. champigny groundwater). This low level is not due to overexploitation, because there is no irrigation in this area.
With this hydrological follow-up, we are trying to test an indicator of severity for the low water level available in aquifers. This indicator is available on a weekly frequency. Its definition on a national level should allow comparing geographical and temporal evolution of hydrological and biological consequences of a drought on the whole of the metropolitan departments.
The indicator is built on three components:
• measurements of flows of the principal rivers (1) • observation of the “assecs” (Dried-out riverbeds) (2) • administrative measurements of restriction of the uses (3)
Total Indicator
The hydrological component of the total indicator is represented by the flow of the great rivers (1) and by index ROCA on smallest (2). Initially one will take the value more penalizing (i.e. strongest) of these two indices in order to obtain a total hydrological level of each department.
In the second step, the taking into account of the economic impact of the low water level will be integrated by realising the figure obtained previously with that of the index representing administrative measurements (3). This makes it possible to decrease the “hydrological” class of each department when the weak uses do not involve the catch of decrees as to increase it when decrees justified by a lack of subsoil water are taken.
Now the weighting coefficient initially and even rule of round-off that previously:
Classe département = [ max (index 1, index 2) + index 3 ] / 2
Index 3 not being never null, we obtain final total indicator with four classes:
• Classe 1 - Normal situation • Classe 2 - Situation of vigilance • Classe 3 - Situation of strong drought • Classe 4 - Situation of exceptional drought
After one year, this indicator is used in France. However, it is very difficult to communicate with it.

DROUGHT MANAGEMENT PLAN REPORT
87
What do we expect from a drought indicator?
A drought indicator should make possible to manage water supply on one potentially touched basin by lack of rainfall. Such an indicator should give a tendency, but could not characterize the event, by allowing comparing it with another event. This indicator is part in an early warning system and of an administrative plan of water supply restriction.
Finnish Experience
Finland has had a severe drought in 2002-2003. Another drought, which is more widely known, but not well recorded, was experienced in 1941-1942. Differences between these two droughts are: the drought duration varied from 9 months (2002-2003) to 18 months (1941-1942), aerial impact varied nationwide from 50-100 % (both covering southern Finland), only a little damage was recorded during 2002-2003 and a probably a lot more during years 1941-1942.
In Finland, we normally identify drought on the basis on rainfall, but not necessarily limited to yearly or monthly rainfall only, but can be biannual, or 3 months period, etc. Meaning that we take the actual low-rainfall period and we compare it to the same periods in our time series and calculate the probability. This normally gives reasonably reliable results, i.e. there has been a good correlation between the droughts identified this way and the actual drought conditions in the field.
One definition used: during the drought period precipitation is less than long-term average minus 2 x standard deviation.
Example: From precipitation time series 1961-1990 mean values Xm for each month or for longer periods and their standard deviations Sm can be calculated. A month or period is dry if observed precipitation Ym is less than (Xm – 2 * Sm).
The coverage of evaporation data in Finland is not as wide as the rainfall data, but we have quite good statistics on average evaporation during the various months, which can be used with sufficient accuracy. (It should be noted that practically evaporation and evapotranspiration takes place only during the summer months (May-August) and is negligent during the rest of the year).
In Finland, we do not really have a definition to differentiate a drought from a “prolonged drought”. For us a drought has been a phenomena which has causes a serious and widespread shortage of water (normally shortage of water supply) caused by deficit of water resources (ground water and surface water).
In our climate, prolonged drought could mean at least drought lasting over a growing season, i.e. the 3 summer months, but rainfall deficit accumulating already from the preceding winter season (meaning the snowmelt would be small or non-existing).
In Finland, rainfall is the main indicator, but so we use some other indicators

DROUGHT MANAGEMENT PLAN REPORT
88
particularly when predicting the risk for drought. These are:
- The water equivalent of the snow
- Level of lakes and reservoirs
- Ground water levels
The drought of 2002-2003 in Finland
Climate models project that summers are likely to be somewhat drier and longer than at present. As a result, the water level in small lakes and groundwater levels will probably be lower during summers (Figure 6). Increased evapotranspiration and lake evaporation in spring and early summer is also harmful. Fortunately, minimum summer soil moisture values in southern Finland are currently so small that the increased evaporation cannot cause considerable further reduction during dry summers. Additionally, during summer groundwater level will decrease. Impacts of drought The impact of a drought and related severe weather was a reality for Finland and the surrounding areas in both 2002 and 2003. A study carried out at the Finnish Environment Institute (SYKE) was an effort to examine these impacts on water use, power production, agriculture, water traffic, forest, buildings (Figure 18) and environment (Silander and Järvinen 2004). The drought did not just cause significant economic damage to the regional economy but also to the fish habitat in hundreds of lakes. In addition, thousands of households suffered from water scarcity, and a lot more carbon dioxide was released into the atmosphere than normally because part of the hydropower deficit was substituted using coal-fired power plants. The recent drought in Finland cost more than 100 million Euros. The study targeted one of the main aspects of drought mitigation and planning which is the assessment of who and what is vulnerable and why. The identification of drought vulnerability is an essential step to address the impact of climate change.
This exceptional 2002-2003 drought in southern and central Finland lasted 9 months. A previous exceptional hydrological drought, that covered the entire country, was between 1940 and 1942, lasting nearly 16 months. Average annual discharge from Finland dropped, in the recent drought, from 3200 m3s-1 to 2100 m3s-1; in 1941 it was only 1600 m3s-1. The groundwater level dropped in southern Finland by about 0,5 -1,5 meters. Annual precipitation was less than 400 mm in some areas.
The recent drought resulted in water shortage and made it necessary to transport water to thousands of households and farms in rural and other sparsely populated areas. The low groundwater level caused problems to many buildings (foundations) and sewage pipe lines (leakage). Due to lower water levels, inland water traffic suffered in shallow areas and created problems for cottagers. It is also known that higher water temperatures reduce water quality. This caused some damage to the recreational use of water courses. Additionally, water shortage in the Nordic countries reduced hydroelectric power generation and doubled the price of electricity (on the stock market) for a short time. Drought also doubled the number of forest fires and increased the risk of pest outbreaks. Crop production dropped only a little due to the fact that drought was mainly during autumn and winter, even though the summer was very

DROUGHT MANAGEMENT PLAN REPORT
89
warm. During a drought, fisheries may also be at risk, and future climate change is thought likely to affect some species sensitive to changes in water temperature. However, only minor impacts were observed during 2002 and 2003. Total costs by each sector are shown in Table 1.
Table 1. Estimated damage of the drought in years 2002 and 2003 in millions on Euros.
Water supply and sewerage 8* Hydropower production 50** Agriculture 15 Forestry 2 Building 25 Inland water traffic 0,5 Recreational use of water course 1 Total ~102
* Doesn't include cost to the water supply companies.
** Estimated value based on additional cost due to the use of more expensive energy sources.
Adaptation for drought
To mitigate the impact of a drought, more power lines may be required as well as a larger market area than Scandinavia (with a large dependence on hydropower), to avoid high electricity prices in the near future. Another challenge concerns maintaining CO2-levels at 1990 levels, as required under the Kyoto Protocol. Building damages can mainly be avoided by requiring piling in clay areas and monitoring timber piled buildings. In the water supply sector, existing wells need to be kept in good shape, because municipal water plants may not always be able to deliver water to all households. To prevent sewerage pipeline breakages during droughts, new methods of installing these pipes should be introduced. In agriculture, farming practices may need to be revised especially in areas of high sensitivity for rainless periods. Inland water traffic problems can mainly be avoided by dredging channels and partly by introducing new regulation practices. We should also be able to estimate groundwater levels in a changing climate. Improvements in water quality may be required by oxidizing the water in shallow lakes.
Experience of the Netherlands
The main parameter in the Dutch drought indicator system is the discharge of the rivers Rhine and Meuse. This because the water need in the Netherlands (for households, agriculture, industry, and electricity plant cooling) is mostly supplied by these two rivers. The Rhine is the most important river, because its water serves 75% of the surface area of the Netherlands area. The main additional parameter is the moving precipitation deficit, calculated from 1 April onward. Only the period from April to the end of September is of relevance for drought assessment in the Netherlands.

DROUGHT MANAGEMENT PLAN REPORT
90
Background information
In a flat country like the Netherlands water can be readily distributed through a network of canals and ditches. During dry periods river water is transferred into the network, and used for agriculture. Locally the surface water network is also needed to set up water levels preventing intrusion of saline groundwater. In areas where no surface water is available, groundwater is used for irrigating. However under normal conditions (no drought) the main water source for agriculture is precipitation, either directly or through the replenishment of the groundwater.
Water used by industry and households is partly taken from rivers and partly from groundwater. On a yearly basis recharge exceeds the groundwater abstraction. However during dry periods, especially in summer, groundwater volumes may decrease. Irreversible damage to groundwater dependent ecosystems is a major criterion for restrictions on groundwater abstraction.
Power plants use river water or seawater for cooling. The water returned has to meet certain quality requirements. During dry summers, power plants along rivers have the water temperature as a major constraint.
River discharge
Discharge thresholds for the river Rhine and river Meuse have been defined where these rivers enter the Netherlands. The thresholds are based on the expected water demand. The latter depends to a large extent on the phase of the agricultural growth season. Hence the threshold for the river Rhine vary from 1400 m3/sec in May to 1000 m3/sec in September and later months.
When the river discharge drops below the threshold, procedures are initiated to further assess the drought risk and the need for measures. Expert judgment plays a key role, taking into account additional parameters such as the precipitation deficit across the Netherlands, the magnitude of the large freshwater reserves such as lake IJsselmeer, the estimated water demand by agriculture, and the expected amount of cooling water needed for power plants. Detailed assessment and action schemes have been established.
Precipitation
Precipitation is evaluated through the moving precipitation deficit calculated from 1 April onward (i.e. the deficit at 1 April is zero by definition). The precipitation deficit is calculated as the precipitation from 1 April onward minus the evapotranspiration from 1 April onward. The extent of concern presented by the precipitation deficit is assessed on the basis of values that occurred in dry years in the past, as illustrated in Figure 1.

DROUGHT MANAGEMENT PLAN REPORT
91
Figure 1: Moving precipitation deficit in the Netherlands, calculated from 1 April onward; averaged over 13 monitoring stations across the country.
Green line: 5th percentile of driest years
Blue line: median (50th percentile)
Red line: 1976
Black line: 2007
Linking drought severity to probability
Table 1 presents the probability of certain degrees of drought severity based on river discharge and precipitation deficit.
Table 1: Estimated return period of some identified dry years based on combined statistics of river discharge and precipitation deficit

DROUGHT MANAGEMENT PLAN REPORT
92
Year return period (years)
1949 17
1959 55
1976 110
2003 12
Recently a major policy study on drought risk management developed a scheme for qualifying drought severity on the basis of the (adverse) consequences of the drought, taking into account a detailed list of economical, environmental and social factors. Since consequences will only be known after the drought event, the scheme cannot be used for operational management.
Italian Experience
In recent years, Italy has experienced several severe droughts affecting large areas of the country or the entire territory. After the extended drought between 1988 and 1992, with socio-economic effects to 1995 and beyond, the need to implement monitoring tools as first step towards deeper knowledge of the phenomenon was recognized, being the knowledge premise of the development of proper strategies for the mitigation of its effects and the planning of interventions and measures to take during the drought management phases and for preventing water shortages. As a result, a National as well as several regional Drought Bulletins were implemented.
APAT, in the framework of the activities of PIC INTERREG II C “Territorial planning and coping with the effects of drought”, with the scientific support of various Universities, developed a Drought Bulletin, in principle as a prototype and now operating for several years and extended to cover, from the meteorological point of view, the entire Mediterranean basin. The analysis of the climatic condition in Italy is available from the first days of each month and it can be consulted on the APAT web site at the address http://apat.it where it is possible to also obtain the full text of the publication from which the major part of the information about the national and regional approach to the drought was taken.
The drought conditions are documented by some significant indexes, among which the Standard Precipitation Index and the Palmer Drought Severity Index.
APAT Drought Bulletin- 09/2007 - Europe

DROUGHT MANAGEMENT PLAN REPORT
93
SPI 3 month SPI 6 month SPI 12 month SPI 24 month
While the analyses present on APAT National Drought Bulletin are based on the data of NCEP/NCAR global scale reanalysis, the regional analyses are mainly based on the observed data from the local hydro-meteorological networks. The regional drought bulletins give information on the principal meteo-climatic parameters and on the state of drought in the region, permitting the identification of the affected areas.
The Calabria Region bulletin, managed by the Functional Centre for Civil Protection CFS-MIDMAR and visible on the site http://www.protezionecivilecalabria.it//, integrate on daily scale the data transmitted by the telemetering hydro-meteorological networks present on the regional territory. The ad hoc database for the drought monitoring is organised in order to contain data grouped in decades (precipitation, temperature and SPI). The BD drought data together with the geographical information are elaborated for the production of maps showing the spatial distribution of the principal climatic variables on the web. All the elaborations are printed on a bulletin which every ten days gives information on the temperature, precipitation and meteo forecast at global scale whereas every month it gives information on the state of drought of the interested month for the six zones in which Calabria Region is subdivided.
The prototype bulletin for the drought monitoring in Sicilian Region has been developed by ICA Dept. of Catania University on behalf of the Regional Water Agency – Hydrographic Observatory and it is visible on the web site of the Office at the address http://www.uirsicilia.it//. The information that constitutes the core of the bulletin has been divided into three groups, each constitutes by one or more sub pages. The first group concerns the basic information used for the realization of the bulletin and in particular the map with the location of the selected thermo-pluviometric stations and the observed historical series in the same stations used for the long period statistical calculations (the meteo-hydrologic DB contains historical series for the period 1921-2006). The second group gathers the information regarding the hydro-meteorological variables, object of particular analysis for drought monitoring, transmitted by the telemetering stations of the regional networks. Finally, the third group contains: Precipitation Deficit, SPI, Palmer Index and Storage volumes in Reservoirs and Freatimeters Data.
In Piedmont Region the Drought Bulletin has been developed by the Regional Environmental Agency (http://www.arpa.piemonte.it/upload/dl/Bollettini/bollidromensile.pdf) and it is issued

DROUGHT MANAGEMENT PLAN REPORT
94
monthly, but updated more frequently in case of severe crisis in water availability. It is organized in three sections in which indication on the current state of water resources and the forecast of the phenomenon using the SPI are given In the first section the precipitation of the current month for each sub basin of the region and 3, 6, 12 months SPI are shown. In the bulletin, three maps show the 3 months SPI estimated for the
next month (an attempt of forecasting) for the three different scenarios corresponding to low precipitation, normal precipitation and high precipitation conditions. The second part of the bulletin gives information on the status of snow as water resource in terms of equivalent volume of water in each regional sub basin. Finally, in the last part of the bulletin the conditions of
the available resources are shown using a graph representing the level of Lake Maggiore (the most important natural water reserve in Piedmont) and a table with the stored volumes in the artificial reservoirs.
Also in Veneto Region the monitoring of the drought and water resources status is operated by the regional environmental agency ARPAV http://www.arpa.veneto.it/bollettini/htm/risorsa_idrica.asp
The information reported regards: a synthesis of the regional situation, monthly rainfall (mm) and hydro-climatic balance (P-ETP), SPI calculated for the entire regional territory and the seven early warning zones in which the regional territory is subdivided,
snow fall condition in the Dolomites and Venetian Alps, water equivalent of the snow cover in Piave River basin, Garda Lake situation (levels), water volumes in the main Venetian reservoirs, groundwater situation or aquifers levels for selected monitoring stations, water courses situation or graphs showing average daily discharges

DROUGHT MANAGEMENT PLAN REPORT
95
The Emilia Romagna Region is the only one, until now, that used the drought monitoring tools in order to identify the vulnerable areas. In fact, the Italian Legislation (Decree n. 152/99) assigns to the Regions and the Basin Authorities the check on the
presence of areas subject to or threatened by drought and the adoption of specific protection measures in the framework of the basin planning and its implementation, according to the criteria foreseen in the National Action Plan for Combating Drought and
Desertification approved on 22 December 1998. The vulnerable areas are indicated in the Water Protection Plan, which is the planning instrument at hydro-graphic basin scale envisaged as the proper plan for reaching the water quality objectives and the rational use of the water resources. In the case of Emilia Romagna Region all the available data at the different scales were gathered, starting from the consolidated consideration that the entire Region is subject to drought events. In order to calculate the climatologic indexes, in particular the 3, 6, 12 and 24 months SPI, the quite complete historical series of monthly precipitation available for the period 1952-2000 for 19 stations were used.
The distribution of the used stations gives quantitative information on the spatial variability of the precipitation and related anomalies. The SPI was used for its ability to quantify the precipitation deficit for different time scales, each one of which reflects the impact of drought on the availability of the different water resources. While the soil humidity gives responses also at short-term scales, the groundwater and the water in rivers and reservoirs undergo variations on longer time scale, so all these parameters are monitored for an overall control of the territory (http://www.arpa.emr.it)
Hereinafter two case studies are reported regarding the application of restriction measures on part of Water Basin Authorities in case of drought condition (hydrologic drought).
Case study 1: The Adige River Water Authority, North-East Italy, on the base of a now 8-year experiment, manages a 30,8 mc/s multiple use water abstraction (mainly irrigation) which serves five Irrigation Districts. As regulated by the Regional offices, the abstraction must be decreased on the base of 2 monitoring points in the river where the level is continuously recorded. The abstraction must be reduced when at the upstream point the flow falls below 140 mc/s, and must be stopped when at the downstream point the flow falls below 80 mc/s. In the ranges of flow between the two extreme cases, abstractions are regulated gradually under the Adige River Water Authority indications. A written agreement between the five Irrigation Districts specifies the percentages of water to be used at each flow regime.
Case study 2: The Alto Adriatico Water Authority, North-East Italy, adopted new measures in 2004 to address Water Scarcity and Drought. In case of drought, the Authority declares an emergency status and identifies procedures and interested subjects (in the energy and agriculture sectors specifically). The regulation of abstractions will follow, from that moment, a set scheme of progressive reduction of

DROUGHT MANAGEMENT PLAN REPORT
96
abstractions according to “gravity” of drought and “period of the year”. The criteria is a combination of three return times (20, 10, and 5 years respectively for severe, medium, and light drought) and five periods (April to May, June 1st to 15th, June 16th to August 15th, August 16th to August 31st, September). Minimum flow rates in the river are set in a specific point of the river according to return time (3, 5, and 7 mc/s respectively), and have to be “defined case by case” in other points. Different percentages of reduction of abstractions are set according to the fice periods (in case of severe drought these are 40, 30, 20, 30, and 40% respectively). Hydropower reservoirs must always release enough water to assure irrigation needs as described above, however respecting a minimum volume (20% of the maximum capacity). More in general, technical measures to save water resources are identified and supported, and regulation bodies are requested to reduce water permits duration (maximum 3 years).
An interesting third case study regards the Drought Management Plan adopted by the Drainage and Irrigation District Romagna Occidentale both on meteorological and hydrological indicators.
Case study 3: The Drainage and Irrigation District Romagna Occidentale, North-East Italy, adopted in 2007 a Drought Management Plan. The Plan will be set by each Drainage and Irrigation District and Public Water Agency by the end of 2007, as set by the Regional Drought Management Program. A number of scenarios and measures are set at different levels of meteorological and hydrological droughts (rainfall, lake water level, snow level, Po river level thresholds and/or distribution network emergencies). At District level, four scenarios (alert, pre-alarm, alarm, serious drought) and a large number of measures to be implemented gradually are set, combining them to scenarios and measures set at Regional and second degree Irrigation District level. Measures include also the nomination of a drought representative, constitution of a Drought Panel able to negotiate and impose measures at technical and political level, and a complete communication and advisory system.
References
Monacelli G., Galluccio M.C., Ferramosca E. (2006) –Linee guida per l’individuazione delle aree soggette a fenomeni di siccità (Rome, Italy). Manuali e linee guida APAT 42/2006.

DROUGHT MANAGEMENT PLAN REPORT
97
A.4. Need for advances in drought research
Important issues that could be addressed on drought preparedness include:
• Developing effective indicators and indices to detect and assess drought situations throughout Europe.
• Development and dissemination of drought hazard, vulnerability and risk assessment tools.
• Development of vulnerability assessment methodologies under different environmental conditions, including the predicted climate change in Europe.
• Development of decision support models for the dissemination of drought-related information to end users.
• Appropriate methods to encourage feedback on climate and water supply assessment products.
• Development of decision support systems for the best exploitation of all information available, including drought forecasts, in order to optimize drought management and mitigation measures.
• Development of information systems to disseminate drought-related information to specifically various end user communities and to encourage their feedback on the usefulness of the presented products.
• Improvement of the monitoring, modelling and prediction capacities.
• Support of initiatives related to the development, improvement, promotion, and inter-linkage of early-warning systems.
• Development of national and regional drought and disaster management policies.
• Development of comprehensive drought reduction strategies that emphasize monitoring and early warning, risk assessment, mitigation and response as an essential part of drought preparedness.
• Assessment of the availability of skilled human resources to be involved in drought preparedness planning.
• Addressing the existing gaps and research needs for adequate risk methodologies in order to establish objective links between drought indicators and thresholds on one hand, and operational alarm levels

DROUGHT MANAGEMENT PLAN REPORT
98
necessary to perform decision making during drought situations for taking mitigation measures on the other hand.

DROUGHT MANAGEMENT PLAN REPORT
99
A.5. Funding through CAP
Following are some examples of measures taken by Member States that focus on maintaining and improving security supply and reducing pressures on water resources:
In terms of improving efficiency, actions in Cyprus concerning the establishment of improved irrigation systems (sprinklers, drip irrigation, etc.) are eligible for co-financing.
In Finland, some projects have included elements to improve insufficient or insecure water supply to crops, and similar support seems possible in the next programming period. There is concern, however, that if agriculture moves away from grain and towards special crops, the need for irrigation will increase and there may be pressure to increase funding for drought-related measures in that sector.
In Slovenia, rural development measures include irrigation schemes (using water reservoirs), but also include adaptation measures in case of water deficiency such as new crops and practices to reduce pressure and dependency.
In Italy, maintaining the quantities and improving the quality of water resources is identified as a main objective to be tackled at the regional scale, and the National Strategic Plan includes specific measures for protection of supplies especially under Axis 1 (Improvement of agricultural sector and forestry competitiveness) and Axis 2 (Environmental and rural areas improvement).
Under the 2000–2006 programming period France's included 175 agro-environmental measures classified into 30 types. Only one type, 'reduction of withdrawals at farm scale', was directly related to measures addressing water scarcity and drought; this included two measures:
• reduction of irrigated crop areas;
• Reduction of the level of irrigation per hectare.
France identified that the 2000–2006 rural development programme only slightly contributed to reducing vulnerability to droughts and water scarcity. In the next programme period (2007–2013), funds specifically aimed at water scarcity and droughts will remain limited, with only the 'reduction of the farm irrigated area' measure planned.
Traditionally, irrigation policy has been of major importance in Spain, as part of the rural development policy. For the next programming period, Spain has also identified that there will be a number of examples of actions eligible in the context of water scarcity and drought.

DROUGHT MANAGEMENT PLAN REPORT
100
A.6. Case studies on agricultural measures
As reported in section 8.4. Potential measures catalogue, case study have been identified as examples for some of the categories reported. The cases study results (experimental work, experimental reviews, large areas applications, modelling applications, data collections) are synthesized at the end of this paragraph, and are chosen to help to organize a “potential catalogue of measures”.
Regarding water efficient technologies (conveyance and application efficiency), results from different recent case studies are listed below following saving potential criteria of the table 17 (page 58) of the final report of eco-logic, “EU Water saving potential” - 19/7/2007 (10-60% water saving, 0-30% yield increasing, 10-70 WUE increasing, up to 100% IWUE).
Outcomes, nevertheless, seem to add new information, adding importance to the combined effect of more methods, the percolation reduction, the effects on groundwater recharge, the change of traditional irrigation methods (e.g. rice crops), the differences and synergies among approach level (farm and district). In general, it is identified as crucial to investigate mechanisms, local conditions, case suitability, collateral positive and negative impacts, and to finally identify detailed behaviours guidelines and open questions.
Efficient practices and saving approaches obtain positive results compared with efficient technologies (10-70% water saving, 12-18% yield increasing, 40-75 WUE increasing, up to 100% IWUE, 50-90 percolation reduction, benefit-cost ratio positive indications).
In this group of case studies it is even more stressed the benefit of modelling scenarios, identifying specific conditions and timing of application, best scheduling, crop needs respecting, and environmental considerations. Specificity, “fine tuning”, “unpublished” techniques combinations are successfully experimented, with benefits at various level also in the long term (water, nutrients, herbicides, energy, costs), with the overall target to characterize and utilize in the best way the “agro-systems” more than a specific measure.
New resources of water include new infrastructures and water reuse (rainfall, waste, irrigation, drainage), and seams to identify large quantities of water and environmental benefits (74% drainage reuse, 80% consumption reduction, 32-81% nitrogen saving).Studies clearly remark the need of deep knowledge on possible impacts of these measures, nevertheless recognizing their potential on water saving.
Considering the possibility of the introduction of a “saving culture” in areas where it is a new approach, recommendations are found to address at the same time management, investments and interaction with stakeholder in order to succeed. In general, in order to effectively improve the efficiency of water resource management in agriculture, it seems that there is a need to further investigate the role of irrigation devices, the specificity of cases, the combined effect of different measures, in such a way to avoid

DROUGHT MANAGEMENT PLAN REPORT
101
too generic guidelines which might result in collateral environmental, quantitative, and social negative impacts (as, for example, disregarding previous high “costly” investments).
1. Italy. 2006. Bortolini. Micro sprinklers irrigation vs drip irrigation. Vine trees. Experimental. RESULTS: irrigation water saving (50% by less irrigated area and better irrigation uniformity).
2. Italy. 2007. Interview with experts (first year results). Mini sprinklers irrigation vs. sprinklers. Radicchio. Experimental. RESULTS: irrigation water saving (15%); increase of yield (30%), WUE (70%), and irrigation uniformity.
3. Italy. 2004. Mannini - Irrigation District (second order) “Consorzio Emiliano Romagnolo”. Irrigation management at field level. Experiments review. RESULTS: improvement of irrigation management at field level seems to be one of the most interesting measures to be adopted on the light of recent experiment results; saving potential of irrigation water at field level of: a) 25-30% as a result of adoption of “irrigation suggestions” by experts, with respect to traditional irrigation management; b) 10-15% as a result of adoption of new Kc selected at local level with respect of those more generic suggested by FAO, c) more saving as a result of adoption of " deficit irrigation”, highly different according to culture, cultivar, deficit irrigation management, type of soil, agronomic practices, productivity accepted decrease.
4. Uzbekistan. 2003-2005. Ibragimova. Drip vs. farrow irrigation. Cotton. Experimental. RESULTS: water saved (18-42%). irrigation water efficiency increased (35-103%); yield increased (10-19%)
5. India. 1996-2006. Bhat. Drip fertigation management. Experimental. RESULTS: maximum WUE with 10-days fertigation frequency
6. Lebanon. 2003-2004. Karam. Drip irrigation. Deficit vs full irrigation conditions. Different deficit irrigation management. Sunflower. Experimental. RESULTS: yield reduction only with deficit irrigation at early and mid flowering stages, not at early seed formation stage; best WUE at early seed formation stage compared to deficit irrigation in other tested stages.
7. Spain. 2007. Lorite. Deficit irrigation strategies by water balance and irrigation performances simulation. Winter cereals, sunflower, garlic, cotton. Modelling. RESULTS: water availability and objectives (income, IWP, labour) made complex results; combination of high water productivity crops and cropping pattern shift is recommended.
8. Pakistan. 2007. Ashraf. Small dams impact. 32 small dams sample. Data collection RESULTS: water table rise from before to after dam construction (from 7-39 m to 6-15 m and from 7-39 m to 9-25 m, respectively in two different locations)
9. Philippines. 2007. Hafeez. Water use and productivity. Rice. Experimental. RESULTS: 74% irrigation water reused (with check dams or pumping); depletion fraction of available water increased (80% by alternative wetting and drying, and captured percolation water); water productivity with respect to available water increased (to 0.83 kg/m3 by combination of reduced land preparation time, and alternative wetting and drying)
10. Spain. 2007. Cuevas. “Algerie” loquat. Deficit irrigation best dates. Experimental. RESULTS: water requirements decrease of 70% produced no

DROUGHT MANAGEMENT PLAN REPORT
102
changes on fruit set, size, and yield, excepted for a reduction on fruit size with August water deficit irrigation; August water deficit irrigation produced also an advancement of bloom harvest date, which was considered of high interest.
11. China. 2006. Hu. Soil Ks spatial variability effects on drainage and irrigation. Modelling. RESULTS: the introduction of a more detailed and realistic soil Ks spatial distribution produced a better estimation of drainage volumes, an irrigation saving (28%), and a drainage reduction when best irrigation was applied (2.3 vs 58.9 mm).
12. India. 2002-2005. Patel. Drip tape depth and irrigation level on yield. Potato. Experimental. RESULTS: irrigation level at 60% of ET combined with placement of tape at 15 cm of depth maximized WUE (average of 2.1 t/ha); benefit-cost ratio was maximized with placement of tape at 10 cm of depth (1.7).
13. USA. 2006. Simmons. Water use measurement techniques under flood irrigation. Pecan. Experimental. RESULTS: inexpensive energy-balance techniques “one propoeller eddy covariance” (OPEC) and “surface renewal analysis” (SR) can be comparable to the more common “sonic eddy covariance” (SEC) for pecan; conditions for best results are also suggested, as for measurement heights (specific for each technique), and for correction factors.
14. Italy. 2001-2004. Irrigation District “Pedemontano Brenta”. Conversion from surface irrigation and open channels network to sprinkler irrigation with pressure pipe network. Treviso and Padova Provinces. 1,140 ha. Experimental. RESULTS: irrigation water saving (water requirements from 2 l/s/ha to 0,7 l/s/ha).
15. Italy. 2005-2007. Irrigation District “Pedemontano Brenta”. Conversion from surface irrigation and open channels network to sprinkler irrigation with pressure pipe network. Padova and Vicenza Provinces. 1,120 ha. Experimental. RESULTS: irrigation water saving (water requirements from 2 l/s/ha to 0,7 l/s/ha).
16. Uzbekistan. 2006. Horst. Surge-flow vs surge-flow on alternate furrow vs continuous flow irrigation method. Experimental. RESULTS: reduction of water use (44%) and max irrigation water productivity with surge-flow on alternate furrows.
17. France. 2006. Chopart. Decision-making tool. Water balance model at farm level and decision rules. Modelling. RESULTS: good simulation of ET and drainage; water saving (30%); no yield decrease.
18. Spain. 2006. Moriana. Irrigation scheduling (rain vs % of ET vs deficit). Olive orchards. Experimental. RESULTS: max water saving with deficit irrigation (43%) vs irrigation with 125% of ET; recovery from water stress (stomatal conductance, phenolic compounds) is rapid if irrigation is concentrated in the second half of summer.
19. China. 2004-2005. Wang. Effects of different soil matric potentials. Tomato. Soil water potential at 0.2 m under drip emitters. Experimental. RESULTS: yield not effected; ET decrease (70 mm); irrigation water saving (80 mm); increased water use efficiency (40%); increase of irrigation water use efficiency (100%); “irrigation suggestions” on minimum soil potential (-20 kPa during tomato establishment, -50 kPa after establishment).
20. Spain. 1999-2001. De la Hera. Partial root-zone. Wine grapes. 3-years.

DROUGHT MANAGEMENT PLAN REPORT
103
Experimental. RESULTS: higher yield; higher water use efficiency (40%); best effects if partial root-zone drying applied at beginning of season; need to investigate long-term effects on vegetative and reproductive development.
21. Pakistan. 2002-2004. Kahlown. Sprinkler irrigation on rice. Farm level. Experimental. RESULTS: increased yield (18%); water use reduction (35%); benefit-cost analysis show financial viability; need to investigate effects on groundwater recharge.
22. Brazil. 2006. Ferreira de Fonseca. Sewage water. Bermudagrass. 2-years. Experimental. RESULTS: nitrogen saving (32-81%); yield unchanged.
23. China. 2003. Ji. Water balance with flood irrigation. Modelling. RESULTS: percolation and transpiration estimates (43 and 41% respectively).
24. Nepal. 2006. Rutkowski. Wastewater. 109 farm sample. Overview. RESULTS: To obtain water quality improvement there is a need to invest in infrastructure, change management, and interact with stakeholder,.
25. Japan. 2006. Watanabe. Water management on herbicides. Intermittent vs continuous and overflow vs controlled drainage. Experimental. RESULTS: water saving and herbicide control with intermittent irrigation scheme and holding drainage period of 10 days.
26. Spain. 2006. Soil moisture thresholds and plant water status. Bell pepper, tomato, melon. Soil moisture sensors. Experimental. RESULTS: Soil Matric Potential sensors are more reliable compared to Available Soil Water Content sensors, because of issues connected to rooting depth, field capacity measurement, calibration, accuracy.
27. Sweden. 2002-2006. Wesstrom. Controlled drainage on drain outflow and N losses. Experimental. RESULTS: drain flow and N load reduction (60-95%); improvement of N efficiency, N plant uptake, and yield (2-18%).
28. Canada. 2006. Yang. Water table depth modelling. 1992-1994 data. Modelling. RESULTS: good simulation performances on soil hydrology and nitrate-N losses in surface runoff.
29. USA. 2007. Sing. Drainage water management. Modelling. 1945-2004 data. Subsurface drainage. RESULTS: controlled drainage can yield trade-off between subsurface and surface drainage.
30. USA. 2006. Qadir. Non-conventional water resources. Experimental review. RESULTS: agricultural drainage can be managed and eventually used as source of water for irrigation, once suitable strategies are used to make sure that every impact is considered on soil, crop, environment (bio-drainage, conjunctive use of saline and fresh water, sequential systems or “agro-drainage systems”)
31. Bulgaria. 1994-2000. Mladenova. Yield-evapotraspiration relationship. Experimental. RESULTS: Ky (yield response factor), assumed constant in FAO Irrigation and Drainage Paper n. 33, resulted vary in years differently wet (1.05-1.41)
32. Italy. 2007. Ghianni. Surge vs continuous flow irrigation. Experimental. RESULTS: surge irrigation results in water saving (10%), deep percolation reduction (61%), application efficiency improvement (12%), nutrient losses reduction, without reducing yield.

DROUGHT MANAGEMENT PLAN REPORT
104
33. Tunisia. 2007. Nagaz. On-farm irrigation scheduling. Fixed vs ET compensation vs. soil water balance. Drip. Potato. Experimental. RESULTS: the fixed amount of water (“producer method”) reduced yield and used more water (20-25%) compared with the soil water balance, which had higher WUE (75%).
34. USA. 2007. Evans. Controlled drainage as BMP. Investment and experimental review. RESULTS: Controlled drainage definition as BMP; 270,000 ha with control structures; 1.7 million kg/y N losses reduction.
35. USA. 2007. Skaggs. Controlled drainage and water balance. Modelling and experimental review. RESULTS: controlled drainage reduce N losses (50%) primarily by a reduction in drainage volumes; controlled drainage increases ET, surface runoff and seepage, reduces subsurface drainage, and effects N transformations (as net N mineralization and denitrification) varying with local and site conditions.
36. Italy. 2001-2007. Costa - Irrigation District “Romagna Occidentale”. Introduction of flow meters and water price based on volume. 650 ha. Introduction in 2006. Fix cost of 31.97 €/ha + variable of 0.15 €/m3. Experimental. RESULTS: reduction of abstractions by 69%.
37. Italy. 2006. Costa - Irrigation District “Romagna Occidentale”. Introduction of small dams. 8,374 ha. Orchards (mainly vignards). Rural Development Program 2001-2006. Private properties (farm or consortium of farms based), Irrigation District project and consulting. Experimental. RESULTS: in area 1 (3,523 ha) total capacity built = 63% of average seasonal water needs; in area 2 (4,851 ha) total capacity built = 20% of average seasonal water needs.
38. Italy. 2007. Paulon – Irrigation District “Pianura Veneta”. Calculation of irrigation benefit index. 14,881 ha. Mixed ditches vs irrigation ditches vs. pressure pipes irrigation. Irrigation network improvement analysis. Data analysis. RESULTS: an irrigation benefit index was found on the base of existing areas of the Irrigation District and on their efficiency, which was 1, 1.86, and 3.1, respectively for mixed ditches, irrigation ditches, and pressure pipes.
39. France. 2007. Bouthier. Scheduling method. 3-5 years. 30-50 farms. Soil hydric status, rainfall, and crop development. Corn, cereals, and peas. Model adjustments. Experimental and modelling and application. RESULTS: a method has been set and tested on farms to find begin, end, and programme adaptations of irrigation along the season; different crop need different approaches (rainfall or soil tension thresholds); measurements compromise solutions identified (which effects a delay or advance of 2 days on the date of irrigation); need of a period of adaptation and learning (1 year); main difficulties are setting the method on place.

DROUGHT MANAGEMENT PLAN REPORT
105
A.7 Ground water system management case study
An Italian case study: The pressure on the hydrogeologic complex of Colli Albani.
The hydrogeologic system of Colli Albani, situated in the regional territory of Latium, presents a critical situation for in regard to exploitation entities and the groundwater availability.The system, which extends over about 2000 km2 is mainly constituted of volcanic and quaternary piroclastic rocks lying between the Tiber River to the N-W, the Aniene River to N-E, the carbonatic hills of the Latin Appennine to E, the Pontina Plain to S-E and the Tyrrenean Sea to W.
The volcanic rocks comprise a complex structure in layers due to different phases of eruption and effusion phases. The overall shape is that of a layer-volcanic, its bed is a sedimentary base, of plio-pleistocenic age, with faults and fractures.
The volcanic and piroclastic rocks constitute an aquifer system limited below by a bed, which is only slightly or not permeable at all. The hydraulic conductivity of the system is highly heterogeneous due to the nature of the deposits produced by the volcanic activity.
The groundwater system is constituted by a base aquifer with a radial centrifugal outflow and by several suspended aquifers, not always interconnected, of limited depth. The natural water outlets correspond mainly to the streams that cut into the volcanic hills and whose basic flow is fed by the groundwater; to the coastal areas fed by groundwater courses and, locally, to the volcanic lakes and to some springs, generally with limited discharge (a few litres per second).
On the base of a recent assessment, the overall system recharge has been estimated to be about 485 × 106 m3/year; withdrawal for drinking, irrigation and industrial purposes for 345x 106 m3/year and natural flows of groundwater, mainly towards streams, for 123×106 m3/year.
From such values it results that the hydraulic withdrawal from the groundwater makes up about 70% of the recharge of the system. In some parts of the system an unbalance exists due to a non-homogeneous distribution of the recharge and the withdrawals on the territory. To highlight the critical situation of the present state of the groundwater resources, the recent drought events have worsened the scenario that also presents both the depletion of several meters of the Albano Lake and the reduction of the discharge of the streams (overall about 5.6 m3/s in 1978-1979, respect to about 3.0 m3/s in 1997-1999 and about 3.8 m3/s in 2002), the presence of coastal areas with piezometric levels below the sea level, and lowering of the water table in different sectors of the aquifer, clearly identified comparing the piezometric levels of the 1970s and the current ones.
The new approaches necessary in water resources management are connected to the high agricultural occupation of the territory: it is enough to cite the extension and importance, also from the socio-economical point of view, of water dependent crops

DROUGHT MANAGEMENT PLAN REPORT
106
and of the vineyards.
Finally, the groundwater system of the Colli Albani is also linked to drinking needs with the utilization of the well field of Carano that feeds the distribution network along the Anzio coastal area and the inland region, with significant peaks of use during the summer period, corresponding to the tourist season for the area

DROUGHT MANAGEMENT PLAN REPORT
107
A.8. List of members of the Water Scarcity and Droughts Expert Network
Portugal Antonio ALVES National Water Institute [email protected]
Italy Elisabetta PREZIOSI IRSA [email protected]
France Daniel BERTHAULT French Ministry of Ecology [email protected]
Gabriele BONAITI
EIC-EuroMed. Irrigators Community [email protected]
Germany Udo BOSENIUS
German Ministry of Environment [email protected]
Portugal Alexandra BRITO Ministry of Environment [email protected]
Portugal Alexandra CARVALHO Ministry of Environment [email protected]
Spain Miguel CASTROVIEJO REPER [email protected] EC Stephanie CROGUENEC DG ENV [email protected]
France Thierry DAVY French water agencies [email protected]
EC Sylvie DETOC DG ENV [email protected]
Belgium Didier D'HONT Flemish Water Authority [email protected]
Netherlands Luit-Jan DIJKHUIS
Ministry of Transport, Public Works and Water Management [email protected]
Spain Teodoro ESTRELA Ministry of Environment [email protected]
Dominique GATEL EUREAU [email protected]
Slovenia Gabrijela GRCAR Ministry of Environment [email protected]
Netherlands Loek KNIJFF RIZA [email protected]
Hungary Peter KOZAK Ministry of Environment [email protected]
Giovanni LAGUARDIA JRC [email protected]
Portugal Aderito MENDES National Water Institute [email protected]
Belgium Stef MICHIELSEN
Flanders Hydraulic Research [email protected]
Italy Giuseppina MONACELLI Ministry of Environment [email protected]
EC Marta MOREN-ABAT DG RTD [email protected] Sergiy MOROZ WWF [email protected] Stefan NIEMEYER DG JRC [email protected]

DROUGHT MANAGEMENT PLAN REPORT
108
Cyprus Charis OMORPHOS
Ministry of Agriculture, Natural Resources and Environment [email protected]
Italy Roberto PASSINO IRSA [email protected]
Italy Giorgio PINESCHI Ministry of Environment [email protected]
Slovak Republic Jana POOROVA
Ministry of Environment [email protected]
Finland Osmo PURHONEN Ministry of Environment [email protected]
France Jean-Paul RIVAUD French Ministry of Ecology [email protected]
Portugal Afonso ROCHA National Water Institute [email protected]
Portugal Rui RODRIGUES National Water Institute [email protected]
Spain Alberto RODRIGUEZ FONTAL
Ministry of Environment [email protected]
Finland Jaakko SIERLA Ministry of Environment [email protected]
Hungary Sandor SZALAI Ministry of Environment [email protected]
Luc TABARY EURELECTRIC [email protected] Niels THYSSEN EEA [email protected]
Belgium Katrien VANEERDENBRUGH Flemish Water Authority [email protected]
Spain Elisa VARGAS Ministry of Environment [email protected]
UK Mike WALKER DEFRA [email protected] Beate WERNER EEA [email protected]

DROUGHT MANAGEMENT PLAN REPORT
109