Page 1
1
DRUG PERMEABILITY ACROSS A PHOSPHOLIPID
VESICLE BASED BARRIER
2. CHARACTERIZATION OF BARRIER STRUCTURE,
STORAGE STABILITY AND STABILITY TOWARDS pH
CHANGES
Gøril Eide Flaten1, Heike Bunjes2, Kristina Luthman3, Martin Brandl1*
1University of Tromsø, Institute of Pharmacy, Department of Pharmaceutics &
Biopharmaceutics, N-9037 Tromsø, Norway
2Friedrich Schiller University Jena, Institute of Pharmacy, Department of Pharmaceutical
Technology, D-07743 Jena, Germany
3Göteborg University, Department of Chemistry, Medicinal Chemistry,
SE-412 96 Göteborg, Sweden
*To whom correspondence should be addressed. Department of Pharmaceutics &
Biopharmaceutics, Institute of Pharmacy, University of Tromsø, N-9037 Tromsø, Norway.
Phone: +47 77646159. Fax: +47 77646151. E-mail: [email protected]
Page 2
2
Abstract
Recently we reported on the development of a phospholipid-vesicle based barrier as a medium
throughput screening method for drug permeability. The aim of the present study was to
characterize the barrier structure, including an estimation of the amount of phospholipid
within the barrier, its storage stability and stability over a pH range representing the
environment in the different part of the gastrointestinal tract. The amount of lipid in the
barrier was quantified using a colorimetric phospholipase D-based assay. The total amount
was found to be in average 3.30 mg phospholipid in each barrier. The preparation process
comprises consecutive deposition of two types of liposomes on a filter support, the smallest
liposomes, with a mean diameter of 298 nm, were estimated to fill the pore volume of the
filter when tightly packed. The volume of the bigger liposomes, deposited on top of the filter,
was calculated to generate a 0.1 mm thick layer. Visualisation of fluorescently labelled
liposomes by confocal laser scanning microscopy confirmed that the pores of the filter were
completely filled with liposomes and that there is a liposome layer on top. Small angle x-ray
scattering (SAXS) analysis was used to study the lamellarity of the liposomes. The liposomes
contained oligo- and/or multilamellar structures before and after deposition.
The functionality of the barriers during storage at three different temperatures was examined
by measuring the permeability of the hydrophilic marker calcein across barriers stored for up
to 4 weeks. The conclusion was that the phospholipid vesicle based barriers could be stored at
–80 C for up to 2 weeks without significant changes. The stability of the barriers in a pH
range from 2.0 to 8.0 was investigated by performing permeation studies with fluoresceine at
different pH values. It was found that the phospholipid vesicle based barrier did not loose its
integrity within this range. Thus, the barriers appear suitable for further studies to provide
insight into segmental absorption in the human gastrointestinal tract. It has also been shown
that the barriers can be stored which gives the opportunity to make up larger batches and by
Page 3
3
that renders the phospholipid vesicle based barrier more appropriate for larger scale
production and high throughput screening.
Keywords: Artificial membrane, liposomes, storage stability, phospholipids, confocal laser
scanning microscope, small angle x-ray scattering, pH, phospholipid quantification.
1 Introduction
A novel predictive medium-throughput screening method for passive drug permeability, based
on a tight barrier of liposomes on a filter support was recently reported by us (Flaten, et
al.,2006). To the best of our knowledge this was the first successful attempt to deposit
membrane barriers without the use of an inert solvent such as hexadecane. The phospholipid
vesicle based barriers were prepared from egg phosphatidylcholin liposomes, which were
deposited into/onto a filter support by centrifugation. Solvent evaporation and freeze-thaw
cycling were then used to promote liposome fusion to obtain a tight barrier. The model was
validated using 21 drug compounds, which covered a wide range of physicochemical
properties and degree of intestinal absorption (Fa) in humans. The apparent permeability
coefficients obtained from the phospholipid vesicle based model correlated well with
literature data on human absorption in vivo, which suggests that its performance is adequate
and that the method is suitable for rapid screening of passive transport of new chemical
entities (Flaten, et al.,2006). This new approach seems to model the in vivo absorption better
than simple physicochemical parameters such as PSA and experimentally determined log D,
or experimentally more laborious methods such as immobilised liposome chromatography
(ILC) (Osterberg, et al.,2001) and the bio-mimetic PAMPA model (Sugano, et al.,2001). The
model also appears to function equally well as the Caco-2 model (Yazdanian, et al.,1998) and
Page 4
4
the double sink PAMPA (DS-PAMPA) “model” (Avdeef,2003) in the prediction of passive
diffusion of drug compounds (Flaten, et al.,2006).
Aqueous phospholipid dispersions of equally high concentration as that of the deposited layer
in the current study, have previously been described as “vesicular phospholipid gels” (Brandl,
et al.,1997). Such gels have been shown to consist of uni- to oligolamellar bilayer-vesicles in
tight packing and to act as a diffusion barrier for incorporated drug compounds (Tardi, et
al.,1998). In contrast, in the PAMPA- model, the phospholipid is applied as a solution in
organic solvent (Kansy, et al.,1998), which eventually forms monolayers, bilayers or multiple
layers at the interface with the water phase. We have hypothesised that the structure of the
phospholipid vesicle based barrier consists of liposomal or closed vesicular structures present
in the pores and on top of the filter. Since this is a novel method no structural information
regarding the barrier has so far been published, so the aim of the present study has been to
study the structure of the barrier, including an estimation of the amount and distribution of the
phospholipids within the barrier, and to examine the stability of the barrier at different storage
conditions and within a pH range from 2.0 to 8.0. Thus, confocal laser scanning microscopy
and small angle x-ray scattering (SAXS) were applied for studies of the barrier structure to
confirm or modify our hypothesis that the structure of the phospholipid vesicle based barrier
consists of liposomal or closed vesicular structures present in the pores and on top of the
filter.
So far the phospholipid vesicle based barriers have been made one day before the permeation
experiment. To carry this model forward and allow its use in a high- throughput format it was
required to study the stability of the barriers during storage. The stability at different storage
temperatures has therefore been examined.
Page 5
5
The permeation studies performed using the phospholipid vesicle based barrier have been
conducted at pH 7.4 in both the donor compartment, the liposome-barrier and the acceptor
compartment (Flaten, et al.,2006). However, this pH-value does not fully represent the
conditions that drugs encounter during the absorption process in vivo in humans. Further
studies using different pH conditions in different compartments of the model system are
expected to provide insight into segmental absorption in the human gastrointestinal tract. The
liposome barrier stability in a broad pH range (pH 2 to 8), representing the environment in the
different part of the gastrointestinal tract, has therefore also been examined.
2 Experimental section
2.1 Materials
Egg phosphatidylcholine, Lipoid E-80 was obtained from Lipoid, Germany. Metoprolol
tartrate, sulpiride, calcein and cholate were purchased from Sigma-Aldrich Co, St. Louis,
USA. Fluorescein sodium was supplied by Merck KGaA, Darmstadt, Germany. Lissamine™
rhodamine B 1,2-dihexadecanoyl-sn-glycero-3-phosphoethanolamine triethylammonium salt
(Rh-DHPE) was obtained from Molecular Probe, Eugene, USA. Silver behenate was supplied
by NIST, Gaitersburg, USA.
Culture inserts (Transwell-Clear, d = 6.5 mm) and plates were purchased from Corning Inc,
Corning, USA, the filter removed and replaced by mixed cellulose ester filters (0.65 µm pore
size) from Millipore, Billerica, USA. The phospholipid kit “Phospholipids B-enzymatic
colorimetric method” was purchased from Wako Chemicals, Neuss, Germany.
Page 6
6
2.2 Methods
2.2.1 Preparation of the barrier
The phospholipid vesicle based barriers were prepared according to the procedure described
earlier (Flaten, et al.,2006) unless stated otherwise. In brief, liposomes with two different
sizes were deposited on a filter support in consecutive steps, first the smaller liposomes and
then the larger, by use of centrifugation. Freeze-thaw cycling was then used to promote
liposomes fusion to produce a tight barrier.
2.2.2 Structure of the barrier
2.2.2.1 Confocal laser scanning microscopy
The liposome barriers were prepared as described earlier (Flaten, et al.,2006), with the
exception that 0.2 mol% of the egg phospholipids was displaced by the fluorophore
Lissamine™ rhodamine B 1,2-dihexadecanoyl-sn-glycero-3-phosphoethanolamine (Rh-
DHPE) (Kirjavainen, et al.,1996). The barriers were hydrated in calcein solution (0.165
mg/ml) (Nagahara, et al.,2004) in phosphate buffer (pH 7.4). The incubations were performed
by adding calcein solution to the donor and the acceptor chambers, and allow the system to
equilibrate for 3 hours. A mixed cellulose ester filter was also incubated in calcein solution
(0.165 mg/ml) to enable the use of the filter without the liposomes as a reference. The barriers
and filters were gently removed from the inserts by use of a scalpel and placed on a
microscope slide (Menzel-Glaser, Menzel GmbH + Co KG, Braunschweig, Germany). The
fluorophores were stabilized by addition of Fluoromount-G (SouthernBiotech, Birmingham,
England) and the barrier was covered with a cover slip (Menzel-Glaser, Menzel GmbH + Co
KG, Braunschweig, Germany).
Page 7
7
The sample was examined under a confocal laser-scanning microscope (Leica DM IRE2 from
Leica Microsystems Wetzlar GmbH, Wetzlar, Germany). Rh-DHPE and calcein were excited
by use of lasers with wavelength 543 nm and 488 nm, respectively. The emission spectra had
their maxima at the spectral maxima for calcein and Rh-DHPE, 509 nm and 580 nm,
respectively.
2.2.2.2 Amount of phospholipids in the barrier
Barriers were investigated both after the deposition of only the smaller liposomes to enable
quantification of the amount of phospholipids in the pores of the filters, and after completed
preparation in order to quantify the total amount of lipid deposited. The inserts with the
barriers were incubated in a cholate solution (2 mg/ml) (5 ml) under bath sonication for 45
min to solubilize the phospholipids in the barrier. The mass balance of the phospholipid
dispersion was estimated by quantification of the amount of phospholipids not caught in or on
the filter support as well, and comparing it to the overall amount applied during preparation
(18 mg per filter insert). The liposome dispersion passing through the filter during
centrifugation (Flaten, et al.,2006) was also collected and analysed upon solubilization with
cholate. Quantification of phosphatidylcholine was carried out as described in (Grohganz, et
al.,2003) with the following adaptations: 50 l of the samples and 250 l of the phospholipid
B-enzymatic colorimetric reagent were mixed in a 96-well titer plate and incubated for 45 min
in the titer plate reader at 37 C, with shaking for the first 5 minutes. The UV-absorption at
492 nm was measured and evaluated against standard solutions of E80 and cholate. The
experiments were done in triplicate with four inserts in each parallel. The mean values and
standard deviations are reported.
Page 8
8
2.2.2.3 Liposome size analysis
The size of the liposomes was measured by photon correlation spectroscopy (PCS) using a
Submicron Particle Sizer 370, (PSS Nicomp Particle Sizing Systems, Santa Barbara,
California, USA). Sample preparation and measuring conditions were as described earlier
(Ingebrigtsen and Brandl,2002). Three cycles with 10 min measuring time each were
performed.
The total number of particles with a diameter larger than 0.5 µm, in the liposome dispersion
extruded through filters with pore size 800 nm, was also estimated by optical particle
counting using a AccuSizerTM 780 Optical Particle Sizer (PSS Nicomp Particle Sizing
Systems, Santa Barbara, California, USA). The liposome dispersion was diluted extensively
(1:1.66 ×10⁻⁶) with particle free water until a concentration for wich the particle counter could
detect single particles in the flow line. The number of particles in the lipid dispersion was then
calculated back from the total dilution and the measured particle number. Three parallels were
performed and the results represented the combined results from three 5 ml aliquots.
2.2.2.4 Small angle x-ray scattering (SAXS)
The samples were investigated with a Kratky camera (MBG-SAX, Hecus M. Braun, Optical
Systems GmbH, Graz, Austria) with a Iso-Debyeflex 3003 60 KV generator (Rich. Seifert,
Ahrensburg, Germany), an x-ray tube (copper anode) FK 61-04 x 12 and a position sensitive
detector (PSD-50M, M. Braun, Garching, Germany). For a simultaneous small and wide
angle scattering measurement the wide angle extension of the device (MBG-SWAX)
containing an additional detector for the wide angle range was used. In most cases, the
samples were measured for one hour at 25 ºC (30 min for the SAXS investigation of the E80
raw material). Hand-shaken liposome dispersion and liposome dispersions extruded through
filters with pore sizes 800 nm and 400 nm were examined. Also a mixed cellulose ester filter
Page 9
9
wetted in phosphate buffer and phospholipid vesicle barriers both before and after incubation
in phosphate buffer for 3 hours were studied using a sample holder for semisolids. The three
liposome dispersions and the buffer were also examined in a capillary sample holder to allow
a more exact comparison of the reflection intensities. The small angle reflections of silver
behenate (d001 = 5.838 nm (Gilles, et al.,1998,Hung, et al.,1993)) were used to calibrate the s-
axis. After addition of phosphate buffer changes of the barrier structure during extended
incubation in buffer at 25 ºC were followed first by measurements at 5 min intervals for 30
minutes, followed by continuous analysis over 5 hours at 15 minutes intervals (5 hours is the
normal time period for a permeation experiment). The measured scattering curves were
smoothed and desmeared to obtain the data presented in Figure 5-7.
2.2.3 Storage stability measured by permeation of calcein and electrical resistance
One exception was made in the preparation procedure of the barriers stored at -80 ºC. Here
the last step in the barrier preparation procedure, heating at 65 ºC for 30 minutes, was not
done until the same day as the permeation studies were performed. The barriers were stored at
three different temperatures; 20 C, 2-8 ºC or -80 ºC. The storage times were 1 and 2 weeks,
barriers were also stored at -80 ºC for 3 and 4 weeks.
Permeation studies were performed using 95.5 mM calcein solutions in phosphate buffer (pH
7.4) according to the procedure described earlier (Flaten, et al.,2006). At the end of the
permeation experiment, samples (200 L) from each acceptor compartment were transferred
into 96-well black plates (Costar) and analyzed at 28.5 oC in a Polarstar (Fluostar, BMG
Technologies) fluorimeter with excitation and emission wavelengths at 485 and 520 nm,
respectively. The resistance of the lipid barriers was measured (Millicell-ERS, Millipore,
USA) immediately after completion of permeation studies. A value of 119 ohms resulting
Page 10
10
from the filters was subtracted from the observed resistance to account for the resistance
resulting from the lipid barrier alone. The obtained value was multiplied by the surface area
(0.33 cm2) to normalize for the dimensions of the insert. The experiments were performed at
least in triplicate with six inserts in each parallel for each storage condition and storage
length. The mean values and standard deviations are reported.
2.2.4 Barrier stability towards changes in pH in a range from 2.0 to 8.0
Permeation studies were performed with fluoresceine solutions in phosphate buffer (pH 2 and
8) according to the procedure described (Flaten, et al.,2006). In the acceptor well a phosphate
buffer (pH 7.4) was used. The analysis of the samples and the measurement of the electrical
resistance were done as described in section 2.2.3. The experiments were performed at least in
triplicate with six inserts in each parallel for each pH. The mean values and standard
deviations are reported.
3 Results and discussions
In this study the structure of the phospholipid vesicle based barrier should be investigated in
more detail. In order to do so firstly, the distribution of differently fluorescently labelled lipid
and water phases over the depth of the filter support was visualised using confocal laser
scanning microscopy. Furthermore the size of the smallest liposomes used was measured by
PCS and the amount of phospholipid which had been deposited during the first two
centrifugation steps determined. This allowed estimation of the volume occupied by the
liposomes in tight packing compared to the pore volume of the filter. Secondly, the amount
and size of the bigger liposomes deposited during the subsequent centrifugation step was
measured and the volume occupied by the liposomes in tight packing estimated in terms of
Page 11
11
thickness of the liposome layer on top of the filter. Thirdly, the contribution of each of the
two liposome layers in the barrier with regard to solute permeability and electrical resistance
were determined. In addition, the structure of the different types of liposomes prior and after
deposition on the membrane was investigated by small angle x-ray scattering.
Finally, the stability of the barriers at different storage temperature (+20 ºC - -80 ºC) and
within a wide pH range (pH 2-8) have been examined.
3.1 Structure of the barrier
Our hypothesis regarding the structure of the phospholipid vesicle based barrier implicates
that liposomal or closed vesicular structures are present in the pores as well as in a layer on
top of the filter (see Figure 1). This assumption is supported by literature data, e.g. extrusion
of hydrated phospholipids has earlier been shown to yield liposomes of a size corresponding
to the pore size of the filters used (Berger, et al.,2001). However, the use of repeated extrusion
cycles through the same filter pore size has been shown to reduce the liposome size (Hope, et
al.,1993). The presence of ethanol in the hydrated phospholipids, in the concentrations used in
this study, has also been shown not to disturb liposome formation (Polozova, et al.,2005).
The barriers were made by first adding smaller liposomes which are expected to go into the
pores, and then larger liposomes that are supposed to produce a layer on top of the filter.
Figure 1
3.1.1 Confocal laser scanning microscopy
To study the phospholipid vesicle based barrier in a confocal laser scanning microscope the
liposome barrier was visualized using rhodamine, a red fluorescent marker, and the buffer
using calceine, a green fluorescent marker. Rhodamine ethanolamine has been widely used in
Page 12
12
studies of membrane fusion, ion permeation and lipid transfer between vesicles. It is not
dependent of pH changes or molecular aggregation in the concentration used in this study
(Massari, et al.,1988).
The results from the confocal laser scanning microscopy are shown in Figure 2 where cross-
section pictures of a phospholipid vesicle based barrier (A and B) and a plain mixed cellulose
ester filter (C) are shown.
Figure 2.
Figure 2 shows that the barrier consists of lipid filled pore structures as well as a liposome
layer on top of the filter. In Figure 2C it can be seen that the pore structures of the mixed
cellulose ester filter are filled with calcein solution. In Figure 2A and 2B the pores appear to
be filled with liposomes through the whole filter thickness. No transient aqueous channels
could be observed in the pictures. In some spots on the filter surface the liposome layer
appeared to be thinner or almost absent, but since the pictures also show that the pores are
filled with liposomes there are still no aqueous channels going through the whole barrier. The
tightness of the barriers, also after incubation with buffer for 5 hours, is comparable with that
observed by Brandl et al (Brandl, et al.,1997), where vesicular phospholipid gels are reported
to make up a tight barrier towards water soluble markers and Tardi et al (Tardi, et al.,1998)
where no floating away of liposomes from the vesicular phospholipid gel was observed, at
least for phospholipid gel containing multi-lamellar structures and planar bilayer staples, for
weeks.
Page 13
13
3.1.2 Amount of phospholipids in the barrier
To further confirm the barrier structure seen in the microscopy studies, the amount of
phospholipid in the barrier was quantified. First the total amount of phospholipid in each
barrier, as well as the distribution between the amount of phospholipids originating from the
smallest liposomes in the pores and the larger liposomes expected to be layered on top of the
filter, was determined. This was done by dissolving the barrier phospholipids in a cholate
solution by sonication and then quantifying the amount of egg phosphatidylcholine both in
half-finished (after the addition of only the smallest liposomes) and finished barriers (after
also the addition of the larger liposomes) using a colorimetric phospholipase D based serum-
phospholipid assay (Grohganz, et al.,2003). The size distribution of the different liposome
dispersions was also determined to allow an estimation of the volume that the liposomes
theoretically would fill.
The quantification of the amount of egg phosphatidylcholine in the half-finished barriers gave
a mean value of 0.50.2 mg phospholipids per barrier. The analysis of the size distribution of
the liposomes by PCS showed that the liposomes extruded through filters with a pore size of
400 nm had a volume-based mean diameter of 2987 nm. In Figure 3 an example of the
volume based size distribution in the liposome dispersion is given.
Figure 3.
When assuming that each egg phospholipid molecule covers a surface area of 71.7 Å2
(Lasic,1993) and that the liposomes are unilamellar it is possible to make a theoretical
calculation of the overall volume of the liposomes. This again allows an estimation of how
much of the pore volume of the filter that is filled with liposomes. When comparing the
overall volume of the 298 nm-liposomes with the overall pore volume, it was found that there
Page 14
14
are more liposomes present than the amount corresponding to the densest sphere packing
(74% of the total volume, (Kleber,1985). The liposomes are not rigid globes, they will to
some extend squeeze together. In addition, it is not certain that all the small liposomes go into
the pores; some could be stacked on the surface of the filter when the pores have been filled.
Another point that has to be taken into account is that the liposomes are assumed to be
unilamellar when doing these calculations. Oligo- or multilamellar structures will decrease the
volume that a specific amount of phospholipids would fill. So what could be said from these
calculations is that the pores of the filter are more or less completely filled with liposomes.
This is also in agreement with the result obtained from the confocal laser scanning
microscopy.
After the addition of the larger liposomes a quantification of the total amount of egg
phosphatidylcholine in the finished barrier was performed using the same method. A mean
value of 3.3 0.2 mg phospholipid was found in each barrier. Subtracting the amount of
phospholipid originating from the smaller liposomes, already known to be 0.5 0.2 mg, gives
2.8 mg phospholipids originating from the larger liposomes extruded through filters with pore
size 800 nm. The overall recovery of liposomes was close to 100%. For these larger
liposomes the PCS method appeared not to deliver reproducible results, so the size
distribution was instead estimated by optical particle counting. The number weighted mean
diameter was estimated to be 6076 nm. In Figure 4 the size distribution of the liposome
dispersion is shown. By calculating the volume of these liposomes in the same way as for the
smaller liposomes and dividing this volume by the area of the filter, the thickness of the
liposome layer was found to be 0.1 mm.
Figure 4.
Page 15
15
The amount of lipid on the filter mainly originates from the addition of liposomes extruded
through filters with a pore size of 800 nm. As much as 86% of the lipids in the barrier
originate from this step in the preparation procedure, whereas 14% originate from the two
additions of liposomes with a mean diameter of 298 nm. To investigate how much the lipids
in the pores contribute to the barrier properties, barriers were made using only liposomes
extruded through filters with a pore size of 800 nm. The permeability (Papp) of calcein across
this barrier was found to be 0.3780.064 x 10-6 cm/sec and the electrical resistance measured
was 660118 . For the barriers made by addition of both liposomes extruded through filters
with pore size 400 nm and liposomes extruded through filters with pore size 800 nm these
values was 0.0610.005 x 10-6 cm/sec and 1591 , respectively. This shows that the
phospholipids in the pores contribute significantly to the permeability properties of the
barrier.
3.1.3 Small angle x-ray scattering (SAXS)
To study the liquid crystalline structure in the different liposome dispersions and the barrier,
as well as to look into the hydration process of the barrier, SAXS experiments were
performed.
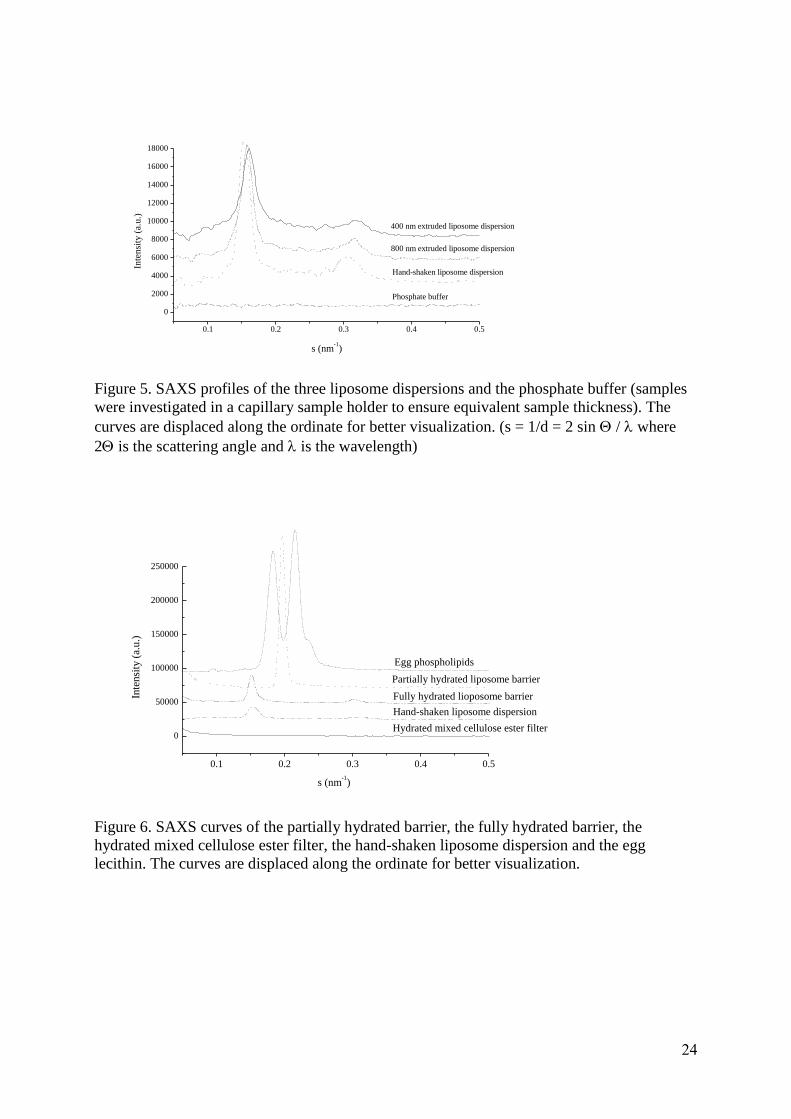
The scattering profiles of both the hand-shaken dispersion and the liposome dispersions
extruded through 400 nm and 800 nm filters, respectively, all display two diffraction signals
with a spacing ratio of 1:2 characteristic of lamellar arrangements (Figure 5). The d-spacing
of the lamellae was found to be about 6.3 nm for the extruded liposomes and about 6.5 nm for
the hand-shaken liposomes which is in good agreement with the value previously reported for
fully hydrated egg lecithin (6.4 nm (Small,1967)). A comparison of the signal intensities
reveals that the amount of lamellar structures decreases with increasing dispersion of the
Page 16
16
samples. There is, however, still a considerable degree of lamellarity even in the dispersion
extruded through the 400 nm filter (structures composed solely of single bilayers would
display only diffuse scattering without any sharp signals (e.g. (Westesen and Wehler,1992)).
Figure 5.
Also the SAXS curves of the fully hydrated membrane display sharp diffraction signals
indicative of multilamellar arrangements with a d-spacing value (~6.6 nm) close to that of the
hand-shaken liposomes (Figure 6). The signals arising from the fully hydrated lipid
membrane are, however, distinctly sharper than those from the liposomal dispersion which
might indicate a higher degree of order and/or a larger size of the lamellar domains in the
membrane. This thus seems to resemble the morphology detected in vesicular phospholipid
gels by freeze fracture electron microscopy (Brandl, et al.,1997). The position of the reflection
arising from the partially hydrated lipid barrier corresponds to a much smaller interlamellar
distance (~5.1 nm; reflections of 2nd and 4th order were also observed but only be viewed at
much higher magnifications) resulting from dehydration. Similar d-spacing values have been
reported for egg lecithin containing 15% water (Small,1967). Comparisons with these values
have, however, to be done cautiously due to the use of different sources of the egg lecithins in
the investigations. The loss of solvent during membrane preparation is, however, not high
enough to convert the lecithin back to its original state which is characterized by a more
complex scattering pattern. The egg lecithin raw material is at least partially crystalline as
indicated by the occurrence of reflections in the wide angle range.
Figure 6.
The hydration process of the barrier was examined by time resolved SAXS measurements.
The strong reflection of the partially hydrated lipid barrier corresponding to ~5.1 nm shifted
Page 17
17
to much smaller angles within the first minutes after addition of buffer (Figure 7). The
hydration process continued for about one hour with decreasing velocity. After this time the
signal remained more or less constant.
Figure 7
In summary, our hypothesis regarding the barrier structure has to a large extent been
supported by the studies presented above. The cross-section pictures from the confocal laser
scanning microscope showed that the pores are filled with liposomes and that there is a
liposome layer on top of the filter. The quantification of the amount of phospholipids in the
pores and on the surface of the filter also supports this hypothesis. The results from the x-ray
scattering analysis show that there are oligo- and/or multilamellar structures.
3.1.4 Storage stability measured by permeation of calcein and electrical resistance
The stability of the barriers during storage at three different temperatures was verified by
performing permeation experiments using calcein after different storage times. The mean
values and standard deviations of the permeability (Papp) of calcein obtained from the barriers
stored under the different temperatures are given in Figure 8. Only small changes in the
electrical resistance (±100 Ω×cm2) were observed.
Figure 8.
As can be seen from the results in Figure 8, storage at –80 C is the most promising condition.
The barriers can be stored up to two weeks under these conditions without any significant
changes with respect to permeability of calcein and electrical resistance. After storage for
more than two weeks an increase in the permeability of calcein can be observed, but neither
the standard deviation for the permeability nor the electrical resistance was changed. The
Page 18
18
barriers stored at 20 C showed a larger change with time in both calcein permeability and
electrical resistance. The mean value for the calcein permeability for barriers stored at 2-8 C
was not changed with prolonged storage time, but the standard deviation was increasing
dramatically which means that the barriers are not stable for longer time under these
conditions.
3.2 Barrier stability towards changes in pH in a range from 2.0 to 8.0
The stability of the phospholipid vesicle based barriers in a pH range from 2.0 to 8.0 was
studied by performing permeability experiments with fluorescein at different pH values in the
donor compartment. The mean and standard deviations of the permeability (Papp) of
fluorescein at the different pH values are given in Figure 9. The electrical resistance measured
after completion of the experiment showed no significant changes.
Figure 9.
The fluorescent marker used in these experiments, fluoresceine sodium, was chosen as its
charge is not changed within the pH range used (pKa 8.6)*. The phospholipid vesicle based
barriers seem to be stable according to the permeability of fluoresceine over the pH range
examined (Figure 9). Neither the electrical resistance values were significantly changed
within this pH range. Thus, the barriers do not seem to loose their integrity in the pH range
from 2.0 to 8.0.
* The value is calculated using Advanced Chemistry Development (ACD/Labs)
Page 19
19
4 Conclusions
In this study we have investigated the structure of the phospholipid vesicle based barriers as
well as their stability at different storage temperatures and within a wide pH range.
The studies of the structure of the barrier support our hypothesis that the pores of the filter are
filled with liposomes and that there is a layer of liposomes on top of the filter. There are
oligo- and mulitlamellar structures and most probably also unilamellar structures in the
barriers. The phospholipid vesicle based barriers are stable at –80 C for up to two weeks and
can stand the pH range from 2.0 to 8.0 without loosing their integrity.
As the barriers have a structure that is stable under a wide pH range they are suitable for
permeation studies using different pH conditions in different compartments of the model
system. Such a setup is expected to provide insight into segmental absorption in the human
gastrointestinal tract. The satisfying stability at the preferred storage temperature also gives
the opportunity to produce larger batches of the barriers and by that make the laboratory work
more efficient and the phospholipid vesicle based barrier more appropriate for medium to
high throughput screening.
Acknowledgements
The authors thank the Norwegian Research Council (Strategic University Program “Drug
Transport and Drug Delivery” as well as a PhD-grant for Gøril Eide Flaten), The Swedish
Research Council (grant #621-2004-4517) and The Knut and Alice Wallenberg Foundation
(grant #98.176) for financial support. We also thank Dr. Anand Babu Dhanikula for important
contributions in the early parts of the project, Professor Per Artursson, Uppsala University, for
access to the confocal laser scanning microscope as well as for fruitful discussions about the
results, and B.Sc. Mohamed Issa for practical help with the microscope. In addition we would
Page 20
20
like to thank Merete Skar for her kind help with the size determination of the liposomes and
Dr. Roy A. Lysaa for making Figure 1.
References
Avdeef, A. 2003. Absorption and Drug Development; Solubilty, Permeability and Charge
State. New Jersey: Wiley-Interscience. p 116-246.
Berger, N., Sachse, A., Bender, J., Schubert, R., Brandl, M. 2001. Filter extrusion of
liposomes using different devices: comparison of liposome size, encapsulation
efficiency, and process characteristics. Int J Pharm 223, 55-68.
Brandl, M., Drechsler, M., Bachmann, D., Bauer, K.H. 1997. Morphology of semisolid
aqueous phosphatidylcholine dispersions, a freeze fracture electron microscopy study.
Chem Phys Lipids 87, 65-72.
Flaten, G.E., Dhanikula, A.B., Luthman, K., Brandl, M. 2006. Drug permeability across a
phospholipid vesicle based barrier: A novel approach for studying passive diffusion.
Eur J Pharm Sci 27, 80-90.
Gilles, R., Keiderling, U., Wiedenmann, A. 1998. Silver behenate powder as a possible low-
angle calibration standard for small-angle neutron scattering. J Appl Crystollography
31, 957-959.
Grohganz, H., Ziroli, V., Massing, U., Brandl, M. 2003. Quantification of various
phosphatidylcholines in liposomes by enzymatic assay. AAPS PharmSciTech 4, E63.
Hope, M.J., Nayar, R., Mayer, L.D., Cullins, P.R. 1993. Reduction of Liposome Size and
Preparation of Unilamellar Vesicles by Extrusion techniques. In Gregoriadis G, editor
Liposome Technology, Liposome Preparation and Related Techniques, ed., Boco
Raton: CSC Press. p 124-139.
Hung, T.C., Toraya, H., Blanton, T.N., Wu, Y. 1993. X-ray-powder diffraction analysis of
silver behenate, a possible low-angle diffraction standard. J Appl Crystollography 26,
180-184.
Ingebrigtsen, L., Brandl, M. 2002. Determination of the size distribution of liposomes by SEC
fractionation, and PCS analysis and enzymatic assay of lipid content. AAPS
PharmSciTech 3, E7.
Kansy, M., Senner, F., Gubernator, K. 1998. Physicochemical high throughput screening:
Parallel artificial membrane permeation assay in the description of passive absorption
processes. J Med Chem 41, 1007-1010.
Kirjavainen, M., Urtti, A., Jaaskelainen, I., Suhonen, T.M., Paronen, P., ValjakkaKoskela, R.,
Kiesvaara, J., Monkkonen, J. 1996. Interaction of liposomes with human skin in vitro -
The influence of lipid composition and structure. Bba-Lipid Lipid Met 1304, 179-
189.
Kleber, W. 1985. Einführung in die Kristallographie. Berlin: VEB Verlag Technik. p 94-101.
Lasic, D.D. 1993. Liposomes: from Physics to Applications. Amsterdam: Elsevier Science
B.V. p 554.
Massari, S., Colonna, R., Folena, E. 1988. Interaction of the Fluorescent-Probe N-(Lissamine
Rhodamine-B Sulfonyl)Dipalmitoylphosphatidylethanolamine with
Phosphatidylcholine Bilayers. Biochim Biophys Acta 940, 149-157.
Nagahara, N., Tavelin, S., Artursson, P. 2004. Contribution of the paracellular route to the
pH-dependent epithelial permeability to cationic drugs. J Pharm Sci 93, 2972-2984.
Page 21
21
Osterberg, T., Svensson, M., Lundahl, P. 2001. Chromatographic retention of drug molecules
on immobilised liposomes prepared from egg phospholipids and from chemically pure
phospholipids. Eur J Pharm Sci 12, 427-439.
Polozova, A., Li, X., Shangguan, T., Meers, P., Schuette, D.R., Ando, N., Gruner, S.M.,
Perkins, W.R. 2005. Formation of homogeneous unilamellar liposomes from an
interdigitated matrix. Biochim Biophys Acta 1668, 117-125.
Small, D.M. 1967. Phase equilibria and structure of dry and hydrated egg lecithin. J Lipid Res
8, 551-&.
Sugano, K., Hamada, H., Machida, M., Ushio, H., Saitoh, K., Terada, K. 2001. Optimized
conditions of bio-mimetic artificial membrane permeation assay. Int J Pharm 228,
181-188.
Tardi, C., Brandl, M., Schubert, R. 1998. Erosion and controlled release properties of
semisolid vesicular phospholipid dispersions. J Control Release 55, 261-270.
Westesen, K., Wehler, T. 1992. Physicochemical characterization of a model intravenous oil-
in-water emulsion. J Pharm Sci 81, 777-786.
Yazdanian, M., Glynn, S.L., Wright, J.L., Hawi, A. 1998. Correlating partitioning and Caco-2
cell permeability of structurally diverse small molecular weight compounds. Pharm
Res 15, 1490-1494.
Page 22
22
Figure 1. A schematic illustration of the hypothesised arrangement of the phospholipid vesicle
based barrier.
Figure 2. Cross-sections from the confocal laser scanning microscopy studies of the
phospholipid vesicle based barrier (A and B) and the mixed cellulose ester filter (C).
Microscopy pictures from different levels in the membrane are given in Figure A in the
Supplementary Material
Page 23
23
Figure 3. Size distribution of the liposomes extruded through filters with pore size 0.4 µm, as
obtained by PCS (volume-weighted).
Figure 4. Size distribution of the liposomes extruded through 800 nm filters, as obtained by
light obscuration particle counting.
Page 24
24
0.1 0.2 0.3 0.4 0.5
0
2000
4000
6000
8000
10000
12000
14000
16000
18000
400 nm extruded liposome dispersion
800 nm extruded liposome dispersion
Hand-shaken liposome dispersion
Phosphate buffer
Inte
nsi
ty (
a.u
.)
s (nm-1
)
Figure 5. SAXS profiles of the three liposome dispersions and the phosphate buffer (samples
were investigated in a capillary sample holder to ensure equivalent sample thickness). The
curves are displaced along the ordinate for better visualization. (s = 1/d = 2 sin / where
2 is the scattering angle and is the wavelength)
0.1 0.2 0.3 0.4 0.5
0
50000
100000
150000
200000
250000
Hydrated mixed cellulose ester filter
Hand-shaken liposome dispersion
Fully hydrated lioposome barrier
Egg phospholipids
Partially hydrated liposome barrier
Inte
nsi
ty (
a.u.)
s (nm-1)
Figure 6. SAXS curves of the partially hydrated barrier, the fully hydrated barrier, the
hydrated mixed cellulose ester filter, the hand-shaken liposome dispersion and the egg
lecithin. The curves are displaced along the ordinate for better visualization.
Page 25
25
0.1 0.2 0.3 0.4
0
50000
100000
150000
200000
250000
Partially hydrated liposome barrierInte
nsi
ty (
a.u.)
s (nm-1)
0.1 0.2 0.3 0.4
0
2500
5000
7500
35 minutes
30 minutes
25 minutes
20 minutes
15 minutes Inte
nsi
ty (
a.u.)
s (nm-1)
Figure. 7: SAXS curves of the lipid barrier observed prior (bottom) and at certain time points
after addition of phosphate buffer to the barrier (top). The curves are displaced along the
ordinate for better visualization.
Figure 8. The permeability of calcein versus storage time at -80 C, 2-8 C and 20 C,
respectively. The 0 week results were obtained from barriers stored for 18 hours at the given
temperature.
Page 26
26
Figure 9. The permeability (Papp) values of fluorescein using different pH-values in the donor
compartment. In the acceptor compartment the pH was 7.4