42
DSC 5530 Production and Operations Management Dr. Ibrahim Salama Dr. Robert Radics 2016 Fall Semester DSC 5530 Production and Operations Management
| Date post: | 13-Apr-2017 |
| Category: |
Education |
| Upload: | robert-radics |
| View: | 81 times |
| Download: | 1 times |
DSC 5530 Production and Operations Management
Dr. Ibrahim SalamaDr. Robert Radics
2016 Fall Semester
DSC 5530 Production and
Operations Management
2
Lecture 2
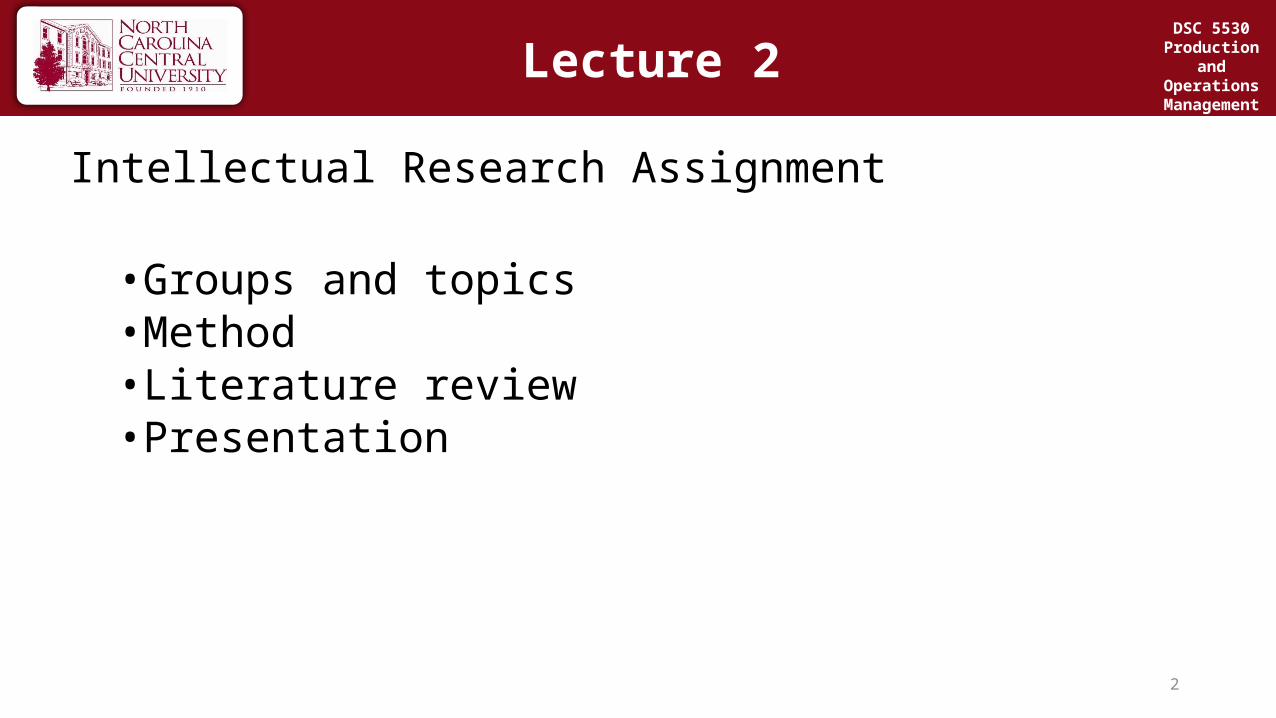
Intellectual Research Assignment
• Groups and topics• Method• Literature review• Presentation
DSC 5530 Production and
Operations Management

3
TeamsDSC 5530
Production and Operations
Management
Group name
(optional)Team
members
1 Location Strategy
2 Design of Goods and Services
3 Process Strategy
4 Project Management
5 Forecasting
6 Operations Strategy in a Global Environment

4
Grading DSC 3750-01 Operations
Management
Assignments % Final Letter Grade Scale
Case Report, Presentations & Class attendance
10
HBR paper report and critique 15 A 90-100B 80-89C 70-79D 60-69F below 60
Intellectual Research Assignment Report 15Intellectual Research Assignment Presentation 10Exam 1, 2, 3 30Exam 4 20Total 100
5
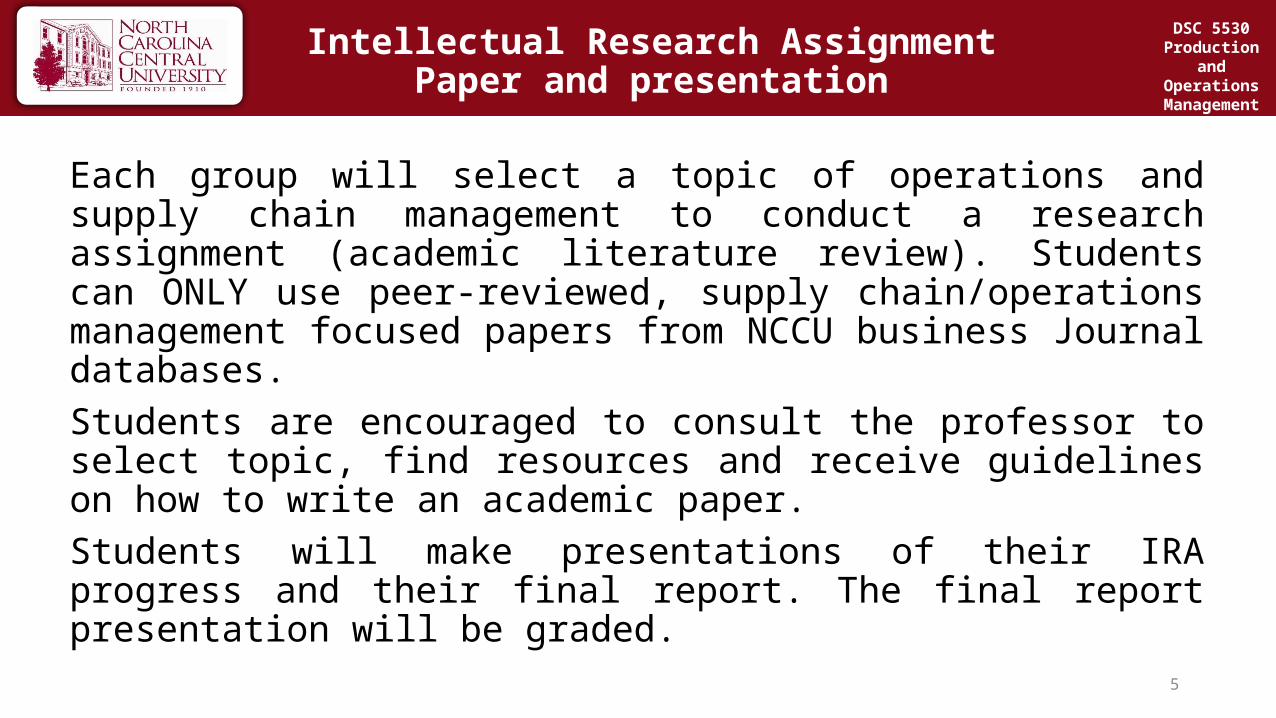
Intellectual Research Assignment Paper and presentation
Each group will select a topic of operations and supply chain management to conduct a research assignment (academic literature review). Students can ONLY use peer-reviewed, supply chain/operations management focused papers from NCCU business Journal databases. Students are encouraged to consult the professor to select topic, find resources and receive guidelines on how to write an academic paper.Students will make presentations of their IRA progress and their final report. The final report presentation will be graded.
DSC 5530 Production and
Operations Management
6
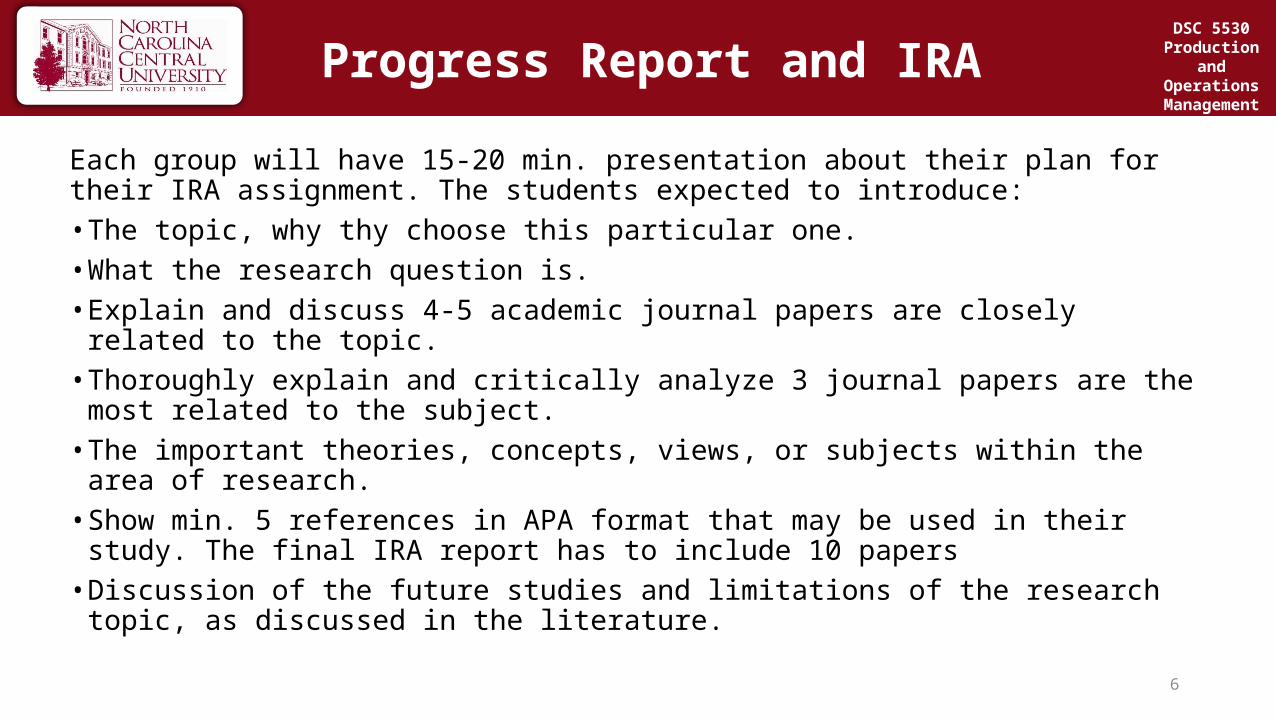
Progress Report and IRA
Each group will have 15-20 min. presentation about their plan for their IRA assignment. The students expected to introduce:• The topic, why thy choose this particular one.• What the research question is.• Explain and discuss 4-5 academic journal papers are closely related to the topic.• Thoroughly explain and critically analyze 3 journal papers are the most related to the
subject.• The important theories, concepts, views, or subjects within the area of research.• Show min. 5 references in APA format that may be used in their study. The final IRA
report has to include 10 papers• Discussion of the future studies and limitations of the research topic, as discussed in
the literature.
DSC 5530 Production and
Operations Management
Robert Radics - PhD Candidate03/17/2014
LCA Group Meeting
DIFFERENT LITERATURE REVIEW METHODS

STUDIES
Grant, M. J., & Booth, A. (2009). A typology of reviews: an analysis of 14 review types and associated methodologies. Health Information and Libraries Journal, 26(2), 91–108. doi:10.1111/j.1471-1842.2009.00848.x
Rowe, R., Whitaker, J., Chapman, J., & Howard, D. (2008). LIFE CYCLE ASSESSMENT IN THE BIOENERGY SECTOR : DEVELOPING A SYSTEMATIC REVIEW.

DIFFERENT METHODS OF LITERATURE REVIEWS
• Typology
• Health care (Evidence Based Practice)
http://hanneinmorocco.blogspot.com/

REVIEW TYPES1. Critical review2. Literature review3. Mapping Review/systematic map4. Meta-analysis5. Mixed studies review/Mixed methods review6. Overview7. Qualitative systematic review / qualitative evidence synthesis8. Rapid review9. Scoping review10. State-of-the-art review11. Systematic review12. Systematic search and review13. Systematized review14. Umbrella review
http://www.norvanco.com/edi/

REVIEW TYPESCritical review
Label Description Search Appraisal Synthesis Analysis
Critical review
Aims to demonstrate writer has extensivelyresearched literature and critically evaluated itsquality. Goes beyond mere description to includedegree of analysis and conceptual innovation.
Seeks to identifymost significant itemsin the field
No formal qualityassessment. Attemptsto evaluate accordingto contribution
Typically narrative,perhaps conceptualor chronological
Significant component: seeks toidentify conceptual contributionto embody existing or derivenew theory
Strengths:• Critical• Built on earlier studies
Continuous development
Weaknesses:• Not systematic• Not structured

REVIEW TYPESLiterature review
Strengths:• Built on earlier studies
Continuous development• Allow consolidation• Identify gaps
Weaknesses:• Potential bias by omitted
literature• Choose preferred hypothesis
Label Description Search Appraisal Synthesis Analysis
Literature review
Generic term: published materials that provideexamination of recent or current literature.Can cover wide range of subjects at variouslevels of completeness and comprehensiveness.May include research findings
May or may notinclude comprehensivesearching
May or may notinclude qualityassessment
Typically narrative
Analysis may be chronological,conceptual, thematic, etc.
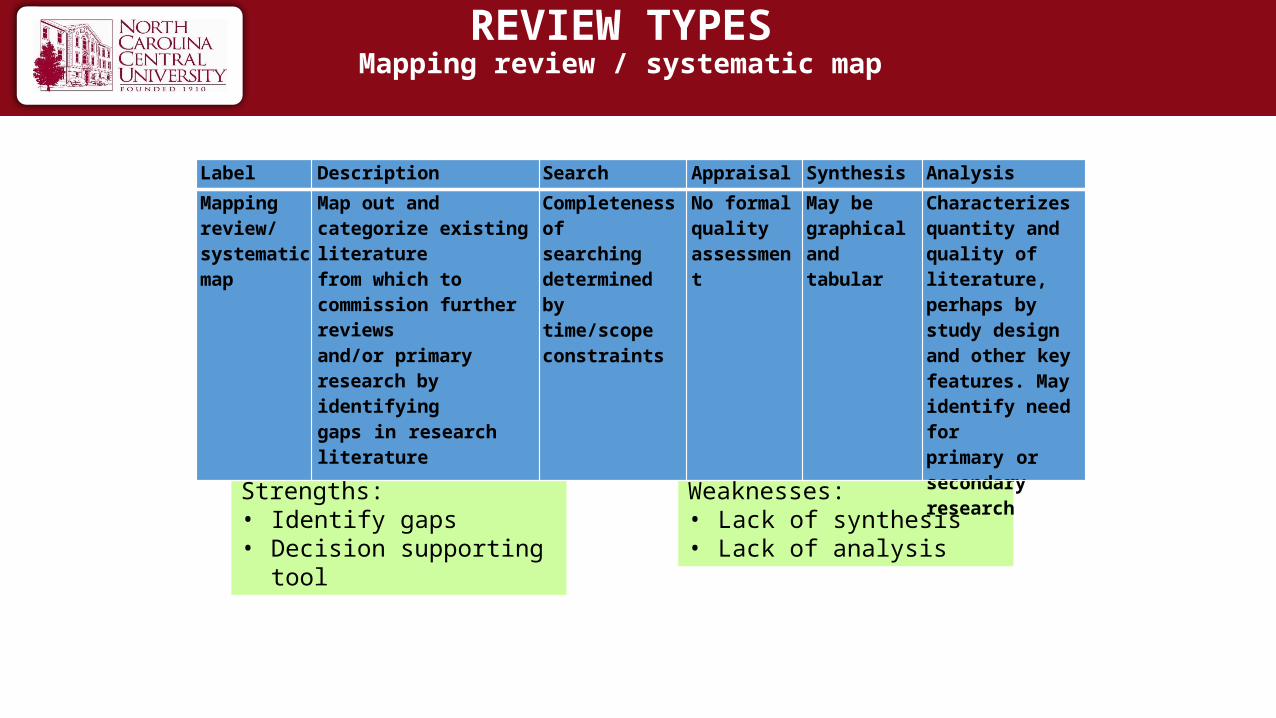
REVIEW TYPESMapping review / systematic map
Strengths:• Identify gaps• Decision supporting tool
Weaknesses:• Lack of synthesis• Lack of analysis
Label Description Search Appraisal Synthesis Analysis
Mapping review/systematic map
Map out and categorize existing literaturefrom which to commission further reviewsand/or primary research by identifyinggaps in research literature
Completeness ofsearching determinedby time/scopeconstraints
No formal qualityassessment
May be graphicaland tabular
Characterizes quantity andquality of literature, perhaps bystudy design and other keyfeatures. May identify need forprimary or secondary research

REVIEW TYPESMapping review / systematic map example
USA Europe Asia TotalFeedstock 5 2 1 8
Communication 1 4 0 5
Knowledge 0 3 2 5
Policy 0 3 0 3
General perception, attitude 7 4 2 13
Total 13 16 5 35
Focus of perception studies by regions
USA Europe Asia TotalInformation_Need 7 11 4 22Environmental_Friendly 7 9 5 21Energy_Independence 6 9 4 19Rural_Development 6 6 1 13Pollution 4 5 2 11Food_Price_Increase 4 4 2 10Jobs 4 3 2 9Total number of main attributes found 38 47 20
Measured attributes by regions

REVIEW TYPESMeta-analysis
Strengths:• Merges results of different
studies• Quantitative
Weaknesses:• Need enough data for
statistical analysis
Label Description Search Appraisal Synthesis Analysis
Meta-analysis
Technique that statistically combines theresults of quantitative studies to provide amore precise effect of the results
Aims for exhaustive,comprehensive searching.May use funnel plot toassess completeness
Quality assessment maydetermine inclusion/exclusion and/orsensitivity analyses
Graphical andtabular withnarrative commentary
Numerical analysis of measuresof effect assuming absence ofheterogeneity

REVIEW TYPESKEY MESSAGES
• Internationally agreed set of discrete, coherent and mutually exclusive review types
• Agreed typology
http://www.psmag.com/blogs/news-blog/literary-fiction-helps-us-read-people-67494/

I. PERCEPTION OF BIOENERGY

OBJECTIVES
• Identifying experiments and methods used in studying social
perception of bioenergy in literature.
• Exploring the general public’s understanding and perceptions
of bioenergy and biofuels in NC and TN.
5

STAKEHOLDER’S PERCEPTION OF BIOENERGY: SYSTEMATIC LITERATURE REVIEW
Findings (44 articles)
• ~84% based in the US and Europe;• Small and convenient samples;• Consumer opinion or general public most
commonly studied (79%)• Low to moderate support for bioenergy;
• No standardized method;• Lack of focus on social impacts.
Systematic search
6

STAKEHOLDER’S PERCEPTION OF BIOENERGY: SYSTEMATIC LITERATURE REVIEW
Consumers Factors Driving Opinion about Bioenergy• Price • Vehicle compatibility• Consistent availability, performance of biofuels, effect on
food availability• Jobs and national security not as important as market
factors
Landowners Factors Affecting Barriers to Supply
• Lack of market structure (need guaranteed contracts)• No commercially successful examples• High investment cost (equipment, etc.) to justify
7

CONCLUSIONSSTAKEHOLDER’S PERCEPTION OF BIOENERGY:
SYSTEMATIC LITERATURE REVIEW
• Social impacts should be studied.
• Need for standardized methods for perception studies.
• Stakeholders expect to be truly involved in collaborative planning, decision making and collective learning process
• Education and targeting of specific needs of stakeholders are the key to the successful adoption of bioenergy.
8

Robert Radics, Ronalds Gonzalez, Ted Bilek, Stephen Kelley,
CAWES ConferenceMay 17 2016
TORREFACTION ECONOMIC LITERATURE REVIEW
By Koppejan et al. (2012) 22

Background – Robert Radics
• Postdoctoral Researcher at NC State University• Ph.D. in Forest Biomaterials• MS. In Forestry Engineering • MS. in Environmental Engineering• MS. In Economics• MBA• Health, Safety and Environmental Manager petrochemical
business 12 years • CEO Environmental remediation 5 years

METHOD
Screening
Identification Databases:(n>100)Google Scholar Web of Science
Articles included:• Peer-reviewed articles and other papers in
English;• Non peer reviewed if deemed creditable;• Published between 2005 and 2015.
Screened by title, abstract (n= 80 )
Articles excluded:• No economic relevant data included• Non peer reviewed and single source of
information
Included
Keywords (combination of at least one word from each of the two bullet points):• Torrefaction/pellet/torrefied pellet;• Economic/process/sustainability/market/risk.
Studies summarized (n= 34)
Articles included:• Focus on pellet, torrefaction or torrefied pellet• Studies that allow for some summarization of the
otherstudies
24

SUMMARY
25
Table 6. Short summary from update peer reviewed and non-peer- reviewed literature
Reference Mass/ Energy Plant size Capex OPEX Totalcost ROI
(Koppejan et al., 78% mass 100,000 t $29 million $9.81/GJ
2012) 98% energy 110,231 T $290/t$263/T
(Pirraglia et al., 2012)– product is
not pelletized100000 T $46 million
$460/T $193.5/T
(Bergman 2005) 70% mass 170000 t 5.6 m Eur 2.2Eur/GJ
2.5Eur/GJ
90% energy 187000 T $6.32 m$33.27/T $50/T
(Tiffany, 2013) Corn
stover65.6% mass
74.5% energy 150000 T $280/T $41.8/T16%
(steam) 6% (no steam)

COMPARISON OF ENERGY SOURCES
26
Wood WP TP Charcoal Coal
Moisture content (% wt) 30 – 45 7 – 10 1 – 5 1 – 5 10 – 15
Heating value (MJ/kg) 9 – 12 15 - 18 20 – 24 30 – 32 23 – 28
Volatile matter (% db) 70 – 75 70 – 75 55 – 65 10 – 12 15 – 30
Fixed carbon (% db) 20 – 25 20 – 25 28 – 35 85 – 87 50 – 55
Density (kg/l) Bulk 0.2 – 0.25 0.55 – 0.75 0.75 – 0.85 ~ 0.20 0.8 – 0.85
Energy density (GJ/m3) (bulk) 2.0 – 3.0 7.5 – 10.4 15.0 – 18.7 6 – 6.4 18.4 – 23.8
Dust Average Limited Limited High Limited
Hydroscopic properties Hydrophilic Hydrophilic Hydrophobic Hydrophobic Hydrophobic
Biological degradation Yes Yes No No No
Grindability Poor Poor Good Good Good
Handling Special Special Good Good Good
Quality variability High Limited Limited Limited Limited
Koppejan et al. (2012)

POTENTIAL USE OF TORREFIED BIOMASS
27
Koppejan et al. (2012)
Market segment
Conversion process
Conversion technology
State-of- the-art biofuel
Pre-treatment requirements
Advantages of torrefaction
Market potential
Large-scale power production
Co-firing Coal-fired boilers WP High
Process with the coal
Higher co-firing rates
High
Gasification Entrained flow gasifiers WP Very high due
to particle size
Size reduction Fluidization C/H/O ratio
very dryLimited
Stand-alone Combustion (>20 MWe)
CFB boilers Wood chips ModerateLimited,
relatively expensive
Small
Industrial heating Combustion Blast
furnaces none ModerateHandling,
C/H/O ratio, Energy content
High
Residential/ District heating
Combustion Stoves / boilers WP High,
decentralizedTransport
savings High

By Koppejan et al. (2012)
TORREFACTION MASS-ENERGY BALANCE
Biomass 50% MC Drying Torrefaction Torrefie
d Biomass
Combustion
1.00 kg
8.30 MJ
8.30 MJ/kg
0.06 kg
0.52 MJ
8.30 MJ/g
Heat
0.37 kg
8.00 MJ
21.70 MJ/kg
0.94 kg
7.80 MJ
8.30 MJ/kg
0.47 kg
8.30 MJ
19.00 MJ/kg
0.10 kg
0.79 MJ
7.90 MJ/kg
Torrefaction gas
Mass
Energy
Energy/mass28

FEEDSTOCK COSTS
30
Note: T refers to short ton
Study Feedstock cost Moisture(Bergman 2005) $15 /T 50%(Pirraglia, Gonzalez, Denig, & Saloni, 2012) $45/T BD
(Tiffany, 2013), corn stover $70/T 17%
(McDow, 2013) $25-$75/T BD(Anonymous, 2015a) $18-$35/T Green T

TORREFACTION TECHNOLOGIES
31Koppejan et al. (2012)
Reactor technologies Companies involved Advantage Disadvantage
Rotating drum
CDS (UK), Torr-Coal (NL), BIO3D (FR), EBES AG (AT), 4Energy Invest (BE), BioEndev/ETPC
(SWE), Atmosclear S.A.(CH), Andritz, EarthCare Products
(USA)
Flexible process controlDirect or indirect heating
Good heat exchangeUpscaling is limited
Screw reactorBTG (NL), Biolake (NL),
FoxCoal (NL), Agri-tech Producers (US)
ContinuousInexpensive
Upscaling is limited Heat transfer is limited
Hot zones, char formation
Herreshoff oven/ Multiple Hearth Furnace (MHF)
CMI-NESA (BE), Wyssmont (USA)
ContinuousInexpensive
Wide particle size processing capability
Torbed – fluid bed reactor Topell (NL)
Continuous or batch wise operation
Fast heating – short residence time
Higher temperature
Sensitive to particle size
Microwave reactor Rotawave (UK) High operation costs
Compact moving bed Andritz/ECN (NL), Thermya (FR), Buhler (D) Non-uniform product
Uneven heat
Belt dryer Stramproy (NL), Agri-tech producers (USA)
Residence time managedUniform product
Not suitable for low bulk density biomass
Upscaling is limited

CAPITAL INVESTMENT
32
Capital investment elements 100 th mt plant by Koppejan et al. (2012)Cost components WP (million USD) TP (Million USD)Woodyard 5.0 5.0Pre dryer (rotary drum) 4.5 3.6Torrefaction 13.0Hammermills 2.0Pelleting 4.0 3.1Silos 1.0Civil works & others 3.0 4.3Total 19.5 29.0

OPERATING COSTS
33
Comparison of WP and TP production costs Koppejan et al. (2012)
Cost components WP ($/GJ) TP ($/GJ) Savings ($/GJ)
Biomass Cost 4.28 4.28 0.00
Electricity Cost 0.60 0.74 -0.14
Labor Cost 0.47 0.47 0.01
Financial costs 1.01 1.49 -0.49
Other costs 0.40 0.43 -0.02
Cost at the production site 6.76 7.41 -0.65
Inland logistics from the plant to port 1.12 0.57 0.55
Deep sea shipment 2.04 1.28 0.76
Inland logistics from the port to utility 0.94 0.55 0.39
Cost delivered to the utility 10.87 9.81 1.06
Extra costs at the power plant 1.93 - 1.93
Total costs of coal replacement 12.80 9.81 2.99

ENERGY NEED
Table 8. Energy requires for TP and WP (Adams et al., 2015) Note: 60 kton/ year pellet mill
TP WPBiomass type Scots pine Scots pine
Biomass volume 163 kton/yr 112 kton/yr
Land area 95 km2 66 km2
Process heat requirement 4000 MJth/t 1560 MJth/t
Natural gas 14.5 m3/t 36.7 m3/t
Grinding electricity 77 kW he/t 260 kW he/t
Pelleting electricity 150 kW he/t 50 kW he/t
Transport bulk density 800 kg/m3 650 kg/m3
Lower calorific value 22.0 MJ/kg 15.5 MJ/kg
Moisture content (MC) (wt.%) 5% 10%
34

CONCLUSIONS
1. Interest: improved energy density, product is more
consistent with the current coal infrastructure.
2. Compared with WP, the lower freight costs of TP due to
their higher energy density is quantified, while other
benefits are not quantified (up to 100% coal
replacement, less dust, lower grinding energy needs, and
TP hydrophobic attribute).
3. The industry is still in its infancy. Scaling up is missing.
4. Power plants have clear interest in the direct coal
replacement.
5. The supply chain is not yet established.

REFERENCES
11
Abt, R. C., Abt, K. L., Cubbage, F. W., & Henderson, J. D. (2010). Effect of policy-based bioenergy demand on southern timber markets: A case study of North Carolina. Biomass and Bioenergy, 34(12), 1679–1686. doi:10.1016/j.biombioe.2010.05.007Adams, P. W. R., Shirley, J. E. J., & McManus, M. C. (2015). Comparative cradle-to-gate life cycle assessment of wood pellet production with torrefaction. Applied Energy, 138, 367–380. doi:10.1016/j.apenergy.2014.11.002 Anonymous. (2015a). North American Woodfiber & Biomass Markets. RISI, (January). Retrieved from http://www.risiinfo.com/Marketing/Indices/NAWBM_sample.pdfAnonymous. (2015b). Pellet Plants. Biomass Magazine. Retrieved from http://biomassmagazine.com/plants/listplants/pellet/US/ Bergman, P. C. (2005). Combined torrefaction and pelletisation. The TOP Process. Analysis, (July), 29. doi:ECN-C--05-073Boskovic, A., Basu, P., & Amyotte, P. (2015). An exploratory study of explosion potential of dust from torrefied biomass. Canadian Journal of Chemical Engineering, 93(4), 658–663. doi:10.1002/cjce.22153 Boskovic, A., Basu, P., Amyotte, P., Stelte, W., Glasser, D., & Guo, W. (2013). Logistics and storage of torrefied biomass : Safety aspects. Fule, 93(4), 1–214. doi:10.1016/0016-2361(86)90163-8Bush, T. G. (2010). Wood Pellet Production in the Southern United States: a Qualitative Economic Assess,emt and Experiment to Determine the Production Factors Influencing Self Heating During Storage. Thesis. Retrieved from http://etd.fcla.edu/UF/UFE0041861/bush_t.pdfCambero, C., & Sowlati, T. (2014). Assessment and optimization of forest biomass supply chains from economic, social and environmental perspectives - A review of literature. Renewable and Sustainable Energy Reviews, 36, 62–73.doi:10.1016/j.rser.2014.04.041CCOHS. (n.d.). Combustible Dust. Canadian Centre for Occupational Health and Safety. Retrieved from http://ccohs.ca/oshanswers/chemicals/combustible_dust.html Dufaud, O. Ã., Perrin, L., Chazelet, S., & Thomas, D. (2007). Dust Explosions : How Should the Influence of Humidity Be Taken Into Account ?, (153), 1–6.Fierro, V., Miranda, J. ., Romero, C., Andrés, J. ., Arriaga, A., Schmal, D., & Visser, G. . (1999). Prevention of spontaneous combustion in coal stockpiles. Fuel Processing Technology, 59(1), 23–34. doi:10.1016/S0378-3820(99)00005-3 Forest2Market. (2015). Wood Supply Market Trends in the US South Wood Supply Trends in the US South. Retrieved from http://www.theusipa.org/Documents/USSouthWoodSupplyTrends(ExecutiveSummary).pdfGlasser, D. (1986). A simplified combustion model of spontaneous in coal stockpiles. Fule, 65, 1035–1041. doi:10.1016/0016-2361(86)90163-8Goh CS, Junginger M, Cocchi M, Marchal D, Thrän D, Hennig C, Heinimö J, Nikolaisen L, Schouwenberg PP, Bradley D, H. R. (2013). Wood pellet market and trade: a global perspective. Biofuels, Bioproducts and Biorefining. Biofuels, Bioproducts and Biorefining, 7(1), 24–42.Gough, D., Thomas, J., & Oliver, S. (2012). Clarifying differences between review designs and methods. Systematic Reviews, 1(1), 28. doi:10.1186/2046-4053-1-28Johnson, E. (2009). Goodbye to carbon neutral: Getting biomass footprints right. Environmental Impact Assessment Review, 29(3), 165–168. doi:10.1016/j.eiar.2008.11.002 Jones, T., B. (1998). Electrostatics and Dust Explosions in Powder Handling. In Fluidization, Solids Handling, and Processing: Industrial Applications (pp. 817–865). Retrieved fromhttps://books.google.com/books?hl=en&lr=&id=YdoBR4MJw_gC&oi=fnd&pg=PP1&dq=electrostatics+and+dust+explosions+in+power+handling,+chapter+13+fluidization+1999&ots=t3pvg9uziU&sig=C96EMJfu-BSVTr_yczV3xbtsNQM#v=onepage&q&f=falseKatie Fletcher. (2016). Pellet Offgassing: Simple Problem, Simple Solution? Biomass Magazine, (01/25). Retrieved from http://biomassmagazine.com/articles/12792/pellet-offgassing-simple-problem-simple-solution Koppejan, J., Sokhansanj, S., Melin, S., & Madrali, S. (2012). Status overview of torrefaction technologies. IEA Bioenergy Task 32, (December), 1–54.Krishnaswamy, S., Gunn, R. D., & Agarwal, P. K. (1996). Low-temperature oxidation of coal 2. An experimental and modelling investigation using a fixed-bed isothermal flow reactor. Fuel, 75(3), 344–352. doi:10.1016/0016- 2361(95)00177-8Lamers, P., Hoefnagels, R., Junginger, M., Hamelinck, C., & Faaij, A. (2014). Global solid biomass trade for energy by 2020: An assessment of potential import streams and supply costs to North-West Europe under different sustainability constraints. GCB Bioenergy, 618–634. doi:10.1111/gcbb.12162Lamers, P., Junginger, M., Hamelinck, C., & Faaij, A. (2012). Developments in international solid biofuel trade - An analysis of volumes, policies, and market factors. Renewable and Sustainable Energy Reviews, 16(5), 3176–3199. doi:10.1016/j.rser.2012.02.027Mathews, J. A. (2008). Carbon-negative biofuels. Energy Policy, 36(3), 940–945. doi:10.1016/j.enpol.2007.11.029McDow, W. (2013). The Wood Pellet Value Chain, (March).OSHA. (n.d.). Combustible Dust: An Explosion Hazard. Occupational Safety & Health Administration. Retrieved from https://www.osha.gov/dsg/combustibledust/Pirraglia, A., Gonzalez, R., Denig, J., & Saloni, D. (2012). Technical and Economic Modeling for the Production of Torrefied Lignocellulosic Biomass for the U.S. Densified Fuel Industry. BioEnergy Research, 6(1), 263–275. doi:10.1007/s12155-012-9255-6Radics, R., Dasmohapatra, S., & Kelley, S. S. (2015). Systematic Review of Bioenergy Perception Studies, 10, 8770–8794.Resch, G., Held, A., Faber, T., Panzer, C., Toro, F., & Haas, R. (2008). Potentials and prospects for renewable energies at global scale. Energy Policy, 36, 4048–4056. doi:10.1016/j.enpol.2008.06.029 Scott, J. A., Ho, W., & Dey, P. K. (2012). A review of multi-criteria decision-making methods for bioenergy systems. Energy, 42(1), 146–156. doi:10.1016/j.energy.2012.03.074Tiffany, D. G. (2013). Economics of Torrefaction Plants with Integrated Ethanol and Coal POwer Plants, 1–26.U.S. Department of Energy. (2011). Billion Ton Update: Biomass Supply for a Bioenergy and Bioproducts Industry. Oak Ridge, TN: Oak Ridge National Laboratory. Retrieved from https://www1.eere.energy.gov/bioenergy/pdfs/billion_ton_update.pdfUNDP. (2000). World Energy Assessment. Energy and the challenge of Sustainability. Vasa. Retrieved from http://medcontent.metapress.com/index/A65RM03P4874243N.pdfZeller Jr., T. (2015). Wood Pellets Are Big Business (And For Some, a Big Worry). Forbes. Retrieved from http://www.forbes.com/sites/tomzeller/2015/02/01/wood-pellets-are-big-business-and-for-some-a-big-worry/#b8f1c5771f83
36

37
AgilitySTRATEGIC PLANNING: AGILITY IS A COMPETITIVE ADVANTAGEBy Erica OlsenIs being agile on your strategic plan’s list of competitive advantages? Can your business react and change its game plan based on either customer feedback or shifts in market, all while keeping that end vision in focus? A successful business has the ability to assess any given situation and decide how to proceed based on the findings.The ability to adapt quickly is the name of the game in today’s business climate. When everyone on your team is on the same page and is pulling in the same direction, you can easily absorb shifts, make changes, and innovate on the fly. If you don’t have a clear direction in your strategic plan, your team may not know how and what to adapt to.We’ve all been around long enough to know that markets shift and things don’t always stay the same. A business leader’s responsibility is to anticipate change. So as you work through your strategic management process, take note. Although you’re preparing a five-year plan, remember that you’ll need to change things up a bit as you travel down that road to success.
DSC 5530 Production and
Operations Management

38
AgilitySTRATEGIC PLANNING: AGILITY IS A COMPETITIVE ADVANTAGEBy Erica OlsenYou’ll likely come across a lot of forks in the road, and you’ll be a more sustainable organization if you’re better equipped to take the necessary turns to get to Point B. Keep this point in mind: Good businesses don’t change strategies every month; they change the tactics to execute a strategy.Many firms underestimate the buy-in needed to make change happen. Change initiatives need approximately 75 percent of recognizable support from key leaders and managers. If at least a majority of the staff and stakeholders are on board with the strategic management process, then getting everyone else on the same page when the tactics to get to your vision need to shift will be much easier.Identifying what will change, what will stay the same, and why the change is important helps this process along and helps alleviate any fears your staff may have of what may happen as a result of the change.
DSC 5530 Production and
Operations Management
39
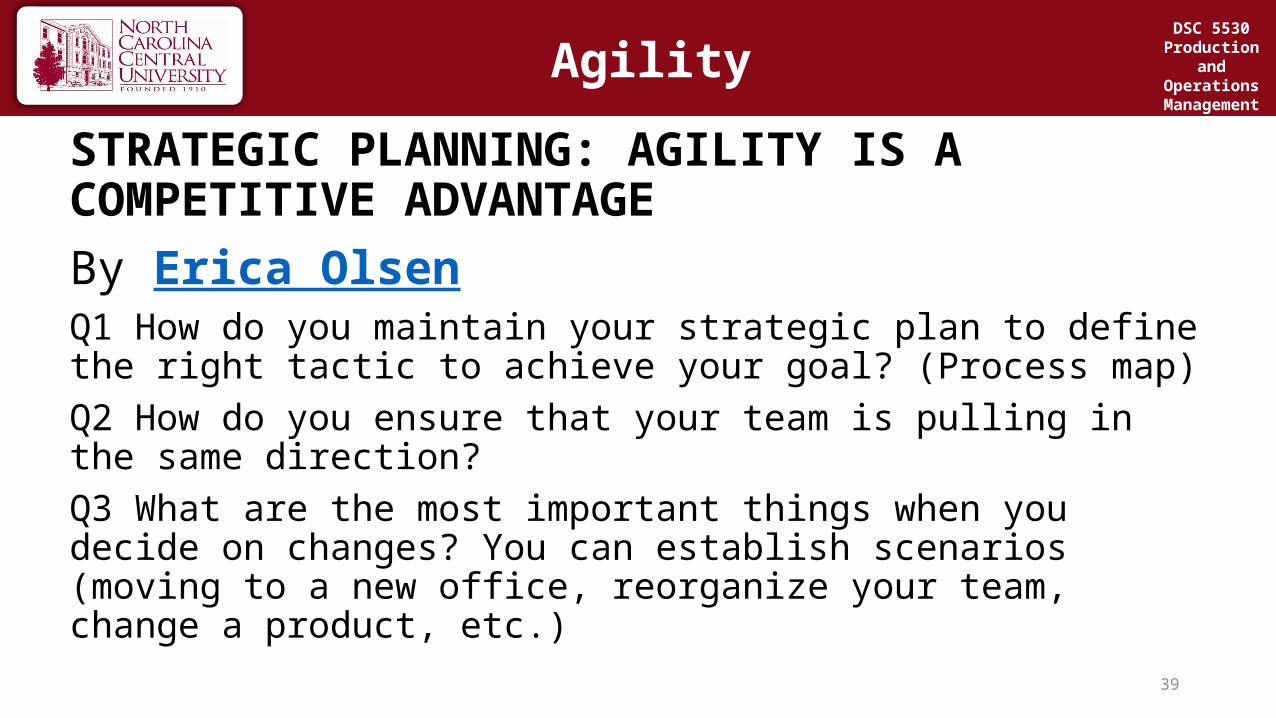
Agility
STRATEGIC PLANNING: AGILITY IS A COMPETITIVE ADVANTAGEBy Erica OlsenQ1 How do you maintain your strategic plan to define the right tactic to achieve your goal? (Process map)Q2 How do you ensure that your team is pulling in the same direction?Q3 What are the most important things when you decide on changes? You can establish scenarios (moving to a new office, reorganize your team, change a product, etc.)
DSC 5530 Production and
Operations Management

40
2nd Lecture Outlines
Teams and SubjectsIntellectual research assignmentLiterature review methodsSample Literature reviews
DSC 5530 Production and
Operations Management

41
Paper Report and Critique Due by next Thursday
Piercy, N. (2012). Business history and operations management, 54(2), 154–178.
DSC 5530 Production and
Operations Management

42
Paper Report and Critique
Papers have been chosen for select classes and one group/student has been assigned to present the paper and start/lead the discussion in each class. All student should read and be prepared for the discussion.All students should submit a paper report for the assigned paper. The reports are 1-2 pages in length. No late submissions will be accepted.
DSC 5530 Production and
Operations Management

43
Next Classes
Tuesday:Chapter 2 “Operations Strategy in a Global Environment”G/S6 will present and lead the discussion. This group submit one print copy of their report to the professor at the beginning of the class on this day.
Suggested Intellectual Research topic by teams for class discussion. Printed copy (importance, relevance, goal, presented in the class 2 min.)
Thursday:Paper Report and Critique: G/S1 will present and lead the discussion.All students should submit their report before noon on this day.
DSC 5530 Production and
Operations Management


