Abstract Bayesian dynamic stochastic general equilibrium (DSGE) models com-bine microeconomic behavioural foundations with a full-system Bayesian likelihoodestimation approach using key macro-economic variables. Because of the usefulnessof this class of models for addressing questions regarding the impact and consequencesof alternative monetary policies they are nowadays widely used for forecasting andpolicy analysis at central banks and other institutions. In this paper we provide a briefdescription of the two main aggregate euro area models at the ECB. Both modelsshare a common core but their detailed specification differs reflecting their specificfocus and use. The New Area Wide Model (NAWM) has a more elaborate interna-tional block, which is useful for conditioning the euro area projections on assumptionsabout foreign economic activity, prices and interest rates and to widen the scope forscenario analysis. The Christiano, Motto and Rostagno (CMR) model instead has amore developed financial sector, which allows it to be used for monetary and financialscenarios and for cross checking. Based on the comparison of two models we find abroad agreement on the qualitative predictions they make, although, in quantitativeterms, there are some differences. However, the perspectives provided by the twomodels are often complementary, rather than conflicting.
Keywords DSGE models · Central banks · Monetary policy
JEL Classification B4 · C5 · E32 · E50
Prepared for a special issue of the Spanish Economic Review. The opinions expressed are our own andshould not be attributed to the European Central Bank or its Governing Council.
F. Smets (B) · K. Christoffel · G. Coenen · R. Motto · M. RostagnoEuropean Central Bank, Frankfurt, Germanye-mail: [email protected]
123
52 SERIEs (2010) 1:51–65
1 Introduction
Central banks need a wide range of macro-econometric models and tools for fore-casting and monetary policy analysis. Over the past 5 years, an increasing number ofinstitutions have introduced Bayesian dynamic stochastic general equilibrium (DSGE)models in their tool kit for policy analysis.1 These models combine a consistent, micro-founded DSGE structure, characterised by the derivation of behavioural relationshipsfrom the optimising behaviour of agents subject to technological and budget con-straints and the specification of a well-defined general equilibrium, with a full-systemBayesian likelihood estimation using key macro-economic variables.
As argued by Smets and Wouters (2003, 2004), the DSGE approach is particularlysuitable for addressing questions regarding the impact and consequences of alternativemonetary policies. The general equilibrium structure lends itself to telling economi-cally coherent stories and structuring forecast-related discussions around it. Off-modelinformation about “deep” structural parameters can be used to calibrate and/or esti-mate the model, which is particularly useful when time series are short. The modelstructure also helps to identify parameters and the type of shocks hitting the economyand to reduce the risk of over-fitting. Finally, the structural nature of the model and,in particular, its explicit account for the role of expectations makes the analysis lesssubject to the Lucas critique and more suitable for policy analysis. DSGE models put apremium on the important role of expectations in assessing alternative policy actions.They also give a better feel for which parameters are likely to be policy invariant andwhich ones are not.
The empirical strategy, full-system Bayesian likelihood estimation, also has a num-ber of advantages over the more traditional equation-by-equation estimation of largemacro models. First, it formalises the use of prior information and helps identifica-tion, thereby making the estimation algorithm of the highly restricted and non-linearmodel much more stable. As shown by Canova (this issue), the likelihood functionof DSGE models is often flat and irregular in a number of the parameters. Priorinformation helps overcoming such identification issues. Secondly, the Bayesian like-lihood approach delivers a full characterisation of the parameter and shock uncertainty,allowing easily constructing probability distributions for unobserved variables (e.g.the output gap) and derived functions (e.g. forecasts). The state-space formulationunderlying the approach, whereby the state equation captures the dynamics of thestate variables in the model economy and the observation equations links those statevariables to observable macro-economic time series, is a very flexible tool that candeal explicitly with measurement error, unobservable state variables, large data setsand different sources of information. Finally, the Bayesian estimation methodologyprovides a natural framework for decision making under uncertainty. As new dataand new models appear, decision makers can update their posterior probabilities andappropriately weigh them when making decisions.
The attractive combination of rigorous economic reasoning and data coherence thatcharacterises Bayesian DSGE models implies that they can be used successfully for
1 Examples are the Sveriges Riksbank, the Norges Bank, the Czech National Bank, the Federal ReserveBoard, the IMF and the European Commission.
123
SERIEs (2010) 1:51–65 53
scenario analysis and monetary policy design without compromising on their forecast-ing performance, which is comparable to the one of purely statistical and data-drivenmethods. In this paper, we provide a brief description of the two main aggregate euroarea DSGE models that are being used in the context of the ECB’s quarterly projec-tion rounds and the associated cross-checking in the context of the ECB’s monetaryanalysis. Both models have a core which is similar to that of Christiano et al. (2005)and Smets and Wouters (2003). However, the New Area Wide Model (NAWM) has amore elaborate international block, which is useful for conditioning the euro area pro-jections on assumptions about foreign economic activity, prices and interest rates. TheChristiano, Motto and Rostagno (CMR) model instead has a more developed financialsector, which allows it to be used in cross checking. In addition to the two estimatedeuro area DSGE models, a number of other DSGE models have been developed toaddress specific issues such as the effects of fiscal policy, the international interac-tions between the euro area and the rest of the world and country-specific developmentswithin the euro area.2 These are not discussed in this paper.
The rest of the paper is structured as follows. Section 2 gives a brief description ofthe main features of those two models and their use at the ECB. Section 3 comparessome of the empirical and structural features of the two models. First, it discusses andcompares the monetary policy transmission mechanism in both models. Secondly, ituses the models to interpret the sources of recent developments in economic activityin the euro area. Finally, it provides an example of the counterfactual policy simula-tions that can be done using the two models. More details and examples of this typeof empirical, quantitative policy analysis can be found in the various papers describ-ing the two models and their applications. Finally, the last section (Sect. 4) brieflyaddresses some of the recent criticism of modern DSGE models that has arisen in thelight of the current financial crisis and provides some conclusions.
2 Estimated euro area DSGE models at the ECB
Many models are in use at the ECB ranging from purely statistical models to fullyfledged structural (DSGE) models. Within the class of DSGE models, two models areroutinely used in the policy process. The NAWM has been developed for forecastingpurposes and for policy analysis. The CMR model has been developed to support themonetary analysis of the ECB and its two-pillar strategy, and to conduct monetaryand financial scenarios. The need to serve for different purposes has driven also themodelling choices in developing these models. The NAWM includes a detailed inter-national block, whereas the CMR includes a detailed modelling of the monetary andfinancial side of the economy.
The two models share similar long-run properties and a similar “core block”. Thislends itself to interpreting the specificities of the two models in terms of additionaltransmission channels with respect to their common “core block”. The core model
2 These models include the version of the NAWM used for globalization studies (Jacquinot and Straub2008), the NAWM with a financial block (McAdam and Lombardo (2009)), a DSGE model to analysemacroeconomic interdependencies in the euro area (Gomes et al. 2009) and the rational expectation multicountry model for the euro area countries used for forecasting and policy analysis (Dieppe et al. 2009).
123
54 SERIEs (2010) 1:51–65
Households - consumption/saving decisions- labour supply
Production - Combine labour and
Markets: imperfect competition &
Monetary
Government
Exports
Imports
Rest of the World Exchange Rate, ForeignDemand,
Final Goods Combining domestic and imported goods
Portfolio decisions
Liabilities- Deposits
Assets
- Reserves
- Loans
Financial
Externalfinancing
Fig. 1 Structure of the Models. Note: The boxes with the solid frame denote the core model that is nestedin both models. The boxes with dashed frame at the bottom of the figure show the open economy featuresof the NAWM whereas the box with dash-dotted frame on the right-hand side of the figure describes thefinancial dimension modelled in the CMR
includes features introduced in Christiano et al. (2005) and Smets and Wouters (2003),which have been shown to help explaining the data well both in the US and the euroarea. Such features have become standard in DSGE modelling. They include habitpersistence in consumption, adjustment costs in the flow of investment, imperfectcompetition, sticky prices and sticky wages, and the inclusion of a large number ofstructural shocks that act as shifters of the structural relationships. Figure 1 providesa diagrammatic representation of the main sectors of the economy included in the“core block” (boxes with solid frame in the middle of the figure) and of the additionalsectors that are included in the NAWM (boxes with dashed frame at the bottom of thefigure) and the CMR model (box shaded with dashed-dotted frame on the right-handside of the figure).
In the NAWM the common core block is embedded into an international environ-ment.3 This has wide-ranging consequences for the model dynamics both regardingthe influence of foreign developments on the domestic economy as well as by directlyinfluencing the decision process of domestic households and firms.
Households are trading both domestic and foreign bonds. The effective return onthe risk-less domestic bonds depends on a financial intermediation premium, whichdrives a wedge between the interest rate controlled by the monetary authority and thereturn required by the household. Similarly, when taking a position in the internationalbond market, the household encounters an external financial intermediation premiumwhich depends on the economy-wide (net) holdings of internationally traded foreignbonds expressed in domestic currency relative to domestic nominal output. That is, ifthe domestic economy is a net debtor, households have to pay an increasing external
3 See Christoffel et al. (2008) for a full description of the NAWM model.
123
SERIEs (2010) 1:51–65 55
intermediation premium on their international debt. The uncovered interest paritycondition determines the dynamics of the exchange rate.
Turning to the production side there are four different kinds of firms. In the pro-duction sector of the tradable, intermediate good there are domestic firms producingfor the domestic market, domestic firms producing for the foreign market and for-eign firms producing for the domestic market. The intermediate good firms engagein Calvo price setting where both import as well as export goods are priced in thedomestic currency.4 The representative firm producing the non-tradable final invest-ment and private consumption goods, combines purchases of a bundle of domesticallyproduced intermediate goods, with purchases of a bundle of imported foreign inter-mediate goods. The relative demand for the goods is determined by the relative prices,the price elasticities and the degree of home bias. The resulting trade flows are affectedby domestic and foreign demand, relative prices and by the exchange rate, accountingfor limited exchange-rate pass-through in the short to medium run.
The design of the NAWM for use in the ECB/Eurosystem staff projections has beenguided by two important considerations, namely (i) to provide a comprehensive set ofcore projection variables and (ii) to allow conditioning on monetary, fiscal and externaldevelopments which, in the form of technical assumptions, are an important elementof the projections. As a consequence, the scale of the model—compared with a typicalDSGE model—is relatively large. Employing Bayesian methods, it is estimated on 18key macroeconomic variables. In addition to standard national account data, data forthe nominal effective exchange rate, euro area foreign demand, euro area competitors’export prices as well as oil prices are used, which are deemed important variables inthe projections capturing the influence of external developments.
Turning to the CMR model, it extends the “core block” by explicitly modellingthe monetary and financial dimension of the economy. Portfolio and financing deci-sions are non-recursive in the model, but they directly affect consumption, investmentand prices. The model is a variant of the model with financial frictions developedin Christiano et al. (2003, 2007), which in turn includes the financial accelerator ofBernanke et al. (1999) and the banking system of Chari et al. (1995). The main fea-tures of financial intermediation in the CMR are the following. First, the presenceof many types of assets in the economy that differ in their degree of liquidity andmaturity gives rise to portfolio decisions. Second, investment in physical capital isleveraged, giving rise to the need for external financing. There is risk of default;and the presence of asymmetric information in credit markets implies that the incen-tives of borrowers and lenders are not aligned. This leads the lender to charge apremium which is a function of the equity of the borrower. As the value of equity ismainly driven by asset price fluctuations, there is a direct link between asset pricesand real economic activity. Third, in the model part of the working capital has to befinanced prior to the time in which revenues from selling current production becomeavailable. Fourth, in the model savers and lenders do not interact directly but viafinancial intermediaries. Intermediaries have their own balance sheet with liabili-ties, mainly different type of deposits, so that it is possible to construct aggregates
4 The alternative setting, assuming local currency pricing both for exports and imports, leads to counter-factual production price dynamics in the eurozone and a deteriorated fit of the model in the estimation.
123
56 SERIEs (2010) 1:51–65
Output Inflation Interest rates
0 5 10 15 20
-0.5
-0.4
-0.3
-0.2
-0.1
0
0.1
Quarters
0 5 10 15 20
-0.25
-0.2
-0.15
-0.1
-0.05
0
0.05
Quarters
0 5 10 15 20-10
0
10
20
30
40
50
60
Quarters
NAWMCMR NAWM
CMRNAWMCMR
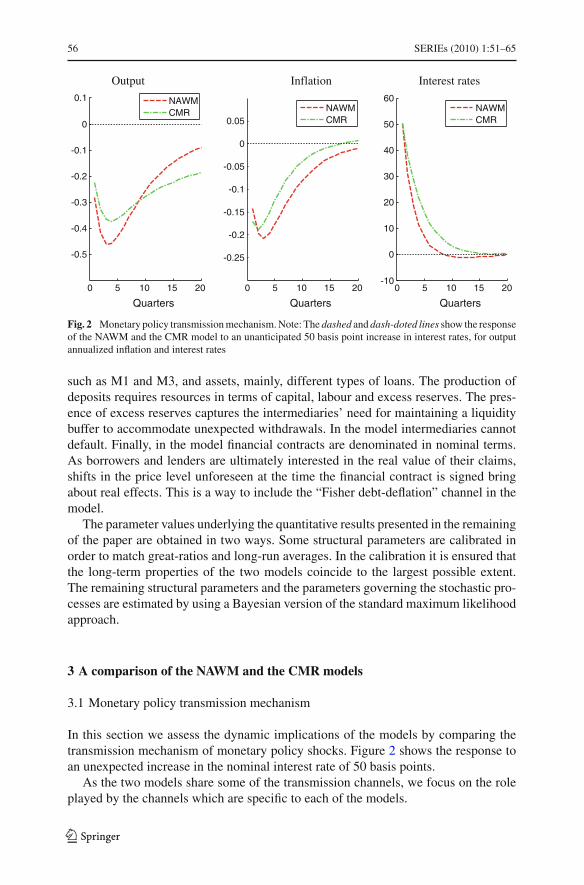
Fig. 2 Monetary policy transmission mechanism. Note: The dashed and dash-doted lines show the responseof the NAWM and the CMR model to an unanticipated 50 basis point increase in interest rates, for outputannualized inflation and interest rates
such as M1 and M3, and assets, mainly, different types of loans. The production ofdeposits requires resources in terms of capital, labour and excess reserves. The pres-ence of excess reserves captures the intermediaries’ need for maintaining a liquiditybuffer to accommodate unexpected withdrawals. In the model intermediaries cannotdefault. Finally, in the model financial contracts are denominated in nominal terms.As borrowers and lenders are ultimately interested in the real value of their claims,shifts in the price level unforeseen at the time the financial contract is signed bringabout real effects. This is a way to include the “Fisher debt-deflation” channel in themodel.
The parameter values underlying the quantitative results presented in the remainingof the paper are obtained in two ways. Some structural parameters are calibrated inorder to match great-ratios and long-run averages. In the calibration it is ensured thatthe long-term properties of the two models coincide to the largest possible extent.The remaining structural parameters and the parameters governing the stochastic pro-cesses are estimated by using a Bayesian version of the standard maximum likelihoodapproach.
3 A comparison of the NAWM and the CMR models
3.1 Monetary policy transmission mechanism
In this section we assess the dynamic implications of the models by comparing thetransmission mechanism of monetary policy shocks. Figure 2 shows the response toan unexpected increase in the nominal interest rate of 50 basis points.
As the two models share some of the transmission channels, we focus on the roleplayed by the channels which are specific to each of the models.
123
SERIEs (2010) 1:51–65 57
In line with common wisdom regarding the transmission of monetary policy, inthe NAWM the increase in the real rate leads to temporarily curtailed demand, withinvestment falling more strongly than consumption. The responses reflect also theopen economy dimension and the endogenous response of the exchange rate addingadditional transmission channels affecting both the real and nominal side.
On the real side we find that the positive interest rate differential between foreignand domestic bonds implies an increased demand for domestic bonds. This impliesan appreciation of the domestic currency via the uncovered interest parity assump-tion. Since intermediate imports are priced in the local currency the exchange ratemovement implies a gradual, but noticeable drop in import prices and an improve-ment of the terms of trade. The improved terms of trade lead to expenditure-switchingfrom domestic towards foreign goods in the composition of the final consumptionand investment goods. As a consequence, imports fall by less than domestic demand.Exports are priced in producer currency implying a stronger price increase and a morepronounced reduction in exports.
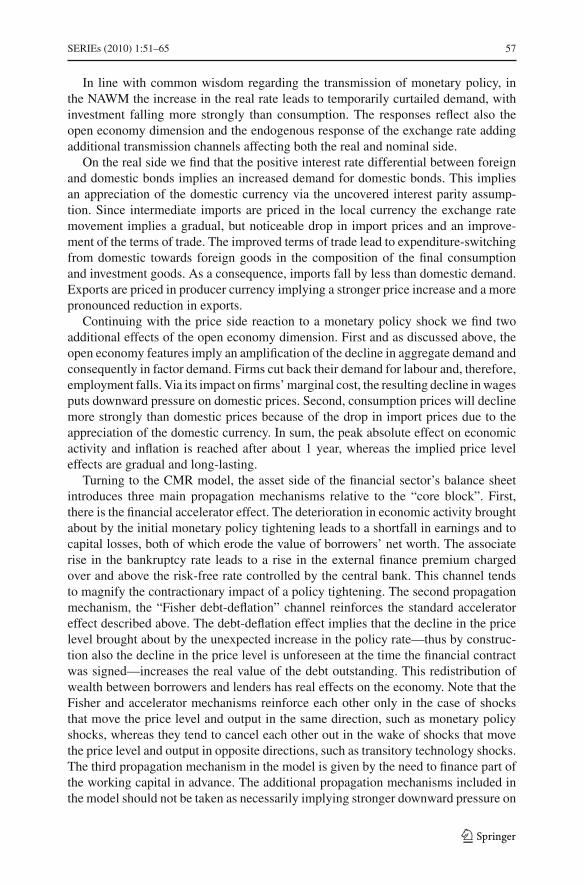
Continuing with the price side reaction to a monetary policy shock we find twoadditional effects of the open economy dimension. First and as discussed above, theopen economy features imply an amplification of the decline in aggregate demand andconsequently in factor demand. Firms cut back their demand for labour and, therefore,employment falls. Via its impact on firms’ marginal cost, the resulting decline in wagesputs downward pressure on domestic prices. Second, consumption prices will declinemore strongly than domestic prices because of the drop in import prices due to theappreciation of the domestic currency. In sum, the peak absolute effect on economicactivity and inflation is reached after about 1 year, whereas the implied price leveleffects are gradual and long-lasting.
Turning to the CMR model, the asset side of the financial sector’s balance sheetintroduces three main propagation mechanisms relative to the “core block”. First,there is the financial accelerator effect. The deterioration in economic activity broughtabout by the initial monetary policy tightening leads to a shortfall in earnings and tocapital losses, both of which erode the value of borrowers’ net worth. The associaterise in the bankruptcy rate leads to a rise in the external finance premium chargedover and above the risk-free rate controlled by the central bank. This channel tendsto magnify the contractionary impact of a policy tightening. The second propagationmechanism, the “Fisher debt-deflation” channel reinforces the standard acceleratoreffect described above. The debt-deflation effect implies that the decline in the pricelevel brought about by the unexpected increase in the policy rate—thus by construc-tion also the decline in the price level is unforeseen at the time the financial contractwas signed—increases the real value of the debt outstanding. This redistribution ofwealth between borrowers and lenders has real effects on the economy. Note that theFisher and accelerator mechanisms reinforce each other only in the case of shocksthat move the price level and output in the same direction, such as monetary policyshocks, whereas they tend to cancel each other out in the wake of shocks that movethe price level and output in opposite directions, such as transitory technology shocks.The third propagation mechanism in the model is given by the need to finance part ofthe working capital in advance. The additional propagation mechanisms included inthe model should not be taken as necessarily implying stronger downward pressure on
123
58 SERIEs (2010) 1:51–65
inflation. On the one hand, higher financing costs lead to lower inflationary pressurevia their depressing effect on economic activity. On the other hand, they representadditional costs, putting upward pressure on price developments.
The model makes also predictions for the liability side of banks’ balance sheet.Given the importance of monetary and credit developments in the ECB monetary pol-icy strategy, understanding the path followed by narrow and broad monetary aggregatesin response to a policy tightening is of particular interest. According to the model, apolicy tightening triggers an initial positive reaction of the stock of nominal M3. This isdriven by the speculative demand for money, captured by the M3 components outsideM1. This is explained by the fact that the interest rate earned on instruments includedin M3–M1 is closely linked to market rates. The model suggests that the own rate onM3–M1 goes up approximately by the full 50 basis points rise in the policy rate. Theinterest rate earned on the liquid component of M3 is instead less reactive. Accordingto the model, after the initial rise, M3 undergoes a significant and permanent decline.This “perverse” initial decline of M3 following a policy tightening found in the modelis consistent with evidence obtained on the basis of identified VARs.
Overall, taking into account that the two models share only some of the transmissionchannels, the quantitative differences between the NAWM and the CMR responses toa policy shock appear to be rather small.
3.2 Structural interpretation of GDP growth
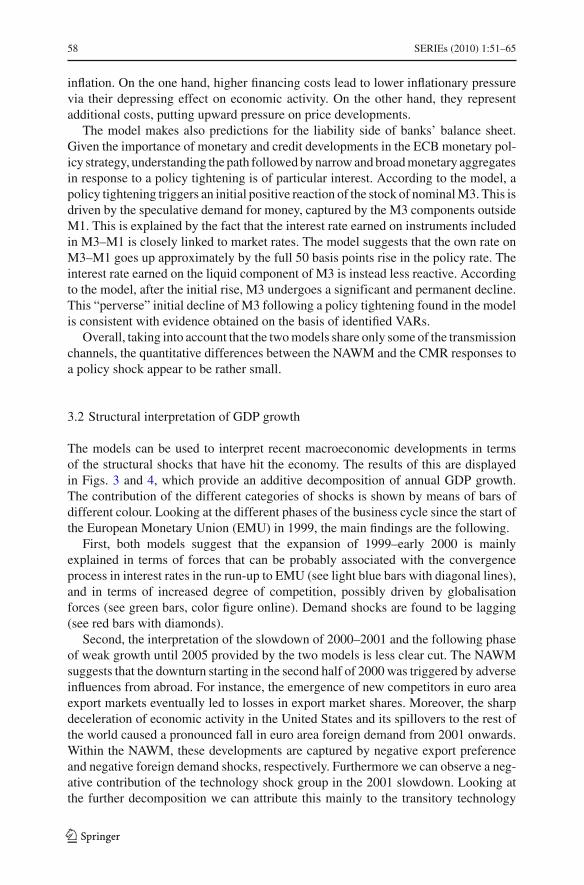
The models can be used to interpret recent macroeconomic developments in termsof the structural shocks that have hit the economy. The results of this are displayedin Figs. 3 and 4, which provide an additive decomposition of annual GDP growth.The contribution of the different categories of shocks is shown by means of bars ofdifferent colour. Looking at the different phases of the business cycle since the start ofthe European Monetary Union (EMU) in 1999, the main findings are the following.
First, both models suggest that the expansion of 1999–early 2000 is mainlyexplained in terms of forces that can be probably associated with the convergenceprocess in interest rates in the run-up to EMU (see light blue bars with diagonal lines),and in terms of increased degree of competition, possibly driven by globalisationforces (see green bars, color figure online). Demand shocks are found to be lagging(see red bars with diamonds).
Second, the interpretation of the slowdown of 2000–2001 and the following phaseof weak growth until 2005 provided by the two models is less clear cut. The NAWMsuggests that the downturn starting in the second half of 2000 was triggered by adverseinfluences from abroad. For instance, the emergence of new competitors in euro areaexport markets eventually led to losses in export market shares. Moreover, the sharpdeceleration of economic activity in the United States and its spillovers to the rest ofthe world caused a pronounced fall in euro area foreign demand from 2001 onwards.Within the NAWM, these developments are captured by negative export preferenceand negative foreign demand shocks, respectively. Furthermore we can observe a neg-ative contribution of the technology shock group in the 2001 slowdown. Looking atthe further decomposition we can attribute this mainly to the transitory technology
123
SERIEs (2010) 1:51–65 59
-10.0
-8.0
-6.0
-4.0
-2.0
0.0
2.0
4.0
6.0
1999 2000 2001 2002 2003 2004 2005 2006 2007 2008
Markups
Policy
International
Demand
Technology
Output Growth
Fig. 3 Structural interpretation of GDP growth in NAWM. Note: GDP growth, year-on-year % change, indeviation from mean. Last observation is 2009q2
-10.0
-8.0
-6.0
-4.0
-2.0
0.0
2.0
4.0
6.0
1999 2000 2001 2002 2003 2004 2005 2006 2007 2008
MarkupsPolicyFinancial Factors in Capital FormationBank FundingDemandTechnologyOutput Growth
Fig. 4 Structural Interpretation of GDP growth in CMR. Note: GDP growth, year-on-year % change, indeviation from mean. Last observation is 2009q2
shock which is related to the increased degree of labour hoarding in this episode. Thesubdued growth of real GDP over the period 2002–2005 is then largely explainedby negative demand shocks, notably domestic risk premium shocks, that entailed aprotracted slump in domestic spending. Since 2003 the overall contribution of theforeign shocks has been rather modest. This masks the fact that in 2003 the adverseimpact of external risk premium shocks (accounting for the marked appreciation of
123
60 SERIEs (2010) 1:51–65
the euro) was largely offset by the unwinding of the previous shocks to export pref-erences. In contrast, the favourable developments in euro area foreign demand duringthe 2004–2006 period have been largely compensated by the continued apprecia-tion of the euro and a renewed deterioration of foreign preferences for euro areaexports.
The CMR model suggests a different interpretation of the rapid slowdown of 2000–2001. It does not support the occurrence of adverse technological shocks and explainsthis episode in terms of negative financial factors associated with the stock marketcollapse. Financial shocks mainly capture the sudden re-appraisal of profit prospects,which led to the stock market collapse, which in turn aggravated the already weakbalance-sheet position of the corporate sector at the time. The associated rise in theriskiness of lending activity led to a sharp rise in the external finance premium. Thisprompted a cut in investment plans and a painful process aimed at repairing bal-ance sheets. According to the model, financial shocks exerted a progressively strongerdownward pull on output until the end of 2002 and then they started receding. Asof 2002, the poor economic performance is explained by the CMR also in terms ofunfavourable productivity shocks which exerted a downward pull on economic activ-ity and upward pressure on inflation. This countercyclical behaviour of productivityshocks had clear monetary policy implications, as it prevented inflation from quicklyreceding, notwithstanding the decline in resource utilisation caused by the economicslowdown.
Third, both models (although the CMR to a larger extent) find that monetary policywas instrumental in preventing the unfavourable forces that hit the euro area over theperiod from 2001 to 2006 from causing a more severe slowdown.
Fourth, both models find that the recovery initiated at the end of 2005 is differentin nature to the earlier recovery in 1999, and is mainly a demand driven phenomenon.
Turning to the recent recession and to the impact of the financial crisis on GDPgrowth the NAWM explains the downturn in terms of three mayor components. First,the financial turmoil led to an increase in perceived financial risks and higher riskpremia in terms of the spread between market interest rates and the rates controlledby the monetary authorities. The increased risk premium depressed domestic demandcomponents as captured in the red bars with diamonds. Second, the deterioration of thesupply side led to a downward revision of production capabilities as measured in thenegative contribution from the technology shock group. Third and most importantly,the global dimension of the crisis implied a substantial reduction in world trade anda corresponding plummeting of exports in the euro area. This effect is particularlyimportant because the reduction in world trade was accompanied by losses in marketshares owing to the high proportion of investment goods in euro area exports. Thenegative contribution of the monetary policy group includes the shock to the sim-ple, empirical monetary policy rule, but not the non-conventional monetary policymeasures installed in response to the crisis.
According to the CMR, the most important driver of the recent crisis can be traceddown to shocks emanating from financial intermediation (see yellow bars with hori-zontal lines), in particular the sudden re-appreciation of credit risk. The second mostimportant contribution to the recent free fall in real economic activity has been thesharp drop in domestic and international demand (see red bars with diamonds). In
123
SERIEs (2010) 1:51–65 61
Table 1 Counterfactual scenario
2005 2006 2007
NAWM
Inflation 0 30 52
GDP growth 3 20 11
CMR
Inflation 0 17 34
GDP growth 2 16 8
Average difference between counterfactual outcome and historical data over a given year. Inflation is mea-sured in terms of the GDP deflator, and expressed in year-on-year terms. GDP growth is in quarter-on-quartertermsDifference with respect to historical data (in basis points)
addition, according to the model, the situation has been aggravated by the deteriora-tion of the supply side of the economy (see blue bars with vertical lines). The onlypositive support to the economy has come from the exceptional compression of mark-ups, and from monetary policy (see light blue bars with diagonal lines) associated withthe unprecedented slashing of policy rates.
3.3 A policy counterfactual
As an example for a policy counterfactual, we assess the macroeconomic impact ofdelaying the policy tightening cycle that started in 2005. At that time the policy rate wasmaintained constant at 2% since 2001, due to protracted weak economic activity andsubdued inflation. On the basis of its assessment of the inflation outlook, in December2005 the ECB decided to start removing policy accommodation with a series of inter-est rate hikes. This decision was criticised at the time by several commentators andpoliticians on the basis that it started too early and the tightening cycle should havebeen postponed by a few quarters. The models can be used to answer the question,what would have happened to economic activity and inflation if the interest-rate cyclewas delayed by, say, two quarters?
As shown in Table 1, delaying the interest rate cycle would have shifted inflationupward significantly, reaching the peak effect almost 2 years later. In 2007 actual infla-tion turned out to be 2.4%, considerably above the ECB definition of price stability ofclose but below 2%. Had the ECB delayed its tightening cycle, in 2007 inflation wouldhave been 34 basis points higher according to the counterfactual simulation carriedout with the CMR model, and 52 basis points higher according to the NAWM. Table 1shows that the impact on economic activity arising from delaying the tightening cyclewould have been felt especially in 2006, with GDP growth higher by 16 basis pointsaccording to the CMR and 20 basis points higher according to the NAWM.
4 Recent criticism of the DSGE approach
The introduction of Bayesian DSGE models in policy institutions has also been accom-panied by increasing criticism of some of the elements and assumptions underlyingthis approach. In this section, we briefly address three of those criticisms.
123
62 SERIEs (2010) 1:51–65
First, it has been argued that both econometrically and economically some of theshocks and frictions in common DSGE models are not well identified. The most force-ful illustration of these identification problems in standard New Keynesian models hasbeen provided by Canova and Sala (2009). These authors and Canova (this issue) showthat the likelihood function often shows little curvature in key parameters of the model.Moreover, because of the highly non-linear nature, it is not always obvious where theidentification problems lie, making correct inference difficult. Clearly, acknowledgingthese identification problems must be an important element of any empirical analysis.However, as argued above, the Bayesian approach allows using prior information toaddress some of these identification problems. For example, Mackowiak and Smets(2009) discuss how the wealth of new micro information on price setting can be usedin the specification and estimation of macro models. Clearly, there is never an unam-biguous, one-to-one mapping between micro features such as the frequency of pricechanges and the simplified structural macro model. However, confronting micro infor-mation with its macro-implications is a useful and informative exercise which can helpreduce identification problems. It can also point to deficiencies in the specification ofthe model. Similarly, as shown above it is standard practice to calibrate some of the keyparameters by using, for example, information on the great macro-economic ratios.The analysis of Canova and Sala (2009) does highlight that it is important to check theinformativeness of the data by comparing the prior distribution with the posterior dis-tribution. One of the criticisms of Chari et al. (2008) of the Smets and Wouters (2007)model is that the economic interpretation of some of the shocks is not clear. For exam-ple, the so-called wage mark-up shocks affecting the labour supply equation couldbe due to a variety of factors such as shifts in labour supply coming from changingpreferences or participation rates, shifts in the bargaining power of unions or changingtaxes. The welfare and policy implications of these different sources of wage mark-upvariations can be quite different. Also in this case, using additional information mayhelp solving this identification problem. For example, Gali (2009) shows that simplyadding the unemployment rate to the observable variables may allow distinguishingbetween the first two sources of mark-up fluctuations.
Second, the assumption of rational (or model-consistent) expectations and perfectinformation, which underlies most of the DSGE models, is obviously an extremeassumption. As argued above, it is a useful and consistent benchmark, in particularwhen analysing the steady-state effects of changes in the policy regime. By bringingout expectations explicitly, their impact can be discussed directly. At the same time, itis unreasonable to assume that in an uncertain world and taking into account that themodel is an abstraction of reality agents use the model to form their expectations ina model-consistent way. A number of avenues have been pursued to include learningand imperfect information in DSGE models. First, it is fair to say that addressing infor-mation problems at the micro level and analysing its implications for the aggregatemacro economy is still at an early stage and is only feasible in small highly stylisedmodels. Second, a number of authors have introduced learning about shocks in themodel. This will typically help explaining some of the persistence in the responseof the economy to shocks. For example, Collard et al. (2009) show that models withsuch signal extraction problems better fit the data. Third, an alternative is to endow theagents with forecasting regressions that are regularly updated. Milani (2006, 2008)
123
SERIEs (2010) 1:51–65 63
and Slobodyan and Wouters (2009) find that DSGE models with learning mechanismsof this sort fit the macro-economic variables better than rational-expectations modelsand can also explain some of the time variation in the estimated persistence of inflationand variances.
A third criticism has become loud and clear since the outbreak of the financial crisis.Most DSGE models do not explicitly model a financial intermediation sector and relyon perfect arbitrage equations to model asset prices. As a result, there is only a lim-ited role for financial phenomena such as agency problems arising from asymmetricinformation giving rise to debt constraints and the possibility of default. As discussedabove, one of the models used at the ECB, the CMR model, does have an explicit bank-ing sector and includes an agency problem with respect to the financing of investmentby firms. As in most other DSGE models, the banking sector itself is, however, notsubject to asymmetric information problems and costly financing constraints. As oneof the major propagation mechanisms of the current financial crisis has been tensionsin the interbank market, it is not surprising that a lot of current research focuses onmodelling a more explicit banking sector. Recent examples are Gertler and Karadi(2009), Christensen and Dib (2009) and Gerali et al. (2009). It remains to be seenwhether such extensions can capture the slow build-up of financial imbalances andassociated credit and asset price booms that we have witnessed over the past decadeand the sudden collapse in 2007 and 2008. Moving away from models that are linear-ised around a steady state is likely to be one condition for capturing such non-linearphenomena. Another feature that is often missing from DSGE models used in policyinstitutions is a well-developed housing market. Historical experience, as well as thecurrent crisis, has highlighted the important role that overextended real estate marketsplay in many financial crisis. The work by Iacoviello (2004), which itself is based onKiyotaki and Moore (1997) is one way of introducing financial frictions in real estatefinance.
5 Conclusion
Bayesian DSGE models have become a useful tool in forecasting and policy analysis.They complement the many other tools such as BVARs, dynamic factor models, partialequilibrium models, small-scale indicator models that are frequently used in policyinstitutions. As these models are regularly used, there is a tendency to extend them toaddress more and more questions. This raises the issue of their optimal size. A singlelarge model provides a common language that provides a benchmark for discussionamongst various economists. However, a large model may also be more difficult tounderstand and to handle and it may lack robustness. A suite of models on the otherhand ensures robustness and flexibility in addressing the multitude of questions thattypically come up in actual policy discussions. One of the practical challenges is tofind a fine balance between those two approaches.
In this paper, we have compared the two main estimated DSGE models for the euroarea used at the ECB: the NAWM and the CMR model. From a qualitative point ofview, there is a broad agreement on the predictions they make, although, in quantitativeterms, there are some differences. However, the perspectives provided by the two mod-
123
64 SERIEs (2010) 1:51–65
els are often complementary, rather than conflicting. The role played by money, creditand, in general, financial factors in CMR complements the international dimensionand the role of the exchange rate in the NAWM. This analysis shows the usefulness ofcarrying out policy exercises with alternative models in order to assess the robustnessof the results.
Open Access This article is distributed under the terms of the Creative Commons Attribution Noncom-mercial License which permits any noncommercial use, distribution, and reproduction in any medium,provided the original author(s) and source are credited.
References
Bernanke B, Gertler M, Gilchrist S (1999) The financial accelerator in a quantitative business cycleframework. In: Taylor JB, Woodford M (eds) Handbook of macroeconomics. Elsevier Science,North-Holland, Amsterdam, New York, pp 1341–1393
Canova F, Sala L (2009) Back to square one: identification issues in DSGE models. J Monetary Econ56(4):431–449
Chari VV, Christiano LJ, Eichenbaum M (1995) Inside money, outside money and short term interest rates.J Money Credit Banking 27:1354–1386
Chari VV, Kehoe P, McGrattan E (2008) New Keynesian models: not yet useful for policy analysis. NBERWorking Paper 14313
Christensen I, Dib A (2009) Monetary policy in and estimated DSGE model with a financial accelerator.Working Paper 06-9, Bank of Canada
Christiano LJ, Eichenbaum M, Evans C (2005) Nominal rigidities and the dynamic effects of a shock tomonetary policy. J Political Econ 113:1–45
Christiano LJ, Motto R, Rostagno M (2003) The great depression and the Friedman–Schwartz hypothesis.J Money Credit Banking 35(6, pt. 2):1119–1198
Christiano LJ, Motto R, Rostagno M (2007) Shocks, structures or policies? The Euro Area and the US After2001. J Econ Dyn Control 32(8):2476–2506
Christoffel K, Coenen G, Warne A (2008) The new area-wide Model of the Euro Area: a micro-foundedopen-economy model for forecasting and policy analysis. ECB Working Paper 944
Collard F, Dellas H, Smets F (2009) Imperfect information and the business cycle. mimeo, Universityof Bern
Dieppe A, Pandiella AG, Willman A (2009) An estimated multi-country model simulated under rationalexpectations. ECB mimeo
Gali J (2009) The return of the Wage Phillips Curve. Working Paper, June 2009, CREIGerali A, Neri S, Sessa L, Signoretti F (2009) Credit and banking in a DSGE model of the Euro Area.
Mimeo, Banca d’ItaliaGertler M, Karadi P (2009) A model of unconventional monetary policy. MimeoGomes S, Jacquinot P, Pissani M (2009) EAGLE: a model for policy analysis of macroeconomic interde-
pendence in the Euro Area, mimeoIacoviello M (2004) House prices, borrowing constraints and monetary policy. Am Econ RevJacquinot P, Straub R (2008) Globalization and the euro area, simulation based analysis using the new area
wide model. ECB Working paper 907Kiyotaki N, Moore J (1997) Credit cycles. J Political Econ 105:211–248Mackowiak B, Smets F (2009) Implications of micro price data for macro-economic models. In: Fuhrer J
(ed) Understanding inflation and the implications for monetary policy: a Phillips curve retrospective,Conference held by the Federal Bank of Boston. MIT Press, Cambridge (in press)
McAdam P, Lombardo G (2009) Financial market frictions in a small open economy for the euro area,mimeo
Milani F (2006) A Bayesian DSGE model with infinite-horizon learning: do “mechanical” sources ofpersistence become superfluous? Int J Central Banking 2(3):87–106
Milani F (2008) Learning, monetary policy rules, and macroeconomic stability. J Econ Dyn Control32(10):3148–3165
123
SERIEs (2010) 1:51–65 65
Slobodyan S, Wouters R (2009) Estimating a medium-scale DSGE model with expectations based on smallforecasting models, mimeo, National Bank of Belgium
Smets F, Wouters R (2003) An estimated dynamic stochastic general equilibrium model of the euro area.J Eur Econ Assoc 1(5):1123–1175
Smets F, Wouters R (2004) Forecasting with a Bayesian DSGE model: an application to the euro area.J Common Mark Stud 42(4):841–867
Smets F, Wouters R (2005) Bayesian new neoclassical synthesis models: modern tools for central banks.J Eur Econ Assoc 3(2–3):422–433
Smets F, Wouters R (2007) Shocks and frictions in US business cycles: a Bayesian DSGE approach. AmEcon Rev 97(3):586–606