1. AREA AND POPULATION 1.1 AREA, POPULATION, LITERATES, SC’S, ST’S – SEXWISE BY BLOCKS AND
MUNICIPALITIES
Sl.
No
Name of the
Blocks/ Municipalities
Are
a (
sq
.km
)
Population
Literates
Pers
on
s
Ma
le
Fe
ma
le
Pers
on
s
Ma
le
Fe
ma
le
(1) (2) (3) (4) (5) (6) (7) (8) (9)
Municipalities
1. Vellore 10.54 185803 91342 94461 143342 74338 69004
2. Arcot 7.51 55955 27782 28173 44382 23254 21128
3. Ranipet 8.19 50764 24278 26486 41117 20489 20628
4. Walajah 2.66 47498 23422 24076 35991 18882 17109
5. Arakkonam 9.06 78395 38810 39585 64133 33235 30898
6. Gudiyatham 4.79 91558 45135 46423 70921 37073 33848
7. Ambur 18.76 114608 56382 58226 87198 44847 42351
8. Vaniyambadi 8.98 95061 46992 48069 70696 36501 34195
9. Thirupattur 4.65 64125 31903 32222 48874 25546 23328
10. Pernambut 7.61 51271 25285 25986 35344 18634 16710
11. Dharapadavedu 14.24 38833 19063 19770 31835 16320 15515
12. Melvisharam 16.06 44786 22655 22131 32797 17709 15088
13. Sathuvachari 16.06 56951 28207 28744 46186 23863 22323
14. Jolarpet 13.06 29662 14596 15066 22079 11838 10241
Blocks
1 Vellore 121.25 407101 200609 206492 311021 162345 148676
2 Kaniyambadi 136.39 125666 62144 63522 93140 50176 42964
3 Anaicut 546.93 163343 81166 82177 107318 59149 48169
4 Gudiyattam 330.53 293813 146066 147747 209262 112924 96338
5 Pernambut 559.90 249951 123287 126664 167813 89664 78149
6 K.V.Kuppam 226.53 128679 63772 64907 90485 49412 41073
7 Katpadi 206.37 214673 108193 106480 164881 88950 75931
8 Wallajah 225.54 249080 122986 126094 186175 99086 87089
9 Sholingur 284.26 150802 75400 75402 104945 58268 46677
10 Arcot 260.32 206051 102515 103536 150764 81365 69399
11 Thimiri 352.33 139884 69819 70065 94583 52873 41710
12 Arakkonam 188.44 172570 86378 86192 130364 70360 60004
13 Nemili 298.30 153586 76496 77090 102546 57267 45279
14 Kaveripakkam 355.13 177870 89031 88839 117555 66380 51175
15 Tirupattur 373.92 202758 102374 100384 139497 76321 63176
16 Kandili 287.44 146890 74897 71993 95790 54144 41646
17 Natrampalli 229.36 92241 46433 45808 58749 32979 25770
18 Jolarpet 291.26 200722 101004 99718 131832 73520 58312
19 Alangayam 430.34 236158 118219 117939 155348 84000 71348
20 Madhanur 215.64 224493 110899 113594 161860 85172 76688
District Total 5920.18 3936331 1961688 1974643 2773928 1504355 1269573
Source: Census of India 2011
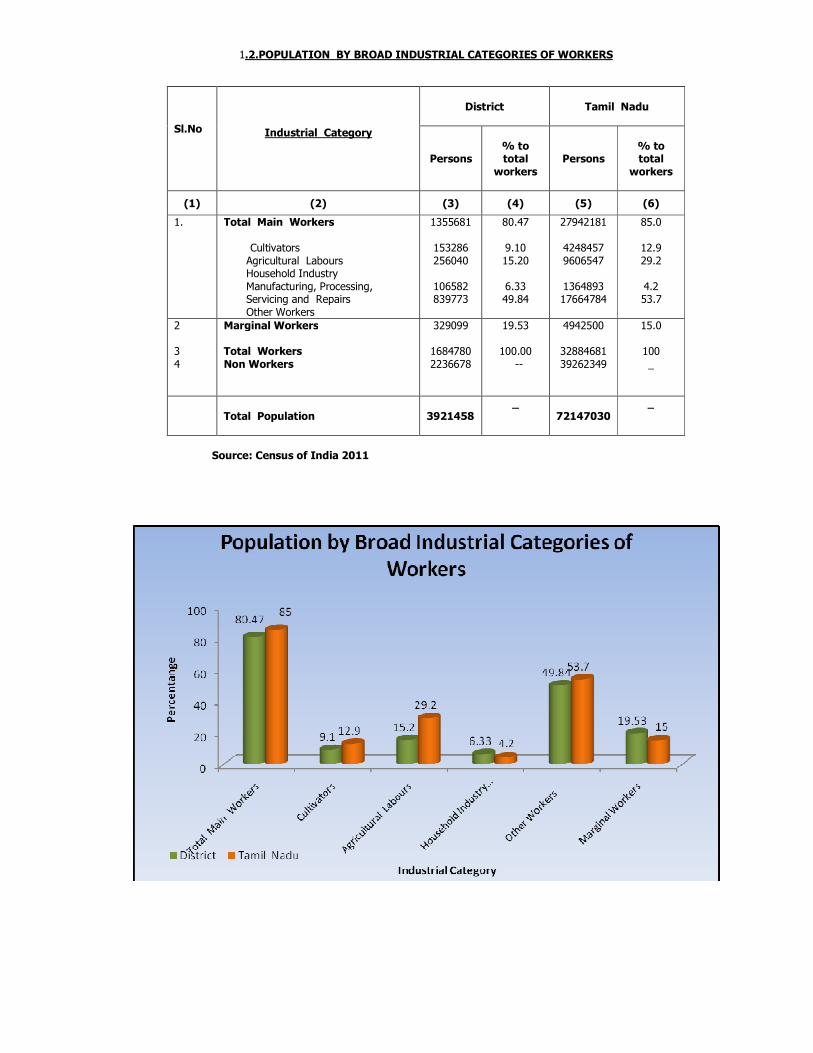
1.2.POPULATION BY BROAD INDUSTRIAL CATEGORIES OF WORKERS
Sl.No
Industrial Category
District
Tamil Nadu
Persons
% to total
workers
Persons
% to total
workers
(1) (2) (3) (4) (5) (6)
1. Total Main Workers Cultivators
Agricultural Labours Household Industry Manufacturing, Processing, Servicing and Repairs Other Workers
1355681
153286 256040
106582 839773
80.47
9.10 15.20
6.33 49.84
27942181
4248457 9606547
1364893 17664784
85.0
12.9 29.2
4.2
53.7
2 3 4
Marginal Workers Total Workers Non Workers
329099
1684780 2236678
19.53
100.00 --
4942500
32884681 39262349
15.0
100 _
Total Population
3921458
_ 72147030
_
Source: Census of India 2011
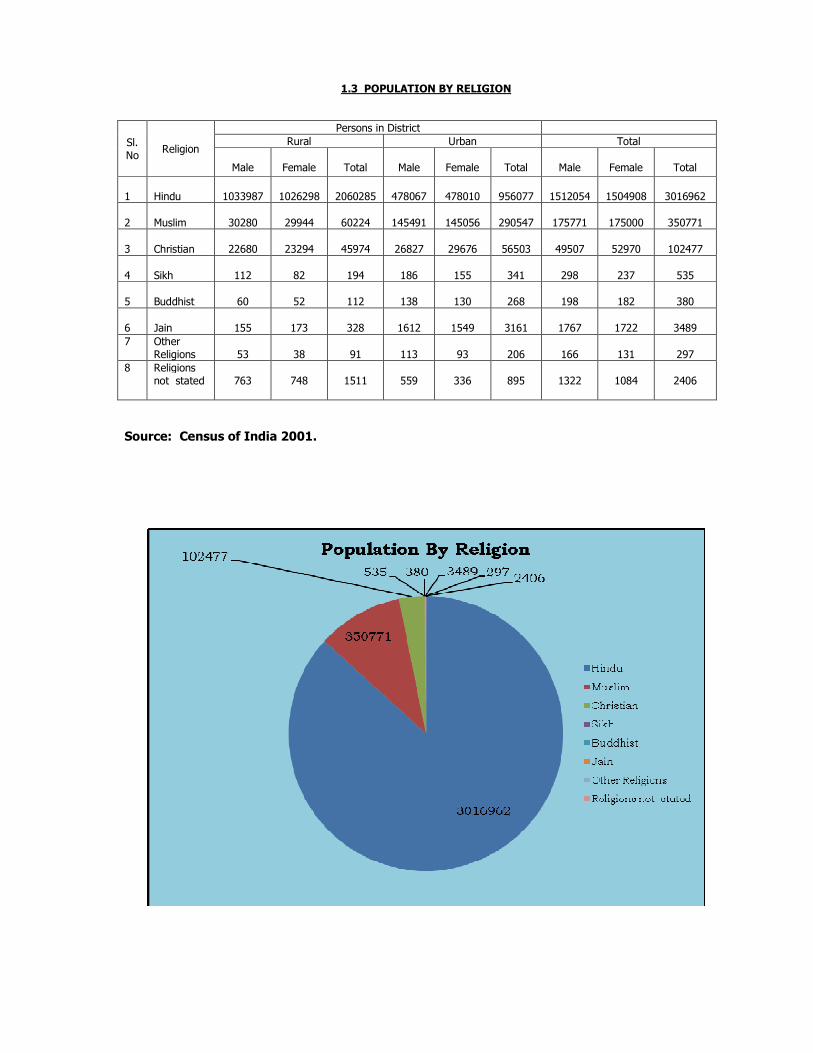
1.3 POPULATION BY RELIGION
Sl. No
Religion
Persons in District
Rural Urban Total
Male
Female
Total
Male
Female
Total
Male
Female
Total
1
Hindu
1033987
1026298
2060285
478067
478010
956077
1512054
1504908
3016962
2
Muslim
30280
29944
60224
145491
145056
290547
175771
175000
350771
3
Christian
22680
23294
45974
26827
29676
56503
49507
52970
102477
4
Sikh
112
82
194
186
155
341
298
237
535
5
Buddhist
60
52
112
138
130
268
198
182
380
6
Jain
155
173
328
1612
1549
3161
1767
1722
3489
7 Other Religions
53
38
91
113
93
206
166
131
297
8 Religions not stated
763
748
1511
559
336
895
1322
1084
2406
Source: Census of India 2001.
1.4 POPULATION BY AGE GROUPS
Sl.No Age Groups Persons in
Districts(in’00’)
Persons in Tamil
Nadu(in ‘00’)
Percent to total in
District Tamil Nadu
(1) (2) (3) (4) (5) (6)
1. 0-14
NOT AVAILABLE
2. 15-29
3. 30-44
4. 45-59
5. 60 and above
Total
Source: Census of India 2011.
1.5 POPULATION OF THE DISTRICT DECENNIAL GROWTH
Period (Subject to the
period of availability)
[2001]
Region
Population
[ 2011 Census]
Percentage Variation Since previous Census
(1) (2) (3) (4)
3477317 Total 3936331 13.20
2169319 Rural 2234344 3.00
1307998 Urban 1701987 30.12
Source: Census of India 2011.
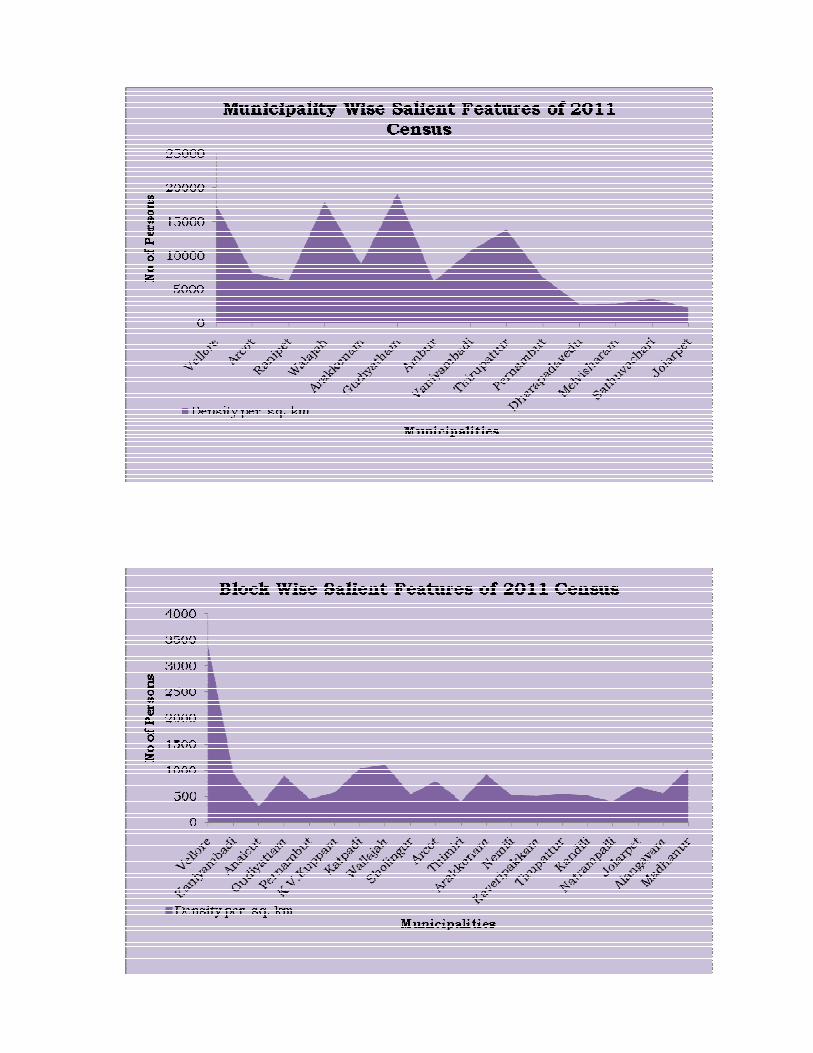
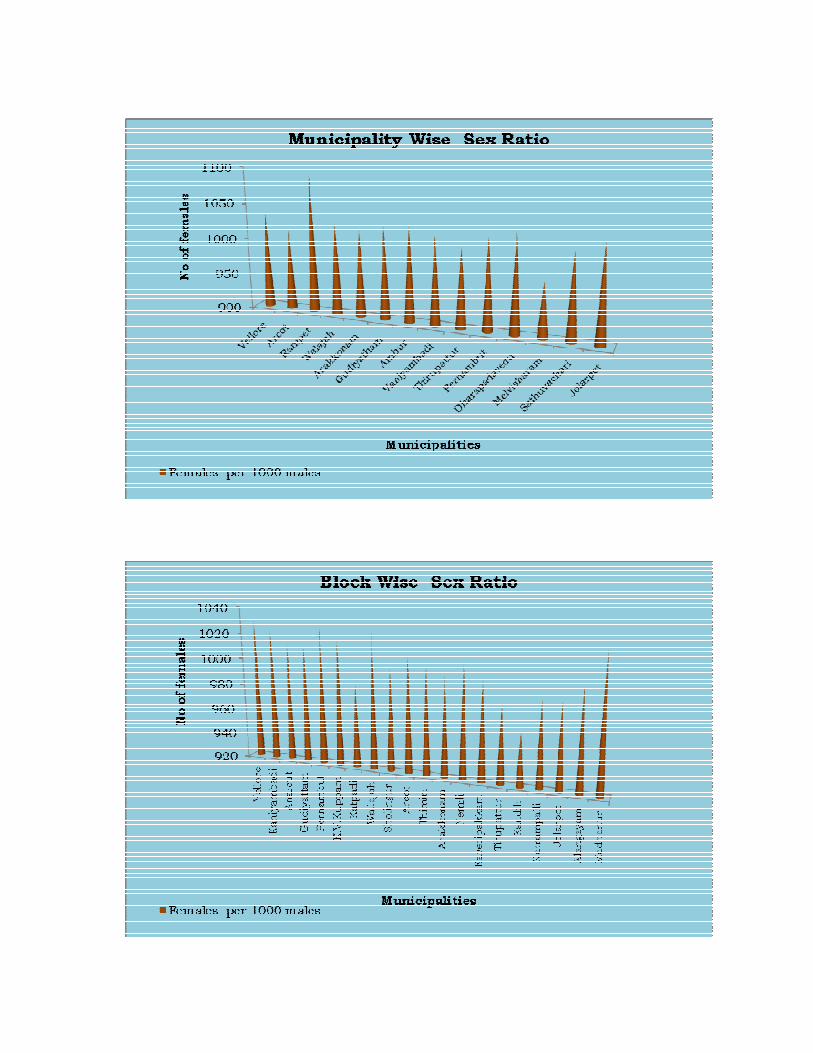
1.6 SALIENT FEATURES 0F 2011 CENSUS -- BLOCK AND MUNICIPALITY WISE
Sl. No
Name of the Block/Municipality
Density per sq. km
Females per 1000 males
Increase in Population since 2001
in %
Urban/Rural Population
in %
Municipalities
1. Vellore 17628.37 1034.146 4.84 45.64
2. Arcot 7450.732 1014.074 12.02 27.44
3. Ranipet 6198.291 1090.947 7.45 20.38
4. Walajah 17856.39 1027.922 61.15 19.07
5. Arakkonam 8652.87 1019.969 -0.37 45.10
6. Gudiyatham 19114.41 1028.537 0.12 33.42
7. Ambur 6109.168 1032.705 15.04 51.05
8. Vaniyambadi 10585.86 1022.919 10.86 40.25
9. Thirupattur 13790.32 1009.999 5.34 31.63
10. Pernambut 6737.319 1027.724 N.A 20.51
11. Dharapadavedu 2727.037 1037.088
N.A. 18.09
12. Melvisharam 2788.667 976.8704
N.A. 21.96
13. Sathuvachari 3546.139 1019.038
N.A. 13.99
14. Jolarpet 2271.21 1032.201
N.A. 14.78
Blocks
1 Vellore 3357.53 1029.33 12.84 84.96/15.04
2 Kaniyambadi 921.37 1022.17 13.53 44.54/55.46
3 Anaicut 298.65 1012.46 12.67 24.34/75.66
4 Gudiyattam 888.91 1011.51 9.18 47.37/52.63
5 Pernambut 446.42 1027.39 17.02 36.93/63.07
6 K.V.Kuppam 568.04 1017.80 8.40 4.13/95.86
7 Katpadi 1040.23 984.17 28.36 64.12/35.88
8 Wallajah 1104.37 1025.27 17.36 62.44/37.56
9 Sholingur 530.51 1000.03 12.04 20.46/79.54
10 Arcot 791.53 1009.96 13.96 53.35/46.65
11 Thimiri 397.03 1003.52 8.10 24.02/75.98
12 Arakkonam 915.78 997.85 9.90 57.59/42.41
13 Nemili 514.87 1007.77 9.19 17.53/82.47
14 Kaveripakkam 500.86 997.84 12.72 15.07/84.93
15 Tirupattur 542.25 980.56 2.73 31.63/68.37
16 Kandili 511.03 961.23 12.41 10.00/90.00
17 Natrampalli 402.17 986.54 -2.18 11.26/88.74
18 Jolarpet 689.15 987.27 18.54 25.76/74.24
19 Alangayam 548.77 997.63 13.56 57.82/42.18
20 Madhanur 1041.05 1024.30 15.94 51.05/48.95
664.90 1006.60 12.77 42.90/57.10
Source: Census of India 2011
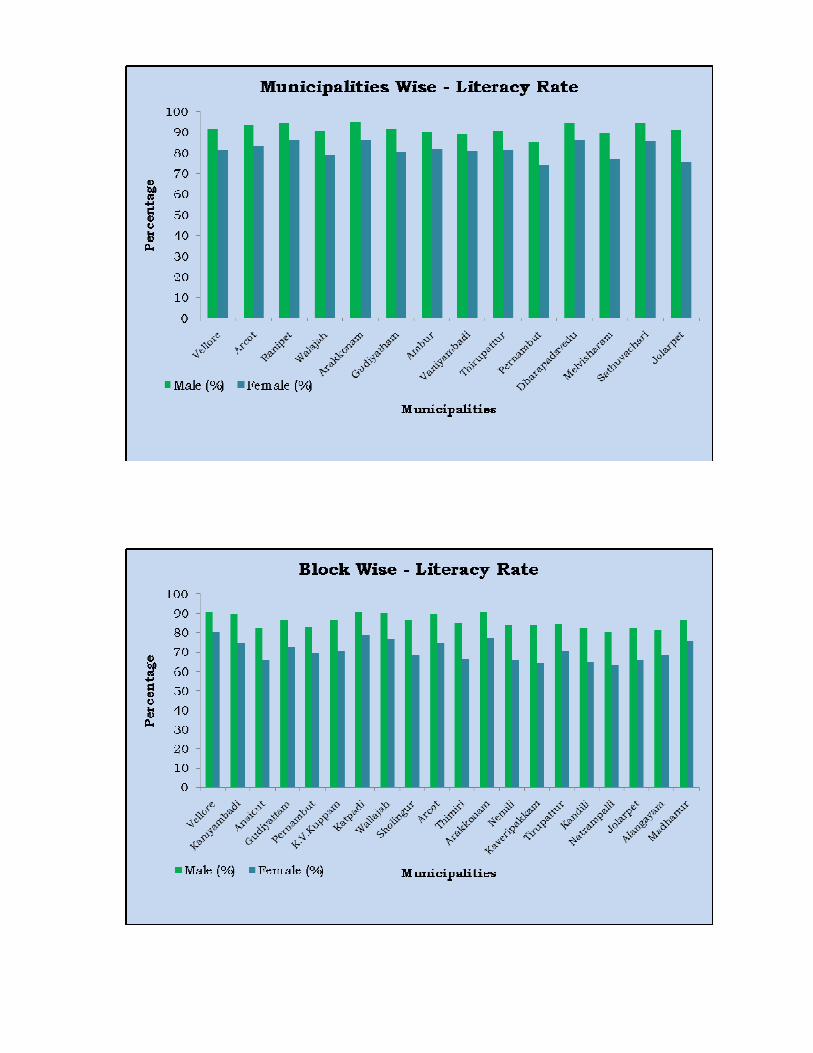
1.6 SALIENT FEATURES 0F 2011 CENSUS -- BLOCK AND MUNICIPALITY WISE
Sl. No
Name of the Block/Municipality
Literacy rate among
S.C. Population in %
S.T. Population in %
Male (%) Female (%)
Municipalities
1. Vellore 91.49 81.51 14.16 0.18
2. Arcot 93.69 83.33 10.31 0.15
3. Ranipet 94.36 86.22 34.30 0.04
4. Walajah 90.59 78.79 14.79 0.21
5. Arakkonam 95.46 86.18 27.10 1.11
6. Gudiyatham 91.77 80.81 16.80 0.10
7. Ambur 90.30 81.91 16.83 0.57
8. Vaniyambadi 89.31 81.07 15.15 0.09
9. Thirupattur 90.63 81.33 18.33 0.43
10. Pernambut 85.35 74.03 23.57 0.02
11. Dharapadavedu 94.42 86.15 13.70 0.18
12. Melvisharam 89.53 77.39 8.99 0.03
13. Sathuvachari 94.10 85.61 10.07 0.14
14. Jolarpet 91.12 75.73 17.89 1.79
Blocks
1 Vellore 90.86 80.21 17.46 0.46
2 Kaniyambadi 90.03 74.89 17.67 0.91
3 Anaicut 82.51 65.80 23.37 7.85
4 Gudiyattam 86.79 72.52 24.16 0.49
5 Pernambut 83.06 69.76 34.59 1.01
6 K.V.Kuppam 86.76 70.35 27.11 0.58
7 Katpadi 91.06 78.78 15.68 0.77
8 Wallajah 90.55 76.85 19.90 0.35
9 Sholingur 86.89 68.97 16.85 0.77
10 Arcot 89.56 75.04 17.11 0.32
11 Thimiri 84.94 66.31 27.06 1.08
12 Arakkonam 91.02 77.33 28.32 1.68
13 Nemili 84.30 65.65 28.89 1.46
14 Kaveripakkam 84.19 64.61 28.43 1.48
15 Tirupattur 84.67 70.76 24.28 1.04
16 Kandili 82.21 65.25 17.54 2.50
17 Natrampalli 80.42 63.21 15.89 0.19
18 Jolarpet 82.58 65.80 12.39 2.43
19 Alangayam 81.66 68.83 16.14 9.85
20 Madhanur 86.90 75.76 25.93 2.10
Source: Census of India 2011


![]P]o] Xµ]v ÇX X] ]P]o] Xµ]v ÇX X] ]P]o] Xµ]v ÇX X] ]P]o ...digilib.uinsby.ac.id/25285/1/M. Ali Subki_B01205044.pdf · dalam rangka penyelamatan seluruh alam, termasuk di dalamnya](https://static.documents.pub/doc/80x56/60d2c65c4a62d608d47506d3/po-xv-x-x-po-xv-x-x-po-xv-x-x-po-ali-subkib01205044pdf.jpg)


