DISCLAIMERPortions of this document may be illegible in electronic image products. Images are produced from the best available original document
CONTENTS
Page
Purpose and Background 3
Conclusions and Summary 5
Main Data About the Factory 7
Production of the Factory 8
Employees and Shifts 11
The Measurements 13
Electricity Supply of the Factory 13
Heat Supply 15
Water Supply and Sewage System 16
Mapping of Electricity Consumption 17
Total Consumption of Electricity 17
Electricity Consumption for CompressedAir Supply 25
Electricity Consumption for Ventilation 26
Electricity Consumption for Lighting 27
Compressed Air System 28
Change of Compressor VK-30 28
The Losses of Compressed Air 29
Electricity Consumption for Lighting 33
Ventilation 37
Energy Saving in Heat Supply System 43
Offer for Energy Saving Introduction 45
Appendix 46
-2-
Purpose and Background
This report is part of the Joint Latvian-Danish Project Demand Side Management and Energy Saving. The Joint project is a part of the Denmark and technology transfer to Latvia. It is the result of collaborative efforts between Latvian team, consisting of the specialists from LATVENERGO and Danish team, which was represented by Danish Power Consult company.
Joint DSM and energy saving project, which started in 1994 was divided into four phases.
Phase 1: Seminar and preliminary audits carried out by Danish and Latvian specialists in several companies.
Phase 2 : Latvian team training courses, organised by Danish Power Consult during two weeks in Copenhagen from 30 May till 11 June 1994.
During the phase 3 the team from LATVENERGO associated Emils Darzins, Janis Slisans, Alvis Ozolins, Juris Paberzs and llgvars Cimoska - carried out energy saving pilot project in the Sock factory "Aurora". Energy audit in the sock factory "Aurora" was performed during 6 months in 1995. LATVENERGO team had contacts with DPC specialists - Mr.Johom Moltke and Peter T.Mortensen and discussed various aspects of demand Side Management, energy audit and energy saving in Latvia.
Authors express great gratitude to above mentioned colleagues and to Danish specialists from DPC, NESA, SEAS and from other institutions with whom they worked during training courses in Denmark.
During the energy audit and performance of the pilot project the following equipment, supplied by Danish side, was available by the team:- Laptop personal computer Olivetti,- program packages LMS Comand KWFLOW",- 4 traffic computers TACOM with infrared ray heads for reading results from Ferrari energy meters,- 4 metering boxes with Ferrari meters, TACOMs and current clamps.
The ultrasonic leakage detector which is available by LATVENERGO team was used short time.
The purpose if this pilot project was not only to carry out energy audit in the sock factory "Aurora" and propose Demand Side Management and Energy saving measures.
Another task of the project was the application of DPC energy audit methods, measuring equipment and software in Latvian conditions and the promotion of energy saving programs in Latvia in this way. For this reason great attention is
- 3 •
paid to energy mapping in order to demonstrate possibilities of the Danish methods.
Phases 1 and 2 of the joint project and activities of DRC experts, including the supply of the equipment, was financed by the Danish government. All activities in energy auditing and the pilot project were performed by LATVENERGO team without any payment, i.e. in the form of additional scientific work.
-4-
Conclusions and Summary
The present report describes four proposals for electricity and compressed air savings in the factory "Aurora". The main figures for the proposals are given in the table No.1. If all proposals are effected electricity savings will be 3,3 million kWh/year amounting to 40,7% of the factories consumption in 1994.
The biggest electricity and fuel savings will be achieved in proposal for changes in compressed air and lightning systems and fuel burner exchange.
All calculations performed are based on the data of energy audit which was carried out in May and June 1995.
-5-
Synopsis of Recommended Energy Saving Proposals
N° ProposalsTotal
kWh/year
savings
Ls\
%from total
consumption
Investment
Ls
Paybackperiod(year)
1 Reconstruction of 230400,0 58521 2,8 4160,00 0,81ventilation system /
2 Looses of electricity 38844,0 986)6 0,48in lighting system \
3 Replacing of existing 1242675,2 31563^5 15,2 51446,3a 1,58luminary's diffusers ' \by X-tralux reflectorsin the shops
4 Compressed air 939161,6 23600V 11,5system leakage'sreduction from 40%to 7%
5 Change of the 856960,0 217665& 10,5 7012,90 1,93compressor A
6 Reconstruction of the 1660000,0 121180,jo 82028/00 0,67boiler house 1
Table 1
* 6 -
Main Data About the Factory
The sock factory "Aurora" is Latvian state factory which was founded in 1947 by uniting small producing units into one bigger enterprise.
The factory is located in the left side of Riga near river Daugava. Plant of the factory is shown in the figures:
1 Boiler house2 Production shop N°23 Production shop N°34 Production shop N°45 Compressors room6 Administrative building
Fig. 1 Plant of the Factory "Aurora*
-7-
Production of the Factory
When the factory was founded it was projected to produce 14 millions pairs of socks per year. During this period 400 different kinds of equipment was installed and 1070 people were employed. First output of production was at 1948 - 3,9 million pairs of sock products. During next years factory was developing continuously, new modern equipment was installed.
Nowadays "Aurora" is a big specialised enterprise - the only one in Latvia producing sock production. The production of factory is sent to shops of previous Soviet Union republics and also it is exported to other countries.
In 1992 factory produced 56,0 million pairs of stock products. It was 231000 pairs per day. The factory produces 90 different kinds of sock products. The total retail trade amount in 1991 (and in prices of 1991) was approximately 189,6 million roubles.
The factory produces women stockings and tights, knee-length socks, men socks, children socks and tights. The assortment is renewed every year by 25 to 30%. The quality is increasing.
The are installed approximately 2600 pcs of different technological equipment, among them 2123 pcs of round knighting automates. They are modem and of high productivity for knighting, sewing, reeling, painting and finishing operations machines produced in previous Soviet Union, Czechoslovakia, Italy, Japan, Germany and France. In the production shops of factory the following machinery is installed: 03DR, 03DS, 03D, Gamma, 2ANK, 2AN, Platirovka, Modik-4, R-850, Zodiak-Ultra, Fantazija, Assembler, POJS, Sabina, Beiby, D3BC, D3VUS, Motiv, DeraES, Verab, 10th class, Ange3B, Ange3C. The following sewing equipment is installed: Takitori-double, Spidomatic, oversewings from Remoldi, Textima, Horosso-lloraizen, Fletlok, Mauzer 20K and soviet 208 class. The following painting equipment is installed: KT-100, KB-50, Kolormat-800, Aksimat Raduga-125, Trikoset, UMOT, CNO-86, Elio and also centrifuge fan and steam tables.
There are 4 main production shops in the factory, where all main technological processes of productions takes place - knighting, sewing, finishing, sorting, packing. Assisting production shops and services are occupied in the fields of repair of technological equipment, provide with electric energy, steam and do all repairmen and construction works.
There is a wide consumption production shop in the factory where the rests of main production shop capron production is re-heated into different parts for needs of factory and other enterprises.
- 8 ■
Output
Fig. 2. Output of production (million pairs)
There is also a Computing centre in the factory, production shop of automatization and mechanisation, service of measurements, labour security and other structures.
For producing of sock production different raw materials are used - capron thread, textured thread, elastin, cotton, wool. The main suppliers of raw materials are factories of chemical fibre in Daugavpils, Chemigova, Kiev, Klin, Volzhsk and cotton production plant in Dedovka. Raw material from England, France, Italy , Japan and Egypt is also used.
The new technologies are involved - like one-process finishing, automatic thread chain cutting, the working in of poliuretan thread in the tights and sock edge, producing of ornamental socks without thermal process, automates for making boxes and plastic bags, pneumatic machine for sock turn round, etc..
-10 -
Employees and Shifts
The number of employees is decreasing during last 4 years: in 1992 worked 2399 employees, in 1994 worked 1643 employees, in May 1995 worked 1425 employees.
Factory is working 5 days during the week in two shifts. But sometimes some shops are working at weekends. In the first shifts are working 822 employees, but in the second shift are working 573 employees.
The measurements in factory "Aurora" were carried out during 3 months (from March to May 1995). The goal of these measurements were to measure load curves for the electricity consumption mapping. For this purpose are used portable metering boxes (with energy meter, Tacom and current clamps). Two metering boxes with current clamps are in disposition of the audit.
On 11 and 12 April on the air compressing unit was installed TACOM BOX.
From 30 April till 8 May 1995 the total income power consumption in substation was measured. From 8 June till 12 June 1995 in the substation No.. 3 the power consumption of dawning production shop lightening and air conditioning were measured.
Electricity Supply of the Factory
The electricity supply is provided from Riga Electrical Network through two cables of 10kW - F-98A and F-101. The capacity of 10/0,4kW transformers in factory is 8260 kVA, for transformer substation - 5.
The general electricity supply scheme is shown in the Fig. 3.
-13 -
I F-iOi
\
i F--Q& At
1000 kVa inoo &A iono *//!
Fij.3
dooo kVa 660 kVa /oook'/a
Electric power Sujojoly Scheme of the
1000 KVA CZOkVa iQQOUVA
Heat Supply
The heat for factory "Aurora" is provided by its own boiler house where 4 boilers are installed: 2 DKVR-6,5/13 and 2 DKVR-20/13, heating with - gas or fuel oil.
Boilers produce steam, which is used for technological needs, heating, hot water supply.
Boiler house provides with heat the near residential complex including also Stradinsh Clinical Hospital.
The amount of energy used for own need changes between 19% in 1991 to 58% in 1990.
Settling account with end users is done by reading measurements from energy meters, which is on balance limit.
Heating mains are old and heat losses are up to 25%.
Heat consumption on own needs
Fig. 4
-15-
Water Supply and Sewage System
In order to provide needs of factory in water the water for Riga city water pipeline and also factories artesian well (pump ECV-8-25-100). The productivity of pump is 25 m3/h, which covers 50% of all needs.
Drain water is channelled to Riga city sewage collector after 3 stages of staying.
Payments in 1994:water supply 12.500 Ls, sewage 30.000 Ls.
-16 -
Mapping of Electricity Consumption
Total Consumption of Electricity
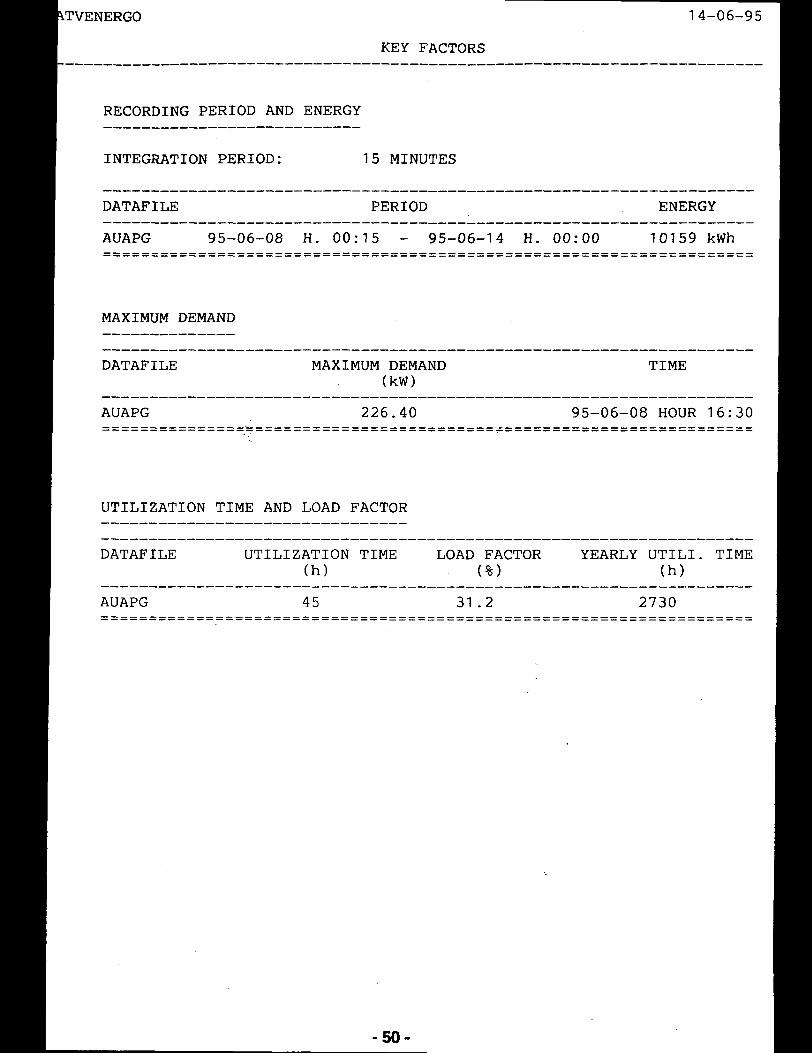
To determine the total electricity consumption in the factory "Aurora" there were installed TACOM measuring units on two main income kWh meters. Measurements were made during on working week where Monday was a holiday.
Factory works in two shifts and maximum of the load is from 10 to 12 o'clock, and it is 1984 kW. .
. .......
The average consumption during the working day in this period was 24,2 kWh:V____
The maximum load in the 2nd shift is from 16 to 17 o'clock and it is 1360 kW.
The load measurement were made on two incoming lines and it divided correspondingly as 69,1% and 30,9%.
Electricity consumption distribution
Fig. 5
-17-
LOAD CURVE950430 00:15 - 950509 00:00
ENERGY= 114S2kUh
IFILECS) : AURU+AUUU
Fig. 6
Total Load of the Factory
Note: Fig. 6 - 9 and tables 4,5 have coefficient = 10
-18 -
DURATION CURVE
ILE:
950430 - 9505091.0 = 198.4 kU
immmmiiH .... ................................
iiiimmimmmimii
I..limiiMHiimmmim
20 40
ummiiimitmiiiimm
Z AF TIME 80
ip/fyyigtyqigigii HMgigWr-vr-H
100AURU
+AUUU
Fig. 7
Total Load of the Factory
-19 -
TVENERGO 26-05-95ENERGY PER DAY
LE: AURU + AUUU
AVERAGE ENERGY PER DAYMONDAYS: TUESDAYS: WEDNESDAYS: THURSDAYS: FRIDAYS: SATURDAYS: SUNDAYS:WORKINGDAYS:
INTEGRATION PERIOD: 15 MINUTESDATAFILE SUB LOADS PART OF THE TOTAL CONSUMPTION
(%)AURU 69.1AUUU 30.9
Table 5
-24-
Electricity Consumption for Compressed Air Supply
One of the largest users of electricity is the compressed air supply system It consists fro 4 air compressing units with total power of 750 kW.
We can point out that the main fault is that automation is not working. The compressors are old one. The water cooling system is very irrational and water from city water supply was used. The re-circulation and secondary use of it is lacking.
In the project screw type compressors are recommended, so there will be no need in using water.
In the 1st shift one compressor is working with 250 kW power, in the 2nd shift often the compressor with 125 kW power is used.
The lack of automation do not allow to use measuring equipment to determine air losses in the system. Therefore the calculation method was used. . /
In practice according to the consumption of air, periodically the rest of it flow out through receiver.
The total daily electricity consumption is 3500 kWh.
The total electricity supply for ventilation was determined similar as for lighting system.
It was carried out for the 2nd producing shop ventilation system using TACOM BOX.
During the measurements irrational consumption of 15 kW was found out.
The maximum of load - 294 kW. The load in the 2nd shift was obviously lower because the technological equipment was not used completely.
Electricity Consumption for Ventilation
-26-
To carry out electricity consumption for lighting in the whole factory is very complicated. There are many objects and for many of them the electricity supply is connected with power supply.
For measurements we choose the 2nd producing shop which is the largest and works in two shifts.
TACOM BOX was used for measurements.
The results were used in estimation of energy saving because the lighting in this producing shop is from luminescent lamps and we know the amount of them.
In other cases the electricity consumption was calculated.
Electricity Consumption for Lighting
-27-
Compressed Air System
Change of Compressor VK-30
Compressed air system operates in working days 16 hours per day. It consists from 4 piston Russian compressors, 2 of them are type VK-20, which can produce compressed air 20 m3/min, but 2 other are type VK-30, which can produce compressed air 30 m3/min. Electrical load of VK-20 is 125,0 kW, but VK-30 - 250,OkW. The pressure of compressed air is 8,0 bar. Compressors are working without automatic control system. Normally is working one compressor type VK.30 and other VK-30 is as a reserve. Compressors type VK-20 worked in minimal regime of compressed air consumption.
So that present compressors are very old and they worked without automatic control systems it is very difficult to calculate efficiency of these compressors, approximately present efficiency of compressor type VK-30 may be 70% from original.
Load curve of compressor VK-30 is shown in the following figure.
Because compressors are antiquated, instead of compressor VK-30, factory installed new screw compressor type VLEA made in Germany. Main parameters for new compressor are:
pressure 8 barproducing of compressed air 20 m3/minelectrical load 132,0 kW
Average energy consumption for compressor VK-30 working time - two shifts or 16,0 hours or 1040000,0kWh/year. But energy consumption for cooling water system is 91520,0 kWh/year. Compressor VLEA have air cooling system. Price of compressor VLEA is 97390 DM. Energy consumption of compressor VLEA is 274560 kWh/year or 35060,4 Ls. Average price of one kWh in Latvia is
0,0215 x 18% = 0,0254 Ls.
Real income of reducing energy consumption in this year was:
Cost of mounting new compressor from data of factory approximat 7012,0 Ls.
Payback period is
35060,4 + 7012,0T = 1,93 years.
b 21766,78- 28 -
The Losses of Compressed Air
As compressor VK-30 works in both shifts without automatic regulation the not useful consumption is 50% from whole amount.
The consumption of energy of compressor without automatic regulation of it's work is:
A1 = 250,0 *260*16 = 1040000,0 kWh/year.
The consumption of energy per year for cooling systems is:
A2 = (7,0 + 15,0) *260* 16 = 91520,0 kWh/year.
The total consumption:
A = A, + A2 = 1040000,0 + 91520,0 = 1131520 kWh/year.
Decrease of energy consumption using automatic regulation is 50% from whole consumption of the year:
A = A* 0,5 = 1131520* 0,5 = 565760 kWh/year.
As compressor is working without automatics then the amount of energy used for compensation of losses for compressed air was determined by chronometer switching on compressor with hand while reaching working pressure.
Experiment longs for 1 hour. During this period compressor was switched on 6 times for 4 minutes each time and the losses of compressed air were compensated.
The total amount of energy for reducing air losses per year are:24
The consumption of energy for compensating compressed air losses is:
As in optimal regime compressed air losses are not lager than 7% , than irrationally used energy consumption for compressed air loss compensating is 33% which is 373401,6 kWh/year.
So useless consumption of energy in compressor department is:
565760,0 + 373401,6 = 939161,6 kWh/year
or
939161,6 • 0,0254 = 23600,7 Ls/year
-30
AVERAGE LOAD CURVE AND DEVIATION FOR ALL DAYS
01.0 = 110 kU
FILE(S):
Fig. 11
Compressed Air Compressor Average Load
-32-
The total lighting power for lighting in factory "Aurora" is 597,44 kW. It divides
Electricity Consumption for Lighting
1804 pcs of lightings 00-2x40, 1614 pcs of lightings 00-2x40, 662 pcs of lightings 00-2x40,
1694 pcs of lightings 00-2x80.
following:
1st production shop2nd production shop3rd production shop4th production shop
At present only 4th production shop is working normally, in other parts work is organised only partly.
Carrying out light measuring in production shops was stated that in average lighting divides as follows:
Lightingquota fact
1 st production shop 750 lx 900 lx2nd production shop 200 lx 200 lx3rd production shop 2000 lx 1950 lx4th production shop 750 lx 750 lx
As we see in table the lighting in general corresponds to quota, except the 3rd production shop, where the level of lighting is lower.
In order to save energy consumption for lightings 00-2x40 the X-Tralux type reflector are used. They increase the effectivity of light reflection for 50%. This allows to decrease the power of lightings using only one florescent lamp.
Reconstruction of lighting
Production before reconstr. after reconstruc tion Amount ofshop lamps lighting lamps lighting power working
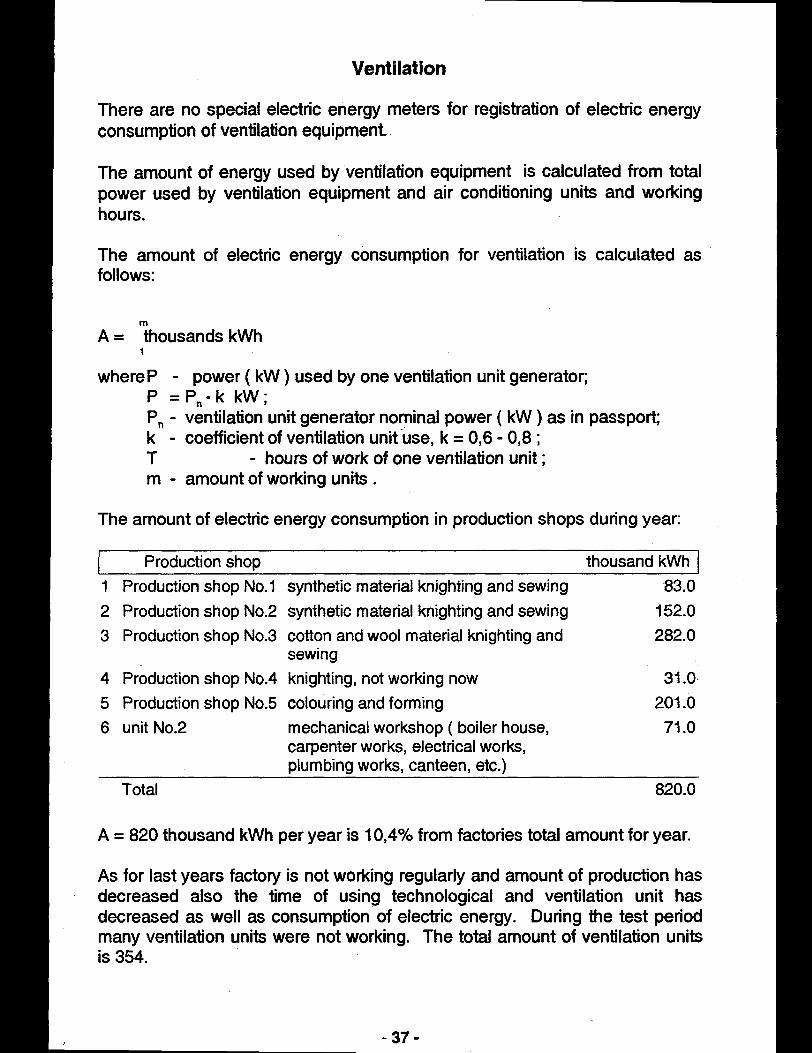
There are no special electric energy meters for registration of electric energy consumption of ventilation equipment
The amount of energy used by ventilation equipment is calculated from total power used by ventilation equipment and air conditioning units and working hours.
The amount of electric energy consumption for ventilation is calculated as follows:
A = thousands kWh1
where P - power ( kW) used by one ventilation unit generator;P = Pn • k kW;Pn - ventilation unit generator nominal power ( kW) as in passport; k - coefficient of ventilation unit use, k = 0,6 - 0,8 ;T - hours of work of one ventilation unit;m - amount of working units .
The amount of electric energy consumption in production shops during year:
Production shop thousand kWh1 Production shop No. 1 synthetic material knighting and sewing 83.02 Production shop No.2 synthetic material knighting and sewing 152.03 Production shop No.3 cotton and wool material knighting and 282.0
sewing4 Production shop No.4 knighting, not working now 31.05 Production shop No.5 colouring and forming 201.06 unit No.2 mechanical workshop (boiler house, 71.0
A = 820 thousand kWh per year is 10,4% from factories total amount for year.
As for last years factory is not working regularly and amount of production has decreased also the time of using technological and ventilation unit has decreased as well as consumption of electric energy. During the test period many ventilation units were not working. The total amount of ventilation units is 354.
-37-
In factory there is installed the exhaust ventilation for sucking out wet, heat, dust and gases produced during the technological processes as well as fresh air supply ventilation. For warmed air supply ventilators with heaters with hot water are used.
Exhaust ventilation is made as total pumping away from upper zones of rooms as well as local pumping away from working places.
Fresh air supply is realised mainly by using axial fans but also belt driven fan are used.
The power of fan generator are different - from 0,6 to 55 kW. There are many ventilators with power 40 and 45 kW.
The ventilation units have been designed for the maximal possible work of technological equipment. During this period in production shops all workplaces and machines are not used. Therefore the amount of harmful outputs has decreased. Some working units and production shops are working half-time or staying for long period. Therefore to Use the ventilation units with full capacity is not useful. After stabilisation of production there may be will be needed a reconstruction of ventilation equipment possibly decreasing the power consumption.
Now the exploitation of ventilation units has ineffective consumption of electric energy:1) air conditioning units are without automatic or it does not work,2) in production shops there are installed ventilation units with high generator power and they work even during the time when the greatest part of technological equipment and workers do not work,3) The dampers of not working technological equipment are not shut therefore there is additional power needed for generator,4) it will be useful to use multi-speed generators to change the speed depending of supplied air amount,5) sometimes lock out ventilation units during breaks and after shift,6) ventilation units with belts, have not all belts needed,7) some exhausting ventilation unit air ducts are damaged,8) air grills are not cleaned when needed ,9) during winter period when air curtain is working the doors of workrooms are not closed,10) there in no individual exhausting ventilation generator blocking with working machine,11) there are old type fans with low actual efficiency of using.
-38-
Changing the old fan to new one we can achieve the following economy of electric energy:
where Q - fan generator power m3/min h - pressure Pa
and - the actual efficiency of old and new fanand - the actual efficiency of generator and electrical net
Example:
Instead of old type of fan VRS with = 0,63 we use new type C4-70 with =0,86
In factory's boiler house DKVR boilers use ineffective burners with hand regulation GMG-4 and GMG-5,5.
In comparison we choose Finnish company's OILON burners which are available in Latvia.
Boilers DKVR-6,5 need burners GRP-201 and boilers DKVR-20 need burners GRP-700.
Heat supply is provided by 1 boiler - in winter - DKVR-20, in summer - DKVR-6,5. In calculation we take in account that only one set of burners is changed on the burners of each type. The fuel oil is used in these burners, but also the gas can be used.
In 1994 23056 Gkal of heat energy was produced using 5360 tons of fuel oil.
To compare the OILON burners and GMG burners we can look at heat production in 1990, when it was the highest - 74982 Gcal, the fuel oil consumption was 10116 t/year. When using OILON burners the consumption of fuel oil was 7722 t/year. It means that OILON burners are for 31% more effective. In 1994 if OILON burners used the fuel oil consumption could be 37001.
Economy -1660 t/year or 121180 Ls if fuel oil price is 73 Ls/t.
The expenses of this enterprise:1. project, installation, regulation 2500 Ls2. prices of burners 9524 x 2 = 19048 Ls (GRP-210)
26640 x 2 = 53280 Ls (GRP-700)3. additional expenses of exploitation
(heating of fuel oil before using in burner) 7200 Ls TOTAL 82028 Ls
Other expenses in both cases are the same.
82028Payback period =----------- = 0,67 year.
121180
In order to increase the savings in the heat supply system we offer the following activities:- one boiler DKVR-6,5 use in water regime which allows to increase its actual efficiency,
-43-
- to change the insulation of heating mains in the factory, which will decrease the losses by 20%,- to install the heat exchanger in the exhausted gas channel to heat the air before boiler house.Because of the lack of information these situations are not economically estimated.
-44-
Offer for Energy Saving Introduction
Energy saving realisation can be divided in 2 parts:1 - without investments or with low investments:
- switch out the load when it is not necessary,- to avert the exhausting in the air system;
2 - with investments:- change of ventilation equipment,- change of burners in the boiler house,- change of air compressors.
- 45 *
APPENDIX
-46-
ATVENERGO 25-05-95ENERGY PER DAY
ILE: AUGAIS
AVERAGE ENERGY PER DAYMONDAYS: TUESDAYS: WEDNESDAYS: THURSDAYS: FRIDAYS: SATURDAYS: SUNDAYS:WORKINGDAYS: