CWONENT PART NOTICE THIS PAPER IS A COMPONENT PART OF THE FOLLOWING COMPILATION REPORT: TITLE: Engine Response to Diptnrtp-d Inflow GnndiMnns: Cnnfftrp.ncp. Prnr.ppdingg of the Propulsion and Energe-lcs Specialists' Meeting (68th) Held in Munich, Germany on 8-9 September 1986. TO ORDER THE COMPLETE COMPILATION REPORT, USE AD-A182 635 THE COMPONENT PART is PROVIDED HERE TO ALLOW USERS ACCESS TO INDIVIDUALLY AUTHORED SECTIONS OF PROCEEDING/ ANNALS, SYMPOSIA, ETC. HOWEVER, THE COMPONENT SHOULD BE CONSIDERED WITHIN THE CONTEXT OF THE OVERALL COMPILATION REPORT AND NOT AS A STAND-ALONE TECHNICAL REPORT. THE FOLLOWING COMPONENT PART NUMBERS COMPRISE THE COMPILATION REPORT: ^. P005 462 thru P005 473 /\[)^ ; AD# AD# m m Accession For NTIS GRAJcI DTIC TAB Unannounced Juatlfloatloo. By Distribution/ I a Availability Codes ÄvaliTand/or Special Bist m DTIC SELECTe|| JUL3 1W7I1 i DTIC f:oRM iJG3 ThS SmwiS bos htm oppnrci OPI: DTIC-TID
Transcript
CWONENT PART NOTICE
THIS PAPER IS A COMPONENT PART OF THE FOLLOWING COMPILATION REPORT:
TITLE: Engine Response to Diptnrtp-d Inflow GnndiMnns: Cnnfftrp.ncp. Prnr.ppdingg
of the Propulsion and Energe-lcs Specialists' Meeting (68th) Held
in Munich, Germany on 8-9 September 1986.
TO ORDER THE COMPLETE COMPILATION REPORT, USE AD-A182 635
THE COMPONENT PART is PROVIDED HERE TO ALLOW USERS ACCESS TO INDIVIDUALLY
AUTHORED SECTIONS OF PROCEEDING/ ANNALS, SYMPOSIA, ETC. HOWEVER, THE COMPONENT
SHOULD BE CONSIDERED WITHIN THE CONTEXT OF THE OVERALL COMPILATION REPORT AND
NOT AS A STAND-ALONE TECHNICAL REPORT.
THE FOLLOWING COMPONENT PART NUMBERS COMPRISE THE COMPILATION REPORT:
^. P005 462 thru P005 473 /\[)^;
AD#
AD#
m m
Accession For
NTIS GRAJcI DTIC TAB Unannounced Juatlfloatloo.
By Distribution/
I a
Availability Codes ÄvaliTand/or
Special Bist
m DTIC
SELECTe|| JUL3 1W7I1
i
DTIC f:oRM iJG3
ThS SmwiS bos htm oppnrci
OPI: DTIC-TID
«
CM rs ^f in o o Q.
I O
I 16-1
UNSTEADY INLET DISTORTION CHARACTERISTICS WITH THE B-1B
by
C. J. HacMlller W. R. Haagenson
ROCKWELL INTERNATIONAL NORTH AMERICAN AIRCRAFT OPERATIONS
P.O. Box 92098 Los Angeles, CA 90009
USA
SUMMARY
^ An extensive wind tunnel and flight test program has been conducted to verify Inlet performance and
distortion characteristics on the B-1B aircraft. During the course of these Investigations, several unsteady, total-pressure disturbances at various discrete frequencies were encountered:
1) Inlet duct resonance at low power settings; 2) ECS precooler duct resonance ■ o-vJ 3) Nose gear wake Ingestion (
,v,-■' >J c/-
Thls resulted In the need to quantify these effects and assess the Impact on engine stability char- acteristics. As a result, engine control features were modified, and aircraft configuration changes were Implemented. Results and findings of these Investigations are sunnarlzed. <r__
IDPH Index of planar distortion, high-pressure (compressor) component
RMS
S
1DPL
IDR
Index of planar distortion, low-pressure (fan) component
Inlet distortion, radial
T
WIR
X IGV engine Inlet guide vanes
IDTL total distortion Index, low-pressure (fan) component, combined spatial and planar distortion Index
0
VN
total distortion Index, high-pressure (compressor) component, combined spatial and planar distortion Index
Intermediate power setting
1,000
knots Indicated airspeed
1 ength
landing gear
mach number
pressure differential
planar pressure pulse generator
peak to peak
power for level flight
power spectral density
engine face average total pressure (FAVG)
freestream total pressure
ring average total pressure
radar cross section
ring minimum total pressure
root mean square
Strouhal number
temperature
engine corrected airflow
organ pipe end correction (sometimes set to 1.4d)
sweep angle of ramp leading edge
nacelle station. Inches
.
i i
16-2
INTRODUCTIOM
Stability characteristics of current high-performance turbofan engines are adversely affected by pressure fluctuations at the compressor face. One class of random pressure variations, frequently referred to as Inlet-lnducea turbulence, Is normally present In the flow. Engine stalls may result If sufficient energy/flow angularities exist at frequencies to which the compression system may respond. Dynamic distortion factors are used to correlate these types of pressure variations with losses In engine surge margin. Critical events can be difficult to define and usually require stochastic techniques. Correlations between the resulting spatial distortion characteristics and loss In surge margin have been the subject of considerable resources during recent decades (References 1 and 2).
Another class of pressure fluctuations can be destabilizing and Is attributed to the occurrence of one-dimensional, unsteady-pressure oscillations at the compressor face. Inlet buzz during supersonic operation at low Inlet mass flow ratios Is one classic example of a large-amplitude, planar wave coupled with spatial distortion. These transients are generally characterized by discrete frequency components and thus classified deterministic. Although higher frequency components are present, events are readily Identified.
Reported sources of planar pressure oscillations Include both Internally and externally generated disturbances. Internally-generated disturbances Include flow separatlon/reattachment, turbulence, buzz, unstart/restart cycles. Interaction with adjacent engines and Inlets, response to control system Inputs and secondary air Inlet designs. Examples of externally generated disturbances Include armament firing, atmospheric gusts, wakes of previous aircraft, external explosions and Ingestion of wakes emanating from forward protuberances - landing gear, external stores and pylons, aerodynamic surfaces, and weapon bay doors and spoilers. Methods for dealing with the simultaneous effects of planar and spatial total-pressure fluctuations are not well understood.
An extensive wind tunnel program was conducted to develop the B-1B propulsion system, and a flight test program to verify operational suitability is well underway. During the course of the Investigations, numerous Instances were encountered where discrete frequency components were evident In total pressures at the engine Inlet. This resulted In the need to quantify the effects and assess Impact on engine stability characteristics. As a result, engine control features were modified, and aircraft configuration changes were Implemented. Results and findings of these Investigations, Including wind tunnel and flight test comparisons, are sumnarlzed.
B-1B PROPULSION SYSTEM
The B-l, Figure I, Is a long-range strategic aircraft operated by a crew of four. Distinctive features relative to the propulsion system are variable sweep wings, nose gear protuberances forward of the Inlets, external stores, structural mode control vanes and weapon bay doors and spoilers. The variable wing changes the wing sweep angle from IS to 67.6 degrees. The aft sweep position (67.5 degrees) Is used at high speeds and during low altitude penetration. The structural mode control vanes are located on the lower sides of the forward fuselage and vary to control structural bending mode oscillations and to provide a smoother ride quality.
WEAPON BAY STRUCTURAL MODE DOOR AND SPOILERS CONTROL VANES
i
.LANDING GEAR STRUTS AND DOORS
Figure 1. B-1B Air Vehicle
The B-l propulsion system consists of two nacelles mounted under the fixed portion of the wing. Each nacelle contains two General Electric afterburning turbofan engines, and separate. Independent Inlets and
/
16-3
dlffusers. Inlets are two-dimensional, with vertical compression ramps, and are located aft of the wing glove leading edge, outboard of the aircraft centerllne. Forebody/wlng boundary layer air Is removed by a gutter located between the nacelle and wing. The off-centerllne location required a complete flow field Investigation because of wing flow outwash that varied with angle of attack, particularly at the aft wing sweep position. Nacelles are toed-1n 1/2 degree to align with local flow at nominal angles of attack.
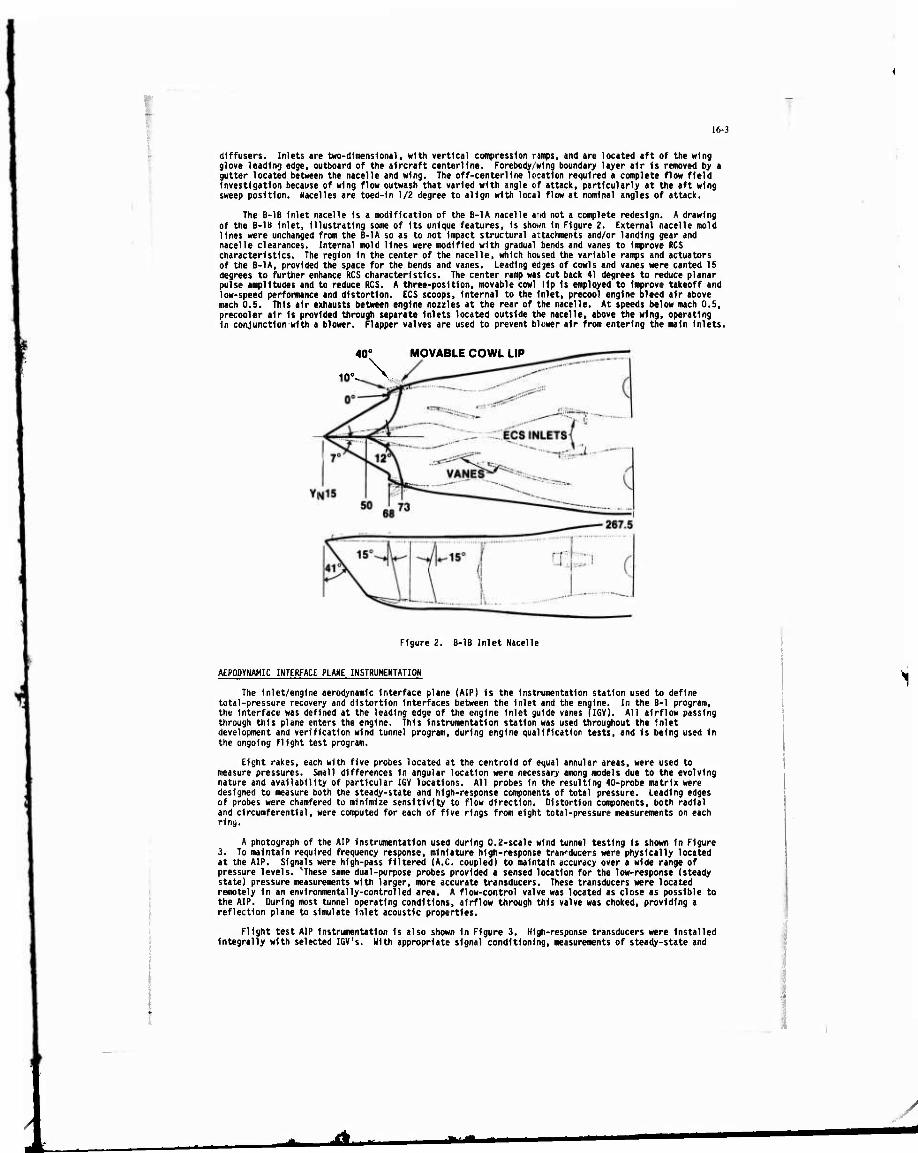
The B-1B Inlet nacelle is a modification of the B-1A nacelle aid not a complete redesign. A drawing of the B-1B Inlet, Illustrating some of Its unique features. Is shown In Figure 2. External nacelle mold lines were unchanged fron the B-1A so as to not Impact structural attachments and/or landing gear and nacelle clearances. Internal mold lines were modified with gradual bends and vanes to improve RCS characteristics. The region in the center of the nacelle, which hoised the variable ramps and actuators of the B-1A, provided the space for the bends and vanes. Leading edges of cowls and vanes were canted 15 degrees to further enhance RCS characteristics. The center ramp was cut back 41 degrees to reduce planar pulse amplitudes and to reduce RCS. A three-position, movable cowl lip Is employed to Improve takeoff and low-speed performance and distortion. ECS scoops. Internal to the inlet, precool engine bleed air above mach 0.5. This air exhausts between engine nozzles at the rear of the nacelle. At speeds below mach 0.5, precooler air is provided through separate Inlets located outside the nacelle, above the wing, operating in conjunction with a blower. Flapper valves are used to prevent blower air from entering the main inlets.
40° MOVABLE COWL LIP
i
Figure 2. B-1B Inlet Nacelle
AEPODYNAWIC INTERFACE PLANE INSTRUMENTATION
The inlet/engine aerodynamic interface plane (AIP) is the instrumentation station used to define total-pressure recovery and distortion Interfaces between the Inlet and the engine. In the B-1 program, the Interface was defined at the leading edge of the engine inlet guide vanes IIGV). All airflow passing through this plane enters the engine. This Instrumentation station was used throughout the Inlet development and verification wind tunnel program, during engine qualification tests, and is being used in the ongoing flight test program.
Eight rakes, each with five probes located at the centroid of equal annular areas, were used to measure pressures. Small differences in angular location were necessary among models due to the evolving nature and availability of particular IGV locations. All probes In the resulting 40-probe matrix were designed to measure both the steady-state and high-response components of total pressure. Leading edges of probes were chamfered to minimize sensitivity to flow direction. Distortion components, both radial and circumferential, were computed for each of five rings from eight total-pressure measurements on each ring.
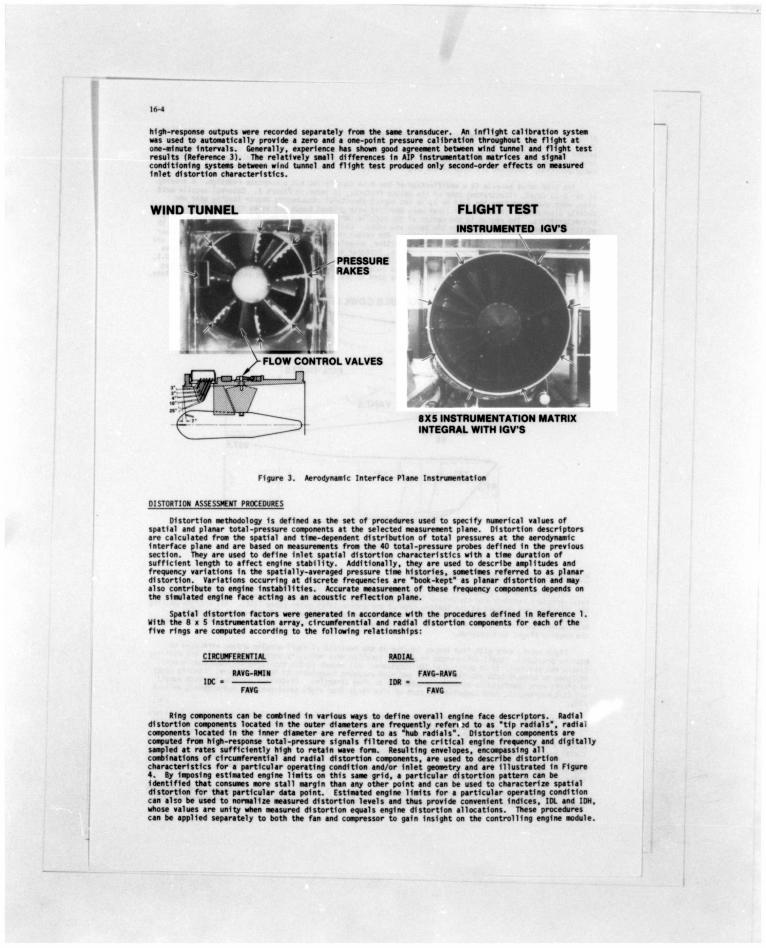
A photograph of the AIP instrumentation used during 0.2-scale wind tunnel testing is shown in Figure 3. To maintain required frequency response, miniature high-response transducers were physically located at the AIP. Signals were high-pass filtered (A.C. coupled) to maintain accuracy over a wide range of pressure levels. ''These same dual-purpose probes provided a sensed location for the low-response (steady state) pressure measurements with larger, more accurate transducers. These transducers were located remotely in an environmentally-controlled area. A flow-control valve was located as close as possible to the AIP. During most tunnel operating conditions, airflow through this valve was choked, providing a reflection plane to simulate Inlet acoustic properties.
Flight test AIP instrumentation is also shown in Figure 3. High-response transducers were Installed integrally with selected IGV's. With appropriate signal conditioning, measurements of steady-state and
i -■"- m m.
hljh-mpomc outputs ueru recorded sepereteljr fro« ttie teae trensdoeer. ta Inflight celibretlon systea ues used to lutoattlcelly provide • zero end e one-point pressure celibretlon throughout the flight et one-alnute Intervels. Generelly, eiperlence hes shoun good egreeaent betaeen wind tunnel end flight test results (Peference 3). The reletively saell differences In AIP Instruaentetlon astrices end signel conditioning systeas oetMen nind tunnel end flight test produced only second-order effects on aeesured Inlet distortion cherecUrlstlcs.
WIND TUNNEL
IIFLIGHT TEST mSTRUMENTEO low’s
PRESSURERAKES
FLOW CONTROL VALVESn
8X5 INSTRUMENTATION MATRIX INTEGRAL WITH IQV’S
Figure 3. Aerodyneerfe Interface Mane Instnaecntatlon
DISTOPTlOh ASStSSeCNT FROCEDUPtS
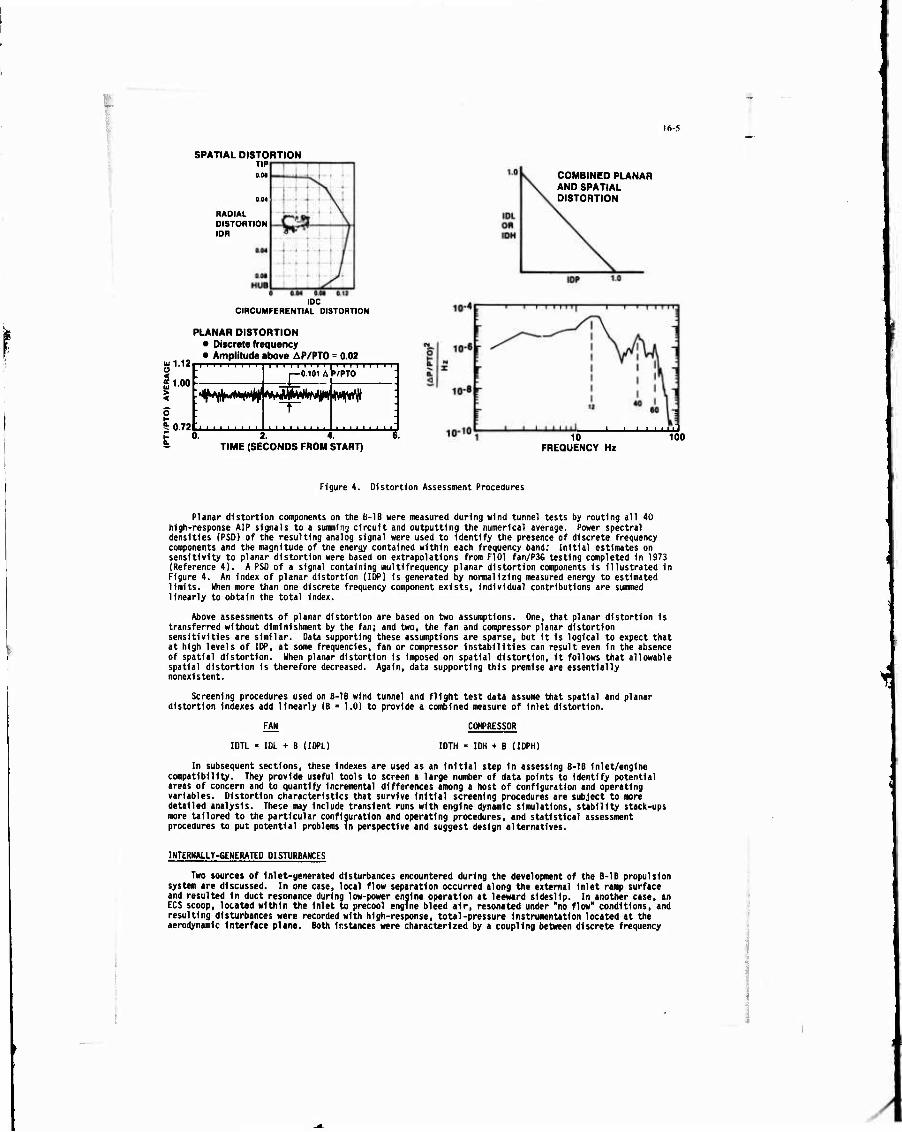
Distortion aethodology Is defined as the set of procedures used to specify nuaericel values of spatial end planer total-pressure coaponents et the selected neesureaent plane. Distortion descriptors ere calculated froa the spatial and tine-dependent distribution of total pressures at the aerodynaalc Interface plane and are based on neasurenents froa the 40 total-pressure probes defined In the previous section. They are used to define Inlet spatial distortion characteristics with a tine duration of sufficient length to affect engine sUblllty. Additionally, they are used to describe anplltudes and frequency variations In the spatially-averaged pressure tine histories, sonetines referred to as planar distortion. Variations occurring at discrete frequencies are ’book-kept* as planar distortion and nay also contribute to engine Instabilities. Accurate neasurenent of these frequency coaponents depends on the slnulated engine face acting as an acoustic reflection plane.
Spatial distortion factors uere generated In accordance ulth the procedures defined In Reference 1. Vlth the 8 X 5 Instrunenutlon array, circunferentlal and radial distortion coa^onants for each of the five rings are coaputed according to the follouing relationships;
CIRCUWCREIITIAI.
RAV6-RM1*
RADIAL
FAVtlOR - FAV8-RAVS
FAVG
Ring coaponents can be coablned In various uays to define overall engine face descriptors. Radial distortion coaponents located In the outer dlaaeUrs are frequently refer; 9d to at ‘tip radlals', radial coaponents located In the Inner dlaaeter are referred to at ’hub radlals’. Distortion coaponents are coaputed froa high-response toul-pressure signals fllured to the critical engine frequency and digitally saapled at rates sufficiently high to retain nave fora. Resulting envelopes, encoapatsing all coablnatlons of circuaferentlal and radial distortion coaponents, are used to describe distortioncharacteristics for a particular operating condition and/or Inlet geoarstry and are Illustrated In Figure4. By l^roslng estlaated engine Units on this saae grid, a particular distortion patUrn can beIdentified that consuaes aore stall aargln than any other point and can be used to characterize spatialdistortion for that particular data point. Estlaated engine Units for a particular operating condition can also be used to nomallze neasured distortion levels and thus provide convenient Indices, IDL and IDM, idiose values are unity uhen neasured distortion equals engine distortion allocations. These procedures can be applied separaUly to both the fan and conpressor to gain Insight on the controlling engine nodule.
■ ■ i i i i i i i i i i i i i i i i < i i < i i i i »/PTO
0.72
|—0.101 A P/PTO
TIME (SECONDS FROM START) 10
FREQUENCY Hz
i i i i i i ii 100
Figure 4. Distortion Assessment Procedures
Planar distortion components on the MB were measured during wind tunnel tests by routing all 40 high-response AIP signals to a summin-; circuit and outputtlng the numerical average. Power spectral densities (PSD) of the resulting analog signal were used to Identify the presence of discrete frequency components and the magnitude of the energy contained within each frequency band; Initial estimates on sensitivity to planar distortion were based on extrapolations from F101 fan/P3G testing completed In 1973 (Reference 4). A PSD of a signal containing multlfrequency planar distortion components Is Illustrated In Figure 4. An Index of planar distortion (IDP) Is generated by normalizing measured energy to estimated limits. When more than one discrete frequency component exists, Individual contributions are sunned linearly to obtain the total Index.
Above assessments of planar distortion are based on two assumptions. One, that planar distortion Is transferred without dlmlnishment by the fan; and two, the fan and compressor planar distortion sensitivities are similar. Data supporting these assumptions are sparse, but It Is logical to expect that at high levels of IDP, at some frequencies, fan or compressor Instabilities can result even In the absence of spatial distortion. When planar distortion Is Imposed on spatial distortion. It follows that allowable spatial distortion Is therefore decreased. Again, data supporting this premise are essentially nonexistent.
Screening procedures used on B-1B wind tunnel and flight test data assume that spatial and planar distortion Indexes add linearly (B ■ 1.0) to provide a combined measure of Inlet distortion.
FAN
IDTL • IDL + B (IDPL)
COMPRESSOR
IDTH ' IDH + B (IDPH)
In subsequent sections, these Indexes are used as an Initial step In assessing B-1B Inlet/engine compatibility. They provide useful tools to screen a large number of data points to Identify potential areas of concern and to quantify Incremental differences among a host of configuration and operating variables. Distortion characteristics that survive Initial screening procedures are subject to more detailed analysis. These may Include transient runs with engine dynamic simulations, stability stack-ups more tailored to the particular configuration and operating procedures, and statistical assessment procedures to put potential problems In perspective and suggest design alternatives.
INTERNALLY-GENERATED DISTURBANCES
Two sources of Inlet-generated disturbances encountered during the development of the B-1B propulsion system are discussed. In one case, local flow separation occurred along the external Inlet ramp surface and resulted In duct resonance during low-power engine operation at leeward sideslip. In another case, an ECS scoop, located within the Inlet to precool engine bleed air, resonated under "no flow" conditions, and resulting disturbances were recorded with high-response, total-pressure Instrumentation located at the aerodynamic Interface plane. Both Instances were characterized by a coupling between discrete frequency
T
'
16-6
components and spatial distortion components normally present in the flow. Although engine response to this coupling Is not well understood, a need to evaluate Inlet-to-engine compatibility In the presence of combined planar and spatial distortion was clearly Identified.
INLET DUCT RESONANCE
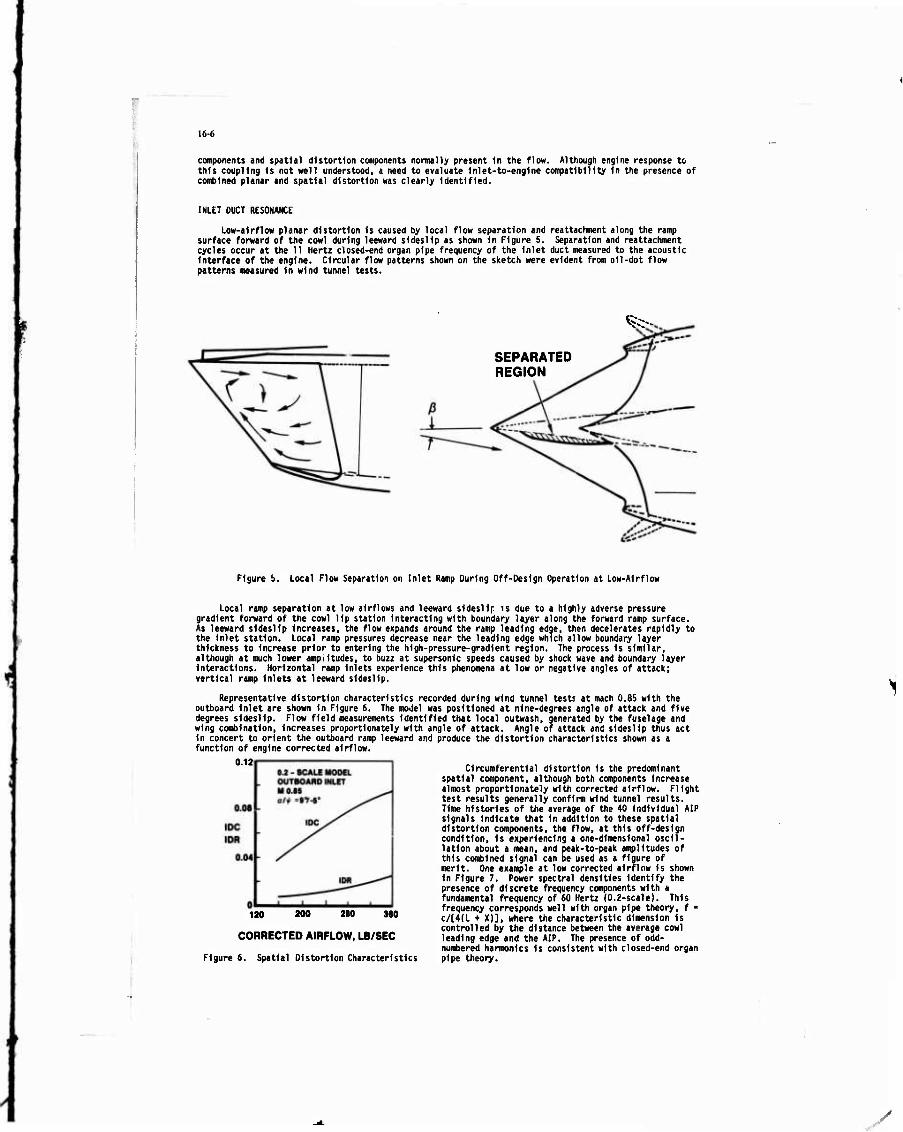
Low-airflow planar distortion Is caused by local flow separation and reattachment along the ramp surface forward of the cowl during leeward sideslip as shown In Figure 5. Separation and reattachment cycles occur at the 11 Hertz closed-end organ pipe frequency of the Inlet duct measured to the acoustic Interface of the engine. Circular flow patterns shown on the sketch were evident from oil-dot flow patterns measured In wind tunnel tests.
I Ccc:-
SEPARATED REGION
Figure b. Local Flow Separation on Inlet Ramp During Off-Design Operation at Low-Airflow
Local ramp separation at low airflows and leeward sldesllr 1s due to a highly adverse pressure gradient forward of the cowl lip station Interacting with boundary layer along the forward ramp surface. As leeward sideslip Increases, the flow expands around the ramp leading edge, then decelerates rapidly to the Inlet station. Local ramp pressures decrease near the leading edge which allow boundary layer thickness to Increase prior to entering the high-pressure-gradient region. The process Is similar, although at much lower amplitudes, to buzz at supersonic speeds caused by shock wave and boundary layer Interactions. Horizontal ramp Inlets experience this phenomena at low or negative angles of attack; vertical ramp Inlets at leeward sideslip.
Representative distortion characteristics recorded during wind tunnel test! at mach 0.85 with the outboard Inlet are shown In Figure 6. The model was positioned at nine-degrees angle of attack and five degrees sideslip. Flow field measurements Identified that local outwash, generated by the fuselage and wing combination, increases proportionately with angle of attack. Angle of attack and sideslip thus act in concert to orient the outboard ramp leeward and produce the distortion characteristics shown as a function of engine corrected airflow.
0.12
120 200 2S0 360
CORRECTED AIRFLOW, LB/SEC
Figure 6. Spatial Distortion Characteristics
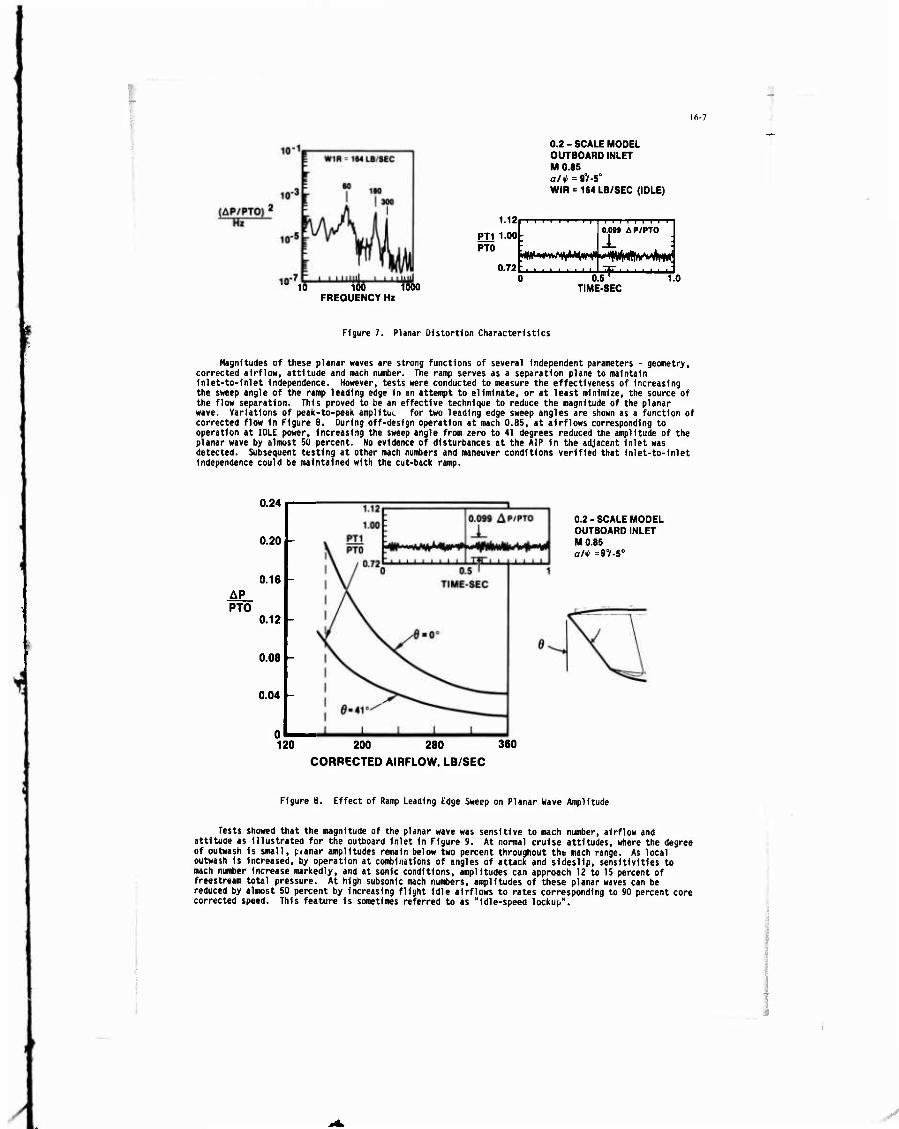
Circumferential distortion Is the predominant spatial component, although both components Increase almost proportionately with corrected airflow. Flight test results generally confirm wind tunnel results. Time histories of the average of the 40 Individual AIP signals Indicate that In addition to these spatial distortion components, the flow, at this off-design condition, Is experiencing a one-dimensional oscil- lation about a mean, and peak-to-peak amplitudes of this combined signal can be used as a figure of merit. One example at low corrected airflow is shown In Figure 7. Power spectral densities identify the presence of discrete frequency components with a fundamental frequency of 60 Hertz (0.2-scale). This frequency corresponds well with organ pipe theory, f • c/[4(L ♦ X)], where the characteristic dimension is controlled by the distance between the average cowl leading edge and the AIP. The presence of odd- numbered harmonics is consistent with closed-end organ pipe theory.
y
- 16-7
0.2 - SCALE MODEL OUTBOARD INLET M0.8S a/^=9V-5° WIR = 164 LB/SEC (IDLE)
1.12
PT1 1.00 PTO
0.72
i i i i i i i i COM AP/PTO
i. Hlh#>»M^Mß4 "»tflllfrlfrw'w^HWl
10 100 1000 FREQUENCY Hz
0.5' TIME-SEC
1.0
Figure 7. Planar Distortion Characteristics
Magnitudes of these planar waves are strong functions of several Independent parameters - geometry, corrected airflow, attitude and mach number. The ramp serves as a separation plane to maintain Inlet-to-inlet Independence. However, tests were conducted to measure the effectiveness of Increasing the sweep angle of the ramp leading edge In an attempt to eliminate, or at least minimize, the source of the flow separation. This proved to be an effective technique to reduce the magnitude of the planar wave. Variations of peak-to-peak amplltui for two leading edge sweep angles are shown as a function of corrected flow In Figure 8. During off-design operation at mach 0.85, at airflows corresponding to operation at IDLE power, Increasing the sweep angle from zero to 41 degrees reduced the amplitude of the planar wave by almost SO percent. No evidence of disturbances at the AIP In the adjacent Inlet was detected. Subsequent testing at other mach numbers and maneuver conditions verified that inlet-to-inlet independence could be maintained with the cut-back ramp.
0.24
0.20
0.16
0.12
0.08
0.04
0.2 - SCALE MODEL OUTBOARD INLET M0.8S a/<l> =90/-50
120 200 280 360
CORPECTED AIRFLOW, LB/SEC
Figure 8. Effect of Ramp Leading Edge Sweep on Planar Wave Amplitude
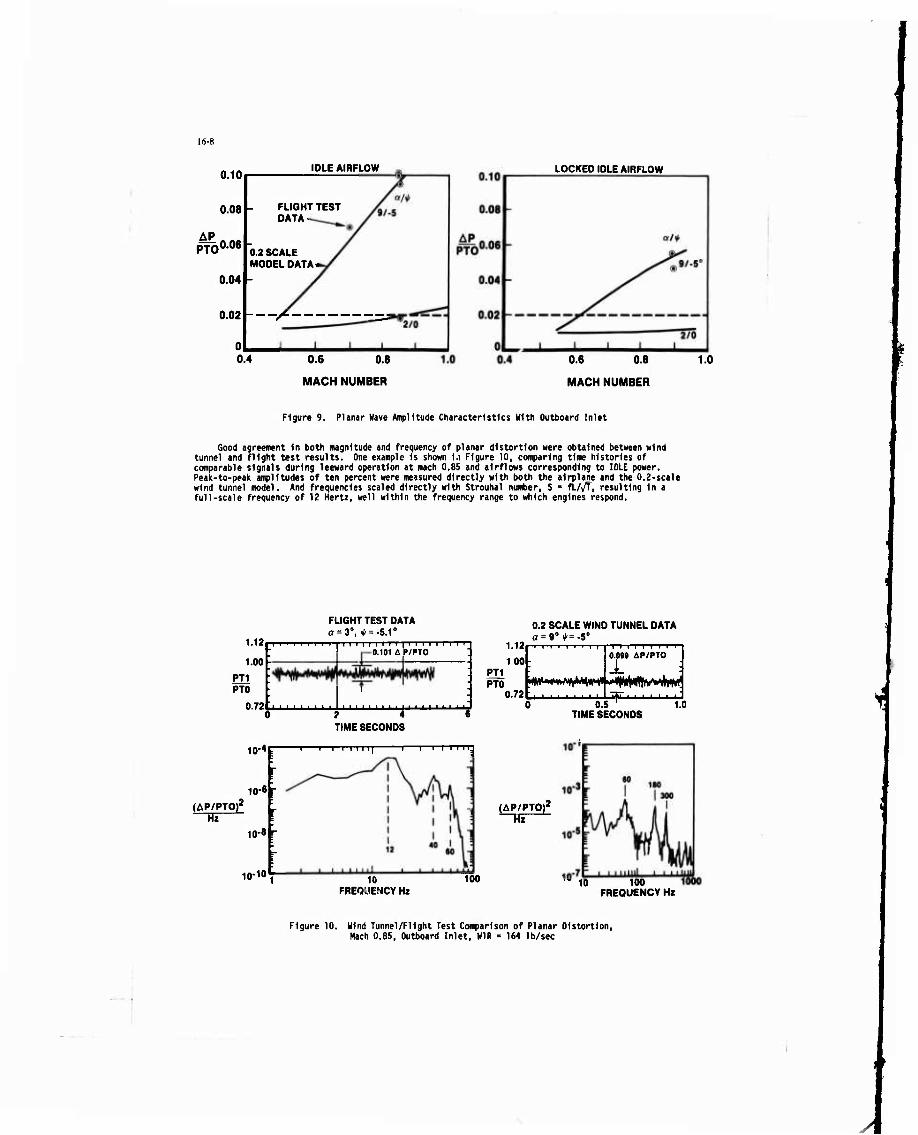
Tests showed that the magnitude of the planar wave was sensitive to mach number, airflow and attitude as illustrated for the outboard Inlet in Figure 9. At normal cruise attitudes, where the degree of outwash Is small, pianar amplitudes remain below two percent throughout the mach range. As local outwash is increased, by operation at combinations of angles of attack and sideslip, sensitivities to mach number Increase markedly, and at sonic conditions, amplitudes can approach 12 to 15 percent of freestream total pressure. At high subsonic mach numbers, amplitudes of these planar waves can be reduced by almost 50 percent by increasing flight idle airflows to rates corresponding to 90 percent core corrected speed. This feature is sometimes referred to as "idle-speed lockup".
y
15-8
I
0.10
0.08
PTO006
IDLE AIRFLOW LOCKED IDLE AIRFLOW
FLIGHT TEST DATA
0.4
0.2 SCALE MODEL DATA^
0.04
0.6 0.8
MACH NUMBER
0.6 0.8
MACH NUMBER
1.0
Figure 9. Planar Wave Amplitude Characteristics With Outboard Inlet
Good agreement In both magnitude and frequency of planar distortion were obtained between Mind tunnel and flight test results. One example Is shown 1,i Figure 10, comparing time histories of comparable signals during leeward operation at mach 0.85 and airflows corresponding to IDLE power. Peak-to-peak amplitudes of ten percent were measured directly with both the airplane and the 0.2-scale wind tunnel model. And frequencies scaled directly with Strouhal number, S • fLA/f, resulting In a full-scale frequency of 12 Hertz, well within the frequency range to which engines respond.
1.12
1.00
PT1 PTO
0.72
FLIGHT TEST DATA a = 3°, ^ = -5.1°
i i i i i i i
10-4
10-6
(AP/PTOr Hz
IC'8 f
10 -10
i i i i i I i i i i i i i i i 0.101 A P/PTO
i I i I i I ) I
TIME SECONDS
-i 1—i i i 111[ i i i i i i ii
PT1 PTO
10 FREQUENCY Hz
100
1.12
100 I ) 0.72
0.2 SCALE WIND TUNNEL DATA a = 9° ^=.5° ■»—i—i i i i ■ i i i i i i i i i i
O.ON AP/PTO
(AP/PTO^ Hz
1^1 I O.S
TIME SECONDS 1.0
10 100 FREQUENCY Hz
i
Figure 10. Hind Tunnel/Flight Test Comparison of Planar Distortion, Mach 0.85, Outboard Inlet, WIR » 164 lb/sec
16-9
$
Ramp separation and the associated planar distortion component are thus shown to be fundamentally a low-airflow phenomenon. Fortunately, spatial distortion components are directly proportional to airflow and are typically less than four percent at Idle airflow. At first glance, one would expect this to be compensatory; however, engine tolerance to spatial distortion can be strong functions of engine corrected airflow and compression system rotational speeds. In fact, the need to accelerate the engine during periods of thermal mismatches between the engine case and rotor, as, for example, during a throttle bodle, can be one of the more difficult hurdles for inlet/engine stability assessments. Complexities of assessing the Impact of adding a planar distortion component make It that much harder.
Using a simplifying assumption that superposition factors defining the relationship between planar and spatial distortion components are unity, assessments were conducted over a range of airflows, mach numbers, and angles of attack and sideslip using data recorded during wind tunnel tests with the 3.2-scale Inlet verification model. Because engine sensitivity is also a function of altitude, conditions were evaluated at altitude extremes for each mach number, and for both fan and compressor engine modules.
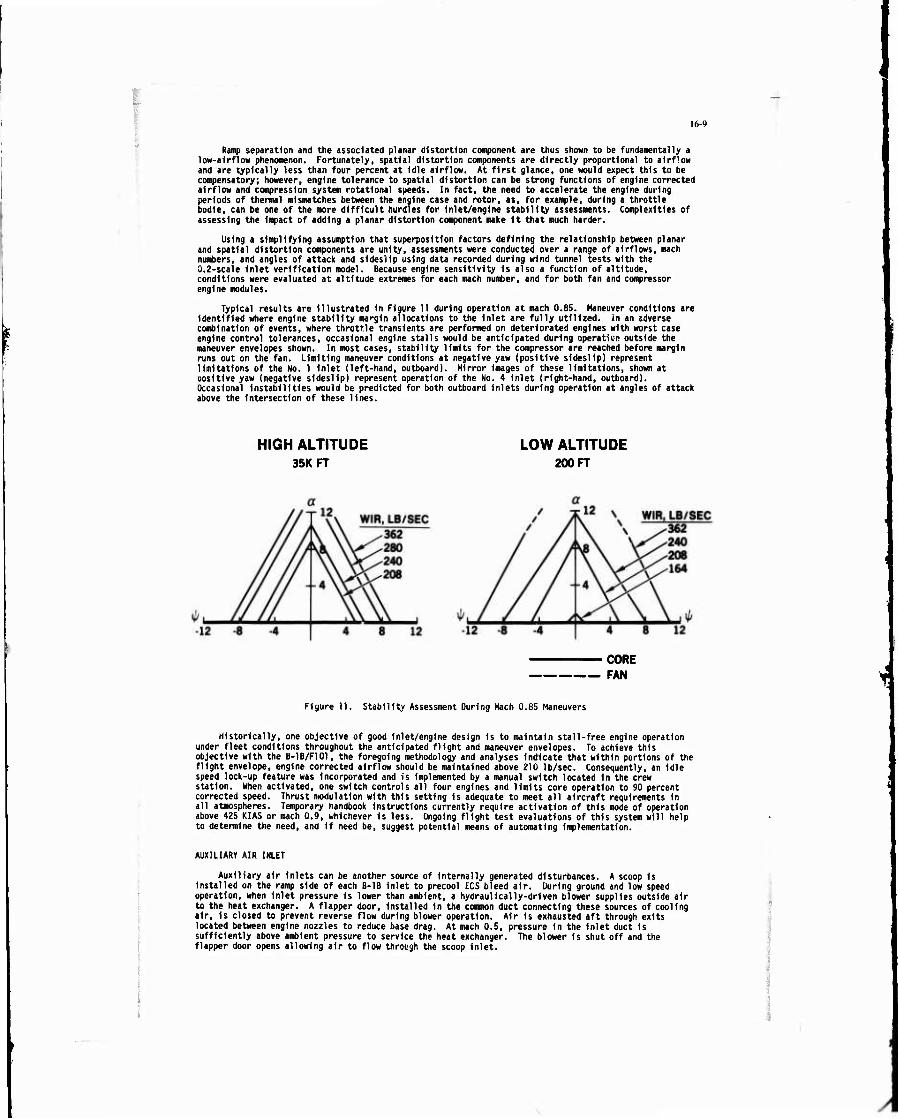
Typical results are Illustrated In Figure 11 during operation at mach 0.85. Maneuver conditions are Identified where engine stability margin allocations to the Inlet are fully utilized, in an adverse combination of events, where throttle transients are performed on deteriorated engines with worst case engine control tolerances, occasional engine stalls would be anticipated during operation outside the maneuver envelopes shown. In most cases, stability limits for the compressor are reached before margin runs out on the fan. Limiting maneuver conditions at negative yaw (positive sideslip) represent limitations of the No. 1 inlet (left-hand, outboard). Mirror Images of thsse limitations, shown at positive yaw (negative sideslip) represent operation of the No. 4 inlet (right-hand, outboard). Occasional instabilities would be predicted for both outboard inlets during operation at angles of attack above the intersection of these lines.
HIGH ALTITUDE 35KFT
LOW ALTITUDE 200 FT
CORE FAN
Figure 11. Stability Assessment During Mach 0.8S Maneuvers
Historically, one objective of good Inlet/engine design Is to maintain stall-free engine operation under fleet conditions throughout the anticipated flight and maneuver envelopes. To achieve this objective with the B-1B/F101, the foregoing methodology and analyses Indicate that within portions of the flight envelope, engine corrected airflow should be maintained above 210 lb/sec. Consequently, an Idle speed lock-up feature was Incorporated and is Implemented by a manual switch located In the crew station. When activated, one switch controls all four engines and limits core operation to 90 percent corrected speed. Thrust modulation with this setting is adequate to meet all aircraft requirements in all atmospheres. Temporary handbook instructions currently require activation of this mode of operation above 425 KIAS or mach 0.9, whichever is less. Ongoing flight test evaluations of this system will help to determine the need, and if need be, suggest potential means of automating implementation.
■
AUXILIARY AIR INLET
Auxiliary air Inlets can be another source of internally generated disturbances. A scoop is installed on the ramp side of each B-1B inlet to precool ECS bleed air. During ground and low speed operation, when inlet pressure is lower than ambient, a hydraulically-driven blower supplies outside air to the heat exchanger. A flapper door, installed in the common duct connecting these sources of cooling air, is closed to prevent reverse flow during blower ooeration. Air is exhausted aft through exits located between engine nozzles to reduce base drag. At mach 0.5, pressure in the inlet duct Is sufficiently above ambient pressure to service the heat exchanger. The blower is shut off and the flapper door opens allowing air to flow through the scoop inlet.
A
J'I16-10
Th* design <nd relitiv* locitlon of th» ECS precooler Inlet »s$e«bly 1$ showi In Figure 12. The scoop 1$ lociUd Just obove the duct centerline end esunds four Inches Into the Inlet. The scoop hed to be redesigned to sccoandeU the redesign of the besic 8-1B Inlet. Adyenuge ms Uken of this opportunity to reshape the scoop coul lip and external eold line to elnlelie external flow separation under "no floe" conditions. The scoop thus acts as a resonator (closed organ pipe) ulth the controlling voliiee located betueen the leading edge and the flapper valve. Since the flapper door Is self-positioned by air loads, resonance can lead to structural daauge, particularly during operation close to the transition point uhen the pressure differential across the door Is saall. Because of the 1o« duct pressure, engine FOC can result, and during the Initial B-IB flight Ust prograai, several InsUnces Mre attributed to structural failure within this systea.
Figure 12. ECS Precooler Assaably
Htgh-response pressure transducers located Just upstreaa of the flapper door In the aircraft Identified duct resonance at frequencies corresponding U a closed-end organ pipe. During sutic operation on the ground at eaxlu engine airflow, power spectral densities. Figure 13. Identified a fundMenUl frequency at V HerU as Mil as the presence of several hanaonics. RMS aagilltudes Mre approxiHtely 2.4 psi. Slallar results Mre obulned with the 0.2-scale Inlet aodel. Although a^lltudes Mre saaller, discrete coaponents Mre aeasured at scaled frequencies, and a prograa ms Initiated to ellalnaU and/or reduce the aagnitude of these oscillations.
M = 0 LIP 40” WIR = MAXIMUM
0.2 SCALE MODEL AIRCRAFT10-’ i
?10-*
-II1
AItHNl
10-0 • , ...... 1 1 1 mum
1 1
IHi Yi t 1 Mill
10 100 1000 FREQUENCY, Hx
10000
Figure 13. Resonance CharacUrlstIcs In ECS Scoop Inlet
lft-11
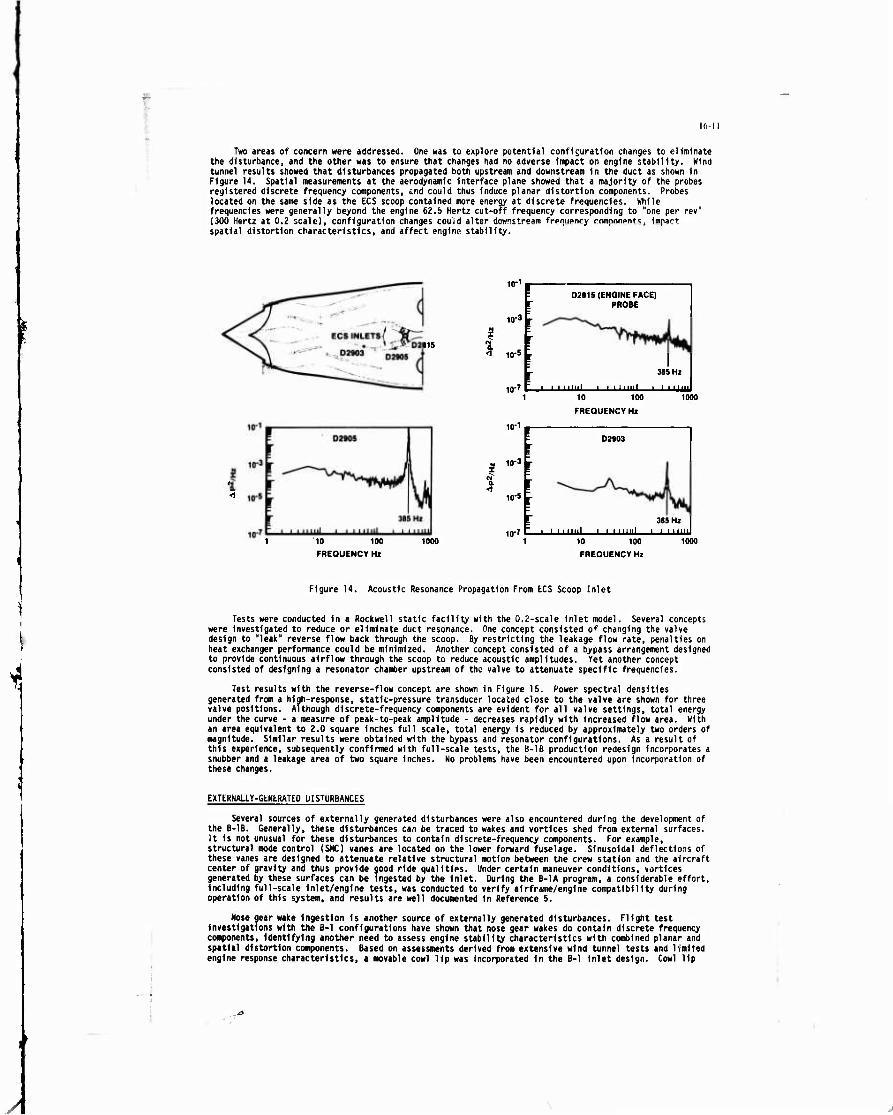
Two areas of concern were addressed. One was to explore potential configuration changes to eliminate the disturbance, and the other was to ensure that changes had no adverse impact on engine stability. Wind tunnel results showed that disturbances propagated both upstream and downstream in the duct as shown in Figure 14. Spatial measurements at the aerodynamic Interface plane showed that a majority of the probes registered discrete frequency components, und could thus induce planar distortion components. Probes located on the same side as the ECS scoop contained more energy at discrete frequencies. While frequencies were generally beyond the engine 62.b Hertz cut-off frequency corresponding to "one per rev" (300 Hertz at 0.2 scale), configuration changes could alter downstream frenupncy ronpnnpnt.t, impact spatial distortion characteristics, and affect engine stability.
I D2S1S
< 10-5
1 10 100
FREQUENCY Hi
1000
10"
10-3
i •a io-5
-i
io-i
D2815 (ENGINE FACE) PROBE
I I i i mil I I I I I
MS Hi
1 LUUU 10 100
FREQUENCY Hi
D2903 10-1 |
10-3 I
10-5
aas HI 10-7 t__l_LUJluJ I i i mill ' ' '""
10 100
FREQUENCY Hi
1000
Figure 14. Acoustic Resonance Propagation From ECS Scoop Inlet
Tests were conducted In a Rockwell static facility with the 0.2-scale inlet model. Several concepts were investigated to reduce or eliminate duct resonance. One concept consisted of changing the valve design to "leak" reverse flow back through the scoop. By restricting the leakage flow rate, penalties on heat exchanger performance could be minimized. Another concept consisted of a bypass arrangement designed to provide continuous airflow through the scoop to reduce acoustic amplitudes. Yet another concept consisted of designing a resonator chamber upstream of the valve to attenuate specific frequencies.
Test results with the reverse-flow concept are shown in Figure 15. Power spectral densities generated from a high-response, static-pressure transducer located close to the valve are shown for three valve positions. Although discrete-frequency components are evident for all valve settings, total energy under the curve - a measure of peak-to-peak amplitude - decreases rapidly with increased flow area. With an area equivalent to 2.0 square Inches full scale, total energy is reduced by approximately two orders of magnitude. Similar results were obtained with the bypass and resonator configurations. As a result of this experience, subsequently confirmed with full-scale tests, the B-1B production redesign incorporates a snubber and a leakage area of two square inches. No problems have been encountered upon incorporation of these changes.
EXTERMALLY-GLNLRATED OISTURBAWCES
Several sources of externally generated disturbances were also encountered during the development of the B-1B. Generally, these disturbances can be traced to wakes and vortices shed from external surfaces. It is not unusual for these disturbances to contain discrete-frequency components. For example, structural mode control (SMC) vanes are located on the lower forward fuselage. Sinusoidal deflections of these vanes are designed to attenuate relative structural motion between the crew station and the aircraft center of gravity and thus provide good ride qualities. Under certain maneuver conditions, vortices generated by these surfaces can be ingested by the Inlet. During the B-1A program, a considerable effort. Including full-scale inlet/engine tests, was conducted to verify airframe/englne compatibility during operation of this system, and results are well documented in Reference 5.
Nose gear wake Ingestion is another source of externally generated disturbances. Flight test investigations with the B-l configurations have shown that nose gear wakes do contain discrete frequency components, Identifying another need to assess engine stability characteristics with combined planar and spatial distortion components. Based on assessments derived from extensive wind tunnel tests and limited engine response characteristics, a movable cowl lip was Incorporated in the 8-1 inlet design. Cowl lip
16-12
angle 1s held In one of three positions, 40, 10 or 0 degrees, and 1$ scheduled as a function of gear position and mach number as shown In Figure 16. Good performance and acceptable distortion characteristics during takeoff and low-speed operation result, and drag 1s minimized during high-speed flight.
0.2 SCALE MODEL M = 0 WIR = MAX
2 4 6 8 10 12
FLAPPER VALVE LEAKAGE AREA, IN^ (FULL SCALE) FREQUENCE Hi
Figure 15. Effect of Reverse Flow on Acoustic Amplitude In ECS Scoop
COWL LIP SCHEDULE
LIP ANGLE DEGREES 301-^
j SWITCHING i 1 LOGIC 1 | SWITCHING COMMAND |
40° —•• 10°
40° ^— 10°
M 0.35 INCR ANDLGUP
M 0.32 DECR QRLGDOWN
10° —»■ 0 10° «— 0
M 0.65 INCR 1
M 0.62 DECR |
0.4 0.6 MACH NUMBER
Figure 16. Cowl Lip Schedule
Limits that define regions of acceptable lip operation are also shown. The distortion limit was derived from wind tunnel data and defines regions where combined spatial and planar distortion levels remain within engine allocations. The limit shown for drag Is somewhat arbitrary. Drag Increases with Increasing lip angle and/or mach number and eventually becomes excessive. Operation at mach numbers and lip angle combinations greater than this Hmlt are avoided to minimize Impact on specific fuel consumption during Important mission conditions.
16-13
Switching among the 40-, 10-, and 0-degree cowl lip settings Is based on flight mach number and landing gear position. The 40-degree lip setting Is used for takeoff and all flight conditions where the landing gear Is down and the nose gear wake could enter the Inlet. The 10-degree lip position Is used above mach 0.35 after the landing gear Is raised. This position maintains Inlet distortion levels within engine allocations for flight maneuvers up to mach 0.65. The fully closed, 0-degree position Is used for high-speed operation above mach 0.65 where drag Is critical. The cowl lip reopens as flight speed Is reduced and/or the landing gear Is lowered. An Increment of 0.03 In mach number Is used to separate opening and closing signals to provide a positive control Input In both directions.
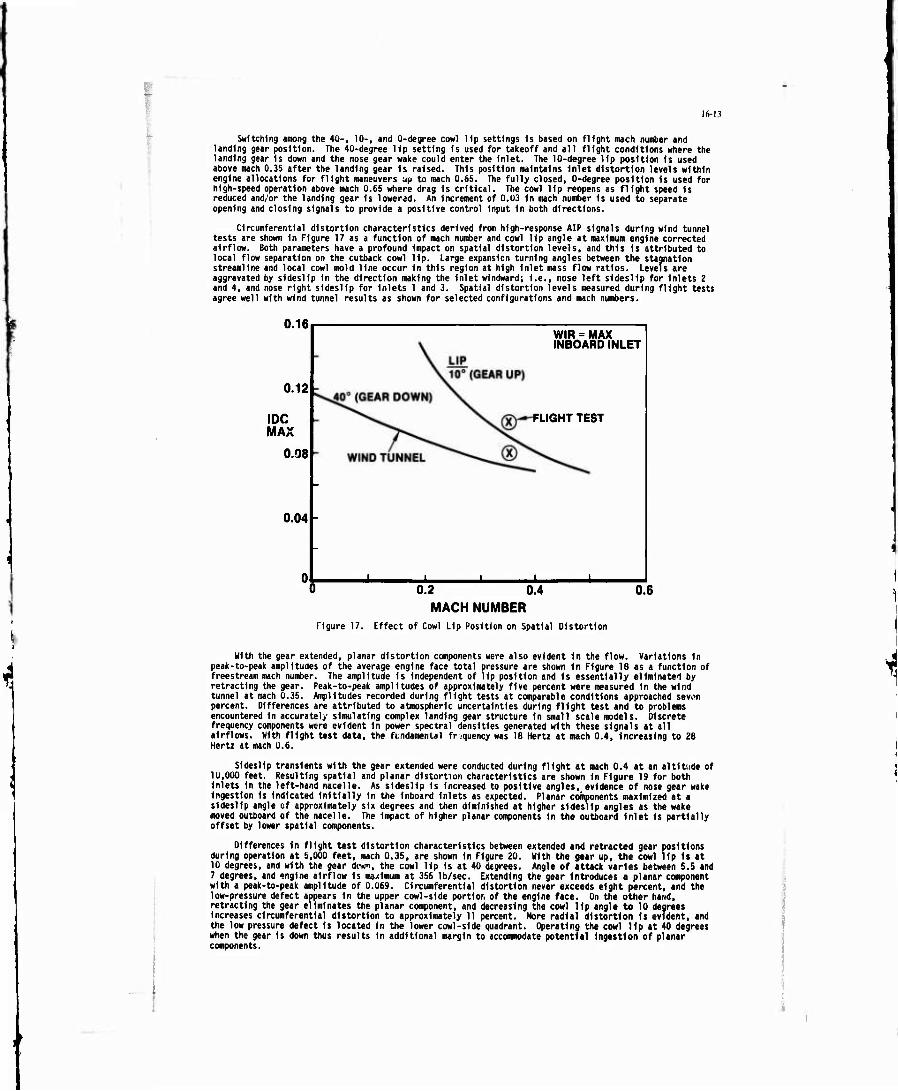
Circumferential distortion characteristics derived from high-response AIP signals during wind tunnel tests are shown In Figure 17 as a function of mach number and cowl lip angle at maximum engine corrected airflow. Both parameters have a profound Impact on spatial distortion levels, and this Is attributed to local flow separation on the cutback cowl lip. Large expansion turning angles between the stagnation streamline and local cowl mold line occur In this region at high Inlet mass flow ratios. Levels are aggravated by sideslip In the direction making the Inlet windward; I.e., nose left sideslip for Inlets 2 and 4, and nose right sideslip for Inlets 1 and 3. Spatial distortion levels measured during flight tests agree well with wind tunnel results as shown for selected configurations and mach numbers.
0.16
0.12
IDC MAX
0.08
0.04 -
WIR = MAX INBOARD INLET
FLIGHT TEST
J. 0.2 0.4
MACH NUMBER Figure 17. Effect of Cowl Lip Position on Spatial Distortion
0.6
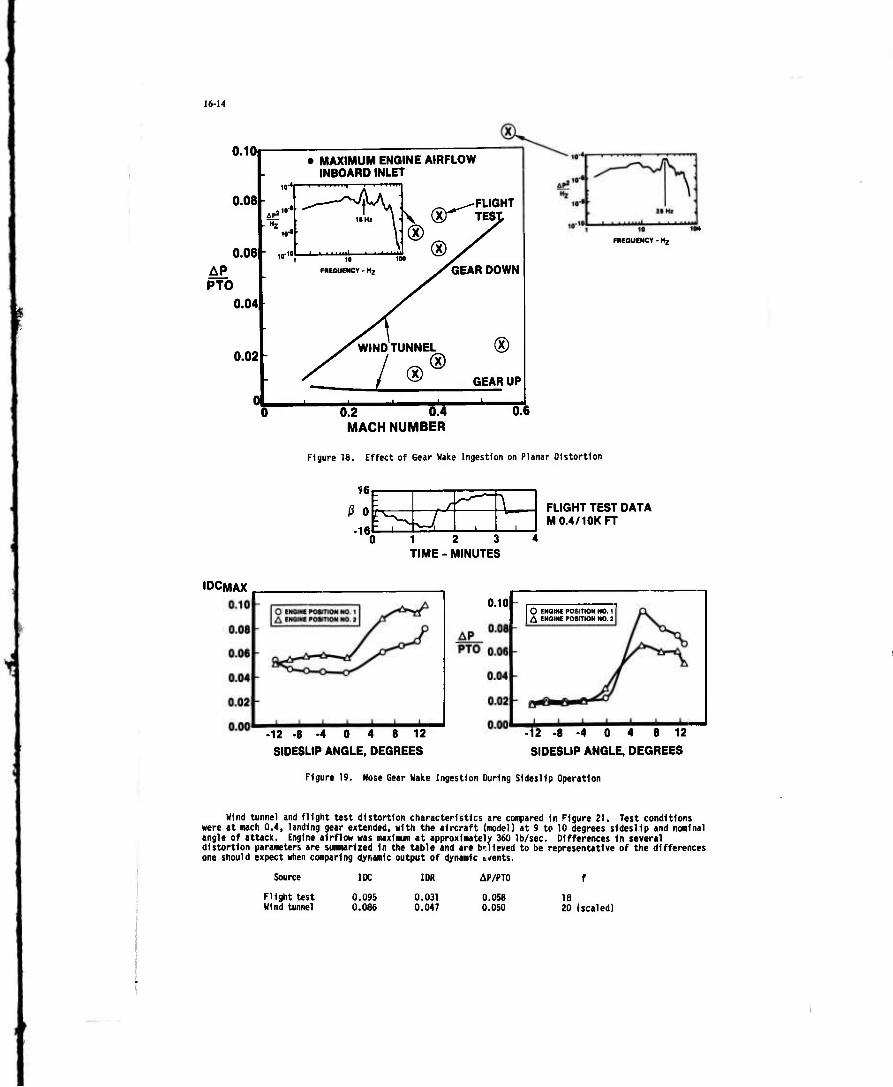
With the gear extended, planar distortion components were also evident In the flow. Variations In peak-to-peak amplitudes of the average engine face total pressure are shown In Figure 18 as a function of freestream mach number. The amplitude Is Independent of lip position and Is essentially eliminated by retracting the gear. Peak-to-peak amplitudes of approximately five percent were measured In the wind tunnel at mach 0.35. Amplitudes recorded during flight tests at comparable conditions approached sevon percent. Differences are attributed to atmospheric uncertainties during flight test and to problems encountered In accurately simulating complex landing gear structure In small scale models. Discrete frequency components were evident In power spectral densities generated with these signals at all airflows. With flight test data, the fundamental frequency was 18 Hertz at mach 0.4, Increasing to 28 Hertz at mach 0.6.
Sideslip transients with the gear extended were conducted during flight at mach 0.4 at an altitude of 10,000 feet. Resulting spatial and planar distortion characteristics are shown In Figure 19 for both Inlets In the left-hand nacelle. As sideslip Is Increased to positive angles, evidence of nose gear wake Ingestion Is Indicated Initially In the Inboard Inlets as expected. Planar components maximized at a sideslip angle cf approximately six degrees and then diminished at higher sideslip angles as the wake moved outboard of the nacelle. The Impact of higher planar components In the outboard Inlet Is partially offset by lower spatial components.
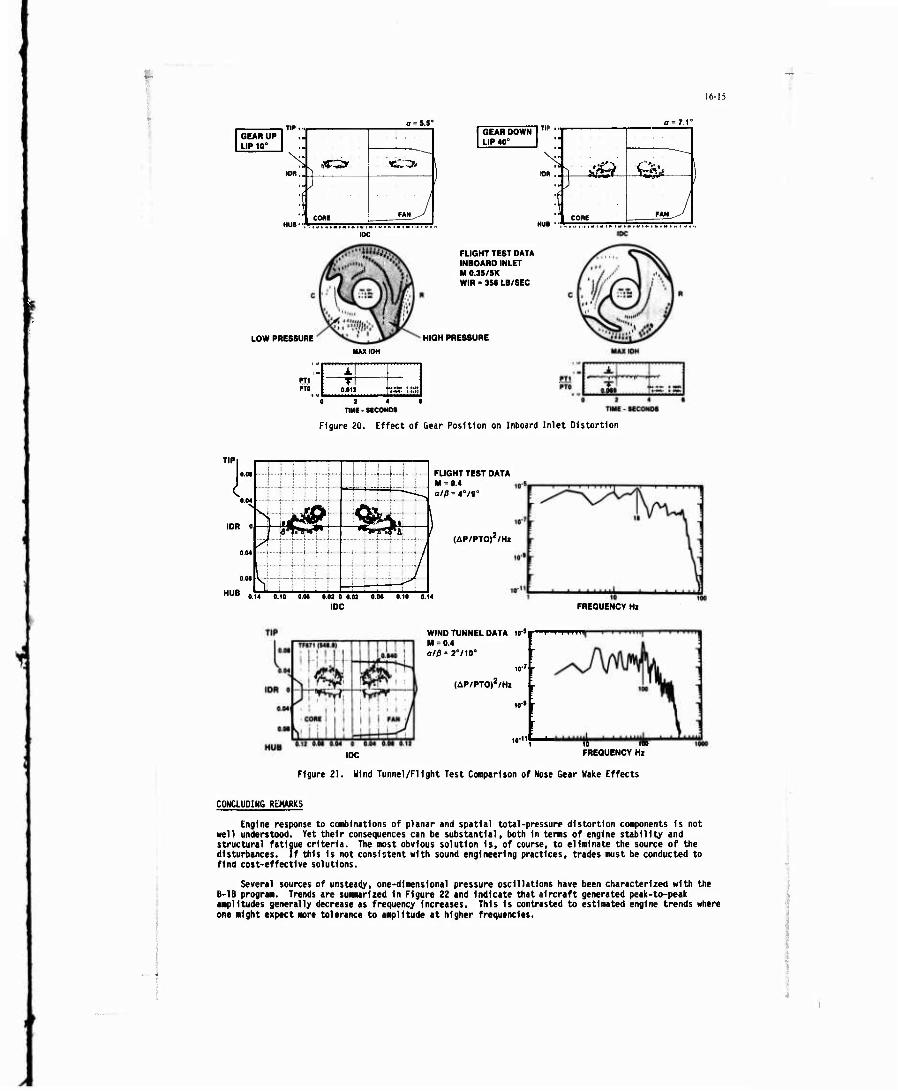
Differences In flight test distortion characteristics between extended and retracted gear positions during operation at 5,000 feet, mach 0.35, are shown In Figure 20. With the gear up. the cowl lip Is at 10 degrees, and with the gear dmn, the cowl lip Is at 40 degrees. Angle of attack varies between 5.5 and 7 degrees, and engine airflow Is mwlmum at 356 lb/sec. Extending the gear Introduces a planar component with a peak-to-peak amplitude of 0.069. Circumferential distortion never exceeds eight percent, and the low-pressure defect appears In the upper cowl-side portion of the engine face. On the other hand, retracting the gear eliminates the planar component, and decreasing the cowl lip angle to 10 degrees Increases circumferential distortion to approximately 11 percent. More radial distortion is evident, and the low pressure defect Is located In the lower cowl-side quadrant. Operating the cowl lip at 40 degrees when the gear Is down thus results In additional margin to accommodate potential Ingestion of planar components.
16-14
.
0.10
0.08 AP?"
I-Mz
0.06
AP PTO
0.04
0.02
• MAXIMUM ENGINE AIRFLOW INBOARD INLET
10' A .
10« 4% »Hl \ '
io-« \ .■10
V 10 IM
FREQUENCY - Hj.
^ ^-FLIGHT \ Sr TEST
®
WIND TUNNEL
®
rGEAR DOWN
®
GEAR UP
0.2 0.4 MACH NUMBER
6
fBEOUEHCY- Hz
Figure 18. Effect of Gear Wake Ingestion on Planar Distortion
16
ß 0 -16
1 2 3 TIME - MINUTES
FLIGHT TEST DATA M0.4/10KFT
i
IDCMAX
•12 -8 -4 0 4 8 12
SIDESLIP ANGLE, DEGREES
0.10 - O ENGINE POSITION NO. 1 A ENQINE POSITION NO. 2
•12 -8-4 0 4 8 12
SIDESLIP ANGLE, DEGREES
Figure 19. Nose Gear Wake Ingestion During Sideslip Operation
Hind tunnel and flight test distortion characteristics are compared In Figure 21. Test conditions were at mach 0.4, landing gear extended, with the aircraft (model) at 9 to 10 degrees sideslip and nominal angle of attack. Engine airflow was maximum at approximately 360 lb/sec. Differences In several distortion parameters are summarized In the table and are bOleved to be representative of the differences one should expect when comparing dynamic output of dynamic events.
FLIGHT TEST DATA INBOARD INLET M 0.3$/5K WIR « 35« LB/SEC
HIGH PRESSURE
[ ±1 | 0.011 ".IT S °1 ]
14« TIME-SECONDS
Figure 20. Effect of Gear Position on Inboard Inlet Distortion
IDR o
HUB
1
Niti r t m
FLIGHT TEST DATA M = 0.« alß = 4°/»°
(AP/PTOr/Hi
0.14 0.10 0.01 0.02 0 0.02 0.00 0.10 0.14
IDC FREQUENCY Hi
i WIND TUNNEL DATA lO1
M«(M alß = 2''/10°
(AP/PTOr/Hi
io« -
I I M IIM
IDC 10 100 FREQUENCY Hz
Figure 21. Wind Tunnel/Flight Test Comparison of Nose Gear Wake Effects
J
COWCLUDIMG REMARKS
Engine response to combinations of planar and spatial total-pressure distortion components is not well understood. Yet their consequences can be substantial, both In terms of engine stability and structural fatigue criteria. The most obvious solution is, of course, to eliminate the source of the disturbances. If this is not consistent with sound engineering practices, trades must be conducted to find cost-effective solutions.
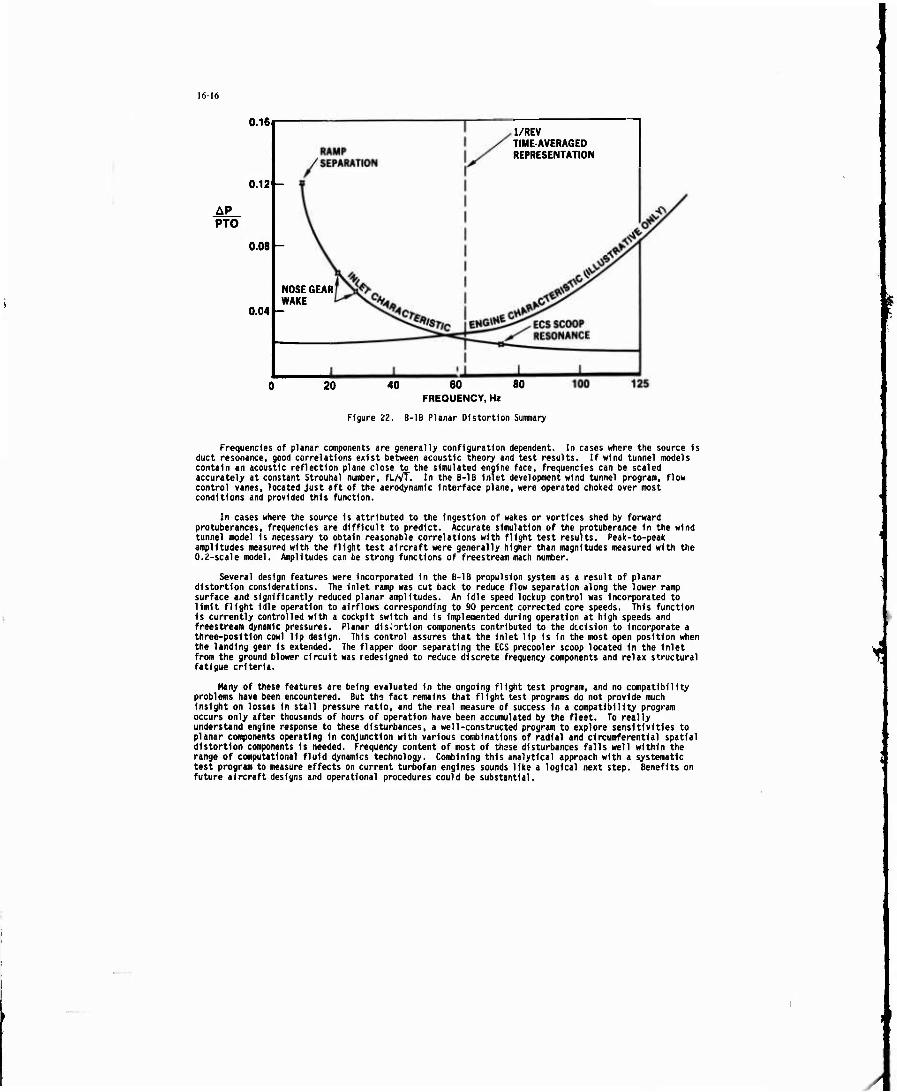
Several sources of unsteady, one-dimensional pressure oscillations have been characterized with the B-1B program. Trends are suMarized In Figure 22 and indicate that aircraft generated peak-to-peak amplitudes generally decrease as frequency increases. This 1$ contrasted to estimated engine trends where one might expect «ore tolerance to amplitude at higher frequencies.
16-16
AP PTO
0.16
0.12 -
0.08
0.04
NOSE GEAR WAKE
1/REV TIME-AVERAGED REPRESENTATION
60 80 FREQUENCY, Hz
20 40
Figure 22. B-1B Planar Distortion Summary
Frequencies of planar components are generally configuration dependent. In cases where the source Is duct resonance, good correlations exist between acoustic theory and test results. If wind tunnel models contain an acoustic reflection plane close to the simulated engine face, frequencies can be scaled accurately at constant Strouhal number, fL/VT. In the B-1B inlet development wind tunnel program, flow control vanes, located just aft of the aerodynamic Interface plane, were operated choked over most conditions and provided this function.
In cases where the source is attributed to the Ingestion of wakes or vortices shed by forward protuberances, frequencies are difficult to predict. Accurate simulation of the protuberance In the wind tunnel model is necessary to obtain reasonable correlations with flight test results. Peak-to-peak amplitudes measured with the flight test aircraft were generally higher than magnitudes measured with the 0.2-scale model. Amplitudes can be strong functions of freestream mach number.
Several design features were Incorporated In the B-1B propulsion system as a result of planar distortion considerations. The inlet ramp was cut back to reduce flow separation along the lower ramp surface and significantly reduced planar amplitudes. An Idle speed lockup control was Incorporated to limit flight Idle operation to airflows corresponding to 90 percent corrected core speeds. This function Is currently controlled with a cockpit switch and Is Implemented during operation at high speeds and freestream dynamic pressures. Planar distortion components contributed to the decision to incorporate a three-position cowl lip design. This control assures that the inlet lip is In the roost open position when the landing gear is extended. The flapper door separating the ECS precooler scoop located in the inlet from the ground blower circuit was redesigned to reduce discrete frequency components and relax structural fatigue criteria.
Many of these features are being evaluated in the ongoing flight test program, and no compatibility problems have been encountered. But the fact remains that flight test programs do not provide much Insight on losses in stall pressure ratio, and the real measure of success in a compatibility program occurs only after thousands of hours of operation have been accumulated by the fleet. To really understand engine response to these disturbances, a wel 1-constructed program to explore sensitivities to planar components operating In conjunction with various combinations of radial and circumferential spatial distortion components is needed. Frequency content of most of these disturbances falls well within the range of computational fluid dynamics technology. Combining this analytical approach with a systematic test program to measure effects on current turbofan engines sounds like a logical next step. Benefits on future aircraft designs and operational procedures could be substantial.
2. SAE AIR 1419, "Inlet Total-Pressure-Distortion Considerations for Gas Turbine Engines", Hay 1983
3. R. H. Johnson, NASA-CR-144864, "Comparison of Inlet Distortion from Flight and Wind Tunnel Tests", April 1978
4. Reynolds, G. G. and Steenken, W. G., AFAPL-TR-76-76, "Dynamic Digital Blade Row Compression Component Stability Model - Model Validation and Analysis of Planar Pressure Pulse Generator and Two-Stage Fan Test Data", August 1976
5. J. H. Wykes, et al, NASA-CR-144887, "Analyses and Test of the B-l Aircraft Structural Mode Control System", January 1980