1
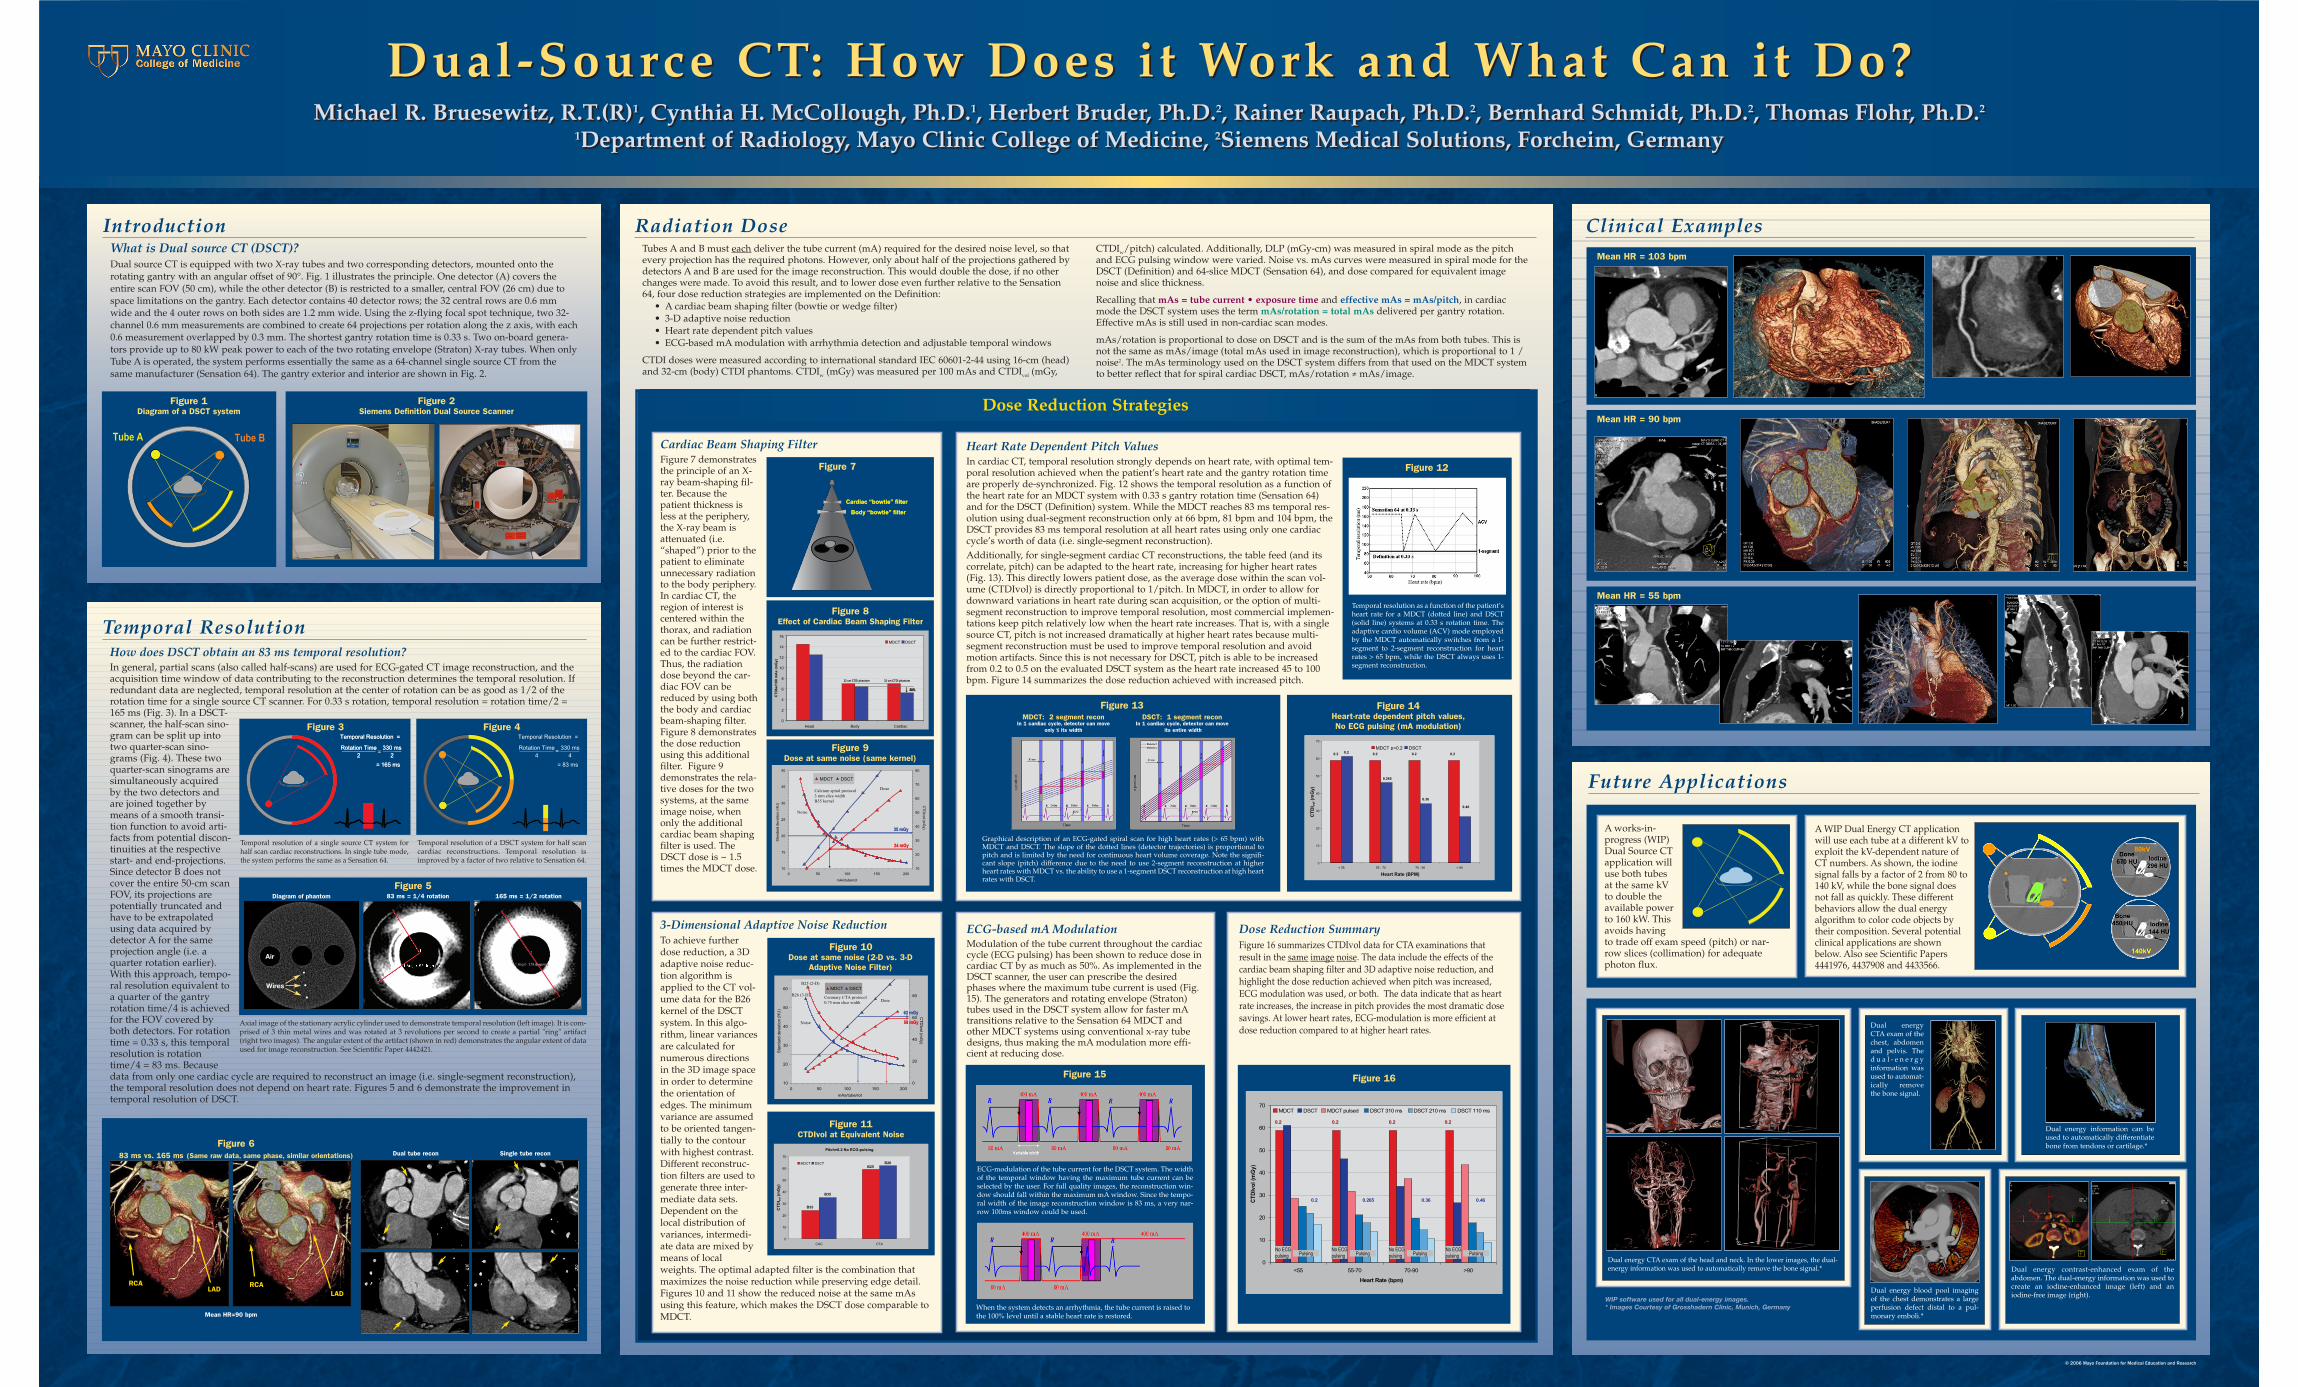
Dual-Source CT: How Does it Work and What Can it Do? Michael R. Bruesewitz, R.T.(R) 1 , Cynthia H. McCollough, Ph.D. 1 , Herbert Bruder, Ph.D. 2 , Rainer Raupach, Ph.D. 2 , Bernhard Schmidt, Ph.D. 2 , Thomas Flohr, Ph.D. 2 1 Department of Radiology, Mayo Clinic College of Medicine, 2 Siemens Medical Solutions, Forcheim, Germany Dual-Source CT: How Does it Work and What Can it Do? Michael R. Bruesewitz, R.T.(R) 1 , Cynthia H. McCollough, Ph.D. 1 , Herbert Bruder, Ph.D. 2 , Rainer Raupach, Ph.D. 2 , Bernhard Schmidt, Ph.D. 2 , Thomas Flohr, Ph.D. 2 1 Department of Radiology, Mayo Clinic College of Medicine, 2 Siemens Medical Solutions, Forcheim, Germany Tube B Tube A Figure 1 Diagram of a DSCT system Figure 2 Siemens Definition Dual Source Scanner Mean HR=90 bpm Figure 6 83 ms vs. 165 ms (Same raw data, same phase, similar orientations) Dual tube recon Single tube recon LAD RCA RCA LAD Clinical Examples Mean HR = 103 bpm Mean HR = 55 bpm Mean HR = 90 bpm A works-in- progress (WIP) Dual Source CT application will use both tubes at the same kV to double the available power to 160 kW. This avoids having to trade off exam speed (pitch) or nar- row slices (collimation) for adequate photon flux. A WIP Dual Energy CT application will use each tube at a different kV to exploit the kV-dependent nature of CT numbers. As shown, the iodine signal falls by a factor of 2 from 80 to 140 kV, while the bone signal does not fall as quickly. These different behaviors allow the dual energy algorithm to color code objects by their composition. Several potential clinical applications are shown below. Also see Scientific Papers 4441976, 4437908 and 4433566. © 2006 Mayo Foundation for Medical Education and Research Temporal Resolution How does DSCT obtain an 83 ms temporal resolution? In general, partial scans (also called half-scans) are used for ECG-gated CT image reconstruction, and the acquisition time window of data contributing to the reconstruction determines the temporal resolution. If redundant data are neglected, temporal resolution at the center of rotation can be as good as 1/2 of the rotation time for a single source CT scanner. For 0.33 s rotation, temporal resolution = rotation time/2 = 165 ms (Fig. 3). In a DSCT- scanner, the half-scan sino- gram can be split up into two quarter-scan sino- grams (Fig. 4). These two quarter-scan sinograms are simultaneously acquired by the two detectors and are joined together by means of a smooth transi- tion function to avoid arti- facts from potential discon- tinuities at the respective start- and end-projections. Since detector B does not cover the entire 50-cm scan FOV, its projections are potentially truncated and have to be extrapolated using data acquired by detector A for the same projection angle (i.e. a quarter rotation earlier). With this approach, tempo- ral resolution equivalent to a quarter of the gantry rotation time/4 is achieved for the FOV covered by both detectors. For rotation time = 0.33 s, this temporal resolution is rotation time/4 = 83 ms. Because data from only one cardiac cycle are required to reconstruct an image (i.e. single-segment reconstruction), the temporal resolution does not depend on heart rate. Figures 5 and 6 demonstrate the improvement in temporal resolution of DSCT. Introduction What is Dual source CT (DSCT)? Dual source CT is equipped with two X-ray tubes and two corresponding detectors, mounted onto the rotating gantry with an angular offset of 90°. Fig. 1 illustrates the principle. One detector (A) covers the entire scan FOV (50 cm), while the other detector (B) is restricted to a smaller, central FOV (26 cm) due to space limitations on the gantry. Each detector contains 40 detector rows; the 32 central rows are 0.6 mm wide and the 4 outer rows on both sides are 1.2 mm wide. Using the z-flying focal spot technique, two 32- channel 0.6 mm measurements are combined to create 64 projections per rotation along the z axis, with each 0.6 measurement overlapped by 0.3 mm. The shortest gantry rotation time is 0.33 s. Two on-board genera- tors provide up to 80 kW peak power to each of the two rotating envelope (Straton) X-ray tubes. When only Tube A is operated, the system performs essentially the same as a 64-channel single source CT from the same manufacturer (Sensation 64). The gantry exterior and interior are shown in Fig. 2. 83 ms = 1/4 rotation 165 ms = 1/2 rotation Figure 5 Diagram of phantom Air Wires = 165 ms Rotation Time 2 330 ms 2 Temporal Resolution = = 165 ms Rotation Time 2 330 ms 2 Temporal Resolution = = Figure 3 Temporal resolution of a single source CT system for half scan cardiac reconstructions. In single tube mode, the system performs the same as a Sensation 64. = 83 ms Rotation Time 4 330 ms 4 Temporal Resolution = = Figure 4 Temporal resolution of a DSCT system for half scan cardiac reconstructions. Temporal resolution is improved by a factor of two relative to Sensation 64. Axial image of the stationary acrylic cylinder used to demonstrate temporal resolution (left image). It is com- prised of 3 thin metal wires and was rotated at 3 revolutions per second to create a partial "ring" artifact (right two images). The angular extent of the artifact (shown in red) demonstrates the angular extent of data used for image reconstruction. See Scientific Paper 4442421. Dual energy CTA exam of the head and neck. In the lower images, the dual- energy information was used to automatically remove the bone signal.* Dual energy CTA exam of the chest, abdomen and pelvis. The dual-energy information was used to automat- ically remove the bone signal. Dual energy blood pool imaging of the chest demonstrates a large perfusion defect distal to a pul- monary emboli.* Dual energy contrast-enhanced exam of the abdomen. The dual-energy information was used to create an iodine-enhanced image (left) and an iodine-free image (right). Dual energy information can be used to automatically differentiate bone from tendons or cartilage.* WIP software used for all dual-energy images. * Images Courtesy of Grosshadern Clinic, Munich, Germany Radiation Dose Tubes A and B must each deliver the tube current (mA) required for the desired noise level, so that every projection has the required photons. However, only about half of the projections gathered by detectors A and B are used for the image reconstruction. This would double the dose, if no other changes were made. To avoid this result, and to lower dose even further relative to the Sensation 64, four dose reduction strategies are implemented on the Definition: • A cardiac beam shaping filter (bowtie or wedge filter) • 3-D adaptive noise reduction • Heart rate dependent pitch values • ECG-based mA modulation with arrhythmia detection and adjustable temporal windows CTDI doses were measured according to international standard IEC 60601-2-44 using 16-cm (head) and 32-cm (body) CTDI phantoms. CTDI w (mGy) was measured per 100 mAs and CTDI vol (mGy, CTDI w /pitch) calculated. Additionally, DLP (mGy-cm) was measured in spiral mode as the pitch and ECG pulsing window were varied. Noise vs. mAs curves were measured in spiral mode for the DSCT (Definition) and 64-slice MDCT (Sensation 64), and dose compared for equivalent image noise and slice thickness. Recalling that mAs = tube current • exposure time and effective mAs = mAs/pitch, in cardiac mode the DSCT system uses the term mAs/rotation = total mAs delivered per gantry rotation. Effective mAs is still used in non-cardiac scan modes. mAs/rotation is proportional to dose on DSCT and is the sum of the mAs from both tubes. This is not the same as mAs/image (total mAs used in image reconstruction), which is proportional to 1 / noise 2 . The mAs terminology used on the DSCT system differs from that used on the MDCT system to better reflect that for spiral cardiac DSCT, mAs/rotation ≠ mAs/image. Dose Reduction Strategies Cardiac Beam Shaping Filter Figure 7 demonstrates the principle of an X- ray beam-shaping fil- ter. Because the patient thickness is less at the periphery, the X-ray beam is attenuated (i.e. “shaped”) prior to the patient to eliminate unnecessary radiation to the body periphery. In cardiac CT, the region of interest is centered within the thorax, and radiation can be further restrict- ed to the cardiac FOV. Thus, the radiation dose beyond the car- diac FOV can be reduced by using both the body and cardiac beam-shaping filter. Figure 8 demonstrates the dose reduction using this additional filter. Figure 9 demonstrates the rela- tive doses for the two systems, at the same image noise, when only the additional cardiac beam shaping filter is used. The DSCT dose is ~ 1.5 times the MDCT dose. Body “bowtie” filter Body “bowtie” filter Cardiac “bowtie” filter Cardiac “bowtie” filter 0 2 4 6 8 10 12 14 16 Head Body Cardiac CTDIw/100 mAs (mGy) MDCT DSCT 32 cm CTDI phantom 32 cm CTDI phantom 20% 20% Figure 8 Effect of Cardiac Beam Shaping Filter Figure 7 10 15 20 25 30 35 40 0 50 100 150 200 mAs/tube/rot Standard deviation (HU) 10 20 30 40 50 60 70 80 CTDIvol (mGy) MDCT DSCT Noise Dose Calcium spiral protocol 3 mm slice width B35 kernel 24 mGy 24 mGy 35 mGy 35 mGy Figure 9 Dose at same noise (same kernel) Heart Rate Dependent Pitch Values In cardiac CT, temporal resolution strongly depends on heart rate, with optimal tem- poral resolution achieved when the patient’s heart rate and the gantry rotation time are properly de-synchronized. Fig. 12 shows the temporal resolution as a function of the heart rate for an MDCT system with 0.33 s gantry rotation time (Sensation 64) and for the DSCT (Definition) system. While the MDCT reaches 83 ms temporal res- olution using dual-segment reconstruction only at 66 bpm, 81 bpm and 104 bpm, the DSCT provides 83 ms temporal resolution at all heart rates using only one cardiac cycle’s worth of data (i.e. single-segment reconstruction). Additionally, for single-segment cardiac CT reconstructions, the table feed (and its correlate, pitch) can be adapted to the heart rate, increasing for higher heart rates (Fig. 13). This directly lowers patient dose, as the average dose within the scan vol- ume (CTDIvol) is directly proportional to 1/pitch. In MDCT, in order to allow for downward variations in heart rate during scan acquisition, or the option of multi- segment reconstruction to improve temporal resolution, most commercial implemen- tations keep pitch relatively low when the heart rate increases. That is, with a single source CT, pitch is not increased dramatically at higher heart rates because multi- segment reconstruction must be used to improve temporal resolution and avoid motion artifacts. Since this is not necessary for DSCT, pitch is able to be increased from 0.2 to 0.5 on the evaluated DSCT system as the heart rate increased 45 to 100 bpm. Figure 14 summarizes the dose reduction achieved with increased pitch. Figure 12 Temporal resolution as a function of the patient’s heart rate for a MDCT (dotted line) and DSCT (solid line) systems at 0.33 s rotation time. The adaptive cardio volume (ACV) mode employed by the MDCT automatically switches from a 1- segment to 2-segment reconstruction for heart rates > 65 bpm, while the DSCT always uses 1- segment reconstruction. Figure 13 Graphical description of an ECG-gated spiral scan for high heart rates (> 65 bpm) with MDCT and DSCT. The slope of the dotted lines (detector trajectories) is proportional to pitch and is limited by the need for continuous heart volume coverage. Note the signifi- cant slope (pitch) difference due to the need to use 2-segment reconstruction at higher heart rates with MDCT vs. the ability to use a 1-segment DSCT reconstruction at high heart rates with DSCT. MDCT: 2 segment recon In 1 cardiac cycle, detector can move only 1 ⁄ 2 its width DSCT: 1 segment recon In 1 cardiac cycle, detector can move its entire width 0 10 20 30 40 50 60 70 < 55 55 - 70 70 - 90 > 90 Heart Rate (BPM) CTDI vol (mGy) MDCT p=0.2 DSCT 0.2 0.2 0.2 0.2 0.2 0.265 0.36 0.46 Figure 14 Heart-rate dependent pitch values, No ECG pulsing (mA modulation) 3-Dimensional Adaptive Noise Reduction To achieve further dose reduction, a 3D adaptive noise reduc- tion algorithm is applied to the CT vol- ume data for the B26 kernel of the DSCT system. In this algo- rithm, linear variances are calculated for numerous directions in the 3D image space in order to determine the orientation of edges. The minimum variance are assumed to be oriented tangen- tially to the contour with highest contrast. Different reconstruc- tion filters are used to generate three inter- mediate data sets. Dependent on the local distribution of variances, intermedi- ate data are mixed by means of local weights. The optimal adapted filter is the combination that maximizes the noise reduction while preserving edge detail. Figures 10 and 11 show the reduced noise at the same mAs using this feature, which makes the DSCT dose comparable to MDCT. 10 20 30 40 50 60 0 50 100 150 200 mAs/tube/rot Standard deviation (HU) 0 20 40 60 80 CTDIvol (mGy) MDCT DSCT Noise Dose Coronary CTA protocol 0.75 mm slice width B25 (2-D) B26 (3-D) 59 mGy 59 mGy 62 mGy 62 mGy Figure 10 Dose at same noise (2-D vs. 3-D Adaptive Noise Filter) Pitch=0.2 No ECG-pulsing 0 10 20 30 40 50 60 70 CAC CTA CTDI vol (mGy) MDCT DSCT B35 B35 B25 B26 Figure 11 CTDIvol at Equivalent Noise Future Applications Dose Reduction Summary Figure 16 summarizes CTDIvol data for CTA examinations that result in the same image noise . The data include the effects of the cardiac beam shaping filter and 3D adaptive noise reduction, and highlight the dose reduction achieved when pitch was increased, ECG modulation was used, or both. The data indicate that as heart rate increases, the increase in pitch provides the most dramatic dose savings. At lower heart rates, ECG-modulation is more efficient at dose reduction compared to at higher heart rates. Figure 16 0 10 20 30 40 50 60 70 <55 55-70 70-90 >90 Heart Rate (bpm) MDCT DSCT MDCT pulsed DSCT 310 ms DSCT 210 ms DSCT 110 ms 0.2 0.2 0.2 0.2 0.2 0.265 0.36 0.46 No ECG pulsing No ECG pulsing No ECG pulsing No ECG pulsing Pulsing Pulsing Pulsing Pulsing CTDIvol (mGy) ECG-based mA Modulation Modulation of the tube current throughout the cardiac cycle (ECG pulsing) has been shown to reduce dose in cardiac CT by as much as 50%. As implemented in the DSCT scanner, the user can prescribe the desired phases where the maximum tube current is used (Fig. 15). The generators and rotating envelope (Straton) tubes used in the DSCT system allow for faster mA transitions relative to the Sensation 64 MDCT and other MDCT systems using conventional x-ray tube designs, thus making the mA modulation more effi- cient at reducing dose. Figure 15 When the system detects an arrhythmia, the tube current is raised to the 100% level until a stable heart rate is restored. ECG-modulation of the tube current for the DSCT system. The width of the temporal window having the maximum tube current can be selected by the user. For full quality images, the reconstruction win- dow should fall within the maximum mA window. Since the tempo- ral width of the image reconstruction window is 83 ms, a very nar- row 100ms window could be used.