Dubai Population Bulletin 2007 1 – Population in Dubai 1.1. Population Size (1) Population in Dubai in 2007 is estimated at 1,529,792, of which 1,164,576 are males (76.13%) and 365,216 are females (23.87%). This difference in proportion between males and females (319 males for 100 females) is due to the large number of male labourers who have entered the emirate without their family members as shown in the following table: Gender Population % Male 1,164,576 76.13 Female 365,216 23.87 Total 1,529,792 100 Table (1): Population by Gender - 2007 (2) 1.2. Estimate of Active Individuals During the Day The daily number of active individuals in Dubai is estimated at 1,890,586 which includes residents, workers commuting from outside the emirate, and the average number of tourists and sailors. This daily increase in population is due to: • Availability of various investment opportunities in Dubai which necessitate the daily movement of people from other emirates to manage their own businesses or to work for others. • Residency of proportion of both Dubai public and private sectors employees in neighbouring emirates due to shortage of unoccupied housing units in Dubai and cheaper accommodation cost in these neighbouring emirates. Table (2): Active Individuals’ Movement During the Day in Dubai - 2007 Description Total Number of Population Permanently residing in Dubai (2) 1,529,792 Workers Residing Outside & Temporary Residents (3) 360,794 Total Active Individuals During the Day 1,890,586 1
Transcript
Dubai PopulationBulletin 2007
1 – Population in Dubai
1.1. Population Size(1)
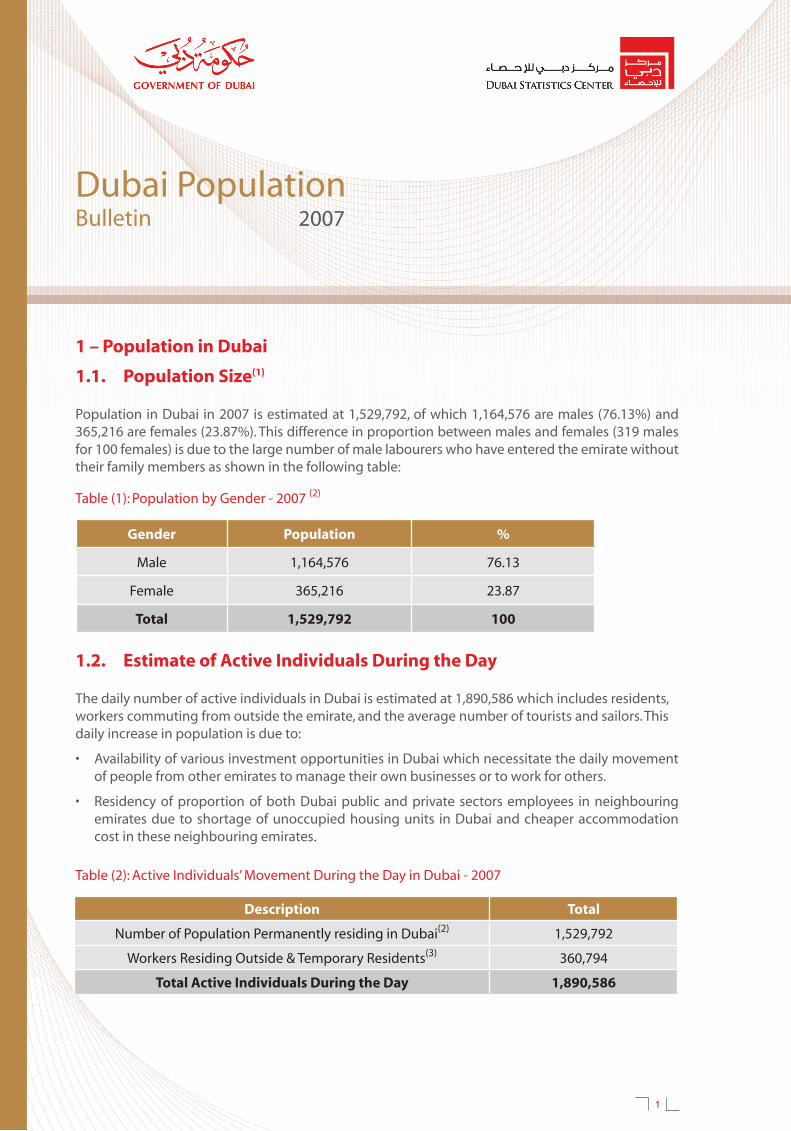
Population in Dubai in 2007 is estimated at 1,529,792, of which 1,164,576 are males (76.13%) and 365,216 are females (23.87%). This difference in proportion between males and females (319 males for 100 females) is due to the large number of male labourers who have entered the emirate without their family members as shown in the following table:
Gender Population %
Male 1,164,576 76.13
Female 365,216 23.87
Total 1,529,792 100
Table (1): Population by Gender - 2007 (2)
1.2. Estimate of Active Individuals During the Day The daily number of active individuals in Dubai is estimated at 1,890,586 which includes residents, workers commuting from outside the emirate, and the average number of tourists and sailors. This daily increase in population is due to:
• AvailabilityofvariousinvestmentopportunitiesinDubaiwhichnecessitatethedailymovementof people from other emirates to manage their own businesses or to work for others.
• ResidencyofproportionofbothDubaipublicandprivatesectorsemployees inneighbouringemirates due to shortage of unoccupied housing units in Dubai and cheaper accommodation cost in these neighbouring emirates.
2. Distribution of Permanent Residents by Age Groups
The (30-34) age group has the highest number of individuals 298,371 which represents 19.50% of total population, followed by the (25-29) age group with 297,833 individuals and a percentage of 19.47% of total population.
Moreover, the (35-39) age group comes in the third place with 227,928 individuals and a percentage of 14.90% of total population. The high number of individuals in those three age groups can be explained by the increasing number of expatriate labour workers that is caused by the accelerated economic growth of Dubai.
Age group Male Female Total %0-4 33,043 29,274 62,317 4.07
5-9 34,420 29,779 64,199 4.20
10-14 30,140 25,637 55,777 3.65
15-19 27,165 22,585 49,750 3.25
20-24 111,071 44,987 156,058 10.20
25-29 241,534 56,299 297,833 19.47
30-34 245,451 52,920 298,371 19.50
35-39 188,523 39,405 227,928 14.90
40-44 115,572 26,732 142,304 9.30
45-49 68,181 16,284 84,465 5.52
50-54 40,190 10,392 50,582 3.31
55-59 17,742 4,974 22,716 1.48
60-64 6,240 2,572 8,812 0.58
65-69 2,281 1,346 3,627 0.24
70-74 1,394 1,003 2,397 0.16
75+ 1,629 1,027 2,656 0.17
Total 1,164,576 365,216 1,529,792 100.00
3 www.dsc.gov.ae
3. Population Distribution by Sector Dubaiisdividedinto9sectorsofwhich1to6areurbanand7to9arerural.Inlightofthepopulationdistribution according to main sectors in 2007, it is clear that the highest population concentration is in sector 3 with 593,138 residents and 38.77% of total population, followed by sector 2 with a concentration of 401,592 residents and 26.25%, while sector 1 comes in the third place with 318,568 residentsand20.82%oftotalpopulation.Inaddition,theruralpopulation(sector7to9)has18,369residents and 1.2% of total population as shown in the table below:
Table (4): Population by Sectors – 2007 (4)
Population (000)
Ag
eG
rou
p
Females
Chart (2): Population Pyramid for Dubai – 2007
Males
Sector Total %
Sector(1) 318,568 20.82
Sector(2) 401,592 26.25
Sector(3) 593,138 38.77
Sector(4) 12,157 0.8
Sector(5) 149,454 9.77
Sector(6) 36,514 2.39
Total Urban 1,511,423 98.8
Sector(7) 3,828 0.25
Sector(8) 11,011 0.72
Sector(9) 3,530 0.23
Total Rural 18,369 1.2
Total population 1,529,792 100
4www.dsc.gov.ae
4. Distribution of Population by Community
Asdescribedintable(5)below,AlMuhaisanahsecond(264)hasthehighestnumberofpopulationwith 202,049 individuals that represents 13.21% of Dubai population. This community is followed by AlQuzIndustrialsecond(365)with82,584individualsandapercentageof5.40%.Moreover,JebalAli(500)comesinthethirdplacewithapopulationsizeof75,284individualsandapercentageof4.92%precedingtheJebalAliIndustrial(599)thathasapopulationof68,698individualsandapercentageof4.49%.ThesefourDubaicommunitiestogetherhaveapopulationsizeof428,615individualsandrepresent28.02%ofthetotalpopulationsizeofDubai.Thoselaterfigurescanbeexplainedbythepresence of several labor accommodation camps in the above mentioned communities.
Table (5): Population By Community 2007 (4)
Community No. Community Name Population %
111 - 918 0.06
112 ALRASS 8,906 0.58
113 ALDHAGAYA 13,321 0.87
114 ALBUTEEN 3,577 0.23
115 ALSABKHA 3,064 0.20
116 AYALNASIR 17,040 1.11
117 ALMURAR 27,081 1.77
118 NAIF 39,898 2.61
119 ALREGA 8,440 0.55
122 ALBARAHA 14,992 0.98
123 ALMUTEENA 25,415 1.66
124 ALMURQABAT 41,154 2.69
125 REGAALBUTEEN 2,621 0.17
126 ABUHAIL 21,307 1.39
127 HORALANZ 47,849 3.13
128 ALKHBEESI 1,376 0.09
129 PORTSAEED 6,764 0.44
131 ALHAMRIYAPORT 135 0.01
132 ALWAHEDA 16,801 1.10
133 HORALANZEAST 13,691 0.89
134 ALMAMZER 4,215 0.28
213 NADSHAMMA 1,504 0.10
214 ALGARHOUD 8,510 0.56
215 UMRAMOOL 2,066 0.14
216 ALRASHIDIYA 29,118 1.90
221 DUBAIAIRPORT(5) 12 0
226 ALTWARFIRST 10,531 0.69
227 ALTWARSECOND 3,899 0.25
228 ALTWARTHIRD 6,630 0.43
231 ALNAHDAFIRST 1,983 0.13
232 ALQUSAISFIRST 31,746 2.08
233 ALQUSAISSECOND 9,267 0.61
234 ALQUSAISTHIRD 8,351 0.55
241 ALNAHDASECOND 5,654 0.37
242 ALQUSAISIND.FIRST 3,284 0.21
5 www.dsc.gov.ae
Continue Table 5
Community No. Community Name Population %
243 ALQUSAISIND.SECOND 3,526 0.23
244 MUHAISANAHTHIRD 2,767 0.18
245 MUHAISANAHFOURTH 21,298 1.39
246 ALQUSAISIND.THIRD 1,806 0.12
247 ALQUSAISIND.FOURTH 1,024 0.07
248 ALQUSAISINDFIFTH(5) 23 0
251 MURDAF 21,287 1.39
252 MUSHRAIFPARK(5) 75 0
261 MUHAISANAHFIRST 5,122 0.33
262 ALMEZHARFIRST 8,510 0.56
263 ALMEZHARSECOND 5,681 0.37
264 MUHAISANAHSECOND 202,049 13.21
265 OUDALMUTEEN 1,216 0.08
271 WADIALAMRADI 1,189 0.08
281 ALKHAWANEEJONE 1,166 0.08
282 ALKHAWANEEJTWO 1,375 0.09
283 ALAYAS 923 0.06
311 ALSHANDAGA(5) 9 0
312 ALSUQALKABEER 35,258 2.30
313 ALHAMRIYA 20,870 1.36
314 UMHURAIRFIRST 2,730 0.18
315 UMHURAIRSECOND 2,612 0.17
316 ALRAFFA 24,813 1.62
317 ALMANKHOOL 25,839 1.69
318 ALKARAMA 60,565 3.96
319 OUDMETHA 7,041 0.46
321 ALMINA 8,002 0.52
322 ALHUDAIBA 6,691 0.44
323 ALJAFLIYA 13,148 0.86
325 ZAABEELFIRST 2,034 0.13
326 ALJADAF 606 0.04
332 JUMEIRAFIRST 12,549 0.82
333 ALBADA 26,822 1.75
334 ALSATWA 42,785 2.80
335 TRADECENTERFIRST 10,947 0.72
336 TRADECENTERSECOND 5,107 0.33
337 ZAABEELSECOND 2,041 0.13
342 JUMEIRASECOND 5,905 0.39
343 ALWASL 16,550 1.08
6www.dsc.gov.ae
Community No. Community Name Population %
345 - 201 0.01
352 JUMEIRATHIRD 7,935 0.52
353 ALSAFFAFIRST 5,413 0.35
354 ALGOZEFIRST 12,467 0.81
355 ALGOZESECOND 695 0.05
356 UMSUQAIMFIRST 8,706 0.57
357 ALSAFFASECOND 4,185 0.27
362 UMSUQAIMSECOND 8,710 0.57
363 ALMANARA 4,272 0.28
364 ALGOZEIND.FIRST 15,624 1.02
365 ALGOZEIND.SECOND 82,584 5.40
366 UMSUQAIMTHIRD 4,931 0.32
367 UMALSHEIF 2,085 0.14
368 ALGOZEIND.THIRD 16,028 1.05
369 ALGOZEIND.FOURTH 24,692 1.61
372 ALSAFOUHFIRST 1,665 0.11
373 ALBARSHAAFIRST 10,409 0.68
375 ALBARSHAATHIRD 5,575 0.36
376 ALBAESHAASECOND 6,807 0.44
382 ALSOFOUHSECOND 2,965 0.19
383 V.RABIESAHRA'A 7,577 0.50
384 JEBELALIHORSERACING 84 0.01
388 EMIRATEHILLSSECOND 3,456 0.23
392 ALMINAALSEYAHI 6,098 0.40
393 EMIRATEHILLSFIRST 671 0.04
394 EMIRATEHILLSTHIRD 16,380 1.07
411 RASALKHOR 443 0.03
416 NADALHAMAR 6,891 0.45
421 ALWARQAAFIRST 760 0.05
422 ALWARQAASECOND 3,009 0.20
423 ALWARQAATHIRD 1,054 0.07
500 JEBELALI(5) 75,284 4.92
597 DUBAIINVESTMENTPARK2 36 0
598 DUBAIINVESTMENTPARK1 5,436 0.36
599 JABALALIINDUSTRIAL 68,698 4.49
600 NADALSHIBBA 1,183 0.08
611 BUKADRA(5) 7 0
612 RASALKHORIND.FIRST 4,961 0.32
613 RASALKHORIND.SECOND 2,633 0.17
Continue Table 5
7 www.dsc.gov.ae
Community No. Community Name Population %
614 RASALKHORIND.THIRD 10,440 0.68
615 NADALSHIBBASECOND 863 0.06
617 NADALSHIBBAFOURTH(5) 17 0
621 WARSANFIRST 11,188 0.73
622 WARSANSECOND 3,197 0.21
664 ARABIANRANCHES 2,025 0.13
711 ALAWEERONE 1,751 0.11
721 ALAWEERTWO 2,077 0.14
800 LEHBAB/RAWIYAH/MURGAM/MURGAB 4,068 0.27
891 HATTA 6,943 0.45
900 RASALKHORIND.THIRD 3,530 0.23
Total 1,529,792 100
Continue Table 5
(1) Population are all individuals living within the geographical boundaries of the Emirate whether they have citizenship or were resident based on the periodic population census or population projections.
(2) Estimated, based on the annual population growth rate (7.32%) between two censuses (2000 - 2005).
(3) Includes a percentage of federal and local government, and private sector employees who resides outside the Emirate plus the average number of tourist and sailors.