29
DUBAI REAL ESTATE MARKET OVERVIEW Q1 2016 REAL ESTATE SERVICES
DUBAI REAL ESTATE MARKET OVERVIEW
Q1 2016
REAL ESTATE SERVICES

2
Average apartment rents declined by 2% quarter-on-quarter and 5% year-on-year while villa rents dropped by 3% Q-on-Q and 7% Y-on-Y.
Sales prices witnessed a marginal decline of 1% for both apartments and villas during this quarter. While Y-on-Y apartments witnessed a 9% decline and villas 8% decline, leading to improvement in net yields during Q1 2016.
The off-plan residential market remained active with the launch of several new projects offering over 4,000 residential units (villas and apartments).
Increasing incentives from developers in the form of extended payment plans and waiving of property registration fees are enticing investors and occupiers alike.
Approximately 2,900 new residential units (apartments and villas) were added to the residential market during the quarter, taking total residential stock to c.484,000 units.
Demand for affordable and mid-tier properties remained strong during the quarter, as investors seek net returns of 8-9% and above, which were possible to achieve in secondary and tertiary locations. Whilst gross yields in prime areas remained stable at circa 6-7% during the last quarter.
During the first three months of 2016, 1.34 million sq.ft. of new space completed, taking the total office supply to 92 million sq.ft. Of the total new office space that entered during the quarter, 56% remained strata title owned and the remaining single owned.
Prime office rents have remained stable, whilst the secondary office market became increasingly fragmented, with rents varying from as low as AED55 per sq.ft. per annum up to AED200 per sq.ft. per annum.
Office sales rates declined by 3% quarter on quarter and 13% year on year. New supply, existing vacant space and weak demand all contributed to average sale rates dropping by 17% in Jumeirah Lakes Towers and 20% year on year in the Business Bay area.
The total retail supply of Dubai reached 35.6 million sq.ft. of GLA with the addition of c.GLA 800,000 sq.ft. spread across three retail centres viz. The Mall, City Centre Sindagah and City Walk Phase 2 which opened during the quarter.
Overall rental rates remained stable across the Emirate, with leading operators such as Emaar strengthening their operations to deliver increased profits by 22%.
Dubai’s hospitality stock rose by 1 % from the previous quarter, with an addition of 1,437 new hotel rooms and apartments during Q1 2016, taking the total hotel room count to circa 98,150 rooms and apartments.
Hotel performance indicators showed a drop in average ADR by 8%, since the beginning of the year, while occupancy rates remained at 80+% which is still high in comparison to other international markets.
FOREWORD ADIB Real Estate Services comprises a comprehensive real estate banking and advisory platform providing the full range of professional services from a single provider. Our services include:-
�� Real estate financing�� Strategic development advisory�� Investment advisory�� Asset management�� Project management
�� Valuation�� Agency�� Market research�� Property management�� Facilities management
REPORT HIGHLIGHTS

3
CONTENTSDemand Drivers 4
Macro Trends 6
Residential Sector 8
Project Focus 15
Office Sector 18
Retail Sector 21
Hospitality Sector 23
Definitions & Methodology 25
Contact Information 26
Supply - Photo Gallery 27
Development Location Map 29
MPM PROPERTIES FACTS AND FIGURES
TOTAL UAE STAFF PROPERTY MANAGEMENT STAFF ADVISORY STAFF
UNITS UNDER MANAGEMENT
LEASING & SALES STAFF LANDLORD CLIENTS
COMBINED MARKET VALUE OF PROPERTIES VALUED SINCE JANUARY 2012
MORTGAGE VALUATIONS SINCE JANUARY 2012
DEDICATED VALUATION PROFESSIONALS
OCCUPANCY RATE
LARGEST ABU DHABI MAINLAND PORTFOLIO
160+
7,600+
No.1
98.5%20+
30+
90bn
35+
23,500+
95+
1,700
REAL ESTATE SERVICES | DUBAI REAL ESTATE MARKET OVERVIEWQ1 2016
4
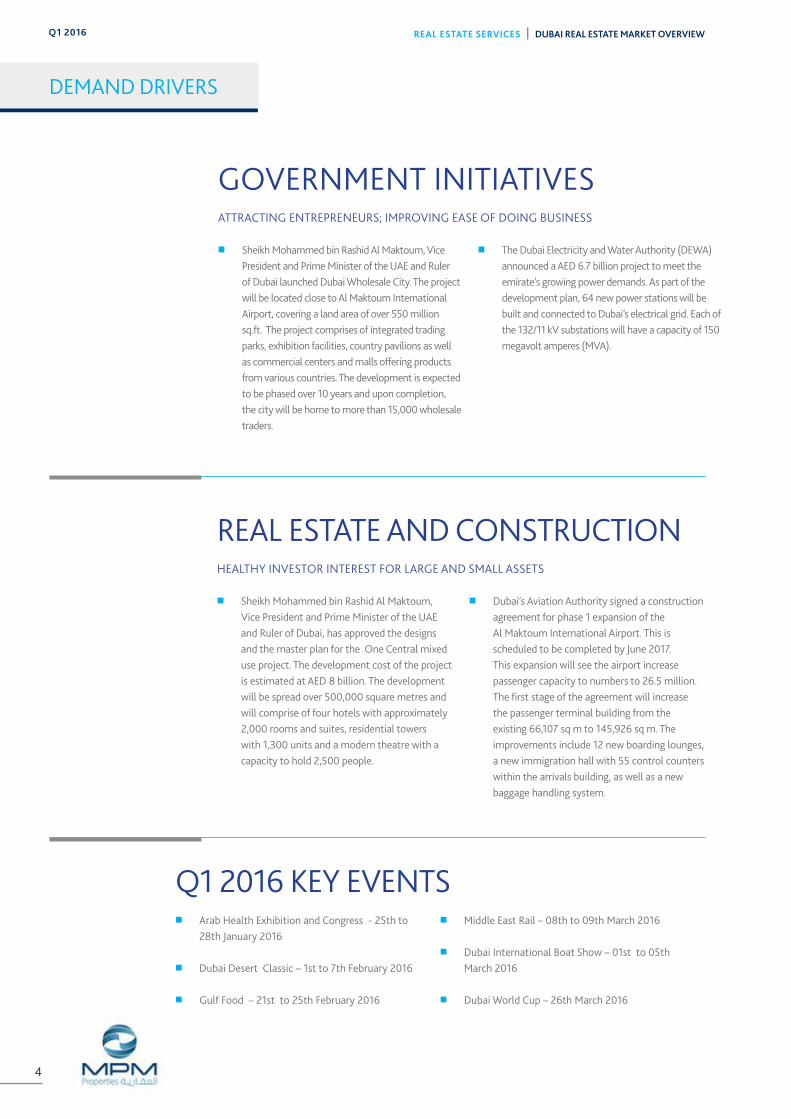
DEMAND DRIVERS
REAL ESTATE AND CONSTRUCTIONHEALTHY INVESTOR INTEREST FOR LARGE AND SMALL ASSETS
�� Sheikh Mohammed bin Rashid Al Maktoum, Vice President and Prime Minister of the UAE and Ruler of Dubai, has approved the designs and the master plan for the One Central mixed use project. The development cost of the project is estimated at AED 8 billion. The development will be spread over 500,000 square metres and will comprise of four hotels with approximately 2,000 rooms and suites, residential towers with 1,300 units and a modern theatre with a capacity to hold 2,500 people.
�� Dubai’s Aviation Authority signed a construction agreement for phase 1 expansion of the Al Maktoum International Airport. This is scheduled to be completed by June 2017. This expansion will see the airport increase passenger capacity to numbers to 26.5 million. The first stage of the agreement will increase the passenger terminal building from the existing 66,107 sq m to 145,926 sq m. The improvements include 12 new boarding lounges, a new immigration hall with 55 control counters within the arrivals building, as well as a new baggage handling system.
Q1 2016 KEY EVENTS�� Arab Health Exhibition and Congress - 25th to
28th January 2016
�� Dubai Desert Classic – 1st to 7th February 2016
�� Gulf Food – 21st to 25th February 2016
�� Middle East Rail – 08th to 09th March 2016
�� Dubai International Boat Show – 01st to 05th March 2016
�� Dubai World Cup – 26th March 2016
GOVERNMENT INITIATIVESATTRACTING ENTREPRENEURS; IMPROVING EASE OF DOING BUSINESS
�� Sheikh Mohammed bin Rashid Al Maktoum, Vice President and Prime Minister of the UAE and Ruler of Dubai launched Dubai Wholesale City. The project will be located close to Al Maktoum International Airport, covering a land area of over 550 million sq.ft. The project comprises of integrated trading parks, exhibition facilities, country pavilions as well as commercial centers and malls offering products from various countries. The development is expected to be phased over 10 years and upon completion, the city will be home to more than 15,000 wholesale traders.
�� The Dubai Electricity and Water Authority (DEWA) announced a AED 6.7 billion project to meet the emirate’s growing power demands. As part of the development plan, 64 new power stations will be built and connected to Dubai’s electrical grid. Each of the 132/11 kV substations will have a capacity of 150 megavolt amperes (MVA).

REAL ESTATE SERVICES | DUBAI REAL ESTATE MARKET OVERVIEW Q1 2016
5
TOURISM INITIATIVES �� Figures from the Department of Tourism and
Commerce Marketing (Dubai Tourism) indicate a 5.1% rise in overnight visitors to Dubai in Q1 2016 versus the same quarter the year before. In Q1 2016, Dubai welcomed 4.1 million overnight visitors with 25% of the visitors originating from GCC countries and 23% from Western European countries. In terms of top source market, Saudi Arabia leads with 476,000 visitors followed by India with 467,000 visitors and United Kingdom remained third with 334,000 visitors.
�� The Green Planet ‘bio dome’ is set to open in
the City Walk retail area in Jumeirah. The project includes a bio-dome to recreate a tropical forest in an enclosed ecosystem and will house over 3,000 plants and animals. It will also house exhibitions and displays under the roof of the bio-dome.
�� IMG Worlds of Adventure, a mega-themed leisure and entertainment destination spread across 1.5 million square feet in the Dubailand area, is set to open on the 15th August 2016. The US$ one billion fully indoor project comprises of four zones of Cartoon Network, Marvel, the Lost Valley-Dinosaur Adventure and IMG Boulevard.
TRANSPORTATION IMPROVING ACCESSIBILITY AND REACH IN DUBAI; CREATING JOBS
�� Dubai International Airport handled 7.2 million passengers in March 2016, up by 7.4% compared to 6.7 million passengers in March 2015. During Q1 2016, passenger traffic increased by 6.8% to 20.95 million passengers, up from 19.61 million passengers during the same period last year.
�� The Roads and Transport Authority (RTA) widened a seven kilometre stretch of Sheikh Mohammed bin Zayed Road, which opened during Q1 2016, with the number of lanes having increased to six in each direction between Al Maktoum
International Airport roundabout to Jebel Ali-Lehbab roundabout.
�� Figures from the Road and Transport Authority (RTA) indicate public transport’s share of all means of transport reached 15% as compared to 6% in 2006. The RTA aims to increase this figure to 20% by 2020 and 30% by 2030. Passenger journeys on the metro red and green lines recorded a 8.7% growth year-on-year with 164.3 million journeys in 2014 versus 178.6 million journeys in 2015.
FREEZONES SIGNING UP NEW TENANTS; CREATING EMPLOYMENT OPPORTUNITIES
�� Ahli United Bank Limited (AUBL) started operations at Dubai International Financial (DFSA) Centre. It received a Category 1 license from the DFSA. Through its office is in DIFC, the Bank will provide corporate banking, private banking, wealth management, trade finance, treasury and cross-border financial products and services to its client based in the UAE and wider Middle East Region.
�� Jebel Ali Free Zone (JAFZA) reported a 7% YoY growth in companies within the pharmaceutical and healthcare sector with the number of companies rising from 238 in 2014 to 255 companies in 2015. Leading pharmaceutical
companies have set up bases in JAFZA to serve and access emerging market such as Africa, Asia, Russia and the CIS and benefit from the infrastructure and trade benefits offered by the JAFZA freezone.
�� Energetics, a leading American energy and management consultancy that worked for over 35 years with the US Department of Energy, has joined Dubai Science Park. From its new base in Dubai, the company will help Dubai achieve its Clean Energy Strategy 2050, as well as provide high-quality advisory support to clients within the MENA region.

REAL ESTATE SERVICES | DUBAI REAL ESTATE MARKET OVERVIEWQ1 2016
6
MACRO TRENDS
DUBAI POPULATION (GROWTH & HOUSEHOLD SIZE)
Population Growth Rate
2009
1.77
1.9
1
2.0
0
2.1
1
2.1
1
2.3
3
2.3
9
2.4
9
2010 2011 2012 2013 2014 Q1 20162015
3.0
2.5
2.0
1.5
1.0
0.5
0
8.0
7.0
6.0
5.0
4.0
3.0
2.0
1.0
0PO
PU
LA
TIO
N (
MIL
LIO
NS
)
GR
OW
TH
RA
TE
(%
PA
)
AN
D H
OU
SE
HO
LD
SIZ
E
Household Size
Source: Dubai Statistics Center
DUBAI CONSTRUCTIONACTIVITY %YoY
GDP Construction
%Y
oY
DUBAI CPI VS RENTALCONTRIBUTION TO CPI Q1 2016
CPIHousingContributionto CPISource: Dubai Statistics Center, IMF
Source: Dubai Statistics Center
20
06
20
07
20
08
20
09
20
10
20
11
20
12
20
13
20
14
20
15
20
16e
115.00
110.00
105.00
100.00
95.00
90.00
85.00
JA
N 1
2
JA
N 1
3
JA
N 1
4
JA
N 1
5
JA
N 1
6
30.0%
20.0%
10.0%
0.0%
-10.0%
-20.0%
-30.0%
Source: Dubai Statistics Center, IMF and MPM Properties Research
DUBAI GDP SHARE BREAKDOWN BY ECONOMIC SECTORS - 2016 YTD

REAL ESTATE SERVICES | DUBAI REAL ESTATE MARKET OVERVIEW Q1 2016
7
INVESTOR ANALYSIS
Sales Transactions
Tra
nsa
cti
on
s
Valu
e (
in M
illio
ns)
DUBAI LAND TRANSACTIONSVOLUME vs VALUE
DUBAI LAND TRANSACTIONSQoQ% CHANGE
Sales Value
Sales Transactions
Q1
4,000
2,000
0
6,000
8,000
10,000
12,000
0
5,000
10,000
15,000
20,000
25,000
30,00080%
60%
40%
20%
0%
-20%
-40%
2012 2013 2014
Q2 Q3 Q4 Q1 Q2 Q3 Q4 Q1
2015 16
Q2 Q3 Q4 Q1 Q1 Q2 Q3 Q4 Q1
2012 2013 2014
Q2 Q3 Q4 Q2 Q3 Q4 Q1 Q2 Q3 Q4 Q1
2015
Q2 Q3 Q4 Q1 Q1
16
Source: DLD and MPM Properties Research Source: DLD and MPM Properties Research
TOP NATIONALITIES INVESTING IN DUBAI PROPERTY IN 2015
Tra
nsa
cti
on
Valu
eA
ED
mill
ion
TOP LOCATIONS - RESIDENTIAL TRANSACTION VALUE
Q1 2016 Q4 2015
Source: DLD
1,200
1,000
800
600
400
200
0
Valu
e (
AE
D' B
illio
ns)
0
5
10
15
20
25
30
QatarJordanKuwaitCanadaIranPakistanSaudiArabia
UnitedKingdom
IndiaUAE
Source: DLD
REAL ESTATE SERVICES | DUBAI REAL ESTATE MARKET OVERVIEWQ1 2016
8
RESIDENTIAL SECTOR
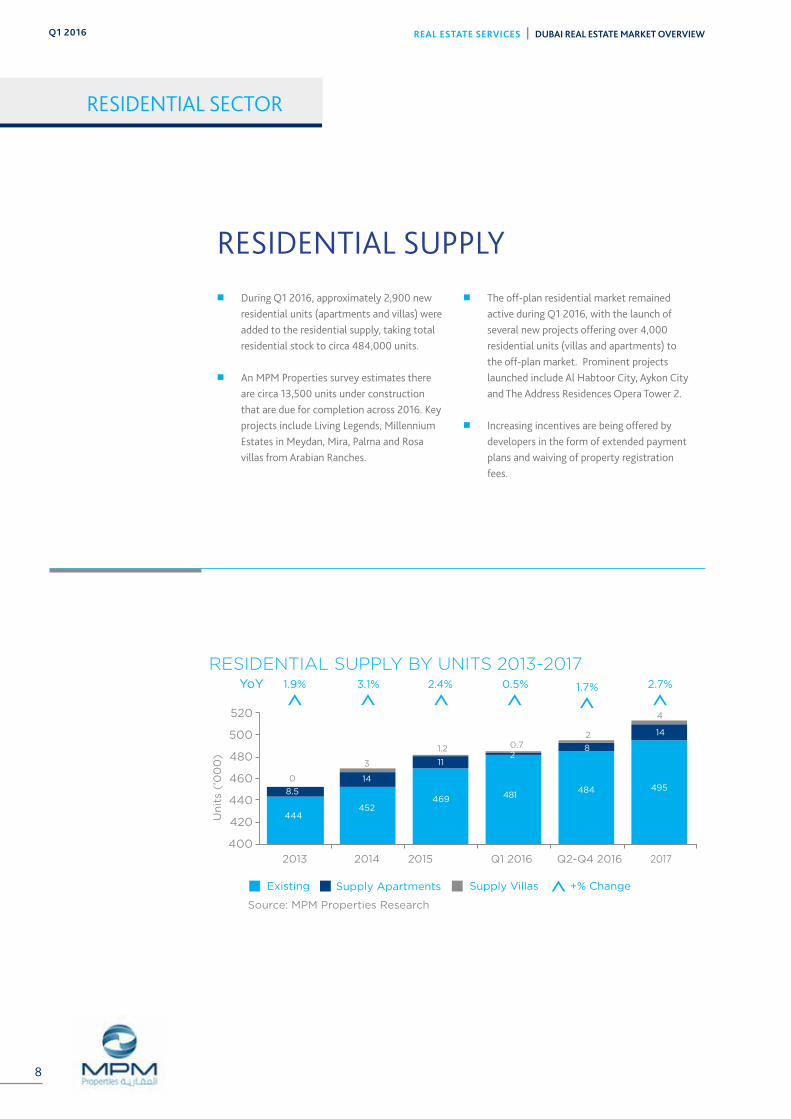
RESIDENTIAL SUPPLY �� During Q1 2016, approximately 2,900 new
residential units (apartments and villas) were added to the residential supply, taking total residential stock to circa 484,000 units.
�� An MPM Properties survey estimates there are circa 13,500 units under construction that are due for completion across 2016. Key projects include Living Legends, Millennium Estates in Meydan, Mira, Palma and Rosa villas from Arabian Ranches.
�� The off-plan residential market remained active during Q1 2016, with the launch of several new projects offering over 4,000 residential units (villas and apartments) to the off-plan market. Prominent projects launched include Al Habtoor City, Aykon City and The Address Residences Opera Tower 2.
�� Increasing incentives are being offered by developers in the form of extended payment plans and waiving of property registration fees.
2014 2015 Q1 2016 Q2-Q4 2016 2017
Source: MPM Properties Research
Supply Apartments
RESIDENTIAL SUPPLY BY UNITS 2013-2017
Existing Supply Villas +% Change
1.9% 2.4% 0.5% 1.7% 2.7% YoY 3.1%
2013
520
500
480
460
440
420
400
8.5
14
3
0
444452
469
112
81.2 0.72
4
481484 495
14

REAL ESTATE SERVICES | DUBAI REAL ESTATE MARKET OVERVIEW Q1 2016
9
SAMPLE OF RESIDENTIAL UPCOMING PROJECTS
SAMPLE OF ANNOUNCED PROJECTS IN Q1 2016
NAME OF PROJECT TYPE DEVELOPER LOCATION
Harbour Views Apartments Emaar Dubai Creek Harbour
Sidra villas villas Emaar Dubai Hills
Bella Casa Serena Townhouses Dubai Properties Dubailand
The Address Residences Dubai Opera Tower 2
Serviced Apartments Emaar Downtown Dubai
Al Habtoor City Apartments Al Habtoor Sheikh Zayed Road
Aykon City Apartments Damac Sheikh Zayed Road
Royal Bay Apartments Azizi Palm Jumeirah
LOCATION PROPERTY NAME NUMBER OF UNITS
Palm Jumeirah The Muraba Residences 50
Palm Jumeirah Club Vista Mare 33
Palm Jumeirah Azure Residence 170
Business Bay Volante 45 (Estimate)
International City Indigo Spectrum 2 89
Tecom C Al Fahad 2 230
Arjaan Siraj Tower 335
Arjaan Syann Park 1 165
Dubai Marina Escan Marina Tower 330
Meydan Grand Views 476

REAL ESTATE SERVICES | DUBAI REAL ESTATE MARKET OVERVIEWQ1 2016
10
RESIDENTIAL SECTOR
APARTMENT AVERAGE SALES PRICES (Q1 2016)AND PERCENTAGE CHANGE
AE
D/s
q.ft.
Source: MPM Properties Research
-4.4% -4.9% -2.7% +0.6% -5.1% 0.0% +2.9% -5.7%0.0% QoQ
YoY -10% -11% -5% -7% -14% -10% -3% -13%-8%
0
500
1,000
1,5002,000
2,500
Th
e G
reen
s
Ju
meir
ah
Beach
Resi
den
ce
Bu
sin
ess
Bay
Du
bai
Mari
na
Th
e V
iew
s
Palm
Ju
meir
ah
DIF
C
Old
To
wn
Do
wn
tow
nD
ub
ai
2,1
50
1,9
50
1,8
00
1,6
50
1,6
00
1,4
00
1,3
00
1,4
00
1,25
0
APARTMENT SALE PRICES �� During Q1 2016, apartment sales transactions
both in value and volume terms, registered a drop as compared to the previous quarter. A total of 2,361 apartments were transacted as compared to 2,606 apartments in Q4 2015, a decline of 9.4% quarter-on-quarter. In value terms, the decline was somewhat lower at 5.4%, with value dropping from AED3.13 billion in Q4 2015 to AED2.96 billion in Q1 2016.
�� Developers attracted buyers in Q1 2016 with incentive schemes and competitive pricing, resulting in a positive response from investors. Tranche releases and gauging the market response helped maintain steady levels of demand. The most prominent launches during the quarter were Aykon City and Al Habtoor City.
�� Circa 69% of all the apartment sale transaction during the quarter were across six residential areas of (1) Dubai Marina, (2) Downtown Dubai, (3) Emirates Living, (4) Business Bay, (5) Palm Jumeirah and (6) Jumeirah Lakes Towers, accounting to AED2.04 billion. The other noticeable active area was International City where 395 apartments transacted at a value of AED178.6 million.
�� Currently, there is no shortage of choice for buyers, with more end users seeking to get onto the property ladder, anticipating long term capital appreciation and relief from rental commitments.
�� Demand of off plan projects is weaker than for newly finished inventory, and the secondary market is signaling possible signs of a bottoming-out in property values across the major locations. Whilst location remains a major factor, it is a combination of the total offering (which comprise product finishes, incentives and attractive payment plans) that are responsible for differences in demand in today’s market.
�� End users are looking for alternatives to renting and therefore most demand in Q1 2016 was for affordable and mid-tier properties. Investors continue to look for net returns of 8 to 9% which are possible to achieve in secondary and tertiary locations, whilst properties in prime areas offered gross returns of 6-7% in the last quarter. As prices adjust, we are seeing more end-users are entering the market.

REAL ESTATE SERVICES | DUBAI REAL ESTATE MARKET OVERVIEW Q1 2016
11
APARTMENT RENTS�� During Q1 2016, average apartment rents
remained stable across the majority of masterplaned developments. However, Business Bay, Dubai Silicon Oasis and Jumeirah Village Circle experienced a decline in rental values. Year-on-year rents dropped by an average of 9% across Dubai.
�� During the quarter, absorption rates across affordable and mid-market units were relatively higher as compared to high and luxurious properties. Landlords of luxurious properties are offering better terms to retain existing tenant as maintaining healthy occupancy rates is as crucial as sourcing new tenants.
�� New projects handed over during the past six months have witnessed reducing asking rents not because of the market dynamics but largely due to high original asking prices demanded by the landlords compared to prevailing market rents.
�� MPM Properties forecasts that rental values in sub-prime areas are likely to correct during the course of 2016, as the majority of the pipeline supply is expected to enter from these locations.
LOCATION STUDIO 1BR 2BR 3BR Q-ON-Q Y-ON-Y
Business Bay 68 85 120 165 -1.07% -5.45%
DIFC 80 115 160 220 0.00% -2.39%
Discovery Gardens 50 70 93 - 2.27% 0.00%
Downtown Dubai 78 118 155 220 3.00% -3.80%
Dubai Marina 68 98 145 198 0.00% -4.55%
Greens 70 88 130 160 0.00% -6.04%
International City 38 49 73 - 0.00% -2.32%
Jumeirah Beach Residence
80 110 133 178 2.50% -1.97%
Jumeirah Lakes Towers 65 88 120 155 0.00% -5.32%
Palm Jumeirah 90 125 165 200 0.51% -2.45%
Tecom 60 83 108 143 0.00% -4.51%
AVERAGE APARTMENT ANNUAL RENTS Q1 2016
Source: MPM Properties Research

REAL ESTATE SERVICES | DUBAI REAL ESTATE MARKET OVERVIEWQ1 2016
12
RESIDENTIAL SECTOR
AVERAGE VILLA SALE PRICE AED/ sq.ft. Q1 2016
AE
D/s
q.ft
Source: MPM Properties Research
+5%
+5%
0.0%
-9%
-5%
-12%
-6%
-12%
-2%
-9%
0.0%
-5%
0.0%
-8%
-2%
-12%
QoQ
YoY
0
500
1,000
1,500
2,000
2,500
3,000
Al F
urj
an
Ju
meir
ah
Vill
ag
e
Sp
rin
gs
&M
ead
ow
s
Ju
meir
ah
Park
Ara
bia
nR
an
ch
es
Du
bai
Sp
ort
s C
ity
Th
e L
akes
Palm
Ju
meir
ah
2,5
75
1,3
25
1,15
0
1,18
0
1,10
0
1,10
0
1,0
50
1,0
00
VILLA SALE PRICES �� Average villa sales rates across freehold
villa communities declined marginally by 1% quarter-on-quarter and 8% year-on-year. Despite the launch of several new villa developments, prices of completed properties remained stable as investors sought yielding product and looked to capitalize on the strong rental market.
�� According to the data sourced from the Dubai Land Department, sales transactions for the quarter totaled approximately AED1.58 billion in Q1 2016 for villas and townhouses. This was an increase of 17% quarter-on-quarter.
�� The Emirates Living development recorded the highest amount of transactions in value terms with a total transaction value of AED643.7 million (41% of total villa transaction in the quarter), followed by Jumeirah Park with a total transaction value of AED232 million. Other active areas during the quarter
were Palm Jumeirah and Arabian Ranches, accounting for cumulative transaction values of AED503 million.
�� Affordable and well-priced villa/townhouse inventory will continue to meet market demand in 2016. The secondary sales market is anticipated to improve further as rental values remain stable across major villa locations, increasing return on investment (ROI) for perspective new purchasers.
�� Developers are quick to respond to changing investor appetite towards affordable properties. During the quarter, Dubai Properties launched Bella Casa townhouses within its Serena development in Dubailand, with starting prices of circa AED1.3 million for two bedroom properties. Nshama developed a show house in its Town Square development to entice investors to purchase its AED1.5 million townhouses.
REAL ESTATE SERVICES | DUBAI REAL ESTATE MARKET OVERVIEW Q1 2016
13
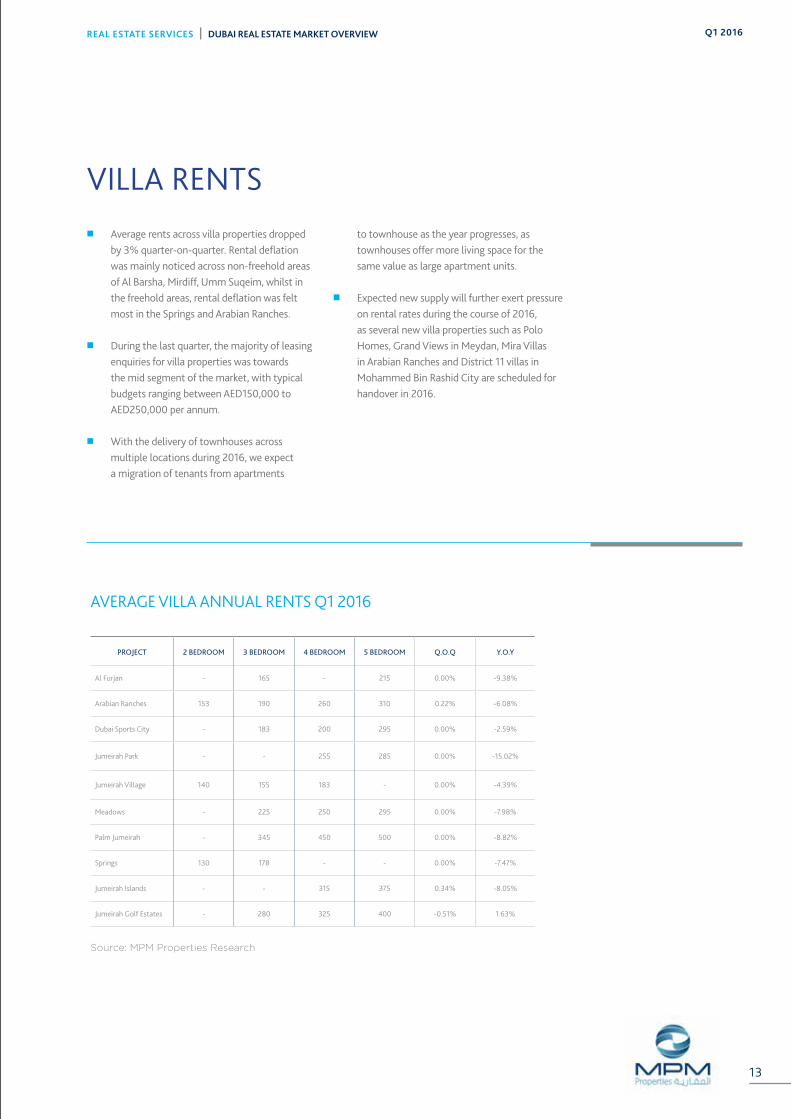
PROJECT 2 BEDROOM 3 BEDROOM 4 BEDROOM 5 BEDROOM Q.O.Q Y.O.Y
Al Furjan - 165 - 215 0.00% -9.38%
Arabian Ranches 153 190 260 310 0.22% -6.08%
Dubai Sports City - 183 200 295 0.00% -2.59%
Jumeirah Park - - 255 285 0.00% -15.02%
Jumeirah Village 140 155 183 - 0.00% -4.39%
Meadows - 225 250 295 0.00% -7.98%
Palm Jumeirah - 345 450 500 0.00% -8.82%
Springs 130 178 - - 0.00% -7.47%
Jumeirah Islands - - 315 375 0.34% -8.05%
Jumeirah Golf Estates - 280 325 400 -0.51% 1.63%
AVERAGE VILLA ANNUAL RENTS Q1 2016
Source: MPM Properties Research
VILLA RENTS �� Average rents across villa properties dropped
by 3% quarter-on-quarter. Rental deflation was mainly noticed across non-freehold areas of Al Barsha, Mirdiff, Umm Suqeim, whilst in the freehold areas, rental deflation was felt most in the Springs and Arabian Ranches.
�� During the last quarter, the majority of leasing enquiries for villa properties was towards the mid segment of the market, with typical budgets ranging between AED150,000 to AED250,000 per annum.
�� With the delivery of townhouses across multiple locations during 2016, we expect a migration of tenants from apartments
to townhouse as the year progresses, as townhouses offer more living space for the same value as large apartment units.
�� Expected new supply will further exert pressure on rental rates during the course of 2016, as several new villa properties such as Polo Homes, Grand Views in Meydan, Mira Villas in Arabian Ranches and District 11 villas in Mohammed Bin Rashid City are scheduled for handover in 2016.

REAL ESTATE SERVICES | DUBAI REAL ESTATE MARKET OVERVIEWQ1 2016
14
4.0
8.06.0
8.0
15.0
11.510.0
24.0
17.0
4.5
8.56.5
GCC FREEHOLD VILLA VALUES Q1 2016
25.0
20.0
15.0
10.0
5.0
0
AE
D (
Mill
ion
)
Source: MPM Properties Research
Mirdif Al Barsha Umm Suqeim Al Warqa
HighLow Average
350
525
438375
550463
650
950
800
275350
313
GCC FREEHOLD LAND VALUES Q1 2016
1,000900800700600500400300200100
0
AE
D /
Sq
.ft.
Source: MPM Properties Research
Mirdif Al Barsha Umm Suqeim Al Warqa
HighLow Average
140155
170 180
225
270
220250
290
150185
220
GCC FREEHOLD VILLA RENTS Q1 2016
35030025020015010050
0
AE
D (
Th
ou
san
ds)
Source: MPM Properties Research
Mirdif Al Barsha Umm Suqeim Al Warqa
4 Bedroom3 Bedroom 5 Bedroom

REAL ESTATE SERVICES | DUBAI REAL ESTATE MARKET OVERVIEW Q1 2016
15
REAL ESTATE SERVICES | DUBAI REAL ESTATE MARKET OVERVIEW Q2 2015

REAL ESTATE SERVICES | DUBAI REAL ESTATE MARKET OVERVIEWQ1 2016
16
Q2 2015
PROJECT FOCUS REDWOOD PARK AT JUMEIRAH GOLF ESTATES
TOWNHOUSES STARTING FROM: ATTRACTIVE PAYMENT PLAN:
Host to the DP World Tour Championship since 2009, Jumeirah Golf Estates is one of the Middle East’s established residential golf communities, offering a wide range of world-class golfing facilities and individually designed homes in the United Arab Emirates.
Located in the heart of New Dubai, Jumeirah Golf Estates’ Phase A development consists of 375 hectares of a 1,119 hectare land parcel, and incorporates 16 residential communities, comprising of more than 1,700 constructed and under construction properties.
Redwood Park features a collection of three and four bedroom townhouses overlooking the 11th and 12th holes of the Fire Course, complete with shared amenities
including swimming pools, children’s play areas and BBQ facilities. Both of these developments are located in the heart of the community, where investors and residents can benefit from a range of offerings as well as access to two championship golf courses, Fire & Earth, plus a new world-class Clubhouse and Country Club.
In addition to two world-class golf courses, Jumeirah Golf Estates is home to a number of golf and residential facilities. In November 2014, the Jumeirah Golf Estates Clubhouse and Country Club opened and has become the communities’ social focal point. Ranging from informal to fine dining, the Clubhouse and Country Club has a host of delicious dining options.
3 Bedroom: AED 2,970,8954 Bedroom: AED 3,993,000
10% down payment40% during construction50% over 2 years post handover
17
REAL ESTATE SERVICES | DUBAI REAL ESTATE MARKET OVERVIEWQ1 2016
18
OFFICE SUMMARY �� During the quarter, office rents in prime areas
remained stable, whilst the secondary office market became increasingly fragmented largely due to strata ownership, with varying rental rates from as low as AED55 up to AED200 per sq.ft. per annum.
�� Despite citywide high headline vacancy rates, freezone areas continued to record healthy occupancy rates of over 90%. Healthy occupancy rates and relatively high demand has led to the emergence of new office towers
across the freezones, including Butterfly and Edge Towers in Tecom and West Wing 8 in the DAFZA.
�� Sales rates declined by 3% quarter on quarter and 13% year on year. New supply, existing vacant space and weak demand are contributing to average sale rates dropping by 17% in Jumeirah Lakes Towers and 20% year on year in the Business Bay area.
OFFICE SECTOR
0
20
40
60
80
100
DUBAI OFFICE STOCK (2008 - 2017)
Mill
ion
sq
.ft.
2008 2009 2010 2011 2012 2013 2014 2015 Q1 2016
Stock Expected
Source: MPM Properties Research
2017
6.0
45
8.0
10.06.0
6.0 0.2 2.56.8 1.3 3.3
4.6
5159 69 75 81 81 84 91 92 95
Q2-Q42016

REAL ESTATE SERVICES | DUBAI REAL ESTATE MARKET OVERVIEW Q1 2016
19
OFFICE SALES �� Dubai Land Department data shows circa 430,000 sq.ft. of office
space was transacted in Q1 2016 with a total value of AED497 million, equating to an average sales price of AED1,150 per sq.ft.
�� During Q1 2016, 83% of office transactions in value terms were registered at Business Bay and Jumeirah Lakes Towers, with the remainder spread across Motor City, Tecom C, Trade Centre, Deira and Dubailand.
�� Business Bay continued to dominate the office transaction market with 219,000 sq.ft. of office space transacted in Q1 2016 at a value
of AED284.2 million, while Jumeirah Lakes Towers saw 125,000 sq.ft. of office space AED128.3 transacted for 128.3 million.
�� Sales enquiries remained low in Q1 2016 and were largely for smaller office sizes between 1,000 to 2,500 sq.ft. Weak demand and perceived low sales prices are encouraging landlords to lease their space and wait for the market to improve, rather than sell now. Considering the supply pipeline and current vacancy rates, we do not expect any price appreciation over the next 12-15 months.
OFFICE AVERAGE SALE PRICES Q1 2016
AE
D /
sq
.ft.
0%
-8%
-4%
-14%
-3%
-13%
-2%
-20%
-5%
-17%
-3%
-6%
QoQ
YoY
0
500
1,000
1,500
2,000
2,500
TECOM CJumeirahLakes Towers
BusinessBay
DubaiMarina
DIFCDowntownDubai
2,2501,800
1,5001,075 1,050 950
OFFICE SUPPLY �� Dubai office stock increased in Q1 2016, with an additional
1.34 million sq.ft. of new space added to the market during this quarter, taking the total office stock to 92 million as at the end of Q1 2016. Of the total space completed during the quarter, 56% was strata titled, with the remaining held on single ownership basis.
�� The majority of new supply in Q1 2016 was within Business Bay, which continues to see a rise in strata owned space despite
high headline vacancy rates. The Exchange and Iris Bay towers are the two main new additions within the Business Bay area, together adding over 750,000 sq.ft. of new space.
�� MPM Properties expects circa 3.3 million sq.ft. of new office space to enter the market in 2016, which could further elevate vacancy rates. The impact will primarily be across strata owned buildings in the Business Bay, Tecom and Dubai Silicon Oasis areas and ageing buildings in the CBD.

Sheikh Mohamed Bin Zayed Rd.
Sheikh Mohamed Bin Zayed Rd.
Sheikh Mohamed Bin Zayed Rd.
Al Khail Road
Al Khail Road
Um
m S
uqei
m R
oad
Sheikh Zayed Rd.
Sheikh Zayed Rd.
Sheikh Zayed Rd.
Arabian RanchesDubai
Land
DubaiLand
DubaiLand
DubaiLand
DubaiLand
Nad AlSheba 2
Nad Al Sheba
DubaiSilicon Oasis
InternationalCity
DragonMark
MushrifNational Park
Murdif
FestivalCity
TOSHARJAH
TOHATTA & OMAN
TOAL AIN
TOABU DHABI
TheLagoons
Business Bay Za’abeel
Garhoud
Al Qusais
Port Saeed
Rigga
Ras Al Khor
Al Marqadh
LegendsAl Barari
City of ArabiaGlobal Village
MotorCity
DubaiSport City
DubaiInvestment
Park 1
Jumeirah GolfEstates
Jumeirah GolfEstates
IMPZ
DubaiInvestment
Park 2
JumeirahVillage
JumeirahVillage South
The Meadows
Emirates Hills
The Springs
TheGardens
Jebel Ali Village
Jebel Ali Port
Jebel Ali Freezone
Jebel AliIndustrial Area
Dubai World Central Airport
DiscoveryGardens
JumeirahPark
JumeirahIslands
TECOMThe
Lakes
TheGreens
Naif
Al Raffa
SatwaJumeirah
Al WaslAl Safa
Umm Suqeim
The PalmJumeirah
Al SufouhMedia / Internet
CityJumeirah Lake
Towers
Dubai Marina
Burj Al Arab
The World
The Palm Deira
Al QuozIndustrial Area
Al Barsha
Al Quoz
Emirates Towers
DIFCBurj Khalifa
Karama
OudMetha
Al Mamzar
Port Rashid
DubaiInternational
Airport
OFFICE SECTOR
OFFICE RENTS AED/sq.ft. Q1 2016
AE
D/s
q.ft.
High Low
350
300
250
200
150
100
50
0
Source: MPM Properties Research
150 20
026
5
140
100 18
0
70
175
34
0
75 120
60
TE
CO
M C
120 17
5
DIC
& D
MC
SHEIKH ZAYED RD.RENT = AED 100 - AED 180 /sq.ft.
DIC & DMCRENT = AED 120 - AED 175 /sq.ft.
TECOM CRENT = AED 75 - AED 120 /sq.ft.AVG. SALE = AED 950 /sq.ft.
JUMEIRAH LAKES TOWERSRENT = AED 60 - AED 200 /sq.ft.AVG. SALE = AED 1,050 /sq.ft.
DOWNTOWN DUBAIRENT = AED 140 - AED 265 /sq.ft.AVG. SALE = AED 2,250 /sq.ft.
DIFCRENT = AED 175 - AED 340 /sq.ft.AVG. SALE = AED 1,800 /sq.ft.
BUSINESS BAYRENT = AED 70 - AED 150 /sq.ft.AVG. SALE = AED 1,075 /sq.ft.
REAL ESTATE SERVICES | DUBAI REAL ESTATE MARKET OVERVIEWQ1 2016
20
OFFICE RENTS �� Office rents in the CBD have remained stable
in Q1 2016, with average rents in Downtown Dubai and along Sheikh Zayed Road ranging between AED100-260 per sq.ft. per annum. However, vacant space across ageing properties is adding pressure to rents in prime locations.
�� Secondary locations are witnessing stronger rental deflationary pressures due to weak demand and substantial rises in supply. There remains reasonable demand for small to mid-size offices ranging from 500 sq.ft. to 2,000 sq.ft. which are well suited to start-ups however demand remains subdued for larger space.
�� Migration of tenants from traditional business areas and demand from new start-ups is helping improve occupancy rates in new commercial office areas such as Business Bay, JLT, etc. However, continued supply of new space is hindering upward rental movement despite offering quality office space with higher specifications.
�� Strata space owners in Business Bay, Tecom C and Jumeirah Lakes Towers are now leasing as low as AED60 per sq.ft. per annum all inclusive for shell and core space along with rent free periods of 1-2 months in order to minimize their rental void costs
REAL ESTATE SERVICES | DUBAI REAL ESTATE MARKET OVERVIEWQ1 2016
21
RETAIL SECTOR
PRIME SHOPPING MALL AVERAGE RENTS - Q1 2016
An
ch
ors
Cin
em
a
Hyp
erm
ark
et
Min
i M
ajo
rs
Fla
gsh
ips
Rest
au
ran
ts
Fo
od
Co
urt
Lin
e S
ho
ps
1,2001,1001000900800700600500400300200100
0
AE
D/s
q.ft.
Source: MPM Properties Research
�� The total retail supply of Dubai has reached 35.6 million sq.ft. of GLA With the addition of circa 800,000 sq.ft., during the quarter with the opening of The Mall, City Centre Sindagah and Phase 2 of City Walk.
�� Q1 has seen marginal movement in average rental rates in Q1, with retailers and landlords keen to stabilize their operations in preparation for Ramadan and the summer months.
�� New retail concepts are entering the market, which includes quality pedestrian friendly high street retail such as The Beach, Box Park and City Walk, offering an alternative to the traditional shopping mall concepts.
�� The retail sector in Dubai continues to grow at a rate of 4+% average yearly (Dubai Chamber) which now equate to 30% of Dubai GDP.
�� Whilst retail space continue to filter into the Dubai market we expect a widening divergence between prime mall rents and more secondary malls, dependent on how well the properties have been designed and are being operated.
RETAIL SUMMARY

REAL ESTATE SERVICES | DUBAI REAL ESTATE MARKET OVERVIEW Q1 2016
22
DUBAI RETAIL MALLS GLA BY AREA Q1 2016 RETAIL SUPPLY PRE-2010
NEW SUPPLY DELIVERED 2010-Q1 2016DUBAI RETAIL MALLS BY SIZE Q1 2016
Source: MPM Properties Research
30% - 10.85 million sq.ft
29.531.6 31.8 31.9 31.9 32.2 34.8 35.6 37.7
3.3
DUBAI RETAIL MALL STOCK 2010-2017
GL
A s
q.ft.
(Mill
ion
s)
Stock Expected - *Includes all retail malls with a GLA greater than 25,000 sq.ft.
Source: MPM Properties Research
2010 2011 2012 2013 2014 2015 Q1 2016 2017Q2-Q42016
50
40
30
20
10
0
2.62.1 0.2 0.1 0.0 0.3
0.82.9
11%
22%14%
3%
22%10%
13%
10%
30%
10%
4% 5% 4%3%
6%3%
8%
3%
REAL ESTATE SERVICES | DUBAI REAL ESTATE MARKET OVERVIEWQ1 2016
23
HOSPITALITY SECTOR
HOTEL SUMMARY �� Dubai’s hospitality stock rose by 1 % from the
previous quarter, with an addition of 1,437 new hotel rooms and apartments during Q1 2016, taking the total hotel room count to circa 98,150 rooms and apartments.
�� 5 star hotels remain the largest share of the Dubai hospitality market with a 32% share, however, new growth is fastest within the 4 star sectors, as Dubai looks to attract more mid to low budget travelers.
�� The supply growth of hotel and apartment rooms remains broadly in line with demand and in line with the 2020 vision. Global economic pressures continue to drive hotel operators to re-assess their competitiveness, compete on ADR’s to secure greater market share.
�� The average ADR in Q1 has dropped on average 8%, since the beginning of the year yet occupancy rates remains in the 80+% which is still high in comparison to other international markets.
DUBAI HOTEL ROOMS SUPPLY (2012 - 2017)
No
. o
f R
oo
ms
('0
00
s)
Existing Supply New Supply
Source: MPM Properties Research
41
8 4.7 1.46.1
8.0
Q2-Q4 2016 2017Q1 201620152012 2013 2014
120
100
80
60
40
20
0
79 80 84 92 97 98 104

REAL ESTATE SERVICES | DUBAI REAL ESTATE MARKET OVERVIEW Q1 2016
24
DUBAI HOTELS PERFORMANCE - 2016 YTD
ADR RevPAR
Source: MPM Properties Research
Occupancy
100%90.0%80.0%70.0%60.0%50.0%40.0%30.0%20.0%10.0%0%
1,400
1,200
1,000
800
600
400
200
0
Jan
-14
Feb
Mar
Ap
r
May
Ju
n
Ju
l
Au
g
Sep
Oct
No
v
Dec
Jan
-15
Feb
Mar
Ap
r
May
Ju
n
Ju
l
Au
g
Sep
Oct
No
v
Dec
Jan
-16
Feb
Mar
AE
D
Occu
pan
cy
HOTEL NAME LOCATION STAR DATE NUMBER OF KEYS
Ibis StyleDubai International
City3 Star Q1 2016 246
Ibis One CentralDubai World Trade
Centre3 Star Q1 2016 588
Four SeasonsDubai International
Financial Centre5 star Q1 2016 106
Wyndham Hotel Dubai Marina 5 star Q1 2016 497
HOTEL NAME LOCATION STAR DATE NUMBER OF KEYS
Rove Hotel Zabeel 4 star Q2 2016 420
W Hotel Sheikh Zayed Road 5 star Q2 2016 384
The Address Boulevard Downtown Dubai 5 star Q2 2016 196
Dusit Emirates Saray Palm Jumeirah 5 Star Q2 2016 292
HOTELS - NEW SUPPLY Q1 2016
SAMPLE OF UPCOMING SUPPLY

REAL ESTATE SERVICES | DUBAI REAL ESTATE MARKET OVERVIEWQ1 2016
25
DEFINITIONS & METHODOLOGY
RESEARCH STUDY AREA
The geographic extent of the study area covers the key districts in Dubai.
RESIDENTIAL
New residential developments are classified as delivered and thus entered into the new supply category when they are made available for occupation. This is verified via a combination of site inspections and discussion with the developer and hence our supply numbers do take into consideration the phased release of large projects.
Rental and sales trend analysis is based on transactional data derived from the MPM Properties Agency team and data sourced from developers and owners.
OFFICES
New office developments are classified as delivered and thus entered into the new supply category when they are available for tenant fit-outs.
Given the general lack of transparency in the local market rents quoted are headline rents, thus exclude any rent free period of other financial
incentives that may have been negotiated between the parties. The rents quoted are also exclusive of service charges.
RETAIL
New retail developments are classified as delivered and thus entered into the new supply category when the first units are open and trading.
Our classification of malls is based on our own assessment having regard to size and the catchment area which the mall typically penetrates.
HOSPITALITY
New hotels are classified as delivered and thus entered into the new supply category when they are opened and trading. All trading performance data is provided by DTCM.
FUTURE SUPPLY PROJECTIONS
Our future supply projections across all sectors are based on a combination of regular site inspections and discussions with developers.
BESPOKE CLIENT RESEARCH ADDING VALUE TO YOUR PROPERTY INTERESTSThe ADIB Real Estate Services team covers all sectors of the real estate market. We provide bespoke market research to our valued clients to meet their specific requirements.
We provide reports, information and presentations derived from primary market data that directly assist our clients to save or make money from real estate and shape strategies to enhance value.
DISCLAIMER:
The information contained in this report has been obtained from and is based upon sources that MPM Properties believes to be reliable, however, no warranty or representation, expressed or implied, is made to the accuracy or completeness of the information contained herein, and same is submitted subject to errors, omissions, change of price, rental or other conditions, withdrawal without notice, and to any special listing conditions imposed by our principals. MPM Properties will not be held responsible for any third-party contributions. All opinions and estimates included in this report constitute MPM Properties, as of the date of this report and are subject
to change without notice. Figures contained in this report are derived from a basket of locations highlighted in this report and therefore represent a snapshot of the Dubai market. Due care and attention has been used in the preparation of forecast information. However, actual results may vary from forecasts and any variation may be materially positive or negative. Forecasts, by their very nature, involve risk and uncertainty because they relate to future events and circumstances which are beyond MPM Properties’ control. For a full in-depth study of the market, please contact MPM Properties team.

REAL ESTATE SERVICES | DUBAI REAL ESTATE MARKET OVERVIEW Q1 2016
26
A collaborative team providing our integrated services
BALAJI NAGARAJ MSC MRICS Head of Residential Valuation Dubai & Northern Emirates T: +971 (0)4 371 9463 M: +971 (0)55 196 2396 [email protected]
PAUL MAISFIELD BSC (HONS) MRICS CEO T: +971 (0)2 610 0545 M: +971 (0)50 660 9437 [email protected]
YOUSEF AL ZAROONI Regional Head – Al Ain T: +971 (0)3 708 8636 M: +971 (0)50 600 1002 [email protected]
ABDULLAH SAID AL KUWEITI Business Development Director T: +971 (0)2 610 1554 M: +971 (0)50 623 5854 [email protected]
MOHAMMED FAHEEM Manager Strategic Advisory & Research T: +971 (0)4 371 9471 M: +971 (0)50 384 5220 [email protected]
SAMUEL MORRIS BSC (HONS) FRICSDirector of Valuation & Regional Head - Dubai T: +971 (0)4 371 9466 M: +971 (0)50 107 1704 [email protected]
WAHIDA KARAMA Head of Property Operations T: +971 (02) 610 0435 M: +971 (0)50 765 7679 [email protected]
FRANK O’DWYER MBA (Hons); BEng.COO T: +971 (0)2 610 0402 M: +971 (0)50 812 1070 [email protected]
DOMINIC BARLOW Head of Retail, Hospitality & Leisure T: +971 (0)2 510 0655 M: +971 (0)56 288 1458 [email protected]
JUBRAN AL HASHMI Head of Property Services T: +971 (0)2 610 0232 M: +971 (0)50 122 0041 [email protected]
VINEET KUMAR Director of Agency – Dubai T: +971 (0)4 371 9462 M: +971 (0)50 651 6491 [email protected]
VAIBHAV SHARMA MCOM; MDBA Director of Strategic Advisory and Research T: +971 (0)2 412 8914 M: +971 (0)50 660 9295 [email protected]
ALI ABDULLAH ABDUL RAHMAN Acting Regional Head – Northern Emirates T: 971 (0)6 597 2514 M: +971 (0)50 656 2486 [email protected]
MOHAMED AL ZOUBI Head of Development Advisory BSc Civil Engineering T: +971 (0)2 610 0564 M: +971 (0)50 310 3570 [email protected]

NEW SUPPLY – Q1 2016 SAMPLE OF UPCOMING PROJECTSRESIDENTIAL RESIDENTIAL
RETAILRETAIL
HOTELHOTEL
1 MURABA RESIDENCES PALM JUMERIAH
1 WASL OASIS 2 - MUHAISNAH 2 ESCAN MARINA DUBAI MARINA
2 WASL HUB - KARAMA3 POLO HOMES - MEYDAN 3 SIRAJ TOWER ARJAAN
4 SYAAN PARK 1 ARJAAN
OFFICEOFFICE
1 PARK LANE TOWER BUSINESS BAY
1 THE EXCHANGE BUSINESS BAY
1 DUBAI MALL DOWNTOWN DUBAI
1 CITY CENTRE SHINDAGAH
1 IBIS STYLE DRAGON MART
1 THE ADDRESS DOWNTOWN
2 IBIS CENTRAL DWTC
2 ROVE ZABEEL
3 FOUR SEASONS DIFC (DAMAN TOWER)
3 DUSIT EMIRATES SARAY PALM JUMEIRAH
4 WYNDHAM DUBAI MARINA
4 W HOTEL SZR - HABTTOR CITY
2 THE EDGE TECOM
2 IRIS BAY BUSINESS BAY
2 THE RIBBON MOTOR CITY
2 THE MALL UMM SUQEIM
3 BUTTERFLY TECOM
3 OFFICE TOWER DWTC
3 THE POINTE PALM JUMEIRAH
3 CITY WALK 2 AL WASL
4 ONYX TOWER SHEIKH ZAYED ROAD
4 OFFICE TOWER IMPZ
4 PALM MALL PALM JUMEIRAH
SUPPLY - PHOTO GALLERY
REAL ESTATE SERVICES | DUBAI REAL ESTATE MARKET OVERVIEWQ1 2016
27

TOABU DHABI
Jebel Ali Port
Jebel Ali Freezone
Al Mamzar
Al Qusais
1
2
3
1
2
3 4
3
1
2
4
1
2
3
4
12
3
1
2
3
4
1
2
34
4
23
1
Residential
Offices
Retail
Hotels
Q1 2016 NEW SUPPLY
Residential
Offices
Retail
Hotels
UNDER CONSTRUCTION
Q1 2016

INTEGRATED SERVICES COVERING THE FULL PROPERTY LIFECYCLE
Property Management
Investment Advisory
Project Management and ESCROW
Research & Strategic AdvisoryAgency (Sales & Leasing)
Valuation
PAUL MAISFIELD BSC (HONS) MRICS CEO T: +971 (0)2 610 0545 M: +971 (0)50 660 9437 [email protected]
VAIBHAV SHARMA MCOM; MDBA Director of Strategic Advisory and Research T: +971 (0)2 412 8914 M: +971 (0)50 660 9295 [email protected]
ABU DHABI HEAD OFFICE 6th Floor, Al Wahda Tower P.O Box 114686 Abu Dhabi
Tel. +971 2 610 0252Fax. +971 2 610 0514 www.mpmproperties.ae
DUBAI OFFICE Office 2301,2303,2305 - Level 123 Arenco Tower, Dubai Internet City Dubai
Tel. +971 (0)4 371 9462
AL AIN OFFICE 201-204 ADIB Ladies Branch Building Oud Touba Street Al Ain
Tel. +971 (0)3 703 9521
SHARJAH OFFICE AL Ikhlas Tower AL Khan Shajrah
Tel. +971 (0)6 597 2555
Enhancing value for individual & institutional property owners:
�� Prompt leasing & debt collection
�� Effectively market & lease vacant units
�� Physical & technical maintenance of asset
�� Maintain tenant satisfaction
�� Timely lease renewals
�� Manage risk, insurance & litigation
�� Protect your interests and enhance value
Complete Project Management services at planning & construction stage:
�� Engineering Review & Scheduling
�� Cost Estimate & Procurement
�� Project Monitoring
�� Cost Control & Accounting
�� Assist with Permits & Licensing
�� Ensure appropriate fund movement for Escrow based on Project Assessment
Aiding developers and investors to maximize value:
�� Investment Advisory & Due Diligence
�� Investment Management
�� Disposal Strategy
�� Portfolio Review & Optimization
�� Deal Structuring & Capital Sourcing
�� Investment Sale
We work with developers, commercial tenants, retailers and individuals, offering:
�� Launch Strategy
�� Project Launch Handling
�� Project Marketing Events
�� Acquisitions
�� Leasing
�� Sales
We cover all sectors, including residential, commercial, industrial, retail, and land.
Bankable studies for your real estate and business needs:
�� Highest & Best Use
�� Market & Financial Feasibility
�� Development Strategy
�� Market Research
�� Corporate Real Estate Strategy
�� Master-plan and design review
Valuation reports for:
�� Mortgage & Loan Security
�� Securing Project Funding
�� Internal Accounting
�� Mergers & Acquisitions
�� Investment appraisal
�� Litigation
�� Inheritance
We cover all asset classes. Our reports are in compliance with the International Valuation Standards (IVS) and the RICS Professional Valuation Standards.


