67
Duke Energy Morro Bay, LLC Updated Analysis of Alternative Cooling Systems For the Morro Bay Modernization Project January 7, 2002

Duke Energy Morro Bay, LLC
Updated Analysis of Alternative Cooling SystemsFor the Morro Bay Modernization Project
January 7, 2002

Table of Contents
1 OVERVIEW.............................................................................................................. 1
2 INTRODUCTION...................................................................................................... 2
3 RE-CAP OF ALTERNATE AIR COOLING ANALYSIS........................................... 2
4 UPDATED COOLING OPTIONS ANALYSIS.......................................................... 4
4.1 Current Cost and Size Estimates..................................................................................... 5
4.2 Visual Impacts................................................................................................................... 7
4.3 Noise Impacts .................................................................................................................... 8
4.4 Air Quality Impacts .......................................................................................................... 9
4.5 Land Use Impacts ........................................................................................................... 10
4.6 Terrestrial Biology Impacts ........................................................................................... 10
4.7 Morro Bay Community Concerns................................................................................. 11
4.8 Economic Impact ............................................................................................................ 12
5 CONCLUSIONS..................................................................................................... 15
APPENDIX A – KEY ASSUMPTIONS MATRIX ........................................................... 16
APPENDIX B – PREVIOUS ANALYSIS PRESENTED IN THE 316 (B) REPORT...... 19
APPENDIX C – ANALYTICAL FRAMEWORK & DOCUMENT HISTORY .................. 22
APPENDIX D – PLOT PLANS...................................................................................... 24
APPENDIX E – SITE CONSTRAINTS POWERPOINT SLIDES .................................. 27
APPENDIX F – VISUAL IMPACTS............................................................................... 33
APPENDIX G --NOISE IMPACTS................................................................................. 41

APPENDIX H --AIR IMPACTS...................................................................................... 48
APPENDIX I – LAND USE IMPACTS........................................................................... 50
APPENDIX J -- TERRESTRIAL BIOLOGY IMPACTS................................................. 54
APPENDIX K – PREVIOUS DUTY CYCLE (JUNE 2001) ............................................ 56
APPENDIX L – CURRENT DUTY CYCLE (JANUARY 2002)...................................... 57
APPENDIX M– CURRENT ALTERNATIVE COOLING FUEL USAGE RESULTS ...... 58
APPENDIX N- CURRENT ECONOMIC RESULTS DISCUSSION ............................... 60

Duke Energy Morro Bay, LLC PageUpdated Analysis of Alternative Cooling Systems
1
1 OverviewThis paper summarizes Duke Energy Morro Bay, LLC (Duke’s) best available informationconcerning the costs, environmental impacts, and other constraints of two possible alternatives tothe proposed project’s seawater cooling system. It is Duke’s opinion that even if any suchalternative could be constructed (an open question) it would be less protective of theenvironment than Duke’s proposed project.
To carry out this analysis, Duke built upon the original analysis and changed assumptions andmethodology as appropriate to account for Duke’s evolving understanding of various attributesof each alternative. Duke’s estimates of economic costs have been derived by contractors andvendors using their best engineering judgments rather than from detailed drawings and plans.Accordingly, the magnitude of these costs is most likely understated.
To summarize the key attributes of both alternatives:
1. Neither the air-cooled nor hybrid alternative could be constructed within the footprintconstraint of Duke’s current site.
2. Neither the air-cooled nor hybrid alternative would comply with several ordinances andregulations (LORS) with respect to negative visual impacts of new structures on the coast ofCalifornia.
3. Neither the air-cooled nor hybrid alternative is consistent with the strongly expressed desiresof the community with respect to the visual impacts of the project.
4. When compared to Duke’s proposed project, both alternatives would have negative visualand noise impacts.
5. It is not clear that it is even feasible to construct either alternative, given the site constraintsand required earthquake standards. Were these limitations to be fully analyzed, project costswould be expected to be significantly higher.
6. While the estimated costs of both alternatives is considerably less than in our previousanalysis, even the reduced incremental costs of the alternatives ($106-$114 million on a NetPresent Value basis) are wholly disproportionate to relatively modest marine biology benefitsfrom reduced use of seawater cooling.
7. Hybrid cooling represents the worst of both worlds: Increased complexity over air-cooledcondensers means lower reliability for about the same cost, and it is premised on availabilityof make-up water that is far from certain.
Duke Energy Morro Bay, LLC PageUpdated Analysis of Alternative Cooling Systems
2
2 IntroductionThis document provides a current and consolidated review of Duke Energy Morro Bay, LLC’s(Duke) analysis of possible alternative cooling options for the proposed Morro Bay Power Plant(MBPP) Project. The two systems evaluated are1) air cooled condensers (ACC) and 2) hybridwet/dry cooling systems (Hybrid) that includes air coolers combined with mechanical draftcooling towers utilizing fresh water sources.
This analysis is the culmination of work that has been ongoing since the issuance of the AFC inOctober of 2000. There have been four distinct efforts by Duke1:
• Conceptual evaluations contained in the AFC (October, 2000)
• Previous analyses contained in the 316(b) Report (May 11, 2000)
• Materials presented at the July 12, 2000 meeting of the Regional Water Board. Thisanalysis was supplemented with an environmental review including some KeyObservation Points (KOPs) in an August 9, 2001 brief presented initially at the Cityof Morro Bay council meeting and later docketed with the CEC
• This updated analysis.
This paper recaps: 1) the previous economic analysis and rationale behind the approach to sizingalternative cooling systems, 2) the steps Duke has taken to define and establish a morerepresentative physical design, and 3) the environmental and economic impacts for both the AirCooling Condensers (ACC) and the “Hybrid” wet/dry systems for the current design concepts.Appendix A contains a matrix comparing the key assumptions in both the previous and currentanalyses and explains why Duke believes the changes in the assumptions and methodology forthis updated analysis are appropriate.
3 Re-cap of Alternate Air Cooling Analysis
The MBPP modernization project proposes to use once-through seawater cooling; the samecooling system used in the existing plant. In accordance with CEQA guidelines, Duke specifiedonce-through seawater cooling for both the baseline and proposed project. When agenciesrequested an evaluation of alternative cooling systems, Duke conducted the analysis within theparameters outlined in the CEQA guidelines: alternatives were evaluated at a conceptual level asopposed to the more detailed analysis required for the base case.2 Therefore, the evaluation of
1 The evolution of the paramaters for performance simulations for the proposed project are shown in Appendix C,along with a historical record of other documents relating to Duke’s analysis of alternative cooling systems.
2 "(d) Evaluation of alternatives. The EIR shall include sufficient information about each alternative to allowmeaningful evaluation, analysis, and comparison with the proposed project. A matrix displaying the majorcharacteristics and significant environmental effects of each alternative may be used to summarize the comparison.If an alternative would cause one or more significant effects in addition to those that would be caused by the project

Duke Energy Morro Bay, LLC PageUpdated Analysis of Alternative Cooling Systems
3
possible cooling system alternatives was based solely on a rough sizing of equipment and limitedconsideration of operational constraints. This analysis, per the requirements of CEQA, did notinclude the same level of engineering detail as that for the base case presented in the AFC. Dukebelieves the original conceptual level of detail was sufficient to compare the relativeenvironmental and economic impacts of possible alternatives.
In brief, key conclusions of the earlier analysis were3:
• The economic impact of the alternatives were evaluated on an incremental PresentValue (PV) and annual cost basis. The Present Value encompassed the capital cost ofthe alternative, the annual O&M costs, and the value of reduced plant efficiencyexpressed as the capital and energy costs of a hypothetical “make-up” plant.
• For the ACC system the incremental PV costs were estimated to be $301 million,equivalent to $24 million on an annualized basis.
• For the Hybrid alternative the incremental PV costs were estimated to be $273million, equivalent to $22 million on an annualized basis.
• Duke concluded that the economic impact was disproportionate to the environmentalbenefits
• Various noise, visual, and land use impacts were assessed and determined to benegative.
• The size of the system, combined with the site constraints at the Morro Bay PowerPlant, would present substantial constructability problems for both alternatives.
The report was presented to the CEC, RWQCB, and other stakeholders on August 9, 2001.During the past several months, these agencies have asked additional questions about Duke’sassumptions concerning the size of the units, noise from the units, constructability issues,estimated efficiency (power) losses, and total economic costs.
To help the agencies and other stakeholders better understand Duke’s thinking and analysis ofthe cooling alternatives, eliminate conflicting information on this matter, and update Duke’sanalysis based on the currently best available data, Duke has prepared the analysis below.
as proposed, the significant effects of the alternative shall be discussed, but in less detail than the significant effectsof the project as proposed. (County of Inyo v. City of Los Angeles (1981) 124 Cal.App.3d 1)." Guidelines section15126.6(d )3 See:
a. Economic Analysis of Cooling Water Alternatives that Duke submitted to RWQCB and CEC onJune 29 and July 2, 2001 respectively.
b. “Evaluation of Alternative Intake Technologies – Air-Cooled Condensers” Report, dated August 9,2001, delivered to the City of Morro Bay on with copies sent to CEC, RWQCB, and CCC for moredetails. A summation of the previous analysis is provided in Appendix B of this document.

Duke Energy Morro Bay, LLC PageUpdated Analysis of Alternative Cooling Systems
4
Note: We received the Tetra Tech alternative cooling report (dated December 26, 2001)prepared for the California Regional Water Quality Control Board (Central Coast Region) justprior to publishing this report. We have done a cursory evaluation of their work and have drawnsome preliminary conclusions. While Tetra Tech makes several good points in a number ofareas, we do not agree or accept their alternative cooling costs or the technical data upon whichthey are based. The systems presented appear more representative of generic designs, andtherefore do not reflect the specific requirements of the Morro Bay site. The report’s conclusionssignificantly underestimate the system sizing and costs necessary for alternative cooling systemsat the Morro Bay site. Duke will provide additional information after we have more fullyevaluated the report.
4 Updated Cooling Options AnalysisTo better understand the environmental and economic impacts of using alternative cooling forthe proposed MBPP Project, Duke conducted additional evaluations of the cooling wateralternatives. In the course of the last month, Duke refined the methodology, validatedassumptions, corrected some deficiencies in previous data, and identified and verified probableenvironmental impacts.
Revisiting the assumptions used in previous work allowed a more in-depth design anddevelopment effort. This, in turn, led to a resizing of equipment to satisfy operating limits andachieve operating flexibility to allow the plant’s target output to be reached across almost theentire ambient temperature range. Key considerations include:
• A design cycle that enables an alternately cooled plant to consistently produce 1200 MWexcept at the extreme high temperature range. This is a different methodology than theearlier analysis. Upon revisiting the initial design assumptions, Duke allows for variations inthe duct firing rate within the current duty cycle as depicted in Appendix L in order toachieve 1200 MW.
• Duke discovered that the air cooled condenser was undersized in the earlier analysis andresulted in a steam turbine back pressure that exceeded the equipment limits at higherambient temperatures. This occurred as the analysis for sizing the condensers did notconsider the full ambient temperature range, but rather focused on a single averagetemperature. In effect, this is an error that has been corrected in this analysis.
• More accurate equipment size and configuration estimates allows Duke to more realisticallyrepresent the required plot space and location for each alternative.
• Consideration of earthquake “Zone 4” criteria in the structural design performance elements.
• Evaluation of the impacts, if any, to stack heights (to meet air emissions standards) andscenic visual corridors due to the height of the coolers with the more specific designelements.

Duke Energy Morro Bay, LLC PageUpdated Analysis of Alternative Cooling Systems
5
• Research by Duke into 1) if (and how) the cooling towers could be designed to ensurecompliance with federal, state, and local noise requirements, and 2) establishing preliminaryvendor costs and capabilities necessary to achieve compliance.
For specific details associated with the above items please refer to Appendix A.
4.1 Current Cost and Size EstimatesAfter Duke completed a more in-depth design cycle, the two primary ACC vendors werecontacted to provide budgetary estimates based on the design parameters. The vendors providedpreliminary size and configuration, a quote for the capital and erection costs of their equipment,and the lowest noise level achievable at 400 feet from their condensers.
Based on the vendor supplied capital and installation quotes, Duke estimated the installed capitalcosts shown in Table 1 (a detailed cost buildup is shown in Table 2). Please note that the 316(b)analysis requires that the costs be evaluated on an incremental basis. These costs are incrementalover and above the costs otherwise incurred with the proposed once-through sea-water coolingsystem.
Table 1: Current Installed Capital and Annual O&M Cost Estimates (in millions)
Capital Cost Annual O&M
Alternative Absolute Incremental Absolute Incremental
Once-through cooling(Base Case)
$25 $0 $0.3 $0
Air Cooled Condenser $80 - $85 $55 - $60 $0.6 $0.3
Hybrid Wet/Dry Cooling $81 - $86 $56 - $61 $0.8 $0.5
While the vendors responded with slightly different equipment configurations, both vendorsrequired approximately 60,000 square feet of plot space per power block (120,000 square feettotal) -- approximately 185 feet x 320 feet for each 600 MW power block for the ACC system.The plot requirement is further complicated by the fact that to avoid significant design issues, amaximum of six fans per bay can be used. The units were placed on the plot plan and kept asclose to the steam turbines as possible (125 feet). Even this compact configuration for theminimum footprint required by the air coolers exceeds the amount of land available on the Dukeproject site. Detailed plot plans are in Appendix D, and site constraints are further explained andvisually demonstrated in Appendix E.

Duke Energy Morro Bay, LLC PageUpdated Analysis of Alternative Cooling Systems
6
Table 2: Detailed Cost Buildup
Air CooledCondenser
(in millions)
Hybrid Wet/DryCooling
(in millions)
Equipment $40.5 $36
Erection $20 $15
Preparation*, ** $20-25 $15-20
WWTP Upgrades*** N/A $15
Absolute Capital Cost (roundedto Nearest $5 million)
$80 – $85 $81 - $86
* Preparation includes pilings, foundations, piping, and duct work to equipment; electrical work;instrumentation; and control.
** These costs DO NOT include undefined complexities such as: constructibility impacts related tospanning the return tunnels, minimization of down time, corresponding impact to ACC structure tospan the tunnels, and a number of other potential, but undefined, costs that would evolve during detaildesign.
*** Due to the scarcity of fresh water supplies and the desire to eliminate the use of seawater as the make-up water for the cooling tower in Hybrid Wet Dry alternative, Duke assumed the make-up water to beprovided solely by the effluent discharge of the Morro Bay WWTP (Waste Water Treatment Plant).The water quality discharge currently does not meet the required quality for cooling tower4 use. Atleast $15MM would be required to upgrade the WWTP discharge to disinfected tertiary quality5; thequality level required for water used in a cooling tower. The required investment is included in theHybrid Wet/Dry Cooling capital cost. However, the cost to bring a pipe from the WWTP to the MBPPsite is not included. It should be noted that it is not certain the WWTP could reliably supply the 1,400gpm assumed in our analysis. If it can’t, then the size of the Air Cooled Condenser in the Hybridsystem may have to be increased, increasing the cost and footprint.
In addition to the increased square footage necessary to accommodate the additional equipment,the overall height of the units (ACC) will be 110 feet.6 The first 65-70 feet of the units are openstructure (support columns and bracing); the remaining top 40-45 feet would be a solid massenclosure covering the condensers. The top of the distribution header would be 110 feet andbecome the highest structure in the plant, except for the stacks, adding substantial bulk anddensity to the facility.
Other critical issues arise from locating the unit in an earthquake "Zone 4 plus" area. Thislocation also requires the unit to span the existing seawater return tunnels-- a difficult 4 California Health Code, Title 225 Cayucos/Morro Bay Comprehensive Recycled Water Study, Carullo Engineers, March 2000
6 The earlier KOPs that Duke submitted were incorrectly rendered. They showed the distribution header atapproximately 65 feet. This was a computer rendering error. The earlier configuration should have been portrayedas the same 110 feet height.

Duke Energy Morro Bay, LLC PageUpdated Analysis of Alternative Cooling Systems
7
engineering problem. How to solve this issue has yet to be assessed, but the results wouldcertainly impact cost (equipment and construction) as well as constructability. These potentiallysignificant costs have not been estimated and are NOT reflected in Table 1 above.
4.2 Visual Impacts
4.2.1 Air Cooled CondensersThe visual analysis of cooling alternatives was based on a set of four visual simulations, whichare included in Appendix F. A visual simulation uses a digital photograph of existing sceneryand overlays a three-dimensional computer model of the equipment as viewed from the samelocation. The result is a photo-realistic representation of the design alternative as it would appearfrom a selected KOP:
• KOP 7 Near view from beach, increased public access, condensers visible• KOP 8 View from west, representative of view from water• KOP 14 Representative view from neighborhoods on hillside to northeast.• KOP 15 Residential view, from hillside to east
The visual analysis compares the Project as proposed in the AFC, with the visual changeincurred as a result of the addition of cooling equipment. Each KOP simulation was evaluatedby a set of four criteria:• Area occupied by the power plant and the new cooling equipment• Area penetrating skyline (extending above horizon)• Horizontal field of view (width of area occupied by the power plant)• Obstruction of features (Views of the Rock, Ocean, Beach or Distant hills that would
otherwise be visible)
The Project, as defined in the AFC, is smaller in height and bulk and occupies less of the coastalsite than the ACC alternative. The ACC alternative requires large array of air condensers in anenclosure that in every case, when evaluated against the visual criteria, consistently caused asignificant negative visual effects. Specifically, the negative visual effects of adding air coolingequipment to the MBPP include; (1) a significant increase in the total area occupied by the powerplant, (2) significant increase in the area penetrating the skyline or obstructing coastal features,and (3) significant increases in the horizontal field of view occupied by the power plant. Each ofthese findings is inconsistent with the City of Morro Bay’s expressed desire to minimize theheight and bulk of the facility. It is Duke’s belief that the size of these condensers would not beacceptable to the larger community in Morro Bay. Please see discussion below in Section 4.7regarding Morro Bay Community Concerns.
4.2.2 Hybrid Wet/Dry Cooling SystemThe Hybrid alternative would have similar impacts as the air-cooled condensers. However, thewet cooling towers associated with the hybrid system also tend to generate visible water vaporplumes. As the wet cooling towers would be operated on a continuous basis, the frequency with

Duke Energy Morro Bay, LLC PageUpdated Analysis of Alternative Cooling Systems
8
which these plumes would be generated will probably be greater than the frequency predicted forthe HRSG plumes associated with the proposed project. The plumes from the towers would alsobe much larger, across the entire surface area of the tower.
See Appendix F for the KOPs and a complete review of the visual implications.
4.3 Noise ImpactsThis section summarizes an additional noise impact assessment conducted for the two alternativesystems. Since these two cooling system alternatives are in lieu of the existing sea water intake,underground, and outfall facilities, either of these alternative cooling systems would be anaddition to the AFC-proposed plant design. As such, when compared to the plant designproposed in the AFC, they would add noise sources and aggregate plant noise emissions. Thesepotential additional noise impacts were investigated to determine a first-order assessment of thechanges due to alternative cooling. Noise level information was received from manufacturer7
documentation and used to assess the additional plant emissions. This noise level informationwas engineering data only and is not fully qualified, nor contractually guaranteed by the vendor.As such, there is some potential for error in using these values, but they were, nonetheless,deemed adequate for this first-order evaluation.
For the ACC option, the vendor calculated an engineering noise level estimate of approximately46 dBA at 400 feet from the periphery of each air-cooler bank (there would be two such banksfor the ACC alternative). For the Hybrid system, the vendor calculated an engineering noiselevel estimate of approximately 44 dBA at 400 feet from the edge of the equipment envelope ofeach air-cooler-plus-cooling-tower system8 (there are two such systems for the Hybridalternative). These vendor noise levels are considered to be ‘best-case’ values that are at thelimit of achievable noise reduction methods for this type, size, and service of cooling system.
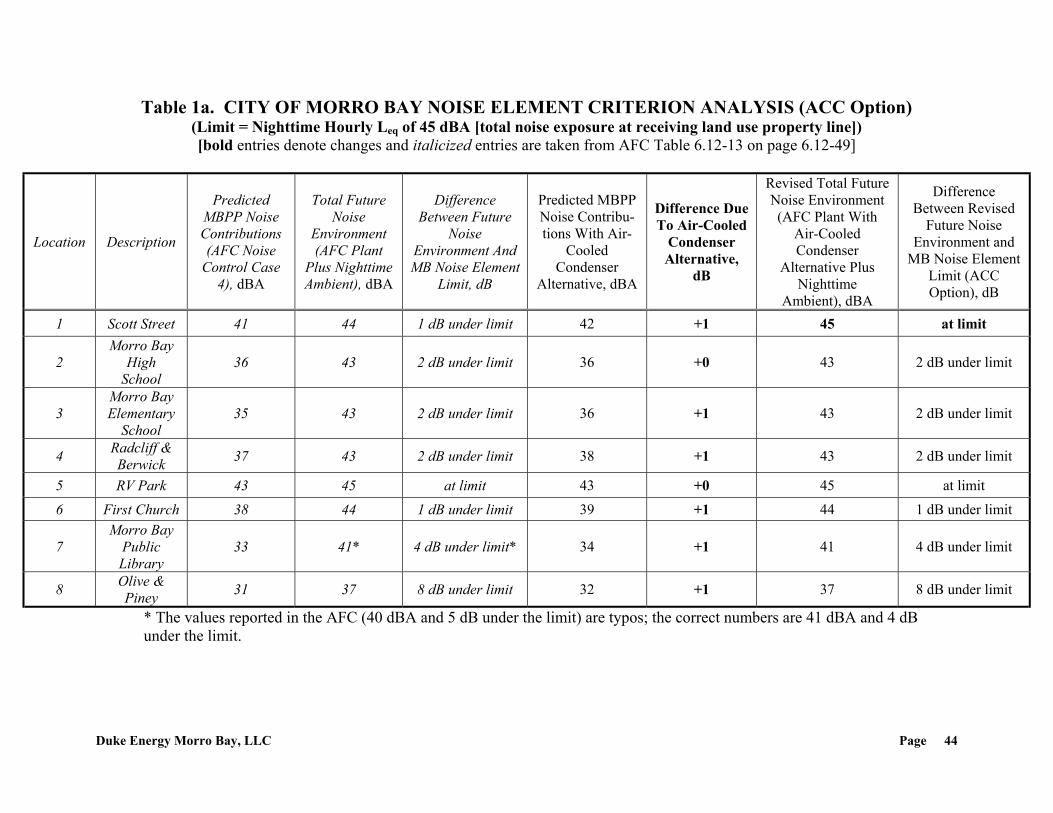
The same basic prediction methodology as used for the AFC was employed for this investigationas well as the physical configuration of equipment, berm, and wall barriers. The predicted noiselevels at the same receptor locations used in the October 2000 AFC were calculated andcompared to the aggregate noise impacts from the AFC-proposed plant design. Thus, thechanges in noise solely from the use of the ACC or Hybrid alternative cooling were found. Theresults of these calculations are summarized in the tables presented in Appendix G.
4.3.1 ACC AlternativeFor the ACC alternative, the nominal increase at residential and sensitive receptors is +1 dB(compared to the AFC design). However, the change to the (LORS-critical) RV Park receptorlocation (and, by interpolation, the closest areas of the creek/wetlands areas) is shown as +0 dB.At the tourist areas to the west, northwest, and southwest of the project site, the nominal increaseis +2 dB. For this option, all identified receptor areas are still within compliance of the pertinentregulatory limits, but the Scott Street location has now joined the RV Park as a second critical 7 The potential vendor contacted for these analyses was GEA Power Cooling Systems, Inc.8 Note that this value does not include the circulating cooling water pump trains, which are typically not part of acooling tower scope-of-supply .

Duke Energy Morro Bay, LLC PageUpdated Analysis of Alternative Cooling Systems
9
receptor (i.e., future noise is predicted to be right at the Noise Element limit). Please note that toeven reach these aggressive noise results, an increased cost ACC package would be required.These increased capital costs are reflected in Table 1.
4.3.2 Hybrid AlternativeFor the Hybrid system, the nominal increase for this cooling option at the residential andsensitive receptors is +4 to +5 dB. This is mostly due to the cooling tower water pumps, eventhough they are assumed to be “quiet-design” units. As with the ACC option, the change at thecritical RV Park is shown to be +0 dBA (again, due to residual barrier attenuation effects in thatdirection). The general increase at residential/sensitive receptors means that two locations arenow predicted to be out of compliance with the Noise Element limits – these are locations 2(Scott Street) and 6 (First Church9). Furthermore, location 4 (Radcliff & Berwick) is now acritical receptor right at the Noise Element limit. At the tourist areas, the increase will besubstantial -- upwards of +10 dB at some locations. This increase is from the cooling waterpumps and lack of substantial barrier benefits in the direction of the tourist-related areas. For theColeman Park location, this cooling alternative can be expected to yield noise levels that arecomparable to the existing power plant environment.
In summary, the best-case analysis for noise impacts shows a slightly increased, but stillcompliant, situation for the ACC option. However, the marginal acceptability at the closestreceptors to the project site has been reduced by the ACC addition. Further, this analysis usespreliminary vendor data and when further detailed design and engineering becomes available,these parameters may not be attainable. If any of the assumptions behind the best-caseconfiguration later prove to be overly optimistic and/or unattainable in the actual installation,then noise compliance may be compromised, with little or no mitigation recourse. For theHybrid option, the evaluation shows noise levels that can be expected to fail the city’s NoiseElement limits at one or more receptor locations (again, this is for the assumed best-caseconditions). However, unlike the ACC option there may be additional (potentially expensive)mitigation measures that could be considered during detail design to potentially reduce the noiseemissions from these predominant sources.
In short, both the ACC and Hybrid cooling alternatives are, at best, problematic for achievingfuture noise compliance and are less beneficial when compared to the AFC-proposed projectdesign. Given the results of the noise analysis, Duke management does not have confidence thatthe noise limits can be met with the ACC system.
4.4 Air Quality ImpactsSierra Research reevaluated worst-case air quality impacts using the same operating assumptionsthat were used in the AFC. The modeling analysis (see Appendix H for more details) concludedthat due to the distance between the stacks and the new cooling structures, the ACC alternativehad no effect on maximum modeled impacts. The addition of cooling towers in the Hybridsystem resulted in increases in ambient PM10 impacts over both the proposed project and theACC cooling alternative.
9 It should be noted that this location is no longer a functioning church and that the general surrounding area ispredominantly commercial/hotel usages.

Duke Energy Morro Bay, LLC PageUpdated Analysis of Alternative Cooling Systems
10
With respect to the Hybrid alternative, the wet cooling towers associated with the hybrid systemtend to generate visible water vapor plumes. As the wet cooling towers would be operated on acontinuous basis, the frequency with which these plumes would be generated will probably begreater than the frequency predicted for the HRSG plumes associated with the proposed project.
4.5 Land Use ImpactsCalifornia Environmental Associates has evaluated potential land use impacts associated with thealternative cooling scenarios. As noted above, even the minimum configuration required toaccommodate either alternative cannot be built within the boundaries of Duke’s current site. Toaccommodate the large dry cooling condensers and/or towers at a best-engineering appropriatelocation, a portion would have to be built on PG&E property (see Appendix E). Duke does notcurrently own this property, nor is there any suggestion that PG&E would be willing toreconfigure the switchyard to accommodate such a need. Even if such an option could betechnically achieved, the costs are unknown at this time, but could be many millions of dollars.
There are multiple policies in the Certified Land Use Plan and General Plan that call forprotecting and improving the visual corridors in Morro Bay. For example, LCP Policy 5.01states: “....power plant expansion on PG&E owned property shall have priority over other coastaldependent industrial uses. Power plant expansion shall be limited to small facilities whoselocation would not further effect the views of Morro Rock from State Highway One and high usevisitor-serving areas, consistent with Policy 12.11.” Given the size, height, and locationrestraints presented by the air cooling alternatives, were either option to be required, there wouldbe at least nine specific conflicts with existing land use regulations and ordinances. SeeAppendix I for a complete discussion.
While the MBPP modernization and replacement project, as originally proposed in the AFC,complies with the height requirements outlined in the City of Morro Bay Municipal CodeSection 17.24.150, an air-cooled or hybrid system would not comply because these additionalstructures would be considered a “new” facility. Accordingly there would be a non-conforminguse due to the height limit that would only be permitted through a city council approved changeto the current ordinance.
4.6 Terrestrial Biology ImpactsThe Huffman Broadway Group, Inc. (HBG) has evaluated the terrestrial biology impacts of thetwo alternative cooling methods. Plot plans (see Appendix D) indicate that although bothalternatives result in larger facility footprints than the proposed project, these additional facilitieswould be sited on industrialized areas that are currently utilized by the MBPP or PG&E (PG&Eswitchyard). Both of these areas have minimal habitat value. Based on the plot plans, neitheralternative would result in substantially different terrestrial habitat impacts when compared to theproposed project. However, were it to be technically infeasible to utilize PG&E property, thiswould require a shift of the cooling facilities to the west. This would lead to significantconstraints and for the air cooled condenser system could possibly lead to negative impacts to thecoastal dune scrub Environmentally Sensitive Habitat Area (ESHA) if the footprint intruded intothis area.
Duke Energy Morro Bay, LLC PageUpdated Analysis of Alternative Cooling Systems
11
Air quality analyses of the two alternatives, conducted by Sierra Research, indicate that overallthere were no significant changes to the modeled pollutant values related to these alternativeswhen compared to the proposed project. Therefore, no significant adverse impacts to terrestrialbiological resources related to air quality are expected as a result of either of these alternatives.
Noise analyses indicated that neither alternative results in an increase in noise at the MorroCreek ESHA as compared to the proposed project. This is due to the potential shielding byeither the heat recovery steam generation system (HRSG) and/or the northern berm and theproposed sound wall. In general, predicted increases in decibel levels at receptor locations to thewest, northwest and southwest related to the ACC alternative are not significant. Predictedincreases in decibel levels at receptor locations to the west, northwest and southwest related tothe Hybrid alternative would be greater than those calculated for the ACC alternative, however,would also not be significant. Increases in noise levels at the Coleman Park location, which isadjacent to dune scrub ESHA, would be comparable to the existing ambient noise level under theHybrid alternative. Neither noise levels from the proposed project nor increases related to theHybrid cooling alternative would be expected to interfere with breeding behavior of peregrinefalcons at Morro Rock, since both the proposed project and the hybrid cooling alternative noiselevels are below the existing ambient noise level at Morro Rock. In summary, no significantadverse impacts to terrestrial biological resources are expected as a result of predicted noiselevels of either of the two cooling alternatives.
See Appendix J for a complete discussion of the issues.
4.7 Morro Bay Community ConcernsThroughout the AFC preparation process over the past two years, Duke has heard repeatedlyfrom both City leaders as well as the general public that it is critical to minimize the height andbulk of the power plant. Views from the surrounding hillside residences of both the ocean andMorro Rock are highly valued. A sampling of quotes from various City meetings and resolutionsis shown below as examples of the City’s position.
“…and replace the old plant in two phases with a state of the art, low profile facility.” (StaffReport to the Mayor and City Council. December 10, 1999.)
“Whereas, in November 2000, the voters of the community expressed their strong support for theremoval of the existing plant and construction of a new, less obtrusive, more efficient, modernfacility…” (City of Morro Bay. Resolution No. 22-01: Resolution of the City Council of theCity of Morro Bay, California. Morro Bay, CA.)
“…and its replacement with a substantially smaller, less visually obtrusive facility.” (City ofMorro Bay. Resolution No. 57-01: Resolution Regarding Alternative Cooling MethodsProposed for the Morro Bay Power Plant. Morro Bay, CA.)

Duke Energy Morro Bay, LLC PageUpdated Analysis of Alternative Cooling Systems
12
“…to reduce the visual obtrusiveness of the new facility.” (City of Morro Bay. Resolution No.57-01: Resolution Regarding Alternative Cooling Methods Proposed for the Morro Bay PowerPlant. Morro Bay, CA.)
“I have no problem with the CEC analyzing enclosure. What I have a problem with is that itseems to me to be not what our residents indicated they wanted at the very beginning, which wasless bulk and more view of the ocean and the Rock.” (Janice, Peters, Morro Bay City CouncilMember, November 13, 2001, Morro Bay City Council Meeting)
The Duke team also believes that minimizing the height and bulk of the new power plant isconsistent with minimizing overall visual impact. Our analysis shows that a low profile, openplan maximized views through the power plant site to the ocean and Rock, and is thereforerecommended. Both of the alternative cooling scenarios involve increasing the height and bulkof the facility and therefore do not address the concerns of the City of Morro Bay nor those of itscitizens.
Another key concern of the City Council is their strong desire that the Duke facility maintain itscurrent seawater cooling system. The use of Duke’s discharge tunnel and the co-mingling ofDuke’s discharge with the discharge from the City’s desalination plant is mandated by the City’scurrent NPDES permit.
4.8 Economic ImpactThe previous methodology employed to compare the relative economic costs of alternativetechnologies has been refined. Specifically, a more direct and improved method foreconomically evaluating the loss in efficiency as a result of the alternative cooling systems hasbeen used. Also, improvements have been made to the duty cycle.
In the prior analysis, the economic cost of the efficiency loss resulting from the coolingalternatives was evaluated using a constant fuel-input rate. The current analysis uses a morestraightforward approach by evaluating the incremental fuel requirements for the alternativeskeeping their net-output equal to the net-output of a once-through cooled plant. The economiccost of the loss in efficiency is then simply the increased cost of fuel. The incremental fuelrequirements are evaluated over the current duty cycle (Appendix L). The fuel usage of a once-through cooled plant and each alternative (for a constant output) are shown in Appendix M.10
The incremental annual fuel use for both the ACC and Hybrid cases is approximately900,000MMBtu/yr. The resultant incremental annual energy cost is about $4 million based on amean projected future natural gas cost of $4.23/MMBtu.
The current duty cycle is based on the air permit, which allows up to 400 hours of startup, 4000hours of duct firing limited to no more than 16 hours a day, and 4000 hours of non-duct firingeach year. For purposes of this analysis we have eliminated the 400 hour startup consideration,which makes the analysis more conservative. Duke also corrected deficiencies in the threetemperature points (summer peak, summer average, and remaining) selected for the previous
10 For the purpose of this analysis, Duke made the simplifying assumption that the increased fuel usage is equivalentfor both alternatives. Based on experience, Duke expects the Hybrid alternative to consume slightly more fuel for agiven output. Additional engineering would need to be done to understand the magnitude of the difference. Dukebelieves this conservative assumption is appropriate in the context of the accuracy of the overall analysis.

Duke Energy Morro Bay, LLC PageUpdated Analysis of Alternative Cooling Systems
13
duty cycle. First, the summer average temperature was understated because the annual meanhigh temperature was used rather than the mean high during just the summer months. Second,distinct summer average and peak temperature points do not provide additional resolutionbecause of the infrequency with which the peak temperature occurs (< 30 hrs/yr). The currentannual duty cycle, as outlined in Appendix L, is based on two temperature points and reflects theair permit limits.
The incremental economic costs for the alternative cooling technologies from the currentanalysis are summarized in Tables 3 and 4. A discussion of the results is presented in AppendixN. It should be noted that these results are site specific. If an air cooled or hybrid cooled plantwas constructed in another location which did not have the moderate, relatively constant ambienttemperature of Morro Bay, the economic impact will be very different. For example, if analternatively cooled plant was constructed in an inland environment, such as Fresno, theeconomic impact would be significantly greater because of the ambient condition variability andlarger temperature extremes.
Table 3: Air Cooled Condenser Summary Economic Cost Results (in millions)
TotalCapitalCosta
IncrementalO&M Cost
($/YR)
IncrementalEnergy Cost
($/YR)
TotalAnnual
Cost($/YR)
PresentValue
AmortizedAnnual
Cost($/YR)
$55 -$60
$0.3 $3.8 $4 $106 -$111
$9
a. incremental
Table 4: Hybrid Wet/Dry Cooling Summary Economic Cost Results (in millions)
TotalCapitalCosta
IncrementalO&M Cost
($/YR)
IncrementalEnergy Cost
($/YR)
TotalAnnual
Cost($/YR)
PresentValue
AmortizedAnnual
Cost($/YR)
$56 -$61
$0.5 $3.8 $4 $109 -$114
$9
a. incremental

Duke Energy Morro Bay, LLC PageUpdated Analysis of Alternative Cooling Systems
14
In brief, key economic conclusions of this analysis are:
• The economic impact of the alternatives were evaluated on an incremental PresentValue (PV) and annual cost basis. The Present Value encompasses the capital cost ofthe alternative, the annual O&M costs, and the value of reduced plant efficiencyexpressed as the cost of additional fuel required for the plant to equal the net output ofthe once-through cooling base-case (Figure 1).
• For air-cooled condensers the incremental PV costs were estimated to be $106-111million, equivalent to $9 million on an annualized basis.
• For the hybrid wet/dry alternative the incremental PV costs were estimated to be$109-114 million, equivalent to $9 million on an annualized basis.
• A Hybrid Wet/Dry cooling system has roughly the same economic impact as an AirCooled Condenser while introducing additional equipment complexity and wateravailability issues. For these reasons, the Hybrid is the less desirable option.
• Duke concludes that the economic impact of alternative cooling systems are stilldisproportionate to the probable benefits.
Figure 1: Present Value Composition
$4 $6
$47 $47
$55 $56
$-
$20
$40
$60
$80
$100
$120
Air Cooled Condenser Hybrid Wet/Dry
Incr
emen
tal P
V ($
mill
ion)
Incremental O&M Incremental Annual Energy CostIncremental Capital Cost
PV = $106 PV = $109

Duke Energy Morro Bay, LLC PageUpdated Analysis of Alternative Cooling Systems
15
5 ConclusionsThis paper summarizes Duke’s best available information concerning the costs, environmentalimpacts and other constraints of two possible alternatives to the proposed project’s seawatercooling system. It is Duke’s opinion that even if any such alternative could be constructed (anopen question), that it would be less protective of the environment than Duke’s proposed project.
To carry out this analysis, Duke built upon our original analysis and changed assumptions andmethodology as appropriate to account for our evolving understanding of various attributes ofeach alternative. Duke’s estimates of economic costs have been derived by contractors andvendors using their best engineering judgments rather than from detailed drawings and plans.Accordingly, the magnitude of these costs is most probably understated.
To summarize the key attributes of both alternatives:
1. Neither the air-cooled nor hybrid alternative could be constructed within the footprintconstraint of Duke’s current site.
2. Neither the air-cooled nor hybrid alternative would comply with several ordinances andregulations (LORS) with respect to negative visual impacts of new structures on the coast ofCalifornia.
3. Neither the air-cooled nor hybrid alternative is consistent with the strongly expressed desiresof the community with respect to the visual impacts of the project.
4. When compared to Duke’s proposed project, both alternatives would have negative visual,and noise impacts.
5. It is not clear that it is even feasible to construct either alternative, given the site constraintsand required earthquake standards. Were these limitations to be fully analyzed, project costsare expected to be significantly higher.
6. While the estimated costs of both alternatives is considerably less than in our previousanalysis, even the reduced incremental costs of either alternative ($106-$114 million on a NetPresent Value basis) are wholly disproportionate to relatively modest marine biology benefitsfrom reduced use of seawater cooling.
7. Hybrid cooling represents the worst of both worlds: Increased complexity over air-cooledcondensers means lower reliability for about the same cost, and it is premised on availabilityof make-up water that is far from certain.
Finally, were such a cooling system to be required by CEC as a condition of certification, itwould jeopardize the project and, at a minimum, would require renegotiation of Duke’sagreement with the City of Morro Bay because total project costs would be prohibitive whenconsidered in the context of the various economic benefits (such as voluntary tear down of theexisting plant) that have been offered to the City.

Duke Energy Morro Bay, LLC PageUpdated Analysis of Alternative Cooling Systems
16
Appendix A – Key Assumptions Matrix
Issue Previous Analyses Current Analysis Explanation
Net plant output ofplant with alternative
cooling systems
Design and condenserconfiguration not
capable of producing1200 MW over
ambient conditionswith alternativecooling systems.
Design plant toproduce 1200MW net
over ambientconditions with
alternative coolingsystems11
The Proposed Project is anominal 1200MW output, soanalysis should reflect this.
Valuing reducedefficiency ofalternatives
Use hypotheticalmake-up plant asvalue proxy for
reduced efficiency(loss in net output)
while fuel inputremains constant.
Value increased fueluse to account forreduced efficiencywhile maintaining
output of alternativeand once-through
cooled plants equal.
Current analysis is a morestraightforward method of
valuing efficiency loss.
Discount Rate 7% 7% By direction of RWQCB.
Project Life 30 Years 30 Years By direction of RWQCB.
Annual Duty Cycle 2,602 hr @64oF26 hr @ 85oF
5,256 hr @ 57oF Allat constant fuel input
1,952 hr @68oF1200MW
2048 hr @ 57oF1200MW
976 hr @ 68oF996MW
3024 hr @ 57oF1021MW
Current duty cycle reflectsoperation limits set by air
permit and ambientconditions.
Natural gas price $5/MMBtu $3.05/MMBtu MIN$4.23/MMBtu AVG$4.89 /MMBtu MAX
Current price reflects likelyfuture price range based on
forward market data.
Air CooledCondenser
Incremental PV
$301MM $106 to $111 MM Lower PV a result of changein valuing efficiency impactand changes to underlying
capital costs.
11 Technically there is a limit to how much fuel can be injected into the HRSG to make up for the lost efficiency ofthe alternatives at high ambient temperatures. This constraint only surfaces at high temperatures of around 85degrees where output cannot be maintained at 1200MW. This will have a negligible impact on the analysis becauseof the relatively few hours per year of very high ambient temperatures.

Duke Energy Morro Bay, LLC PageUpdated Analysis of Alternative Cooling Systems
17
Issue Previous Analyses Current Analysis Explanation
Air CooledCondenserIncremental
Amortized AnnualCost
$24MM $9 MM Result of lower PV.
Air CooledCondenser
Absolute Capital Cost
$64MM $80 to $85 MM Larger condensers requiredfor plant to produce 1200MW
net output over ambienttemperature range. Also, low
noise package added.
Air CooledCondenser
Incremental CapitalCost
$39MM $55 to $60MM Larger condensers requiredfor plant to produce 1200MW
net output over ambienttemperature range. Also, lownoise package added to design
costs.
Air CooledCondenser
Absolute O&M Cost
$0.6MM $0.6MM Small influence on PV soassumed to be the same.
Air CooledCondenser
Incremental O&MCost
$0.3MM $0.3MM Small influence on PV soassumed to be the same.
Air CooledCondenser
Annual Energy Cost
$14MM $4MM Change in valuationmethodology and changes infuel cost and plant heat rate.
Hybrid Wet/DryCooling Incremental
PV
$273MM $109 to $114 MM Lower PV a result of changein valuing efficiency impactand changes to underlying
capital costs.
Hybrid Wet/DryCooling IncrementalAmortized Annual
Cost
$22MM $9 MM Result of lower PV.
Hybrid Wet/DryCooling Absolute
Capital Cost
$61MM $81to $86 MM Smaller cooling tower incurrent design, but investmentrequired to upgrade WWTP.
Hybrid Wet/DryCooling Incremental
Capital Cost
$36MM $56 to $61MM Smaller cooling tower incurrent design, but investmentrequired to upgrade WWTP.

Duke Energy Morro Bay, LLC PageUpdated Analysis of Alternative Cooling Systems
18
Issue Previous Analyses Current Analysis Explanation
Hybrid Wet/DryCooling Absolute
O&M Cost
$0.8MM $0.8MM Small influence on PV soassumed to be the same.
Hybrid Wet/DryCooling Incremental
O&M Cost
$0.5MM $0.5MM Small influence on PV soassumed to be the same.
Hybrid Wet/DryCooling IncrementalAnnual Energy Cost
$12MM $4MM Current energy cost lower as aresult of hypothetical “make-up” plant’s lower heat rate,lower fuel price, and equalnet-output methodology.
Hybrid cooling towermake-up water
requirement
5,000 GPM seawater 1,400 GPM
Reclaimed Waterfrom the WWTP
Desire to eliminate use of anyseawater in alternatives in
order to minimize air qualityand biology impacts. Most
practical source for asufficient quantity of freshwater is WWTP. Limited
freshwater supplies setavailable makeup rate.
No desalination capability.
Temperature limit ofHRSG
Original HRSGlimited to 1450oF
Redesigned HRSGlimited to 1550oF
Up to 60 MW additionaloutput at high ambient
temperatures with minorHRSG cost increase.
Air CooledCondenser Design
Criteria
Specification at 64°Fambient
Specification at 85°Fambient to maintain
steam turbine exhaustpressure below
7.0”HgA equipmentlimitation.
Considering normal steamturbine exhaust pressure
limitation.
Air CooledCondenser Noise
Standard Air CooledCondenserEquipment
Low-noise packagefrom GEA
Standard ACC not capable ofmeeting City noise
requirements, so add lownoise package in an attempt to
meet requirements.

Duke Energy Morro Bay, LLC PageUpdated Analysis of Alternative Cooling Systems
19
Appendix B – Previous Analysis Presented in the316 (b) Report
PREVIOUS CAPITAL COST AND SIZE ESTIMATESEvaluating the alternatives at the conceptual level enabled Duke to quickly obtain quotes andpreliminary equipment sizing from vendors. Given the vendor information, Duke evaluated fourpossible plot configurations, estimated economic costs, and evaluated probable efficiencyimpacts of the alternative cooling systems. The estimated capital and O&M costs for thealternatives are summarized in Table 1.
The incremental cost numbers represent the net increase in costs compared to the baseline (once-through cooling). These costs were calculated by subtracting the baseline cost from thealternative cooling cost.
Table 1: Previous Capital and Annual O&M Cost Estimates (in millions)
Capital Cost Annual O&Ma
Alternative Absolute Incremental Absolute Incremental
Once-through cooling(Base Case)
$25 $0 $0.3 $0
Air Cooled Condenser $64 $39 $0.6 $0.3
Hybrid Wet/Dry Cooling $61 $36 $0.8 $0.5a. excludes energy cost to run fans and other equipment
PREVIOUS ECONOMIC IMPACTThe plant efficiency impacts of the alternatives were calculated keeping the fuel (gas)consumption constant. This enabled Duke to evaluate the net plant output differences, inmegawatts, between the alternatives and thus estimate the resultant economic impact. Thedifference in plant net-output between a once-through cooled plant and the alternatives wasevaluated at the three temperature points in the duty cycle (Appendix K). The economic cost ofthe reduced output was determined by using a hypothetical “make-up” plant as a value proxy.The economic cost reflected the capital cost to build the “make-up” plant (sized to meet themaximum reduction in net-output of the alternatives) and the annual fuel cost for the “make-up”plant ( assumed plant’s output over the duty cycle was exactly equal to the difference in outputof a once-through cooled plant and the alternatives). The resulting capital and annual fuel cost ofthe “make-up” plant are shown in Table 2.

Duke Energy Morro Bay, LLC PageUpdated Analysis of Alternative Cooling Systems
20
Table 2: “Make-up” Plant Cost Estimates (in millions)
Capital Cost Annual Fuel Cost
Proposed Plant CoolingSystem
Absolute Incremental Absolute Incremental
Once-through cooling(Base Case)
$0 $0 $0 $0
Air Cooled Condenser $82 $82 $14 $14
Hybrid Wet/Dry Cooling $80 $80 $12 $12
PREVIOUS RESULTS AND CONCLUSIONSThe initial evaluation resulted in two key findings. First, the plot space available for eithercooling alternative was inadequate on two levels. First, it was not clear that a plant using one ofthe alternative cooling methods could be constructed within the given site and if it could, theproject would not minimize the down time between shutdown of the existing plant and startup ofthe new plant. Second, the megawatt loss and resultant economic cost of the alternatives relativeto once-through cooling are wholly disproportionate to any potential biological benefit. Forthese reasons, Duke concluded that an alternative cooling system would be an unacceptablealternative to once-through seawater cooling.
The following bullets provide more background on how Duke came to this conclusion.
PLOT SPACE• The total plot space available for the plant is both limited and complex. There are many
constraints on equipment placement that severely limit, if not preclude, most if not all,placement options on the available portion of the site.
• The planned plot space has been optimized for both equipment configuration and noisemitigation. It will be difficult to change the location of the plant without increasingenvironmental impacts from the facility.
• The air-cooled condensers (included in both alternatives) must be kept as close to thesteam turbine as possible. Failing to do this creates tremendous back-pressure(economic) inefficiencies and would require a disproportionately large duct pipe size totransmit steam to the condensers. These two factors challenge the very constructabilityof any of these alternatives.
• The only viable location for the air coolers is to place them immediately above theseawater return tunnels. However, this location presents serious constructability issuesand also introduces the risk of interrupting the existing plant's operations.

Duke Energy Morro Bay, LLC PageUpdated Analysis of Alternative Cooling Systems
21
ECONOMIC
• The maximum loss in net output for the alternatives is estimated to be 102MW for AirCooled Condenser alternative and 100MW for the Hybrid Wet/Dry Cooling alternative.
• The resultant incremental economic cost for the alternatives is summarized in Tables 3and 4.
• If a rigorous engineering design was undertaken for these alternatives, it is likely that alarger, even more expensive system would result.
Table 3: Air Cooled Condenser Summary Economic Cost Results (in millions)
TotalCapital
Cost
IncrementalO&M Cost
($/YR)
IncrementalEnergy Cost
($/YR)
TotalAnnual
Cost($/YR)
PresentValue
AmortizedAnnual
Cost($/YR)
$120 $0.3 $14 $15 $301 $24
Table 4: Hybrid Wet/Dry Cooling Summary Economic Cost Results (in millions)
TotalCapital
Cost
IncrementalO&M Cost
($/YR)
IncrementalEnergy Cost
($/YR)
Total AnnualCost
($/YR)
PresentValue
AmortizedAnnual
Cost($/YR)
$116 $0.5 $12 $13 $273 $22

Duke Energy Morro Bay, LLC PageUpdated Analysis of Alternative Cooling Systems
22
Appendix C – Analytical Framework & Document History
Table 1: MBPP Proposed Project: Simulation History
CONFIGURATION AMBIENT TEMPERATURENumber ofCTG
CTGLOAD
DUCTBURNER
34o F 57o F 64o F 68o F 85o F
2 50% Unfired AFC:1 AFC:1 AFC:12 75% Unfired AFC:1 AFC:1 AFC:12 100% Unfired AFC:1 AFC:1
NEW:1NEW:1 AFC:1
2 100% Fired AFC:1 AFC:1PRV:1NEW:1,2,3
PRV:1,2,3 NEW:1,2,3 AFC:1PRV:1,2,3
2 100% PartialFiringa
NEW:2,3 NEW:2,3
a. Duct burner of ACC/Hybrid cooled plant fired such that net output is equal to once-through plant with no duct firing
AFC Simulation for AFC 1 Once-through cooling
PRV Simulation for basis of 316(b) “Resource AssessmentReport” impacts (note: simulations performed at aconceptual level with a commensurate level ofprecision)
2 Hybrid Wet/Dry Cooling
NEW New simulation for the analysis in this document 3 Air Cooled Condenser
Document History
• Duke initially evaluated the feasibility of alternative cooling technologies for the proposedMBPP project as part of the development of the 316(b) Resource Assessment Report.
• May 11, 2001: Draft of 316(b) Resource Assessment Report submitted to the TWG(Technical Working Group) and the RWQCB (Regional Water Quality Control Board).
• June 29, 2001: Refined economic analysis submitted to the RWQCB in response to a requestfrom the RWQCB to further explain the economic considerations.
• July 2, 2001: Copy of Refined Economic Analysis report sent to the CEC
• July 10, 2001: Final 316(b) Resource Assessment report, incorporating the refined analysis,submitted to the CEC, RWQCB, and TWG .
• July 12, 2001: The results of the alternative cooling analysis at the RWQCB workshop.

Duke Energy Morro Bay, LLC PageUpdated Analysis of Alternative Cooling Systems
23
• August 9, 2001: “Evaluation of Alternative Intake Technologies – Air-Cooled Condensers”report delivered to the City of Morro Bay on with copies sent to CEC, RWQCB, and CCC .It provided additional information concerning the regulatory basis for alternative coolingtechnology evaluations, the technology review that was conducted, information relatedspecifically to the Air-cooled Condenser technology, and our conclusions. Report created inresponse to request for additional information on dry cooling from Morro Bay City Councilon August 3, 2001.

Duke Energy Morro Bay, LLC PageUpdated Analysis of Alternative Cooling Systems
24
Appendix D – Plot Plans

Duke Energy Morro Bay, LLC PageUpdated Analysis of Alternative Cooling Systems
25
Insert Plot Plans Here

Duke Energy Morro Bay, LLC PageUpdated Analysis of Alternative Cooling Systems
26
Insert Plot Plans Here

Duke Energy Morro Bay, LLC PageUpdated Analysis of Alternative Cooling Systems
27
Appendix E – Site Constraints PowerPoint Slides

Duke Energy Morro Bay, LLC PageUpdated Analysis of Alternative Cooling Systems
28
Insert Power Point Slides Here

Duke Energy Morro Bay, LLC PageUpdated Analysis of Alternative Cooling Systems
29
Insert Power Point Slides Here

Duke Energy Morro Bay, LLC PageUpdated Analysis of Alternative Cooling Systems
30
Insert Power Point Slides Here

Duke Energy Morro Bay, LLC PageUpdated Analysis of Alternative Cooling Systems
31
Insert Power Point Slides Here

Duke Energy Morro Bay, LLC PageUpdated Analysis of Alternative Cooling Systems
32
Insert Power Point Slides Here
Duke Energy Morro Bay, LLC PageUpdated Analysis of Alternative Cooling Systems
33
Appendix F – Visual Impacts
This visual analysis supersedes previous analyses on cooling alternatives for the Morro BayPower Plant. Earlier analyses, done in October and November of this year, were based uponpreliminary designs that have since been found not to meet noise requirements. Since then,conceptual designs have been revised and the size of the required equipment has increased. Theair-cooled condensers (ACCs), which are essentially thirty-foot diameter fans, were slowed-down to reduce noise. The slower fans reduced cooling air volume and resulted in therequirement for more fans with larger enclosures. This analysis evaluates the visual effect of therevised design alternatives for cooling.
DESCRIPTION OF COOLING ALTERNATIVESTwo cooling alternatives are potentially available for the Morro Bay Power Plant. The first air-cooled alternative utilizes a large array of air condensers and the other, the hybrid alternative,utilizes a smaller array of air condensers plus two cooling towers. This visual analysis focuseson the first alternative, the large array of air condensers because the potential impacts of thelarger size. Simulations of the large array of ACCs follow this discussion.
Air-Cooled AlternativeThe air-cooled alternative abandons the water intake structure; outfall and all other undergroundfacilities associated with water transfer and requires construction of two air-cooled condenserenclosures as part of the facilities. The number of units, as well as the dimensions of the unitsthemselves were determined from manufacturer budget quotes appropriate in terms of meetingthe cooling requirements for the proposed power-generation facility and limiting noisegeneration to attempt to meet required standards.
Each condenser enclosure measures 185' (W) x 320'(L) with a vertical height of 110' to the top ofthe steam header. From the ground up to the first 65'-70' is open steel structure while theremaining 40'-45' is a shrouded box to enclose "A" frame condensers. The ACC enclosure unitsare located approximately 285’ south of the nearest proposed HRSG units. (See site plan)..Plumes are not associated with this type of cooling.
Hybrid Cooling AlternativeThe Hybrid alternative is similar to the air-cooled option requiring two smaller ACC units sitedin roughly the same location, but also adds two, two-cell cooling towers adjacent to the ACCunits (See attached plan). Each ACC enclosure unit measures 225’ (W) x 225’ (L), with avertical height of 105’ to the top of the steam header and matches the ACC units from the dry-cooled option in appearance and structure. Each cooling tower structure measures 36’ (W) x 72’(L) with a vertical height of 40’. Plumes could emanate from these towers on winter mornings orother periods of cool weather and high humidity.
Table 1 below lists component dimensions for both alternatives.

Duke Energy Morro Bay, LLC PageUpdated Analysis of Alternative Cooling Systems
34
Table 1: Design Alternative Component DimensionsDesign Alternative Air-Cooled Hybrid Cooling (not simulated)
Plant Components ACC Unit Stack ACC Unit Stack Cooling Tower
(L) Length in ft. 320 NA 225 NA 72
(W) Width in ft. 185 NA 225 NA 36
(H) Height in ft. 110 145 105 145 40
(D) Diameter in ft. NA 18 NA 18 NA
METHODOLOGY FOR VISUAL SIMULATIONSThis visual analysis of cooling alternatives was based on a set of four visual simulations. Avisual simulation uses a digital photograph of existing scenery and overlays a three-dimensional,rendered computer model of the equipment as viewed from the same location. The result is aphoto-realistic representation of the design alternative as it would appear from a selected KeyObservation Point, or KOP. The visual simulations reflect a high level of accuracy regardingfootprint, dimensions, and location but do not reflect final engineering design decisions (siting,structure, materials, finishes etc.). They are artists’ extrapolations based on schematicengineering data as thus far determined by the applicant as well as reference material (e.g.,photographs and literature of similar air-cooled condensers). See Attachment 6.13 – 2 in theAFC for a more detailed description of visual simulation process
CRITERIA FOR VISUAL ANALYSISThis analysis compares the Project as proposed in the AFC, with the visual change incurred as aresult of the addition of cooling equipment described above. Each KOP simulation wasevaluated by a set of four criteria:• Area occupied by the power plant and the new cooling equipment• Area penetrating skyline (extending above horizon)• Horizontal field of view (width of area occupied by the power plant)• Obstruction of features (Views of the Rock, Ocean, Beach or Distant hills that would
otherwise be visible)
SELECTION OF KEY OBSERVATION POINTS (KOP’S)The evaluation of cooling alternatives relies on four KOP’s (7, 8, 14, 15) as the most appropriatefrom which to determine visual impacts. The four selected KOP’s have been used in previousrepresentations and were selected to provide views of the air condensers from differentrepresentative perspectives, specifically:
• KOP 7 Near view from beach, increased public access, condensers visible• KOP 8 View from west, representative of view from water• KOP 14 Representative view from neighborhoods on hillside to northeast.

Duke Energy Morro Bay, LLC PageUpdated Analysis of Alternative Cooling Systems
35
• KOP 15 Residential view, from hillside to east.
ANALYSIS OF KOP’S
KOP 7: Close-up view from Embarcadero RoadLooking ESE from south of Morro Creek
This is a scenic vista point as referenced in the LCP and is a public coastal access point. Mainlylocal residents and fishermen use the unpaved public parking area. This is the future site of theEmbarcadero road connection. This site provides a close range public view of the Project designalternative.
The visual effect of the air-cooled alternative from this perspective is the near view of large aircondenser enclosures rising above the skyline that block ridgeline views of the coastal hills andthe City of Morro Bay itself. Details of the structure and components will be clear. Thehorizontal field of view occupied by the power plant will nearly double when compared to thewater-cooled option.
KOP 8: View from Coleman DriveLooking NE across inlet from Morro Rock
Local residents, visitors, and boaters coming into Morro Bay Harbor see this view. This is a fullview of the MBPP property looking northeast from Coleman Drive at the base of Morro Rock.
At a height of 110 feet, the air-cooled enclosures would be the largest structures visible, andwould block views to the grassy coastal hills in the distance. They would not rise above theskyline, but would increase the industrial bulk visible on the site and increase the horizontal fieldof view occupied by the power plant.
KOP 14: View from Sunset PlateauLooking SSW from vacant lot at end of Sunset Court
Panoramic views from Sunset Plateau include a broad expansive view of the ocean and thecoastline to the north (not visible in image) as well as views directly onto the Project site. Thisneighborhood also overlooks Highway 1, which is visible in the middle ground.
The air-cooled enclosures would extend above the horizon, obstructing views of the estuary, thesand spit, the ocean, and some trees in the distance. This alternative would increase thehorizontal field of view by introducing the taller air condenser enclosures throughout most ofthat field. Some existing trees in the foreground, plus proposed landscaping, could partiallyscreen the lower half of the air condensers, but would not screen that portion which protrudesabove the skyline.
KOP 15: View from Harbor Front TractLooking West down Radcliffe Street from Berwick Drive

Duke Energy Morro Bay, LLC PageUpdated Analysis of Alternative Cooling Systems
36
Views from the Harbor Front Tract residential area include Morro Rock, the power plant,transmission towers, and the ocean. To the south are the harbor inlet and the northern tip of thesand spit. Residential structures in the area both frame views and obstruct potential panoramicviews. This location is near a scenic vista point referenced in the LCP.
The air-cooled condenser enclosures are the largest structures visible from KOP 15. Thisalternative would widen the horizontal field of view occupied by the power plant to where thecondensers begin to obstruct views of Morro Rock and the ocean.
SUMMARYThe Project as defined in the AFC is smaller in height and bulk, and occupies less of the coastalsite than the air-cooled alternative. The air-cooling alternative requires the large array of aircondensers in an enclosure which, when evaluated against the visual criteria, consistently causeda significant negative visual effect. Specifically, the negative visual effects of adding air coolingequipment to the MBPP include; (1) a significant increase in the total area occupied by the powerplant, (2) Significant increase in the area penetrating the skyline or obstructing coastal features,and (3) Significant increases in the horizontal field of view occupied by the power plant. Each ofthese findings is inconsistent with the City of Morro Bay’s expressed desire to minimize theheight and bulk of the facility.

Duke Energy Morro Bay, LLC PageUpdated Analysis of Alternative Cooling Systems
37
INSERT KOPs HERE

Duke Energy Morro Bay, LLC PageUpdated Analysis of Alternative Cooling Systems
38
INSERT KOPs HERE

Duke Energy Morro Bay, LLC PageUpdated Analysis of Alternative Cooling Systems
39
INSERT KOPs HERE

Duke Energy Morro Bay, LLC PageUpdated Analysis of Alternative Cooling Systems
40
INSERT KOPs HERE

Duke Energy Morro Bay, LLC PageUpdated Analysis of Alternative Cooling Systems
41
Appendix G --Noise Impacts
INTRODUCTIONThis document summarizes an additional noise impact assessment conducted for two alternativeplant-cooling options for the MBPP Project. Rather than using the existing once-through (sea)water cooling system for the proposed plant, two optional alternative cooling systems have beeninvestigated. One option is to use a dry, air-cooled condenser (“ACC”) array for each powerblock (two arrays total), while the second option would employ a combination of dry ACC arrayscoupled with wet cooling towers and is known as a “Hybrid” system. The details of each coolingalternative are given in other sections of the Alternatives discussion.
BACKGROUNDSince these two cooling system alternatives are in lieu of the existing sea water intake,underground, and outfall facilities, either of these alternative cooling systems would be anaddition to the AFC-proposed plant design. As such, they would add noise sources andaggregate plant noise emissions, when compared to the plant design proposed in the AFC. Thesepotential additional noise impacts were investigated to determine a first-order assessment of thechanges due to alternative cooling. Noise level information was received from manufacturer12
documentation and used to assess the additional plant emissions. This noise level informationwas engineering data only and is not fully qualified, nor contractually guaranteed by the vendor.As such, there is some potential for error in using these values, but they were, nonetheless,deemed adequate for this first-order evaluation.
The vendor calculated the size, configuration, and operations characteristics of each system tomeet the necessary cooling capacity, while minimizing visual, plume, noise, and powerconsumption impacts. For the ACC option, the vendor calculated an engineering noise levelestimate of approximately 46 dBA at 400 feet from the periphery of each air-cooler bank (therewould be two such banks for the ACC alternative). For the Hybrid option, the vendor calculatedan engineering noise level estimate of approximately 44 dBA at 400 feet from the edge of theequipment envelope of each air-cooler-plus-cooling-tower system13 (again, there are two suchsystems for the Hybrid alternative). These vendor noise levels are considered to be ‘best-case’values that are at the limit of achievable noise reduction methods for this type, size, and serviceof cooling system.
ANALYSESThese estimated far-field system noise levels were converted into individual noise source inputsto better define the spatially-distributed nature of the fan arrays. Although the bottom of theACC open steel structure is 65 to 70 feet above the ground (with 40 to 45 feet above thatconsisting of a shrouded enclosure), the nominal noise source height was conservatively taken tobe 85 feet above ground. The Hybrid system was also analyzed with individual sources at boththe air-cooler fans and the cooling tower cells. Additionally, the circulating cooling water pumps 12 The potential vendor contacted for these analyses was GEA Power Cooling Systems, Inc.13 Note that this value does not include the circulating cooling water pump trains, which are typically not part of acooling tower scope-of-supply .

Duke Energy Morro Bay, LLC PageUpdated Analysis of Alternative Cooling Systems
42
needed for the cooling towers were added, assuming a maximally-mitigated set of pump trains.Thus, for both options, the quietest equipment configurations considered to be reasonable andachievable were used for this noise impact investigation. The same basic predictionmethodology as used for the AFC was employed for this investigation and the physicalconfiguration of equipment, berm, and wall barriers was also used. The predicted noise levels atthe same receptor locations as used in the October 2000 AFC were calculated and compared tothe aggregate noise impacts from the AFC-proposed plant design. Thus, the changes in noisefrom just the use of ACC or Hybrid alternative cooling were found. The results of thesecalculations are summarized in Tables 1a and 1b “Alternative Cooling Noise” for the ACCoption and Table 2a and 2b “Alternative Cooling Noise” for the Hybrid option. For the ‘a’tables, the results are for the residential and sensitive receptor locations, while the ‘b’ tablessummarize the noise predictions for the tourist-related receptor locations (as given in the AFC).
SUMMARYThe tables show the following general observations. For the all air-cooled condenser (ACC)alternative, the nominal increase at residential and sensitive receptors is +1 dB (compared to theAFC design). However, the change to the (LORS-critical) RV Park receptor location (and, byinterpolation, the closest areas of the creek/wetlands areas) is shown as +0 dB. This is becausejust enough barrier shielding from the HRSG structures and/or north berm wall is still present forthe elevated ACC sources to prevent an increase in aggregate RV Park receptor noise levels.However, the margin of safety in meeting the most restrictive LORS requirement (i.e. the City ofMorro Bay Noise Element limits) has been reduced. At the tourist areas to the west, northwest,and southwest of the project site, the nominal increase is +2 dB. Although not as beneficial tothe noise environment as the AFC-proposed plant, this result is still significantly better than theexisting conditions from the current power plant at tourist-related areas. For this option, allidentified receptor areas are still within compliance of the pertinent regulatory limits, but theScott Street location has now joined the RV Park as a second critical receptor (i.e., future noise ispredicted to be right at the Noise Element limit).
For the Hybrid system, the nominal increase for this cooling option at the residential andsensitive receptors is +4 to +5 dB. This is mostly due to the cooling tower water pumps, eventhough they are assumed to be quiet-design units. As with the ACC option, the change at thecritical RV Park is shown to be +0 dB (due, again, to residual barrier attenuation effects in thatdirection). The general increase at residential/sensitive receptors means that two locations arenow predicted to be out of compliance with the Noise Element limits – these are locations 2(Scott Street) and 6 (First Church14). Furthermore, location 4 (Radcliff & Berwick) is now acritical receptor, being right at the Noise Element limit. At the tourist areas, the increase will besubstantial….upwards of +10 dB at some locations. This is from the cooling water pumps andthe lack of substantial barrier benefits in the direction of the tourist-related areas. For theColeman Park location, this cooling alternative can be expected to yield noise levels that arecomparable to the existing power plant environment.
14 It should be noted that this location is no longer a functioning church and that the general surrounding area ispredominantly commercial/hotel usages.
Duke Energy Morro Bay, LLC PageUpdated Analysis of Alternative Cooling Systems
43
In summary, the best-case analysis for noise impacts shows a slightly-increased, but stillcompliant, situation for the ACC option. However, the marginal acceptability at the closestreceptors to the project site has been reduced by the ACC addition. Further, this analysis usespreliminary vendor data and when further detailed design and engineering becomes available,these parameters may not be attainable. If any of the assumptions behind the best-caseconfiguration prove later to be overly-optimistic and/or unattainable in the actual installation,then noise compliance may be compromised, with little or no mitigation recourse. For theHybrid option, the evaluation shows noise levels that can be expected to be above the city’sNoise Element limits at one or more receptor locations (and this is, again, for the assumed best-case conditions). Unlike the ACC option, however, there may be additional (potentiallyexpensive) mitigation measures, albeit rather drastic, that could be considered during detaildesign to potentially reduce the noise emissions from these predominant sources.
In short, both ACC and Hybrid cooling alternatives are at best, problematic for achieving futurenoise compliance, when compared to the AFC-proposed project design.
Duke Energy Morro Bay, LLC Page 44
Table 1a. CITY OF MORRO BAY NOISE ELEMENT CRITERION ANALYSIS (ACC Option)(Limit = Nighttime Hourly Leq of 45 dBA [total noise exposure at receiving land use property line])[bold entries denote changes and italicized entries are taken from AFC Table 6.12-13 on page 6.12-49]
Location Description
PredictedMBPP NoiseContributions(AFC Noise
Control Case4), dBA
Total FutureNoise
Environment(AFC Plant
Plus NighttimeAmbient), dBA
DifferenceBetween Future
NoiseEnvironment AndMB Noise Element
Limit, dB
Predicted MBPPNoise Contribu-tions With Air-
CooledCondenser
Alternative, dBA
Difference DueTo Air-Cooled
CondenserAlternative,
dB
Revised Total FutureNoise Environment(AFC Plant With
Air-CooledCondenser
Alternative PlusNighttime
Ambient), dBA
DifferenceBetween Revised
Future NoiseEnvironment and
MB Noise ElementLimit (ACCOption), dB
1 Scott Street 41 44 1 dB under limit 42 +1 45 at limit
2Morro Bay
HighSchool
36 43 2 dB under limit 36 +0 43 2 dB under limit
3Morro BayElementary
School35 43 2 dB under limit 36 +1 43 2 dB under limit
4 Radcliff &Berwick 37 43 2 dB under limit 38 +1 43 2 dB under limit
5 RV Park 43 45 at limit 43 +0 45 at limit
6 First Church 38 44 1 dB under limit 39 +1 44 1 dB under limit
7Morro Bay
PublicLibrary
33 41* 4 dB under limit* 34 +1 41 4 dB under limit
8 Olive &Piney 31 37 8 dB under limit 32 +1 37 8 dB under limit
* The values reported in the AFC (40 dBA and 5 dB under the limit) are typos; the correct numbers are 41 dBA and 4 dBunder the limit.

Duke Energy Morro Bay, LLC PageUpdated Analysis of Alternative Cooling Systems
45
Table 1b. COMPARISON OF EXISTING AND FUTURE NOISE LEVELS ATMORRO BAY TOURIST AREAS (ACC Option)
[bold entries denote changes and italicized entries are taken from AFC Table 6.12-14 on page 6.12-56]
Location Description
Predicted MBPP NoiseContributions (AFC
Noise Control Case 4),dBA
Predicted ProjectContribution Compared
to Measured ExistingAmbient
Predicted MBPP NoiseContributions with Air-
Cooled CondenserAlternative, dBA
Difference Due toAir-CooledCondenser
Alternative, dB
Revised Predicted ProjectContribution (with AddedAir-Cooled Condensers)Compared to Measured
Existing Ambient
10 Embarcadero(1) 44 23 dB under existingambient 46 +2 21 under existing
ambient
11 Coleman Park(2) 46 9 dB under existing
ambient 48 +2 7 under existing ambient
12 Beach Shoreline(3) 42 20 dB under existing
ambient 43 +1 19 under existingambient
13 Morro Rock,East (4) 36 14 dB under existing
ambient 38 +2 12 under existingambient
14 Morro Rock,West (5) <20 >35 dB under existing
ambient <20 negligible > 35 under existingambient
1. Location at Salt Water Taffy Shop, 1247 Embarcadero, directly across street from (existing) Center Stack2. Location at Park at corner of Embarcadero and Coleman, near park bench area, northwest of swings3. Location at shoreline, just south of the creek outlet wash area4. Location at bend in Morro Rock access road, at west end of parking area5. Location at end of Morro Rock access road, northeast of breakwater
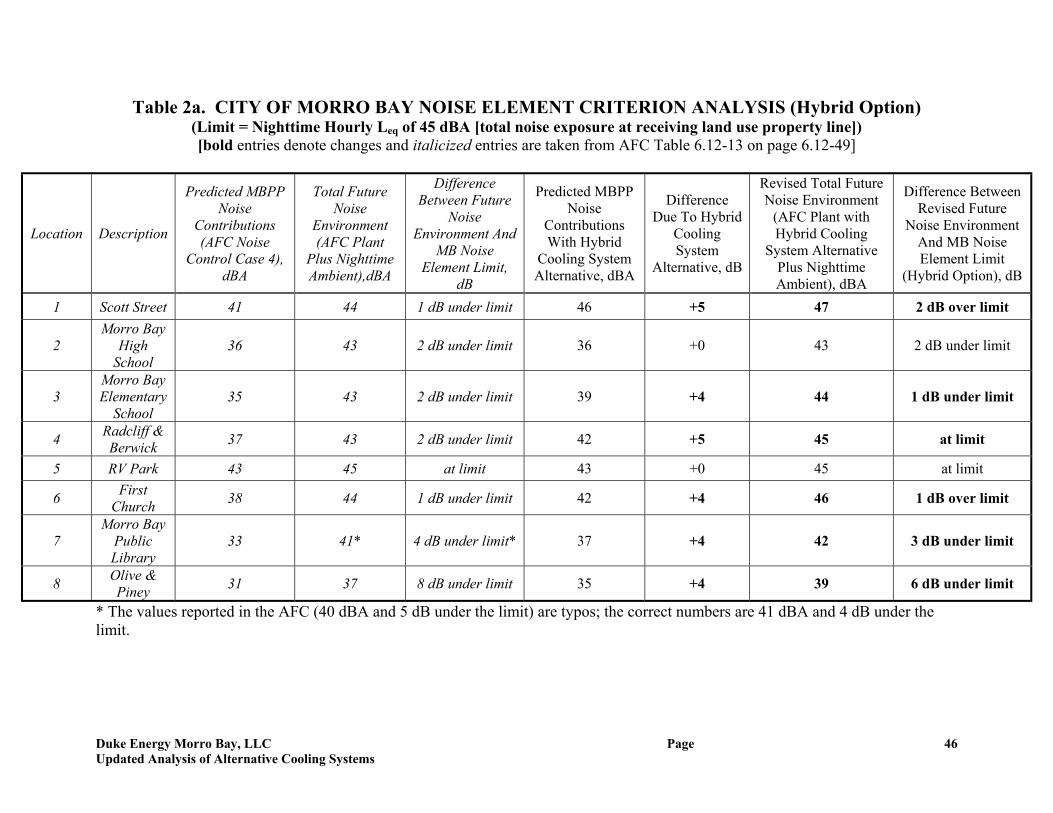
Duke Energy Morro Bay, LLC PageUpdated Analysis of Alternative Cooling Systems
46
Table 2a. CITY OF MORRO BAY NOISE ELEMENT CRITERION ANALYSIS (Hybrid Option)(Limit = Nighttime Hourly Leq of 45 dBA [total noise exposure at receiving land use property line])[bold entries denote changes and italicized entries are taken from AFC Table 6.12-13 on page 6.12-49]
Location Description
Predicted MBPPNoise
Contributions(AFC Noise
Control Case 4),dBA
Total FutureNoise
Environment(AFC Plant
Plus NighttimeAmbient),dBA
DifferenceBetween Future
NoiseEnvironment And
MB NoiseElement Limit,
dB
Predicted MBPPNoise
ContributionsWith Hybrid
Cooling SystemAlternative, dBA
DifferenceDue To Hybrid
CoolingSystem
Alternative, dB
Revised Total FutureNoise Environment
(AFC Plant withHybrid Cooling
System AlternativePlus NighttimeAmbient), dBA
Difference BetweenRevised Future
Noise EnvironmentAnd MB NoiseElement Limit
(Hybrid Option), dB
1 Scott Street 41 44 1 dB under limit 46 +5 47 2 dB over limit
2Morro Bay
HighSchool
36 43 2 dB under limit 36 +0 43 2 dB under limit
3Morro BayElementary
School35 43 2 dB under limit 39 +4 44 1 dB under limit
4 Radcliff &Berwick 37 43 2 dB under limit 42 +5 45 at limit
5 RV Park 43 45 at limit 43 +0 45 at limit
6 FirstChurch 38 44 1 dB under limit 42 +4 46 1 dB over limit
7Morro Bay
PublicLibrary
33 41* 4 dB under limit* 37 +4 42 3 dB under limit
8 Olive &Piney 31 37 8 dB under limit 35 +4 39 6 dB under limit
* The values reported in the AFC (40 dBA and 5 dB under the limit) are typos; the correct numbers are 41 dBA and 4 dB under thelimit.

Duke Energy Morro Bay, LLC PageUpdated Analysis of Alternative Cooling Systems
47
Table 2b. COMPARISON OF EXISTING AND FUTURE NOISE LEVELS ATMORRO BAY TOURIST AREAS (Hybrid Option)
[bold entries denote changes and italicized entries are taken from AFC Table 6.12-14 on page 6.12-56]
Location Description
Predicted MBPPNoise
Contributions(AFC Noise
Control Case 4),dBA
Predicted ProjectContribution Compared toMeasured Existing Ambient
Predicted MBPP NoiseContributions with
Hybrid Cooling SystemAlternative, dBA
Difference Due toHybrid Cooling
System Alternative,dB
Revised Predicted ProjectContribution (with AddedHybrid Cooling System)Compared to Measured
Existing Ambient
10 Embarcadero(1) 44 23 dB under existing
ambient 54 +10 13 under existing ambient
11 ColemanPark (2) 46 9 dB under existing ambient 55 +9 Same as existing ambient
12 BeachShoreline (3) 42 20 dB under existing
ambient 43 +1 19 under existing ambient
13 Morro Rock,East (4) 36 14 dB under existing
ambient 43 +7 7 under existing ambient
14 Morro Rock,West (5) <20 >35 dB under existing
ambient <20 negligible > 35 under existing ambient
1. Location at Salt Water Taffy Shop, 1247 Embarcadero, directly across street from (existing) Center Stack2. Location at Park at corner of Embarcadero and Coleman, near park bench area, northwest of swings3. Location at shoreline, just south of the creek outlet wash area4. Location at bend in Morro Rock access road, at west end of parking area

Duke Energy Morro Bay, LLC Page 48
Appendix H --Air Impacts
MBPP has evaluated the air quality impacts of two alternative cooling methods for the proposedturbine project: 100% dry cooling using air-cooled condensers (ACCs) and a hybrid coolingsystem that includes ACCs and cooling towers. Using building dimensions and cooling towerparameters provided by DFD, worst-case turbine operations were reevaluated using the sameoperating assumptions that were used in the AFC. The modeling analysis showed that becauseof the distance between the stacks and the new cooling structures, the 100% dry coolingalternative had no effect on maximum modeled impacts. The addition of cooling towers in thehybrid system resulted in increases in ambient PM10 impacts over the proposed project and theACC cooling alternative. Overall, there were no significant changes to the modeled impactsfrom these alternative cooling methods.
The modeling results for the alternative cooling methods are summarized, along with the resultsfor the project as proposed, in the following tables.

Duke Energy Morro Bay, LLC PageUpdated Analysis of Alternative Cooling Systems
49
Table 1: Project Alone (modeled concentrations in ug/m3)
Pollutant/Averaging Period
NO2 SO2 CO PM10Cooling Alternative
1-hr Annual 1-hr 3-hr 24-hr Annual 1-hr 8-hr 24-hr Annual
Project As Proposed 220 2.9 17.3 10.4 2.7 0.23 326.3 1,508 24.2 2.7
Project with 100% Dry Cooling 220 2.9 17.3 10.4 2.7 0.23 326.3 1,508 24.2 2.7
Project with Hybrid CoolingSystem 220 2.9 17.3 10.4 2.7 0.23 326.3 1,508 26.2 3.0
Table 2: Project plus Background (modeled concentrations in ug/m3)
Pollutant/Averaging Period
NO2 SO2 CO PM10
1-hr Annual 1-hr 24-hr Annual 1-hr 8-hr 24-hr AAM2 AGM3
Maximum Monitored AmbientConcentrations1 122 25 106 13 0 6,988 3,444 57 20.6 18.6
Project As Proposed 342.4 27.9 123 15.7 0.23 7,314 4,952 81.2 23.3 21.3
Project with 100% Dry Cooling 342.4 27.9 123 15.7 0.23 7,314 4,952 81.2 23.3 21.3
Project with Hybrid CoolingSystem 342.4 27.9 123 15.7 0.23 7,314 4,952 83.2 23.6 21.6
State Standard 470 -- 650 109 -- 23,000 10,000 50 -- 30
Federal Standard -- 100 -- 365 80 40,000 10,000 150 50 --

Duke Energy Morro Bay, LLC Page 50
Appendix I – Land Use Impacts
This section provides an analysis of the conformity of placing a power plant facility that uses drycooling or a hybrid cooling system on the MBPP project site with the City of Morro Bay LandUse planning documents. In summary, installing dry cooling at the MBPP site will conflict withmultiple areas of the Land Use Planning documents. The attached table (see Table 1, below)provides the exact text of the policies that dry cooling conflicts with and reasons why the conflictoccurs. The conflicts are briefly summarized below.
SIGNIFICANT NEGATIVE VISUAL IMPACTSThere are multiple policies in the CLUP, and General Plan that call for protecting and improvingthe visual corridors in Morro Bay (see attached Table 1). For example, LCP Policy 5.01 states:“....Power plant expansion on PG&E owned property shall have priority over other coastaldependent industrial uses. Power plant expansion shall be limited to small facilities whoselocation would not further effect the views of Morro Rock from State Highway One and high usevisitor-serving areas, consistent with Policy 12.11.”
Placing dry cooling towers on the MBPP site is not consistent with this and several other localvisual policies (see the visual analysis and KOPs for more specific information on thedetrimental visual impacts).
PROPERTY OWNERSHIPThe large cooling towers do not fit in the current MBPP site. To accommodate the large drycooling towers in an appropriate location, a portion of the towers would have to be built onPG&E property (see DFD plot plan). Duke Energy does not currently own this property and it ishighly questionable if Duke would be able to lease or purchase additional property from PG&Ethat is currently being used for their switchyard.

Duke Energy Morro Bay, LLC Page 51
Table 1: LAND USE PLANS AND POLICIES THAT CONFLICTWITH DRY COOLING AT MORRO BAY POWER PLANT
Policy # POLICY TEXT WHY DRY COOLING IS NOT CONSISTENT WITHPROGRAM, POLICY, OR REGULATION
CITY OF MORRO BAY - GENERAL PLANII. Land Use, Open Space, and Conservation ElementsSensitive Lands and Open Space
GPProgramLU-62.1
All developments at or adjacent to the harbor or beach areas shallprovide for physical and visual public access to these features.
The additional dry cooling towers would have significantnegative impacts on the views of Morro Rock and fromvisitor serving areas in Morro Bay
CITY OF MORRO BAY – COASTAL LAND USE PLAN (LUP)Chapter VII. Energy/Industrial Development
LCPtext
According to a CEC report entitled "Feasibility of Expansion ofExisting Coastal Zone Power Plants," the power plant site is theminimal adequate for expansion of small facilities whose locationwould not further affect the unique view corridor of Morro Rockand the report indicates that conversion is unfeasible due to avariety of factors. The study does conclude that expansion isfeasible for a small-scale facility utilizing either steam turbine, theexisting generating system, combined cycle, or combustion. (LUP,p. 107 & 109)
The additional dry cooling towers would have significantnegative impacts on the views of Morro Rock and fromvisitor serving areas in Morro Bay.
F. Policies on Energy Related DevelopmentGeneral Policies
LCPPolicy5.01
… Power plant expansion on PG&E owned property shall havepriority over other coastal dependent industrial uses. Power plantexpansion shall be limited to small facilities whose location wouldnot further effect the views of Morro Rock from State HighwayOne and high use visitor-serving areas, consistent with Policy12.11. (General Plan policy # LU-39.1)
The additional cooling towers would create significantadverse impacts on the view of Morro Rock and fromvisitor serving areas in Morro Bay.
LCPPolicy5.21
Substantial landscaping and screening to mitigate the visualimpacts of existing and future facilities; with particular emphasison screening the facilities located between the power plant andHighway One. (General Plan policy # LU-40.16)
The additional cooling towers would create significantadverse impacts on the view of Morro Rock and fromvisitor serving areas in Morro Bay.
Chapter XIII Visual Resources

Duke Energy Morro Bay, LLC Page 52
Policy # POLICY TEXT WHY DRY COOLING IS NOT CONSISTENT WITHPROGRAM, POLICY, OR REGULATION
E. Visual Resources PoliciesLCP
Policy12.01
The scenic and visual qualities of coastal areas shall be consideredand protected as a resource of public importance. Permitteddevelopment shall be sited and designed to protect views to andalong the ocean and scenic and coastal areas, to minimize thealteration of natural land forms, to be visually compatible with thecharacter of surrounding areas, and where feasible, to restore andenhance visual quality in visually degraded areas. Newdevelopment in highly scenic area such as those designated onFigure 31, shall be subordinate to the character of its setting.
MBPP is designated on Figure 31 as an area of visualsignificance. . The additional cooling towers would createsignificant adverse impacts on the view of Morro Rock andfrom visitor serving areas in Morro Bay.
LCPPolicy12.02
Permitted development shall be sited and designed to protectviews to and along the coast and designated scenic areas and shallbe visually compatible with the surrounding areas. Specific designcriteria shall be established for the following areas:The Embarcadero (as defined in Policy 2.03)Downtown commercial area.The criteria shall include the following specific requirements andshall be applied to proposed projects on a case-by case basisduring architectural review:Building height/bulk relationship compatible with existingsurrounding uses; landscaping to restore and enhance visuallydegraded areas using native and drought resistant plant and treespecies; Preservation and enhancement of views of the ocean, bay,sandspit and Morro Rock; Any other requirements applicable fromCoastal Commission conceptual approval of the Urban WaterfrontRestoration Plan.
The additional cooling towers would create significantadverse impacts on the view of Morro Rock and fromvisitor serving areas in Morro Bay.
LCPPolicy12.06
New development in areas designated on Figure 31 as havingvisual significance shall include as appropriate the following:Height/bulk relationships compatible with the character ofsurrounding areas or compatible with neighborhoods or specialcommunities which, because of their unique characteristics, arepopular visit destination points for recreation uses.Designation of land for parks and open space in new developmentswhich because of their location are popular visitor destinationpoints for recreation uses. View easements or corridors designedto protect views to and along the ocean and scenic and coastalareas.
MBPP is identified on figure 31. The additional coolingtowers would create significant adverse impacts on the viewof Morro Rock and from visitor serving areas in Morro Bay.The cooling towers will introduce two large bulky obstaclesto the coastal viewer and degrade view corridors.
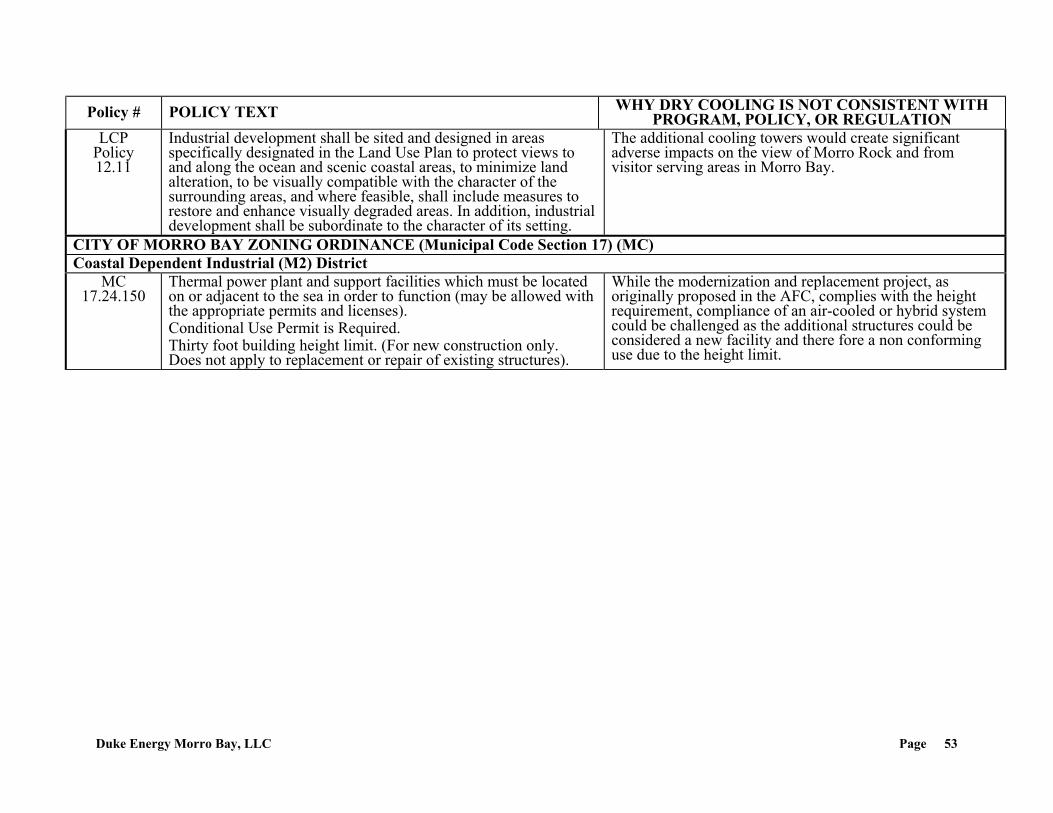
Duke Energy Morro Bay, LLC Page 53
Policy # POLICY TEXT WHY DRY COOLING IS NOT CONSISTENT WITHPROGRAM, POLICY, OR REGULATION
LCPPolicy12.11
Industrial development shall be sited and designed in areasspecifically designated in the Land Use Plan to protect views toand along the ocean and scenic coastal areas, to minimize landalteration, to be visually compatible with the character of thesurrounding areas, and where feasible, shall include measures torestore and enhance visually degraded areas. In addition, industrialdevelopment shall be subordinate to the character of its setting.
The additional cooling towers would create significantadverse impacts on the view of Morro Rock and fromvisitor serving areas in Morro Bay.
CITY OF MORRO BAY ZONING ORDINANCE (Municipal Code Section 17) (MC)Coastal Dependent Industrial (M2) District
MC17.24.150
Thermal power plant and support facilities which must be locatedon or adjacent to the sea in order to function (may be allowed withthe appropriate permits and licenses).Conditional Use Permit is Required.Thirty foot building height limit. (For new construction only.Does not apply to replacement or repair of existing structures).
While the modernization and replacement project, asoriginally proposed in the AFC, complies with the heightrequirement, compliance of an air-cooled or hybrid systemcould be challenged as the additional structures could beconsidered a new facility and there fore a non conforminguse due to the height limit.

Duke Energy Morro Bay, LLC Page 54
Appendix J -- Terrestrial Biology Impacts
The Huffman Broadway Group, Inc. (HBG) has evaluated the terrestrial biology impacts of thetwo alternative cooling methods for the Morro Bay Power Plant (MBPP) Modernization Project.The two alternatives are 100% dry cooling using air-cooled condensers (ACCs) and a hybridcooling system that includes ACCs and cooling towers. Plot plans provided by DFD indicatethat although the addition of the ACCs and ACCs and cooling towers, respectively, in the twoalternatives, results in larger facility footprints when compared to the currently proposed project,these additional facilities are sited on industrialized areas that are currently utilized by the MBPPor are on PG&E property (PG&E switchyard). Both of these areas have minimal habitat value.Based on the plot plans, neither of these alternatives results in substantially different terrestrialhabitat impacts as a result of the increased footprint when compared to the proposed project. If itbecame necessary to shift the cooling facilities to the west, to remove them from property notowned by Duke Energy, there are constraints to the west of the tank farm related to the coastaldune scrub Environmentally Sensitive Habitat Area (ESHA).
Air quality analyses of the two alternatives, conducted by Sierra Research, indicate that overall,there were no significant changes to the modeled pollutant values related to these alternativeswhen compared to the proposed project. Therefore, no significant adverse impacts to terrestrialbiological resources related to air quality are expected as a result of either of these alternatives.
Noise analyses were conducted by Alliance Acoustical Consultants, Inc., utilizing engineeringdata from the manufacturer of the systems, and utilizing “best-case” values. These analysesindicated that neither alternative results in an increase in noise at Morro Creek, an ESHA. Thisis due to the potential shielding by either the heat recovery steam generation system (HRSG)and/or the northern berm and the proposed sound wall. According to the calculations, thesefeatures keep the additional cooling system noise contribution from both of the dry coolingalternatives from increasing the total plant noise at Morro Creek.
In general, predicted increases in decibel levels at receptor locations to the west, northwest andsouthwest related to the 100% ACC alternative are not significant. Both Coleman Park (which isadjacent to the coastal dune scrub ESHA) and the eastern side of Morro Rock experienceincreases in noise of 2 dB under the 100% ACC alternative. This results in noise measurementsthat are still significantly better than the existing conditions from the current power plant.
Predicted increases in decibel levels at receptor locations to the west, northwest and southwestrelated to the hybrid alternative would be greater than those calculated for the 100% ACCalternative. For example, noise levels predicted for the eastern side of Morro Rock could beexpected to increase by 7 dB compared to the noise levels of the proposed project, resulting in aplant contribution of 43 dBA. Neither noise levels from the proposed project nor increasesrelated to the hybrid cooling alternative would be expected to interfere with breeding behavior ofperegrine falcons at Morro Rock since both the proposed project and the hybrid coolingalternative noise levels are below the existing ambient noise level at Morro Rock. Analysesindicated an increase of 9 dB (from 46 dBA to 55 dBA) at the Coleman Park location, which isadjacent to dune scrub ESHA. This noise level is comparable to the existing ambient noise level.

Duke Energy Morro Bay, LLC Page 55
In summary, no significant adverse impacts to terrestrial biological resources are expected as aresult of predicted noise levels of either the 100% ACC cooling alternative or the hybridalternative.

Duke Energy Morro Bay, LLC Page 56
Appendix K – Previous Duty Cycle (June 2001)
8,760 hr/yr
2602 hr/yrconstant fuel input64o F avg. ambienta
26 hr/yrconstant fuel input85o F avg. ambientb
5,256 hr/yr constant fuel input57o F avg. ambientc
90%Capacity Factor
7,884 hr/yroperation
Treat 4 Summer months as average
and peak
AssumeConstant fuel input
8 months
Figure notes:a. Mean maximum annual temperatureb. Highest expected temperaturec. Mean average annual temperature
Temp Data:International Station Meteorological Climate Summary, Version 4.0 1996Issued by: Federal Climate Complex, Asheville, NCMonterey Peninsula (WMO No. 724915)Period of Record 1973 to 1996

Duke Energy Morro Bay, LLC Page 57
Appendix L – Current Duty Cycle (January 2002)
1,952 hr1200MW
Summer 68o F avg. ambienta
2,048 hr1200MW
57o F avg. ambientb
976 hr996MW
68o F avg. ambienta
3024 hr1021MW
57o F avg. ambientb
Proportion Hoursbetween Summer (4 mo)and Remaining months
4,000 hr/yr
Notes:a. Mean historical maximum temperature during Jun-Sepb. Mean historical average annual temperature
Temp data source:International Station Meteorological Climate Summary, Version 4.0 1996Issued by: Federal Climate Complex, Asheville, NCMonterey Peninsula (WMO No. 724915)
4,000 hr/yr
Proportion Hoursbetween Summer (4 mo)and Remaining months
Air Permit Allowable Annual OperationTotal 8,400 hr/yr
Duct Firing 4,000 hr/yr (limit16hr/day)No Duct Firing 4,000 hr/yrStartup 400
Startup400 hr/yr
Minor efficiencyimpact, so ignore

Duke Energy Morro Bay, LLC Page 58
Appendix M– Current Alternative Cooling Fuel Usage Results
The plant fuel usage results below were developed using the Thermoflow (V10.2) suite ofcombined cycle power plant thermal modeling software, namely GTPro and GTMaster. Areview of the results below, specifically for the 57 degree case, would indicate a slight efficiencyadvantage of once through cooling over ACC or hybrid systems.
However, the efficiency advantage of once-through cooling becomes more pronounced at higherambient temperatures, and is most prominent with duct firing. For example, the absolutedifference in peak-load heat rate between a once-through and alternatively cooled plant nearlytriples when the ambient temperature increases from 57°F to 68°F (rising from 83Btu/kWh to203 Btu/kWh). This means that the efficiency advantage of once-through cooling overalternative cooling would be nearly 2.5 times greater at 68°F than 57°F.
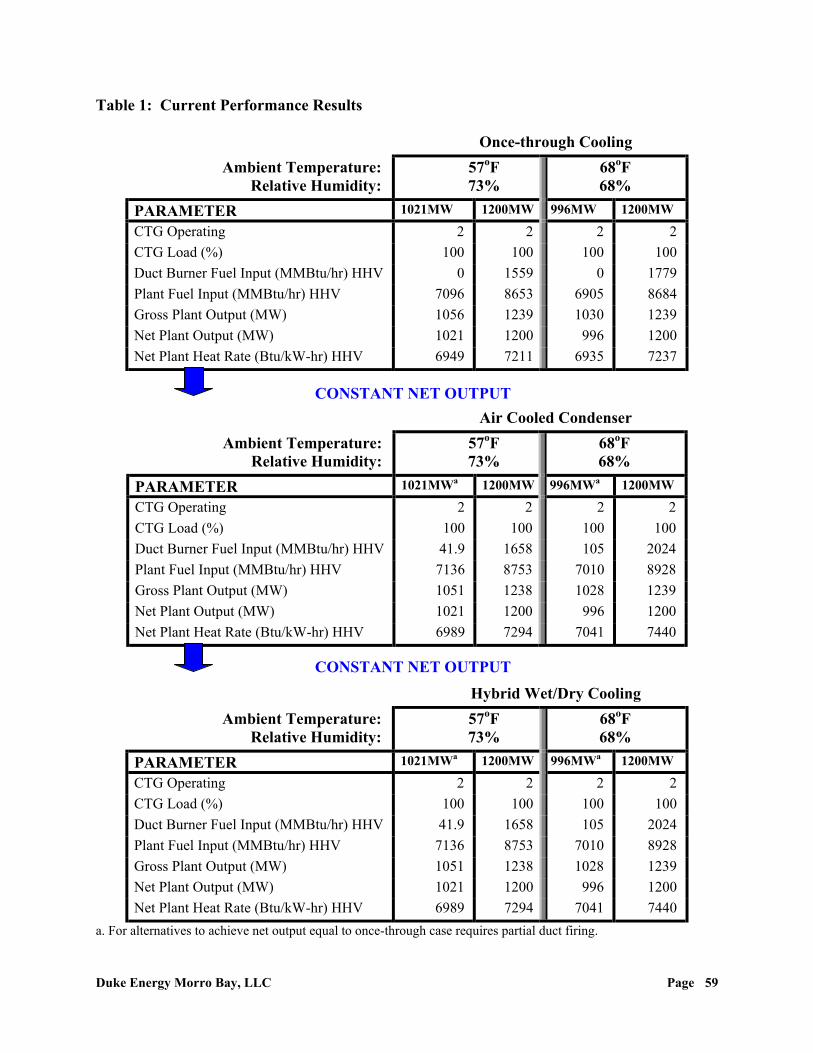
Duke Energy Morro Bay, LLC Page 59
Table 1: Current Performance Results
Once-through CoolingAmbient Temperature:
Relative Humidity:57oF73%
68oF68%
PARAMETER 1021MW 1200MW 996MW 1200MW
CTG Operating 2 2 2 2CTG Load (%) 100 100 100 100Duct Burner Fuel Input (MMBtu/hr) HHV 0 1559 0 1779Plant Fuel Input (MMBtu/hr) HHV 7096 8653 6905 8684Gross Plant Output (MW) 1056 1239 1030 1239Net Plant Output (MW) 1021 1200 996 1200Net Plant Heat Rate (Btu/kW-hr) HHV 6949 7211 6935 7237
Air Cooled CondenserAmbient Temperature:
Relative Humidity:57oF73%
68oF68%
PARAMETER 1021MWa 1200MW 996MWa 1200MW
CTG Operating 2 2 2 2CTG Load (%) 100 100 100 100Duct Burner Fuel Input (MMBtu/hr) HHV 41.9 1658 105 2024Plant Fuel Input (MMBtu/hr) HHV 7136 8753 7010 8928Gross Plant Output (MW) 1051 1238 1028 1239Net Plant Output (MW) 1021 1200 996 1200Net Plant Heat Rate (Btu/kW-hr) HHV 6989 7294 7041 7440
Hybrid Wet/Dry CoolingAmbient Temperature:
Relative Humidity:57oF73%
68oF68%
PARAMETER 1021MWa 1200MW 996MWa 1200MW
CTG Operating 2 2 2 2CTG Load (%) 100 100 100 100Duct Burner Fuel Input (MMBtu/hr) HHV 41.9 1658 105 2024Plant Fuel Input (MMBtu/hr) HHV 7136 8753 7010 8928Gross Plant Output (MW) 1051 1238 1028 1239Net Plant Output (MW) 1021 1200 996 1200Net Plant Heat Rate (Btu/kW-hr) HHV 6989 7294 7041 7440
a. For alternatives to achieve net output equal to once-through case requires partial duct firing.
CONSTANT NET OUTPUT
CONSTANT NET OUTPUT

Duke Energy Morro Bay, LLC Page 60
Appendix N- Current Economic Results DiscussionOne impact not reflected in the current analysis is Duke’s increased risk exposure to fuel pricevolatility if alternative cooling is required. Figure 1 shows the composition of the incrementalPV for the current analysis.
Figure 1: Incremental PV Composition
$4 $6
$47 $47
$55 $56
$-
$20
$40
$60
$80
$100
$120
Air Cooled Condenser Hybrid Wet/Dry
Incr
emen
tal P
V ($
mill
ion)
Incremental O&M Incremental Annual Energy CostIncremental Capital Cost
PV = $106 PV = $109
Nearly half of the incremental PV reflects the incremental annual energy expenditure required torun a less efficient plant as a result of alternative cooling. The efficiency impact of alternativecooling amplifies any volatility in fuel prices. The annual energy expenditure is influenced bythe price of fuel and the incremental fuel consumed. Table 1 shows the annual incrementalenergy cost for a normal range of likely fuel prices15. The mean gas price is used in the currentanalysis.
15 Based on historical prices, PG&E CG forward prices published on November 30, 2001, Duke’s view of forwardprices and transport charges. Price statistics are per MMBtu delivered to burner tip covering Jan 2002 through Dec2010.

Duke Energy Morro Bay, LLC Page 61
Table 1: Estimated Incremental Annual Energy Cost
Low Mean High
Gas Price ($/MMBtu): $3.0 $4.23 $4.89
Air Cooled Condenser ($mil) $2.8 $3.8 $4.4
Hybrid Wet/Dry Cooling ($mil) $2.8 $3.8 $4.4
The annual energy cost changes in direct proportion to changes in fuel price. If fuel pricevolatility returns to what was experienced in California last year, not unlikely in light ofincreasing gas demand and uncertain reserves, The impact on the incremental PV would besignificant. If mean gas prices were to double to $8.46/MMBtu16, the annual energy cost woulddouble and the incremental PV of alternative cooling would increase by nearly 50%. Duke’sincreased risk exposure to fuel price volatility has not been accounted for in the current analysis.
The incremental gas consumed is a reflection of the duty cycle. The duty cycle defines theannual hours of operation, the net output and the ambient temperatures. In keeping with the levelof the overall evaluation and Duke’s standard methodology for evaluating project investmentdecisions, only two temperature points were used representing the warmer summer months andthe remainder of the year. As can be seen in Figure 2 the ambient temperature on averageremains within a limited range over the course of a year. For this reason, expanding the dutycycle to additional temperature points would not likely provide additional resolution. The hoursof operation are the maximum allowed by the air permit. The actual hours may vary, but usingthe permitted values keeps the analysis consistent with the AFC.
16 Conservative considering gas prices in California reached $13/MMBtu in 2001

Duke Energy Morro Bay, LLC Page 62
Figure 2: Temperature Distribution for Average Year
International Station Meteorological Climate Summary, Version 4.0 1996Issued by: Federal Climate Complex, Asheville, NC
Monterey Peninsula (WMO No. 724915) Period of Record 1973 to 1996
0.0%
5.0%
10.0%
15.0%
20.0%
25.0%
30.0%
35.0%
T em perature R ange (o F)
Occurance (%) 0.0% 0.1% 1.0% 4.1% 9.8% 26.6% 28.6% 19.2% 7.5% 2.3% 0.5% 0.2% 0.1% 0.0% 0.0%
25 - 29 30 - 34 35 - 39 40 - 44 45 - 49 50 - 54 55 - 59 60 - 64 65 - 69 70 - 74 75 - 79 80 - 84 85 - 89 90 - 94 95 - 99
74% of T im e
M E A N (57 o )
Figures 3 and 4 compare the compositions of the Present Value (PV) results from the current andprevious analysis. The first bar to the left shows the incremental PV from the previous analysis.The next bar to the right is the current PV. The difference in PV, next bar, can be attributed tochanges in capital costs and annual energy costs.
The next bar to the right shows that the capital cost difference consists of two components. First,the current analysis reflects the increased capital cost required to achieve 1200MW nominaloutput over the temperature range and through a more detailed assessment. Additionally, a noisemitigation package would be required to attempt to comply with City noise requirements. Theremainder is due to the change in valuation methodology which eliminated the proxy plantcapital cost.
The last bar shows the three components that comprise the energy cost difference. First, thecurrent analysis uses a $4.23/MMBtu fuel price compared to $5/MMBtu in the previous analysis.Next, the additional fuel required to make up efficiency losses is consumed in a lower heat rateplant (i.e. more efficient), resulting in reduced fuel usage. The remainder in energy costdifference is due to changes in the duty cycle and valuation methodology.
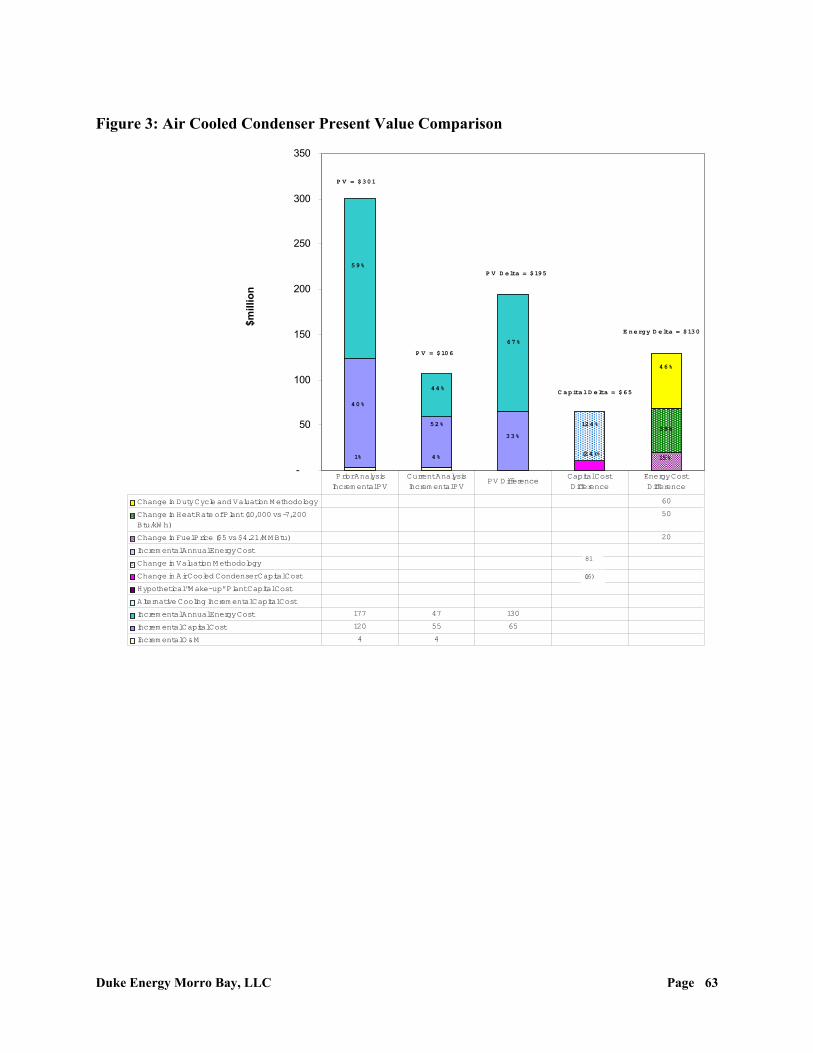
Duke Energy Morro Bay, LLC Page 63
Figure 3: Air Cooled Condenser Present Value Comparison
������������������������������������������������
������������������������
������������������������������������������������
-
50
100
150
200
250
300
350
$mill
ion
Change in Duty Cycle and Valuation M ethodology 60 ������ Change in Heat Rate of Plant (10,000 vs ~7,200Btu/kW h)
50
���Change in Fuel Price ($5 vs $4.21 /M M Btu) 20
Increm ental Annual Energy Cost������ Change in Valuation M ethodology 54
Change in Air Cooled Condenser Capital Cost 11
Hypothetical "M ake-up" Plant Capital Cost
Alternative Cooling Increm ental Capital Cost
Increm ental Annual Energy Cost 177 47 130
Increm ental Capital Cost 120 55 65
Increm ental O &M 4 4
Prior AnalysisIncrem ental PV
Current AnalysisIncrem ental PV
PV DifferenceCapital Cost Difference
Energy Cost Difference
P V = $301
P V = $106
C apital D elta = $65
E nergy D elta = $130
P V D elta = $19559%
40%
1%
44%
52%
4%
67%
33%
124%
(24)%
46%
39%
15%
81
(16)

Duke Energy Morro Bay, LLC Page 64
Figure 4: Hybrid Present Value Comparison
-
50
100
150
200
250
300
$mill
ion
Change in Duty Cycle and ValuationMethodology
45
Change in Heat Rate of Plant (10,000 vs~7,200 Btu/kWh)
42
Change in Fuel Price ($5 vs $4.21/MMBtu)
17
Incremental Annual Energy Cost
Change in Valuation Methodolog
Change in Hybrid Wet/Dry Capital Cost (20)
Hypothetical "Make-up" Plant Capital Cost
Alternative Cooling Incremental CapitalCost
Incremental Annual Energy Cost 151 47 104
Incremental Capital Cost 116 56 60
Incremental O&M 6 6
Prior AnalysisIncremental PV
Current AnalysisIncremental PV PV Difference Capital Cost
DifferenceEnergy Cost Difference
PV = $273
PV = $109
Capital Delta = $60
Energy Delta = $104
PV Delta = $164
55%
43%
2%
43%
51%
6%
63%
37%133%
(33)%
43%
41%
16%
80


