DUKE MBA EMPLOYMENT REPORT 2016 – 2017 1 This report conforms to the MBA Career Services and Employer Alliance (MBACSEA) Standards for Reporting MBA Employment Statistics. Percentages are rounded to the nearest whole and may not total 100. Duke University’s Fuqua School of Business is pleased to present the following employment information for its graduating Class of 2017 and intern Class of 2018. We hope you will find value in learning about the full- time positions and summer internships accepted by our Daytime MBA students in 2016 – 2017 and the premier organizations that hire them. If we can answer any questions or help you with your talent needs, please contact the Career Management Center (CMC) at [email protected]or +1 (919) 660-7810. Top 20 employers this year Employer Total Duke MBA Hires for 2016-2017 Class of 2017 (Full-Time) Class of 2018 (Internships) Amazon.com 45 15 30 Deloitte 40 26 14 McKinsey & Company 35 21 14 Microsoft Corporation 21 11 10 Accenture LLP 21 11 10 BCG (The Boston Consulting Group) 19 12 7 Bank of America Merrill Lynch 19 7 12 Bain & Company 17 10 7 Apple, Inc. 13 6 7 Google, Inc. 11 3 8 Goldman Sachs 9 5 4 Walmart 9 3 6 Dell, Inc. 9 3 6 DaVita Healthcare Partners 9 5 4 Eli Lilly and Company 9 3 6 Johnson & Johnson 8 2 6 PwC (PricewaterhouseCoopers LLP) 7 5 2 American Airlines 7 6 1 Credit Suisse 7 2 5 Cisco Systems 7 4 3 Genentech 6 2 4 Coca-Cola Company, The 6 4 2 Please see pages 14 – 15 for a complete list of employers hiring Duke MBAs in 2016 - 2017.
Transcript
DUKE MBA EMPLOYMENT REPORT 2016 – 2017
1 This report conforms to the MBA Career Services and Employer Alliance (MBACSEA) Standards for Reporting MBA Employment Statistics. Percentages are rounded to the nearest whole and may not total 100.
Duke University’s Fuqua School of Business is pleased to present the following employment information for
its graduating Class of 2017 and intern Class of 2018. We hope you will find value in learning about the full-
time positions and summer internships accepted by our Daytime MBA students in 2016 – 2017 and the
premier organizations that hire them.
If we can answer any questions or help you with your talent needs, please contact the Career Management
2 This report conforms to the MBA Career Services and Employer Alliance (MBACSEA) Standards for Reporting MBA Employment Statistics. Percentages are rounded to the nearest whole and may not total 100.
CLASS OF 2017 FULL-TIME EMPLOYMENT DATA
Two graduates, representing 0.5% of those seeking full-time employment, reported having full-time offers rescinded by employers.
On pages 2 – 6, you will see full-time compensation information for Class of 2017 graduates. This data is
based on acceptances by three months post-graduation, in U.S. dollar equivalents, and self-reported by
students. To protect privacy, salaries are not reported when there are less than four usable data points, the
number is less than one percent of the reporting population, or when all salaries in the category are equal.
Annual base salary Reporting base salary
Mean Median High Low Number Percent
With permanent U.S. work authorization 232 96% $125,619 $125,000 $200,000 $52,000
Without permanent U.S. work authorization 110 91% $117,442 $120,000 $156,000 $55,000
All graduates reporting salary 342 94% $122,989 $125,000 $200,000 $52,000
Signing bonus Reporting signing bonus
Mean Median High Low Number Percent
With permanent U.S. work authorization 192 83% $29,236 $25,000 $85,000 $3,000
Without permanent U.S. work authorization 88 80% $32,859 $30,000 $75,000 $3,500
With permanent U.S. work authorization 251 239 95% 8 3% 247 98%
Without permanent U.S. work authorization 141 117 83% 12 9% 129 91%
All graduates 392 356 91% 20 5% 376 96%
Timing of
job acceptances Total
By graduation Between graduation
and 3 months out Total
Number Percent Number Percent Number Percent
With permanent U.S. work authorization 251 233 93% 9 4% 242 96%
Without permanent U.S. work authorization 141 108 77% 13 9% 121 86%
All graduates 392 341 87% 22 6% 363 93%
DUKE MBA EMPLOYMENT REPORT 2016 – 2017
3 This report conforms to the MBA Career Services and Employer Alliance (MBACSEA) Standards for Reporting MBA Employment Statistics. Percentages are rounded to the nearest whole and may not total 100.
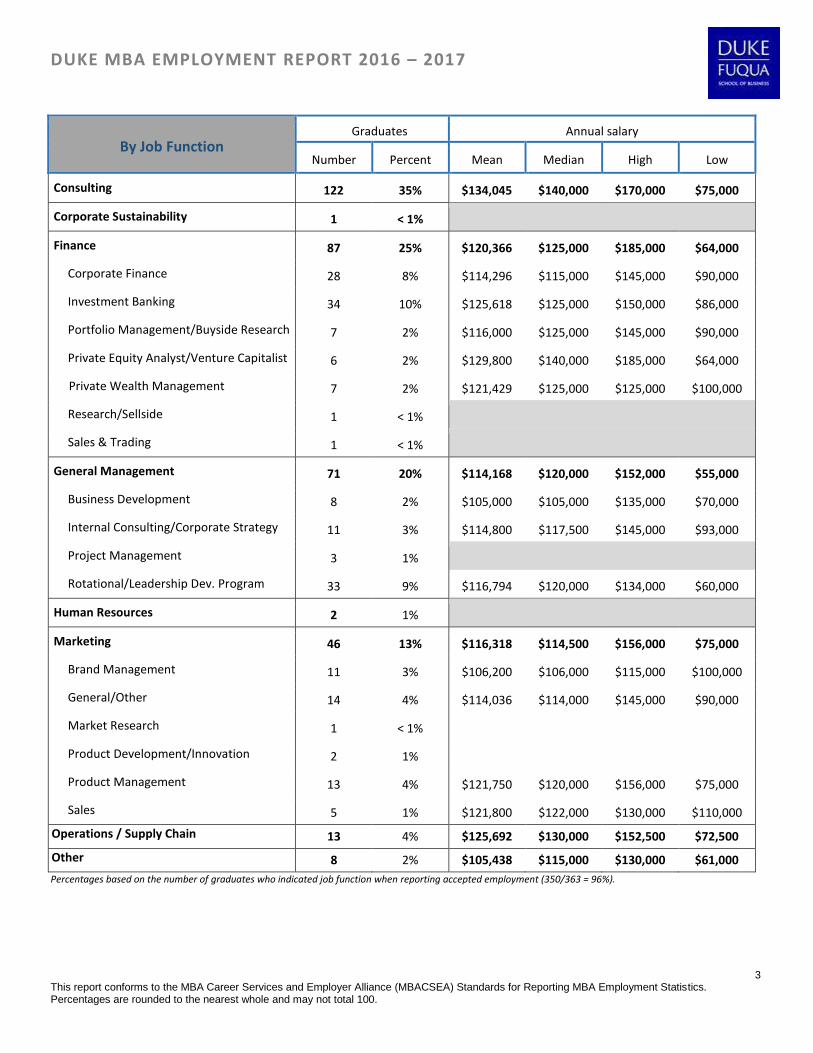
Percentages based on the number of graduates who indicated job function when reporting accepted employment (350/363 = 96%).
DUKE MBA EMPLOYMENT REPORT 2016 – 2017
4 This report conforms to the MBA Career Services and Employer Alliance (MBACSEA) Standards for Reporting MBA Employment Statistics. Percentages are rounded to the nearest whole and may not total 100.
Other Health 5 1% $98,000 $105,000 $120,000 $52,000
DUKE MBA EMPLOYMENT REPORT 2016 – 2017
5 This report conforms to the MBA Career Services and Employer Alliance (MBACSEA) Standards for Reporting MBA Employment Statistics. Percentages are rounded to the nearest whole and may not total 100.
Business 117 33% $124,071 $125,000 $185,000 $72,000
Other 126 35% $121,930 $125,000 $200,000 $52,000
Percentages based on the number of graduates who indicated undergraduate major when reporting accepted employment (357/363 = 98%).
DUKE MBA EMPLOYMENT REPORT 2016 – 2017
6 This report conforms to the MBA Career Services and Employer Alliance (MBACSEA) Standards for Reporting MBA Employment Statistics. Percentages are rounded to the nearest whole and may not total 100.
By World Region Graduates Annual salary
Number Percent Mean Median High Low
Asia 16 5% $109,115 $110,000 $130,000 $64,000
Australia and Oceania 1 < 1%
Central America and the Caribbean 6 2% $96,667 $100,000 $125,000 $60,000
European Free Trade Zone 5 1% $115,551 $114,250 $130,000 $103,703
European Non-Free Trade Zone 1 < 1%
South America 10 3% $93,744 $88,910 $145,000 $61,000
North America 318 89% $124,908 $125,000 $200,000 $52,000
Percentages based on the number of graduates who indicated world region when reporting accepted employment (357/363 = 98%).
By North American Region Graduates Annual salary
Number Percent Mean Median High Low
U.S. Mid-Atlantic 20 6% $132,425 $130,000 $200,000 $93,000
U.S. Midwest 43 14% $126,755 $125,000 $152,000 $90,000
U.S. Northeast 81 26% $127,619 $125,000 $170,000 $90,000
U.S. South 65 20% $117,118 $120,000 $152,500 $52,000
U.S. Southwest 32 10% $123,547 $125,000 $152,500 $86,000
U.S. West 75 24% $126,042 $121,500 $185,000 $55,000
Canada 2 1%
By Years of Prior Experience Graduates Annual salary
Number Percent Mean Median High Low
More than 1 year, up to 3 years 27 7% $123,320 $125,000 $152,000 $70,000
More than 3 years, up to 5 years 161 44% $122,600 $125,000 $160,000 $61,000
More than 5 years 175 48% $123,297 $125,000 $200,000 $52,000
DUKE MBA EMPLOYMENT REPORT 2016 – 2017
7 This report conforms to the MBA Career Services and Employer Alliance (MBACSEA) Standards for Reporting MBA Employment Statistics. Percentages are rounded to the nearest whole and may not total 100.
THREE-YEAR TRENDS: FULL-TIME POSITIONS
In an increasingly diverse MBA employment marketplace,
our presence in key industries and job functions remains strong.
0
5
10
15
20
25
30
35
Consulting Finance Technology Health
% o
f gr
adu
atin
g cl
ass
By Industry
2017 2016 2015
0
5
10
15
20
25
30
35
40
Consulting Finance Gen Mgmt Marketing
% o
f gr
adu
atin
g cl
ass
By Job Function
2017 2016 2015
DUKE MBA EMPLOYMENT REPORT 2016 – 2017
8 This report conforms to the MBA Career Services and Employer Alliance (MBACSEA) Standards for Reporting MBA Employment Statistics. Percentages are rounded to the nearest whole and may not total 100.
Sources of employment Class of 2017 (Full-Time) Class of 2018 (Internships)
Number Percent Number Percent
Total School-Facilitated Activities 258 80% 303 87%
From a summer 2016 internship (full-time only) ¹ 130 40% N/A
Scheduled interviews 93 29% 209 60%
Job postings 14 4% 45 13%
Other Fuqua source or event 21 6% 49 14%
Total Graduate-Facilitated Activities 66 20% 44 13%
From a summer 2016 internship (full-time only) ¹ 19 6% N/A
Family, friends outside school 9 3% 14 4%
Job posting 10 3% 13 4%
Other source or event 28 9% 17 5%
Percentages based on the number of graduates (89%) and interns (86%) who indicated job offer source when reporting accepted employment.
¹ Differentiated by the original source of the internship, whether school- or graduate-facilitated.
CLASS OF 2018 INTERNSHIP DATA
On pages 8 - 12, you will see monthly compensation information for Class of 2018 interns. This data is in U.S.
dollar equivalents and self-reported by students. To protect privacy, salaries are not reported when there are
less than four usable data points, the number is less than one percent of the reporting population, or when
all salaries in the category are equal.
Monthly salary Reporting base salary
Mean Median High Low Number Percent
With permanent U.S. work authorization 228 93% $8,331 $8,000 $14,000 $1,000
Without permanent U.S. work authorization 131 83% $7,278 $8,000 $12,500 $600
All interns reporting salary 359 89% $7,947 $8,000 $14,000 $600
14% of interns reported receiving a signing bonus with a mean of $3,610 and a median of $2,500.
DUKE MBA EMPLOYMENT REPORT 2016 – 2017
9 This report conforms to the MBA Career Services and Employer Alliance (MBACSEA) Standards for Reporting MBA Employment Statistics. Percentages are rounded to the nearest whole and may not total 100.
Percentages based on the number of graduates who indicated job function when reporting accepted employment (391/405 = 97%).
DUKE MBA EMPLOYMENT REPORT 2016 – 2017
10 This report conforms to the MBA Career Services and Employer Alliance (MBACSEA) Standards for Reporting MBA Employment Statistics. Percentages are rounded to the nearest whole and may not total 100.
By Industry Interns Monthly salary
Number Percent Mean Median High Low
Consulting 72 18% $10,486 $11,268 $13,500 $1,600
Energy 1 < 1%
Healthcare 3 1%
Human Capital 4 1% $8,970 $10,190 $10,500 $5,000
Strategy 35 9% $10,612 $11,200 $13,500 $2,595
Technology 5 1% $10,317 $11,000 $12,500 $6,000
Other Consulting 24 6% $11,165 $12,250 $12,500 $2,400
Consumer Goods 23 6% $6,744 $7,000 $8,750 $2,000
Beverages / Food 8 2% $6,595 $7,268 $8,750 $2,000
Household / Personal 2 < 1%
Other Consumer Goods 13 3% $6,757 $6,512 $7,713 $5,258
11 This report conforms to the MBA Career Services and Employer Alliance (MBACSEA) Standards for Reporting MBA Employment Statistics. Percentages are rounded to the nearest whole and may not total 100.
By Industry (continued) Interns Monthly salary
Number Percent Mean Median High Low
Hospitality/Tourism 2 < 1%
Insurance 3 1%
Legal Services 1 < 1%
Manufacturing 11 3% $7,395 $7,550 $10,000 $5,000
Automotive 5 1% $6,640 $7,300 $7,800 $5,000
Other Manufacturing 6 1% $8,150 $8,000 $10,000 $7,000
Media / Entertainment 2 < 1%
Real Estate 2 < 1%
Retail 10 2% $6,678 $7,000 $8,000 $4,500
Social & Environmental Impact 12 3% $4,248 $4,000 $7,000 $1,200
Education 5 1%
Foundations/Philanthropy 1 < 1%
Other Social Impact 6 1% $4,700 $5,500 $7,000 $1,200
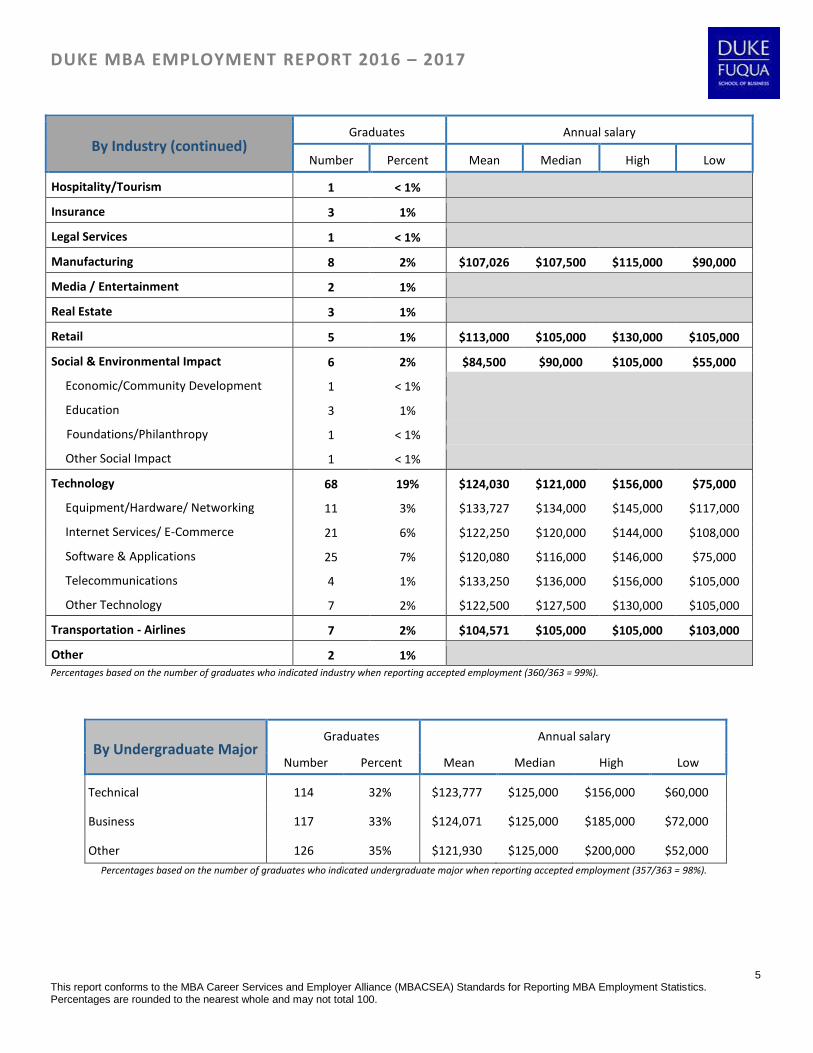
Percentages based on the number of interns who indicated industry when reporting accepted employment (401/405 = 99%).
By Undergraduate Major Interns Monthly salary
Number Percent Mean Median High Low
Technical 132 34% $7,786 $8,000 $12,600 $1,000
Business 135 34% $8,011 $8,000 $12,500 $1,000
Other 127 32% $7,924 $8,000 $14,000 $600
Percentages based on the number of interns who indicated undergraduate major when reporting accepted employment (394/405 = 97%).
DUKE MBA EMPLOYMENT REPORT 2016 – 2017
12 This report conforms to the MBA Career Services and Employer Alliance (MBACSEA) Standards for Reporting MBA Employment Statistics. Percentages are rounded to the nearest whole and may not total 100.
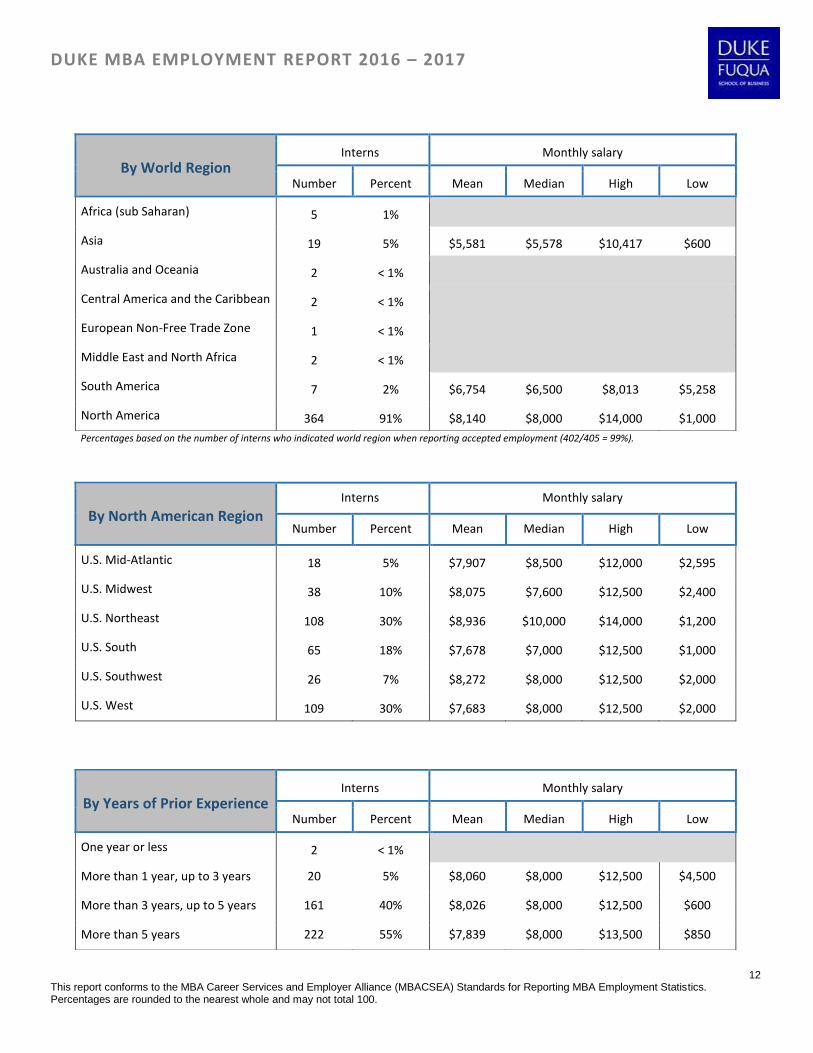
Percentages based on the number of interns who indicated world region when reporting accepted employment (402/405 = 99%).
By North American Region Interns Monthly salary
Number Percent Mean Median High Low
U.S. Mid-Atlantic 18 5% $7,907 $8,500 $12,000 $2,595
U.S. Midwest 38 10% $8,075 $7,600 $12,500 $2,400
U.S. Northeast 108 30% $8,936 $10,000 $14,000 $1,200
U.S. South 65 18% $7,678 $7,000 $12,500 $1,000
U.S. Southwest 26 7% $8,272 $8,000 $12,500 $2,000
U.S. West 109 30% $7,683 $8,000 $12,500 $2,000
By World Region Interns Monthly salary
Number Percent Mean Median High Low
Africa (sub Saharan) 5 1%
Asia 19 5% $5,581 $5,578 $10,417 $600
Australia and Oceania 2 < 1%
Central America and the Caribbean 2 < 1%
European Non-Free Trade Zone 1 < 1%
Middle East and North Africa 2 < 1%
South America 7 2% $6,754 $6,500 $8,013 $5,258
North America 364 91% $8,140 $8,000 $14,000 $1,000
By Years of Prior Experience Interns Monthly salary
Number Percent Mean Median High Low
One year or less 2 < 1%
More than 1 year, up to 3 years 20 5% $8,060 $8,000 $12,500 $4,500
More than 3 years, up to 5 years 161 40% $8,026 $8,000 $12,500 $600
More than 5 years 222 55% $7,839 $8,000 $13,500 $850
DUKE MBA EMPLOYMENT REPORT 2016 – 2017
13 This report conforms to the MBA Career Services and Employer Alliance (MBACSEA) Standards for Reporting MBA Employment Statistics. Percentages are rounded to the nearest whole and may not total 100.
Total not seeking employment 11 1 12 6 0 6 17 1 18
No information available 0 0 0 3 0 3 3 0 3
Total students 258 20 278 167 0 167 425 20 445
DUKE MBA EMPLOYMENT REPORT 2016 – 2017
14 This report conforms to the MBA Career Services and Employer Alliance (MBACSEA) Standards for Reporting MBA Employment Statistics. Percentages are rounded to the nearest whole and may not total 100.
Employers hiring at least one Duke MBA graduate or intern in 2016 - 2017
20th Century Fox
3M
A.T. Kearney
ABB
Accenture LLP
Acumen Fund Inc.
Adobe Systems Inc.
ADP
AES Energy Storage
Allstate Insurance Co.
Amazon.com
American Airlines
American Express Company
Amgen, Inc.
Anheuser-Busch InBev
Apple, Inc.
Arosa LLC
AstraZeneca
AT&T
Athenahealth
BAE Systems
Bain & Company
Bank of America Merrill Lynch
Barclays
Baxter Healthcare
Bayer
BCG (The Boston Consulting Group)
BD
Bill & Melinda Gates Foundation, The
Bimbo Bakeries USA
BlackArch Partners
BNP Paribas
Boehringer Laboratories
Booz Allen Hamilton
Boston Scientific Corporation
Bridgewater Associates, LP
Burt’s Bees, Inc.
Caesars Entertainment Corporation
Cain Brothers & Company, LLC
Cambridge Associates
Capital One
Cardinal Health
Cencosud SA
Chatham Financial Corporation
Chevron Corporation
Churchill Capital Company
CIGNA Corporation
Cisco Systems
Citi
Citigroup
Clorox Company, The
Coca Cola Bottling Co. Consolidated
Coca-Cola Company, The
Cognizant Technology Solutions
Credit Suisse
Ctrip.com International Ltd.
Cytokinetics, Inc.
D.light Design
Danaher Corporation
DaVita
Deere & Co.
Dell, Inc.
Deloitte
Deloitte Corporate Finance LLC
Delta Air Lines
Deutsche Bank
Development Finance Initiative
Dimensional Fund Advisors
Discover Financial Services
DISH Network
Dr Pepper Snapple Group
Duke Corporate Education
Duke University Health System, Inc.
DuPont
E & J Gallo Winery
eBay Inc.
Education Pioneers
Eli Lilly and Company
Emerson Electric
Eos Energy Storage
Ernst & Young
Everest Group
Exelon Corporation
ExxonMobil Corporation
Facebook
Falabella
Federal Bureau of Investigation (FBI)
Fidelity Investments
Ford Motor Company
Full Steam Brewery
Gartner
GE
Genentech
General Mills
General Motors Company
Georgia-Pacific LLC
GlaxoSmithKline (GSK)
Glenfarne Group
Goldman Sachs
Google, Inc.
Greenhill & Co.
HARMAN
Harris Williams & Co.
HD Supply
Hershey Company, The
Hines
Houghton Mifflin Harcourt
Houlihan Lokey
HP, Inc.
IBM Corporation
IDEXX
Illumina
Innovations in Healthcare (Formerly IPIHD)
Inspiring Capital
Integra LifeSciences
Intel Corporation
Internex Capital
Intuitive Surgical
IQVIA (Formerly QuintilesIMS)
Itau Unibanco
J.P. Morgan
Jabil Inc.
Janssen Pharmaceutica Inc. (J&J)
JD Group
Jefferies & Company, Inc.
John Deere
Johnson & Johnson
K12 Inc.
Kaiser Permanente
Kespry
KIPP New Orleans Schools
KPMG LLP
DUKE MBA EMPLOYMENT REPORT 2016 – 2017
15 This report conforms to the MBA Career Services and Employer Alliance (MBACSEA) Standards for Reporting MBA Employment Statistics. Percentages are rounded to the nearest whole and may not total 100.