26
August, 2016 August 2016 August 2016 Duluth Energy Transition Chapter 2: Investigating Zero-Energy Potential
0
August, 2016
August 2016
August 2016
Duluth Energy Transition Chapter 2: Investigating Zero-Energy Potential

1
Duluth Energy Transition,
Chapter 2: Investigating Zero-
Energy Potential
Authors:
Jacob Cherry, Graduate Research Assistant, Center for Sustainable Building
Research
Megan Butler, Graduate Research Assistant, Energy Transition Lab
Ellen Anderson, Executive Director Energy Transition Lab
Garrett Mosiman, Senior Research Fellow, Center for Sustainable Building
Research
All graphic materials prepared by:
Thank you to the McKnight foundation for financial support of this project.

2
Table of Contents
Executive Summary ....................................................................................................................................... 4
Introduction .................................................................................................................................................. 5
Phase 1: Identify a civic building in Duluth, MN with the potential to reach net-zero energy
consumption. ............................................................................................................................................ 6
Phase 2: Develop and calibrate an energy model of the facility .............................................................. 9
Measure 1: Reduced Building Exhaust Rate ....................................................................................... 11
Measure 2: Increased Roof Insulation to R-35 ................................................................................... 12
Measure 3: Increased Wall Insulation to R-15.2 ................................................................................. 13
Measure 4: Air Infiltration Rates in the Apparatus Bay ...................................................................... 14
Measure 5: Refrigerator Replacement ............................................................................................... 15
Measure 6: Address Fire Hall 4’s Internal Equipment Load ................................................................ 16
Total Energy Reduction ....................................................................................................................... 17
Phase 4: Size a renewable energy system to supply remaining building energy load ........................... 18
Carbon-Neutral ................................................................................................................................... 18
Net-Zero Energy .................................................................................................................................. 19
Recommendations ...................................................................................................................................... 20
Appendix A: Duluth Steam Current System ................................................................................................ 23
Appendix B: Assumptions ........................................................................................................................... 24
Bibliography ................................................................................................................................................ 25

3
Table of Figures Figure 1: Energy Use Intensity ...................................................................................................................... 6
Figure 2: Comparison of Savings Potential ................................................................................................... 7
Figure 3: Duluth Fire hall Energy Use Intensity ............................................................................................. 8
Figure 4: CBECS Average Energy Use Intensity of Public Order and Safety Buildings .................................. 8
Figure 5: Energy Model Calibration .............................................................................................................. 9
Figure 6: Measure 1 Modeled Energy Savings ............................................................................................ 11
Figure 7: Measure 2 Modeled Energy Savings ............................................................................................ 12
Figure 8: Measure 3 Modeled Energy Savings ............................................................................................ 13
Figure 9: Measure 4 Modeled Energy Savings ............................................................................................ 14
Figure 10: Measure 5 Modeled Energy Savings .......................................................................................... 15
Figure 11: Measure 6 Modeled Energy Savings .......................................................................................... 16
Figure 12: Summary of Energy Conservation Measures ............................................................................. 17
Figure 13: Size of Solar Panel Necessary to Reach Carbon Neutrality. ....................................................... 18
Figure 14: Size of Solar Panel Necessary to Receive the Designation of Being Net-Zero Energy ............... 19
Figure 15: Relative Costs of Measures Analyzed…………………………………………………………………………………….20
4
Executive Summary
As part of its research on Duluth’s Energy Future Planning, the University of Minnesota’s Energy Transition
Lab collaborated with the Center for Sustainable Building Research (CSBR) to investigate the potential of
a carbon-neutral or net-zero energy building within Duluth’s existing municipal buildings. The goal of this
research was to provide actionable strategies for the city to significantly increase a target building’s energy
efficiency. The Energy Transition Lab managed the project, coordinated with city staff and stakeholders,
and drafted and edited this report, while the CSBR research team did all of the technical and analytical
work, contributed to editing and writing, and created all graphics and data found in this report.
The CSBR research team systematically assessed and identified opportunities within Duluth’s municipal
facilities. Taken as a group Duluth’s Fire Halls were underperforming compared to national building
performance data. Together with key city stakeholders, the research team identified Fire Hall 4 as a
representative facility to proceed with an in-depth analysis.
The CSBR research team gathered information about the facility from existing drawings and site
walkthroughs and utilized a combination of computer software to generate an energy model. Through
iterative simulation the model was tuned and calibrated to within a reasonable tolerance of known energy
usage and utility data. Once calibrated, the energy model was utilized to measure the potential effect of
different energy conservation measures on total energy consumption in the building. These energy
conservation measures included adjustments to operations, mechanical systems, and architectural
retrofits, and collectively simulated energy usage reductions from 44%-62%. Based on current rates, these
improvements would save an estimated $4,700 - $7,600 annually on utility expenditures. Some, but not
all, of the measures projected to achieve significant reductions required relatively easy and inexpensive
changes to building operations and maintenance.
In addition to the complex tasks of developing a calibrated energy model and analyzing the impact of
energy conservation measures, the research team identified the amount of renewable energy output that
Fire Hall 4 would require in order to achieve carbon neutral or net-zero energy designations. The on-site
renewable system needed for carbon-neutral ranged from 63MWh – 93MWh; a net-zero energy system
was much harder to attain with systems ranging from 126 MWh – 186MWh.1 We will describe in detail
the differences between net zero and carbon neutral below.
Potential actions and drawbacks of each energy conservation measure, renewable energy systems, and
additional considerations are listed in conclusion.
1 Note that these numbers refer to energy production of a renewable system (megawatt hours), not the size of the system (kilowatts or megawatts).

5
Introduction
In February 2015 Duluth community stakeholders participated in an Energy Future Charrette and
identified key priorities for future research. The McKnight Foundation awarded the Energy Transition Lab
grant funding to study and report on key aspects of Duluth’s energy future planning. The project brought
together University and industry experts in bioenergy, solar, law, economics, sustainable building design,
combined heat and power, and other disciplines to analyze forward-looking energy scenarios for
Northeastern Minnesota.
One of the key outcomes of the Duluth Charrette was to understand how realistic it is to reach high levels
of energy reductions in existing buildings. To set a high bar for this inquiry, the project scope was set as
a goal of providing actionable, cost-effective models for Net-Zero Energy building retrofits. This research
focuses upon retrofits rather than new construction because of the opportunities that exist within the
state’s current building stock. The Energy Transition Lab asked the University of Minnesota’s Center for
Sustainable Building Research (CSBR) to assist in the energy modeling.
The team hoped to analyze a public building that could be a significant and replicable model for future
energy efficiency projects. The Center for Sustainable Building Research (CSBR) approaches buildings as
architects and designers, and our open approach allowed us to explore multiple scenarios and pathways
to achieve energy efficiency. While these may represent stretch goals for buildings, they are grounded in
economic reality. The analysis involved five distinct goals:
1. Identify a civic building in Duluth, MN with the potential to reach net-zero energy consumption
and to provide replicable learning and results.
2. Develop an energy model of the facility and its operations, and calibrate it to the building’s known
energy demands.
3. Evaluate energy efficiency strategies and retrofits to reduce the building’s total energy
consumption.
4. Size a renewable energy system to supply the remaining building energy load.
5. Quantify potential savings and environmental impacts of selected outcomes.
Duluth’s Fire Hall #4 was chosen as a representative facility. Simulated architectural and operations
changes aimed to result in the building’s on-site energy production being equal to its on-site energy
consumption, and its total CO2 emissions equal to total CO2 reductions. This allowed us to analyze the
measures that would be necessary to retrofit Fire hall #4 to achieve a net zero energy profile, including
both electricity and natural gas inputs. As a result of this exercise, the CSBR demonstrated how to
transform an existing public building to Net-Zero Energy/Carbon Neutral facility and maximize emissions
reductions.
The following sections detail the methods utilized in each phase of this project, the results, and
recommendations for future action.

6
Phase 1: Identify a civic building in Duluth, MN with the potential to reach net-zero
energy consumption.
CSBR conducted an analysis of the existing building stock in Duluth to identify potential demonstration
sites. The potential sites also focused upon buildings in the district energy central city footprint2 that have
the potential of reaching net zero energy consumption. Several buildings that were higher than a national
median in energy use and carbon outputs were targeted.
As seen in Figure 1, a standard metric for assessing buildings is Energy Use Intensity (EUI), or all of the
building’s energy usage divided by the gross building area in square footage. Figure 2 (page 6) shows a
range of potential energy cost savings for several different Duluth public buildings. The percent reduction
in operating energy costs is shown, rather than percent reduction in actual energy use. Energy use
reductions for each potential level is shown in BTUs as well as Greenhouse Gas emissions reductions.
2 The siting of this project within the district energy central footprint was done to support the planned retrofits to the
Duluth Steam Plant. The Duluth Steam Plant’s planned conversion to a more efficient district energy system should
be paired with a focus on central city buildings, to maximize the efficiency of the entire system, expand the
customer base, and create cost-effective opportunities for building improvements. A map of Duluth Steam’s Current
System is included in Appendix A of this report
Figure 1: Energy Use Intensity
;

7
Figure 2: Comparison of Savings Potential

8
Building options for the modeling exercise included:
Duluth City Hall, City Center West, and Fire halls #1,
#2, #4, #6 and #7. CSBR determined the Energy Use
Intensity (EUI) for each building, the national
median EUI for buildings of the same type3 (Figure
3), and the recent utility expenditures for each
building analyzed; and quantified the economic
impact of theoretical energy reduction targets on
the facility’s annual utility costs.
The full research team met with key city
stakeholders, including city managers and facility
operations staff, in July 2015 and all of the options
were presented. Fire Hall #4 was identified as the
ideal site for the Net-Zero analysis. The Fire Hall was
deemed to be the ideal site for this analysis for
several reasons:
Duluth’s fire halls operate well above the
Commercial Buildings Energy Consumption
Survey (CBECS)4 Fire Station / Police Station EUI
of 88.3.
It was assumed that a successful net-zero
energy retrofit / renovation program for this
building would have the potential for
replication at other fire stations within the
municipality, a total representation of
65,000ft2 of built area.
The fire halls are distributed throughout
residential areas; successful projects would
increase exposure and awareness of net-zero
energy strategies to the general public.
Public order and safety buildings, which include fire and police stations, by nature of their 24/7
operations, have high energy demands.
The 2013-2017 Capital Improvements Plan5 presents opportunity to influence facility efficiencies
through an established investment schedule.
3 EUI includes energy spent on space heating, cooling, ventilation, water heating, lighting, refrigeration, office
equipment, computers etc. 4 The U.S. Energy Information Administration (EIA) defines the CBECS as “a national sample survey that collects
information on the stock of U.S. commercial buildings including their energy related building characteristics and
energy usage data (consumption and expenditures).” EIA: https://www.eia.gov/consumption/commercial/about.cfm 5 City of Duluth Capital Improvement and Budget Five Year Plan (2012): http://www.duluthgov.info/finance/2013-
2017%20Capital%20Improvement%20Plan.pdf
Figure 3: Duluth Fire hall Energy Use Intensity
Figure 4: CBECS Average Energy Use Intensity of Public Order and Safety Buildings
9
The mechanical system in Fire hall 4 had recently been upgraded to a high-efficiency condensing
boiler, which presented additional opportunities for retrofits.
Some of the existing buildings are dated and have not been remodeled. Upgrades to the stations
could focus on improving quality of service as well as operational efficiency.
Phase 2: Develop and calibrate an energy model of the facility
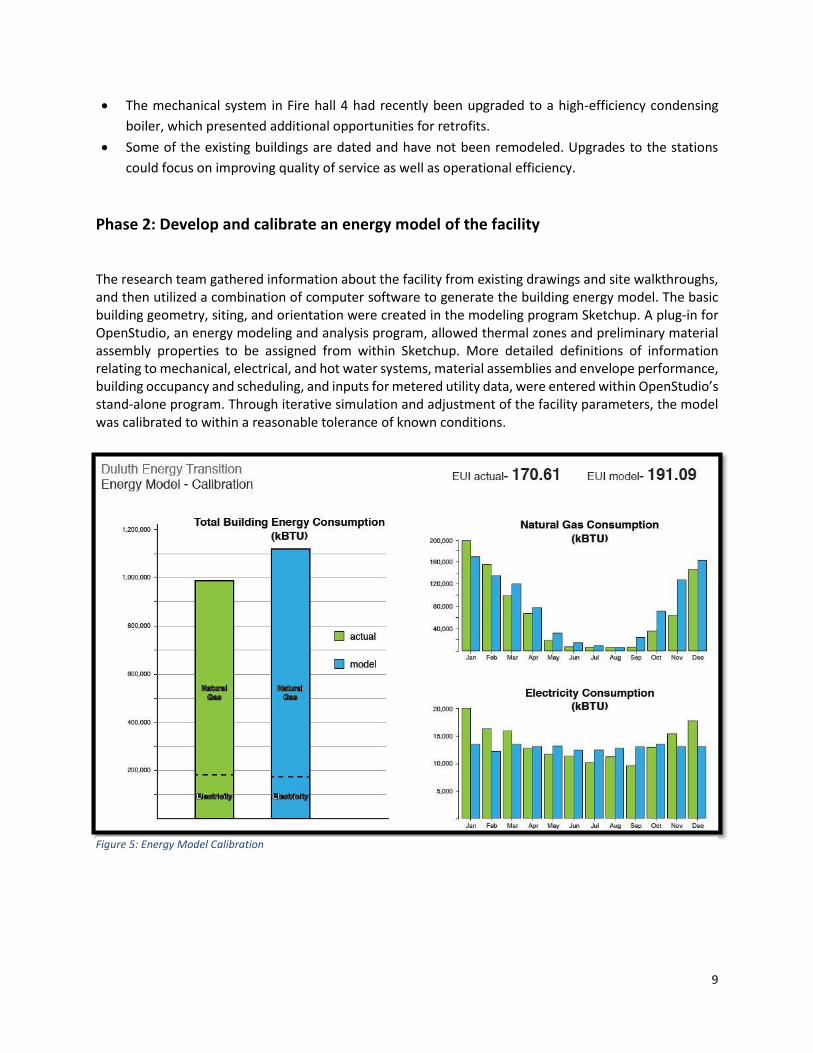
The research team gathered information about the facility from existing drawings and site walkthroughs, and then utilized a combination of computer software to generate the building energy model. The basic building geometry, siting, and orientation were created in the modeling program Sketchup. A plug-in for OpenStudio, an energy modeling and analysis program, allowed thermal zones and preliminary material assembly properties to be assigned from within Sketchup. More detailed definitions of information relating to mechanical, electrical, and hot water systems, material assemblies and envelope performance, building occupancy and scheduling, and inputs for metered utility data, were entered within OpenStudio’s stand-alone program. Through iterative simulation and adjustment of the facility parameters, the model was calibrated to within a reasonable tolerance of known conditions.
Figure 5: Energy Model Calibration

10
Phase 3: Evaluate energy conservation measures and architectural retrofits
Several concerns about the condition of the facility at Fire Hall 4 were identified during the development and calibration of the energy model. In many respects, the facility was not in compliance with current building codes. The thermal envelope was inadequately insulated. It was found that both thermal zones of the building were over ventilated, and air leakage and infiltration through the envelope was a significant problem. As a result, temperatures in the building’s two thermal zones were rarely within acceptable tolerances- too cold in the winter, and too hot in the summer- causing mechanical equipment to cycle on/off excessively. These concerns are generally supported by known utility expenditures. The facility utilizes a large amount of gas in the winter and this increased usage is reflected by significant increases in utility bills during cold winter months.
Once calibrated, the energy model was utilized to measure the potential effect of different energy conservation measures on total energy consumption in the building. These energy conservation measures included adjustments to operations, mechanical systems, and architectural retrofits. The measures modeled, and their effects, are described in the following section.
11
Measure 1: Reduced Building Exhaust Rate
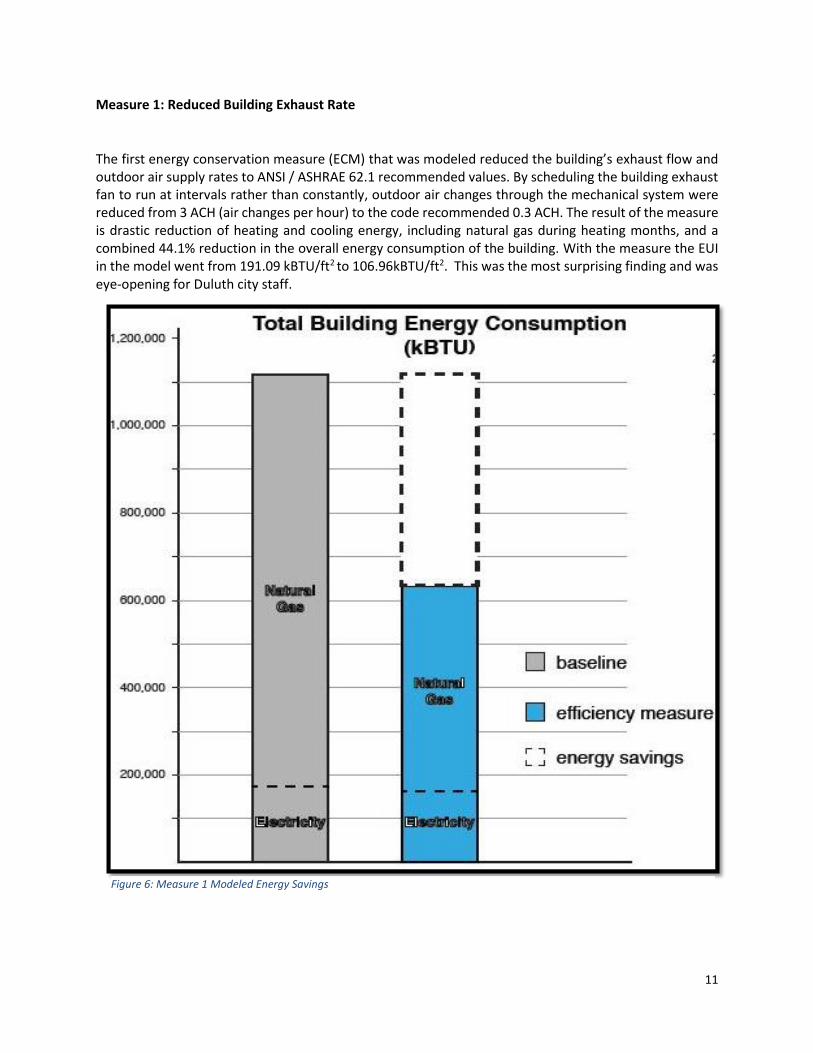
The first energy conservation measure (ECM) that was modeled reduced the building’s exhaust flow and outdoor air supply rates to ANSI / ASHRAE 62.1 recommended values. By scheduling the building exhaust fan to run at intervals rather than constantly, outdoor air changes through the mechanical system were reduced from 3 ACH (air changes per hour) to the code recommended 0.3 ACH. The result of the measure is drastic reduction of heating and cooling energy, including natural gas during heating months, and a combined 44.1% reduction in the overall energy consumption of the building. With the measure the EUI in the model went from 191.09 kBTU/ft2 to 106.96kBTU/ft2. This was the most surprising finding and was eye-opening for Duluth city staff.
Figure 6: Measure 1 Modeled Energy Savings

12
Measure 2: Increased Roof Insulation to R-35
The second energy conservation measure (ECM) modeled increased the building’s roof insulation to R-35. This amount of above-deck roof insulation complies with ASHRAE 90.1 - 2010. The result of the measure is additional savings on natural gas during heating months, and combined with the previous measure results in a 45.8% reduction in the overall energy consumption of the building, bringing the building’s EUI to 103.62.
Figure 7: Measure 2 Modeled Energy Savings

13
Measure 3: Increased Wall Insulation to R-15.2
The third energy conservation measure that was modeled increased the building’s wall insulation to R-15.2. This insulation value complies with ASHRAE 90.1 - 2010. The result of the measure stabilized thermal zone temperature swings, and created additional savings on natural gas during heating months. Combined with the previous measures, the result is a 48.7% reduction in the overall energy consumption of the building, bringing the building’s EUI to 98.04.
Figure 8: Measure 3 Modeled Energy Savings
14
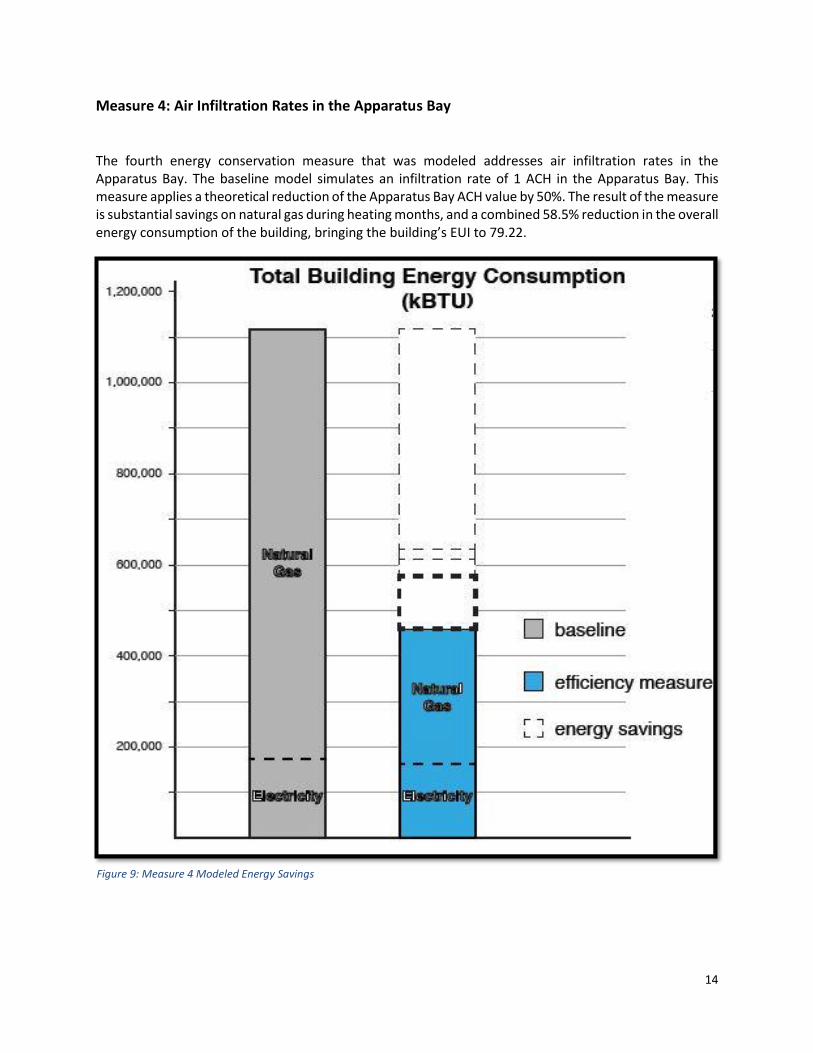
Measure 4: Air Infiltration Rates in the Apparatus Bay
The fourth energy conservation measure that was modeled addresses air infiltration rates in the Apparatus Bay. The baseline model simulates an infiltration rate of 1 ACH in the Apparatus Bay. This measure applies a theoretical reduction of the Apparatus Bay ACH value by 50%. The result of the measure is substantial savings on natural gas during heating months, and a combined 58.5% reduction in the overall energy consumption of the building, bringing the building’s EUI to 79.22.
Figure 9: Measure 4 Modeled Energy Savings

15
Measure 5: Refrigerator Replacement
Fire hall 4 runs three separate shifts per week, and each shift has their own refrigerator. The three refrigerators account for approximately 1800 kWh per year. The fifth energy conservation measure modeled replaces the existing refrigerators with an Energy Star rated unit that consumes approximately 400 kWh per year. The result of the measure saves approximately 1400 kWh per year, for a yearly savings of $126. This measure, combined with the previous measures, reduces energy use by 58.9% which brings the EUI down to 78.56 kBTU/ft2.
Figure 10: Measure 5 Modeled Energy Savings

16
Measure 6: Address Fire Hall 4’s Internal Equipment Load
The final energy conservation measure that was modeled addresses Firehall 4’s internal equipment load. The baseline model miscellaneous plug load input is occupancy scheduled 1 W/ft2, consistent with ASHRAE 90.1. The measure reduces the miscellaneous plug load input to 0.5 W/ft2. A plug load analysis is recommended to further understand how best to achieve this measure. The combined result of this and the previous measures is a 62% reduction of the baseline model energy demand and reduces EUI to 72.66 kBTU/ft2.
Figure 11: Measure 6 Modeled Energy Savings

17
Total Energy Reduction
As the table below shows, by implementing all of the above energy conservation measures, it may be
possible for Fire Hall 4 to reduce its energy load by 62%, decreasing the buildings EUI to 72.66. Based on
current rates, the modeled energy reduction could save up to $7,600 annually on utility expenditures.
Figure 12: Summary of Energy Conservation Measures

18
Phase 4: Size a renewable energy system to supply remaining building energy load
In addition to the complex tasks of developing a calibrated energy model and analyzing the impact of
energy conservation measures, we identified the size of renewable energy output that Fire Hall 4 will
require in order to achieve carbon neutral or net-zero energy designations. The two scenarios presented
below draw from existing information regarding CO2 output from the production of 1 kBTU of electricity
or natural gas.6 7
Carbon-Neutral
To achieve the designation carbon-neutral, a building must produce an amount of renewable energy
such that the amount of CO2 required to produce it through renewable means, subtracted from the
amount of CO2 required to produce it by conventional means, would generate a CO2 savings equal to the
CO2 output of the building’s current energy consumption. Because natural gas and electricity production
produce a different amount of CO2, a renewable energy system required to attain carbon-neutral
designation need not supply all of a building’s required energy. The table below shows the amount of
CO2 produced annually based on Fire Hall 4’s electricity and gas consumption after the applied energy
conservation measures. The final column is the electricity output required from an on-site solar array in
order for Fire Hall 4 to achieve carbon-neutral designation.
6 Energy Information Agency Frequently Asked Questions: https://www.eia.gov/tools/faqs/faq.cfm?id=74&t=11 7 Environmental Protection Agency: https://www.epa.gov/energy/ghg-equivalencies-calculator-calculations-and-references.
Figure 13: Size of Solar Panel Necessary to Reach Carbon Neutrality.

19
Net-Zero Energy
To achieve the designation net-zero energy, a building must produce annually, an amount of renewable
energy equal to the building’s annual energy consumption. Simply put, the energy produced by the
building must be equal to the energy consumed by the building. The table below shows the Fire Hall 4’s
kBTU equivalency for its electricity and natural gas consumption after the applied energy conservation
measures. The final column is the electricity output required from an on-site solar array in order for Fire
Hall 4 to achieve net-zero energy designation.
Figure 14: Size of Solar Panel Necessary to Receive the Designation of Being Net-Zero Energy

20
Recommendations
The work presented in this report is the result of a complex process of analysis that demands a significant
amount of time and expertise that is unavailable generally. As such, while this process could be replicated
with the appropriate software expertise, the specific process undertaken by the authors does not
translate easily into a replicable model or a simplified list of best practices. However, what this work does
do well is expose the need to work to develop a holistic understanding of facilities’ construction, systems,
and operations when addressing issues of energy efficiency. It also illustrates the importance of
equipment operation to the energy use of a building. By understanding how a building runs, it is possible
to make cost and energy savings adjustments even without a complicated energy model such as the one
presented in this analysis
The energy conservation measures presented above include adjustments to building operations and
architectural retrofits. Implementation of these measures may not be cost effective, and in some cases
may be prohibitively expensive. The table below provides a rough estimate of the typical costs of reach
measures relative to one another.
Figure 15: Relative Costs of Measures Analyzed
Very little to no cost Low cost Moderate cost High cost
Adjusting exhaust fan
Adjusting Air Infiltration Rates in the Apparatus Bay8
Replacing electronics
Refrigerator replacement
Increase roof insulation
Wall insulation
More detailed economic analysis and recommendations as to how best to enact certain courses of action
would be required should the stakeholders choose to do so. However, it is the CSBR research team’s
opinion that some changes could be implemented immediately, for low cost, and high impact.
Potential actions and drawbacks of energy conservation measures:
Measure 1
o Decouple the building exhaust fan from other ventilation requirements
o Use humidity sensors or other controls for wet-area ventilation to limit ventilation fan
operation
o Use carbon monoxide sensors or other controls for fresh-air requirements to limit
ventilation rate
o Use a percentage timer for the building exhaust
o Make the fan customizable for occupant comfort
8 This assumes a reduction in hose dryer fan operation.

21
o Make controls for the fan automatic rather than dependent on a maintenance person’s
check
o Additional analysis recommended
Measure 2
o Increase above-deck roof insulation to code as possible
o As identified, structure may be unable to accommodate additional load
o Additional analysis recommended
Measure 3
o Due to the brick veneer, additional wall insulation may be difficult, expensive, ineffective,
or create additional problems
o Additional analysis recommended
Measure 4
o Consider an air-curtain to reduce air leakage when apparatus bay doors are open during
heating months
o Fan in hose-drying tower may contribute to excessive ventilation rates – consider using a
timer or humidity sensor to reduce fan runtime
Measure 5
o Refrigerators are numerous and dated – consider replacing with Energy Star or other
energy efficiency rated equipment
Measure 6
o Replace old or inefficient electronics
o Consider switches that completely power-down equipment like set-top boxes, DVD
players, etc. These trickle charges can be significant in aggregate.
Renewable Energy System
The first step towards an effective renewable energy system is to have an efficient facility with which to pair it. After reducing the building’s energy load and a carbon output, then a renewable energy system can be coupled to reach the desired goal of carbon-neutral or net-zero energy.
Renewable energy systems in Public Order and Safety buildings may contribute to a community’s resiliency and disaster response.
Additional Considerations
Do not discount behavioral changes. Often operations and maintenance practices have a higher impact than physical structural factors. Other factors like maintenance—behavior may be significant drivers of energy usage
Make one change at a time to evaluate results.
Consider the input of industry experts working on net-zero energy building typology prototypes when evaluating cost-effectiveness of retrofit/remodel vs. new construction.
Duluth city facilities staff welcomed this analysis and the somewhat surprising results. While they had the benefit of CSBR expert software modeling and analysis, the results showed them that some relatively simple measures related to building operations could make a tremendous impact on energy usage. In discussion with the research team, city staff discussed how they could measure and monitor these

22
operational changes. At this time the City of Duluth has begun to implement some of the no/low cost energy solutions suggested by this analysis.

23
Appendix A: Duluth Steam Current System9
9 Duluth Steam Master Plan, 2013: http://www.duluthenergysystems.com/wp-content/uploads/2013/01/Duluth-Master-Plan-Final_December2013.pdf

24
Appendix B: Assumptions
CO2 -1201 Lb/MWh
N20 =1.5 Lb/MWh
SO2= 1.4 lb/MWh
Electricity 2014 Average Rate = $0.0463/kBTU
Natural Gas 2014 Average Rate = $0.010127/kBTU

25
Bibliography
Duluth Steam Master Plan. (2015). Duluth Energy Systems. Retrieved from: http://www.duluthenergysystems.com/wp-content/uploads/2013/01/Duluth-Master-Plan-Final_December2013.pdf
Capital Improvement and Budget Five Year Plan. (2012). City of Duluth. Retrieved from: http://www.duluthgov.info/finance/2013-2017%20Capital%20Improvement%20Plan.pdf
Commercial Buildings Energy Consumption Survey. (2016). U.S. Energy Information Administration. Retrieved from: https://www.eia.gov/consumption/commercial/about.cfm


