Oxfam Briefing Paper 61 Dumping on the world How EU sugar policies hurt poor countries European Union (EU) sugar policies hamper global efforts to reduce poverty. Export subsidies are used to dump 5 million tonnes of surplus sugar annually on world markets, destroying opportunities for exporters in developing countries. Meanwhile, producers in Africa have limited access to EU markets. The winners from the CAP sugar regime are big farmers and corporate sugar refiners such as Sudzucker and British Sugar. The losers are the poor. European consumers and taxpayers are financing a system which denies vulnerable people a chance to escape poverty and improve their lives. Reforms are needed to stop European dumping and improve market access for the poorest countries.
Transcript
Oxfam Briefing Paper
61
Dumping on the world How EU sugar policies hurt poor countries European Union (EU) sugar policies hamper global efforts to reduce poverty. Export subsidies are used to dump 5 million tonnes of surplus sugar annually on world markets, destroying opportunities for exporters in developing countries. Meanwhile, producers in Africa have limited access to EU markets. The winners from the CAP sugar regime are big farmers and corporate sugar refiners such as Sudzucker and British Sugar. The losers are the poor. European consumers and taxpayers are financing a system which denies vulnerable people a chance to escape poverty and improve their lives. Reforms are needed to stop European dumping and improve market access for the poorest countries.
Summary The Common Agricultural Policy (CAP) sugar regime produces an annual harvest of subsidised profit for food processors and big farmers, and it perpetuates unfair trade between Europe and the developing world. Reform could benefit millions of people in poor countries. The current system disproportionately benefits a wealthy minority in Europe.
The sugar regime is an anachronism within the expensive absurdity of the CAP. Insulated from successive reforms, the sugar sector remains one of the most distorted markets in European agriculture. It is also a flashpoint for international tensions over trade. An ongoing review of the CAP sugar regime provides an opportunity to address the problem. Failure to grasp that opportunity will be bad for Europe, worse for developing countries, and potentially disastrous for the future of the rules-based multilateral trading system.
The EU sugar regime is a notoriously complex system, but it produces a problem that can be very simply stated: too much sugar. Each year, Europe – a high-cost producer – generates an export surplus of approximately 5 million tonnes. This surplus is dumped overseas through a system of direct and indirect export subsidies, destroying markets for more efficient developing-country producers in the process. Meanwhile, high trade barriers keep imports out of Europe. The livelihoods of agricultural labourers and small farmers in developing countries suffer both as a consequence of the EU’s exports to world markets, and because of restricted access to European markets.
The EU claims that Europe is a ‘non-subsidising’ sugar exporter. This is the basis of its defence at the World Trade Organisation (WTO), where the sugar regime is under challenge. But this defence is untenable. The EU’s position at the WTO is built on economic sophistry. Behind the statistical fog emanating from Brussels, Europe is the world’s most prolific subsidy-user and biggest dumper. Currently, the EU is spending €3.30 in subsidies to export sugar worth €1. In addition to the €1.3bn in export subsidies recorded annually in its budgets, the EU provides hidden support amounting to around €833m on nominally unsubsidised sugar exports. These hidden dumping subsidies reflect the gap between EU production costs and export prices.
Heavy export subsidies and high import tariffs are a consequence of the wide gap between EU guaranteed prices and world prices. Domestic prices are maintained at levels three times those prevailing on world markets. Shorn of diplomatic niceties, the CAP sugar regime has the appearance of a price-fixing cartel operated by governments on behalf of big farmers and sugar-processing companies. The regime maintains a system of corporate welfare, paid for by EU taxpayers and consumers, with the human costs absorbed by developing countries.
Europe’s most prosperous agricultural regions – such as eastern England, the Paris Basin, and northern Germany – are among the biggest beneficiaries of sugar subsidies. We estimate the average support provided to 27 of the largest sugar-beet farms in the UK at €206,910. But the biggest welfare transfers are directed towards corporate sugar processors. The 25 per cent profit margin achieved by British Sugar, a subsidiary of Associated British Foods, is among the highest in the manufacturing sector in the EU. British Sugar is among the most vigorous lobbyists for maintaining the
Dumping on the world, Oxfam Briefing Paper. March 2004 1
current regime, having built an entire campaign on a selective and misleading interpretation of facts.
Other companies benefit from export subsidies worth millions of Euros each year. We estimate export-subsidy receipts for six major sugar processors at € 819m in 2003. The French company Beghin Say tops the league with receipts of €236m, followed by the German company Sudzucker, Europe’s largest processor, with receipts of €201m, and Tate and Lyle with €158m.
Developing countries figure prominently in the ranks of losers from CAP-sponsored sugar dumping. Translated into foreign-exchange losses, world-market distortions associated with EU sugar policies cost Brazil $494m,Thailand $151m, and South Africa and India around $60m each in 2002. These are large losses for countries with significant populations living in poverty, acute balance-of-payments pressures, and limited budget resources.
Trade preferences mitigate the losses caused by the sugar regime – but only marginally. Countries in the African, Caribbean, and Pacific (ACP) group enjoy preferential access to the European sugar market at prices linked to EU guaranteed prices. Least Developed Countries (LDCs) also have preferential access for a limited quota. This is a transitional arrangement under the Everything But Arms (EBA) initiative, through which the EU is committed to providing duty-free access from 2009.
The EU likes to point to the EBA initiative as an example of its commitment to development – and it must be said that the initiative has helped some countries. But in sugar, as in other areas of trade policy, EU generosity has its limits. Market-access rights are severely restricted to accommodate the concerns of processing companies such as British Sugar, Beghin Say, Sudzucker, and the sugar-beet lobby.
EBA arrangements allow Least Developed Countries to export a volume of sugar equivalent to 1 per cent of EU consumption. In other words, a group of 49 of the world’s poorest countries are allowed to supply Europe, one of the world’s richest regions, with only three days’ worth of sugar consumption. Mozambique and Ethiopia, two of the world’s poorest countries, have a right to export a combined total of 25,000 tonnes in 2004. Just fifteen of the biggest sugar farms in Norfolk produce more than this. When it comes to choosing between reducing poverty in Africa and supporting big farm and industrial interests in Europe, EU governments have made a clear choice.
We estimate the costs of EU market restrictions for Ethiopia, Mozambique, and Malawi. Total losses since the inception of the EBA in 2001 amount to $238m. Projected losses for 2004 are $38m for Mozambique and $32m for Malawi. The figures highlight a shameful lack of coherence between EU aid and trade policies. For every $3 that the EU gives Mozambique in aid, it takes back $1 through restrictions on access to its sugar market.
Export losses undermine investment and restrict the scope for diversification. For individual countries, the costs are large in relation to national financing capacity.
�� The losses for Mozambique in the current financial year are equivalent to total government spending on agriculture and rural development.
�� Ethiopia’s losses are equivalent to total national spending on programmes to combat HIV/AIDS.
Dumping on the world, Oxfam Briefing Paper. March 2004 2
�� Malawi’s losses exceed the national budget for primary health care.
The ultimate losers from the CAP sugar regime are men, women, and children in the world’s poorest countries. For those countries where more than half of the rural population lives below the poverty line, EU import restrictions translate into increased vulnerability, more poverty, absent or deteriorating health services, and diminished opportunities for education. The same is true for rural populations in countries such as South Africa and Thailand, where wages and conditions are adversely affected by EU dumping.
Reform of the EU sugar sector must address four central concerns.
�� First, the EU has to stop the direct and indirect subsidisation of exports. Continued dumping of surpluses must be rejected. For practical purposes, this means that the EU should adopt a ‘zero export’ regime for sugar, which in turn means cuts in production quotas.
�� The second priority is to improve market access for the poorest countries. Governments of the Least Developed Countries have indicated a preference for retaining quotas through which they can export to the EU at a remunerative and predictable price. If this option is adopted, the quota should reflect their export capacity.
�� The third priority is the protection of ACP interests. It is widely accepted that reform of the sugar regime will result in lower guaranteed prices, for which large growers in Europe will be generously compensated. But as EU prices fall, so too will those received by ACP exporters. For a large group of ACP countries this poses a serious threat. Some will face severe adjustment costs and the threat of social and economic dislocation. For this reason, it is imperative that the EU provides generous and timely support to aid countries undergoing adjustment.
�� Finally, the sugar regime should be brought into line with public interest in the EU. That means enhancing the capacity of small-scale family farmers in Europe to contribute to the creation of an agricultural system that is sustainable in social and environmental terms.
There is a growing danger that corporate interest groups will exploit the debate about reform of the CAP for their own ends, overriding public interest in the pursuit of subsidised profit. Sugar processors and large farm organisations have launched a Europe-wide lobbying effort aimed at perpetuating the current system. Britain is one of the focal points for the campaign. British Sugar and the National Farmers’ Union are attempting to sway public opinion against reform behind the populist banner of a ‘Save Our Sugar’ campaign. That campaign is built on distortion and the pursuit of self-interest.
This paper sets out the case for a reform model built on a fundamental realignment of EU sugar policy. It starts out from a position of pragmatism, rather than market fundamentalism. Advocates of deep liberalisation and transition to world-market prices ignore two fundamental problems. First, no politically plausible price cuts are likely to eliminate EU export surpluses, especially if implemented with large direct income aids to compensate the biggest farms for income losses. Second, deep price cuts in the EU would devastate the ACP and LDC industries that currently export at prices linked to CAP guaranteed prices. They would also undermine small-scale family farming.
Dumping on the world, Oxfam Briefing Paper. March 2004 3
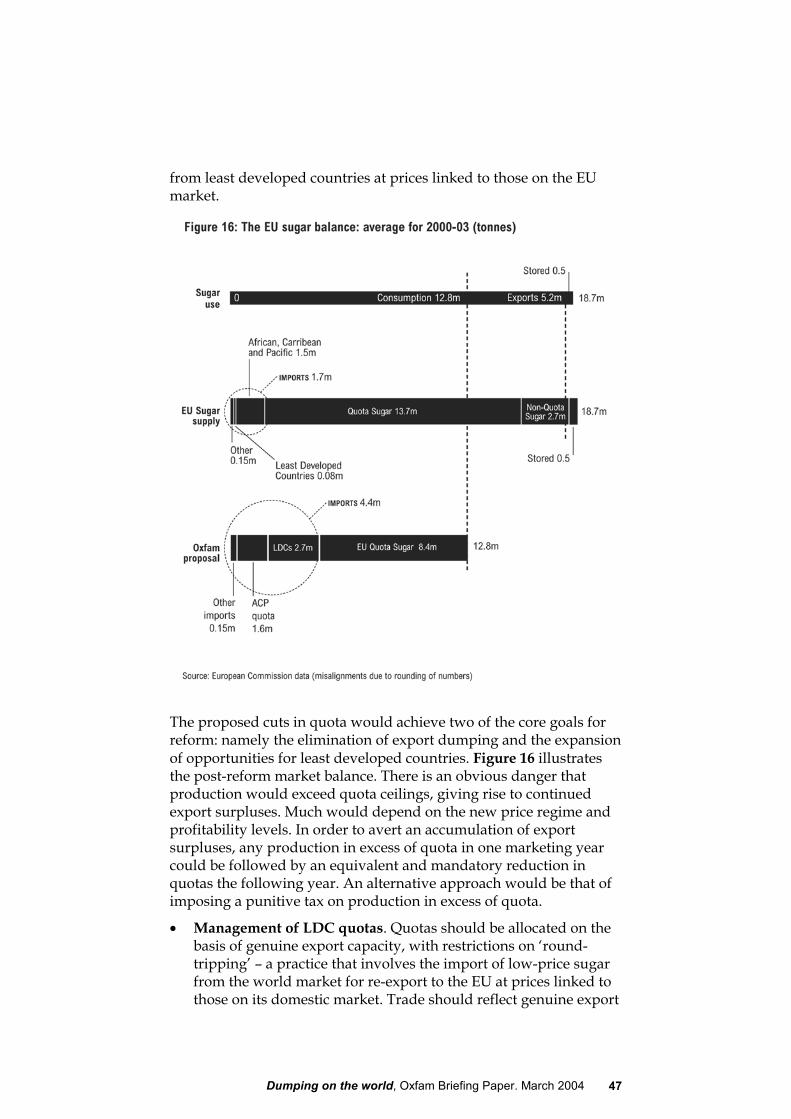
Our reform option incorporates a recognition that price cuts will take place as part of the reform process, but it argues for deep adjustments through quota cuts and expanded market access for least developed countries. We propose four key measures, as follows:
�� A cut of around 5.2 million tonnes, or one-third, in the EU quota to end all exports, facilitate an increase in imports from least developed countries, and realign domestic production with consumption. The cut would take place in two stages:
Stage 1: An immediate prohibition on non-quota exports (2.7 million tonnes) and a domestic quota cut of around 2.5 million tonnes.
Stage 2: An incremental, graduated cut in quotas over the period 2006-13 to accommodate an additional 2.7 million tonnes in imports from Least Developed Countries at prices linked to those on the EU market.
�� The elimination of all direct and indirect export subsidies with immediate effect.
�� A programme of increased aid and compensation for ACP exporters, financed by a transfer of the €1.3bn now allocated to export subsidies. The programme would include a ‘quota buy-back’ option, under which ACP countries could sell their quota back to the EU in return for a guaranteed flow of assistance.
�� Redistribution of CAP support towards smaller farmers, and an EU-wide investigation of the activities of sugar processors, conducted by national competition authorities.
Perhaps more than in any other sector, the sugar regime demonstrates why CAP reform cannot be treated solely as a domestic EU affair. The EU’s position as a major global producer, exporter, and importer means that decisions taken in Brussels will have implications not just for a large group of poor countries, but for millions of desperately poor people within those countries. That is why the EU needs to display a sense of international responsibility commensurate with its market power.
Dumping on the world, Oxfam Briefing Paper. March 2004 4
1 Introduction ‘This is hard work. I earn around $40 a month cutting sugar cane. But the alternative is poverty. At least now I can send my children to school and buy the basics for my family.’
Bekele Telila, a cane cutter on the Metahara Sugar Plantation, East Shoa, Ethiopia
‘Low world sugar prices and the dumping of sugar are a problem…I would like to see sugar subsidies cut and a global levelling of the playing field. European farmers should farm something more suitable to their climate. This would allow developing countries, particularly the small-scale growers, to grow more sugar cane for the world market, which would improve my situation. I can’t grow anything other than sugar cane.’
Mzo Mzoneli, smallholder sugar farmer, Kwa Zulu province, Natal, South Africa
Debates about reform of EU sugar policy invariably descend into a dense fog of technical arguments over budgets, subsidies, and marketing arrangements. Behind this fog, powerful vested interests lobby their governments and mobilise public campaigns to shape the direction of reform. Financial and political power provides these vested interests with a strong voice at the negotiating table: EU Member State governments are acutely sensitive to the demands of big farmers and sugar processors. By contrast, the voices of people in developing countries, such as those cited above, have a weak resonance in European capitals. The interests of farmers and labourers in poor countries may figure prominently in development-policy rhetoric. But when it comes to the formulation of policies in agriculture and trade, development principles take second place to power politics.
For a major trading power and a group of the world’s richest nations, this is not acceptable. Decisions taken in Brussels on the future of the CAP sugar regime will have major implications for poverty in developing countries. In a globalised world, trade implies interdependence and shared responsibilities. And sugar trade is one of the strongest links between Europeans and vulnerable people in the developing world.
For many developing countries, sugar is a major export and an important source of foreign exchange. Earnings from sugar help to finance imports vital to national development. But sugar also matters to households and the lives of ordinary people. In the impoverished north-east of Thailand, sugar is the main source of employment for rural agricultural labourers. In Mozambique and Malawi, the sugar sector supports tens of thousands of seasonal jobs and provides
Dumping on the world, Oxfam Briefing Paper. March 2004 5
incomes for desperately poor rural populations. In Kwa Zulu and other parts of the South African sugar belt, the industry provides a market for smallholder cane farmers, who in turn employ rural labourers. Worldwide, international sugar markets directly or indirectly impact on the welfare of millions of people, with price changes transmitted back through rural product and labour markets.
That does not mean sugar exports represent an automatic route to higher growth and poverty reduction. The international sugar markets is characterised by volatile and deteriorating price trends, making diversification essential. In some countries the basic employment rights of sugar workers are violated on a routine basis, weakening the link between sugar exports and poverty reduction. Smallholder farmers, the vast majority of the world’s poor, are often denied a stake in the benefits of sugar trade. Inequalities in the distribution of land, access to credit, and marketing infrastructure mean that large commercial farms frequently dominate exports. This is the case for Brazil (just as it is for the EU). Against this backdrop, export agriculture is not a panacea for poverty, or a substitute for strategies to achieve a broad-based distribution of benefits from export activity. Governments in developing countries have a responsibility to adopt policies – including land and asset redistribution, respect for international standards on labour rights, and the prioritisation of smallholder agriculture - that can make sugar trade work for poor people.
The EU also has responsibilities. As a major producer and exporter of sugar, it needs to ensure that its policies do not undermine the efforts of poor people to improve their lives. We show in this paper that it has failed to meet this responsibility. Overproduction and surplus dumping are destabilising markets and driving down prices, with attendant consequences for smallholder farmers and the rural labourers that they employ. The current review of the CAP sugar regime provides an opportunity for Europe to bring its agriculture and trade policies into line with its rhetorical commitments to poverty reduction.
2 The EU in the global market Even by the standards of the CAP, the operations of the sugar regime are highly complex. However, it produces a simple result: high guaranteed prices, maintained through import tariffs, generate far more sugar than Europe consumes. Attempts to manage supply through quotas have failed in spectacular fashion. The upshot: huge surpluses are dumped on the world market, with the help of massive export subsidies. Price stability and high profits for the sugar industry at home are secured at the cost of lower and less stable prices abroad.
Dumping on the world, Oxfam Briefing Paper. March 2004 6
The international market During the colonial era, European settlers and European trading companies accumulated vast fortunes trading in sugar produced from cane. The global market changed in the early nineteenth century, when a British naval blockade prompted Napoleonic France to pursue self-sufficiency through sugar beet – a tradition continued under the CAP. Today, the international market for sugar remains a site of competition between sugar cane and sugar beet.
Sugar cane is a perennial grass grown in tropical areas, usually with a five-year cropping cycle. Beet sugar is a root crop, typically produced as part of an arable cycle. Cane sugar is traded either as raw or white sugar. Beet is traded solely as white sugar. EU beet accounts for around 13 per cent of global sugar production. The top five cane producers – India, Brazil, China, Thailand, and Mexico – account for another 42 per cent.1
EU beet, produced at high cost, is still a major export Cane-sugar producers enjoy significant advantages over their sugar-beet competitors. These are linked not just to lower costs of land and labour, but also to Europe’s disadvantage in access to one vital input: sunshine. Even with intensive chemical inputs, sugar-beet growers
Dumping on the world, Oxfam Briefing Paper. March 2004 7
produce less per hectare than cane producers. Direct comparisons of costs are difficult, but by international standards the EU is a high-cost producer, compared with major cane producers (Figure 1).
Despite this disadvantage, the EU is a major player on the international market (Figures 2 and 3). With exports of around 5 million tonnes a year, it is second only to Brazil in overall share of the world market. Europe is also the world’s largest exporter of refined sugar. Collectively, the top five exporters – Brazil, the EU, Thailand, Australia, and Cuba – account for around half of world exports.
World prices are low, volatile, and falling In contrast to other agricultural commodities, a relatively large share of sugar output – about one quarter of the total – is traded internationally. This means that the viability of many sugar industries is strongly influenced by world market conditions. Sugar exporters face two things in common with primary-commodity exporters in tropical products such coffee and cocoa: namely, deteriorating prices and a high degree of price volatility. World sugar prices have historically been characterised by short, sharp price rises, followed by long periods of low prices.
The past two decades have been one of the longest such periods on record. Since the mid-1990s, the value of sugar trade has remained relatively constant at around $11bn,2 but the volume of exports has increased by 75 per cent. With production outstripping consumption and stocks rising, prices have gradually declined – albeit on a wildly fluctuating trend. Sugar exporters have been forced to increase the volume of their exports merely to stand still in terms of foreign-exchange earnings. Expanding exports in turn add to the downward
Dumping on the world, Oxfam Briefing Paper. March 2004 8
pressure on markets, reinforcing a vicious circle of over-production and low prices.
Price projections suggest a bleak picture for future. Current international prices of around $160/tonne are already below production costs for most major producers. On present trends, average prices for 2010-15 could be as much as 25 per cent lower than the average for the second half of the 1990s.3
Several factors combine to explain the adverse price trends in world markets. On the supply side, the dramatic entry of Brazil into the global market during the 1990s was a major factor in dampening prices. More broadly, supply from developing countries tends to be unresponsive to changes in world prices, partly because of the perennial nature of sugar cane – and partly because of the long-term nature of investments in sugar processing. On the demand side, export growth has been affected by the growth of markets for alternative sweetener products. Northern protectionism has produced supply-and-demand effects. Subsidies have enabled the EU to expand exports, while most industrialised countries restrict imports through high tariffs. The consequence (Figure 4) is a widening gap between industrialised-country demand and world supply.
Price volatility is exacerbated by the concentration of exports on a small number of suppliers, and by policies – such as those in the EU – which insulate producers in industrialised countries from world markets. Agricultural support systems enable the EU to produce and market a large export surplus, regardless of trends in market prices. This has the effect of displacing the costs of adjusting to these trends on to other producers.
Dumping on the world, Oxfam Briefing Paper. March 2004 9
The EU sugar regime in operation All major sugar producers provide support to the sector, including those in developing countries. Most see protection as a legitimate response to distorted and depressed international prices. But judged by the level of support and subsidised disruption of international markets, the EU is in a league of its own. According to the OECD, the total cost of supporting EU sugar amounts to half of the value of production. 4 Among other major producers, only the USA can rival the EU when it comes to sugar subsidies.
In the early years of the CAP, the aim was to achieve self-sufficiency in sugar and to protect the incomes of producers. Part of that mission has been achieved. Protection has been extremely effective in insulating EU farmers and processors from low prices and the vagaries of the world market. But the domestic gains have been unequally shared – and the external costs have been high.
The ‘three legs’ of the CAP sugar regime In simplified terms, the CAP sugar regime rests on three legs: guaranteed prices, import protection, and export subsidies.
Guaranteed prices are applied to a quota of sugar that is determined each year by the EU Commission. In recent years, quotas have been set at around 14 million tonnes. CAP quotas were designed originally to ensure self-sufficiency, building on the principle established by Napoleon. But they evolved to provide price support for a volume of output far in excess of EU consumption. There is a structural surplus of around 1.5 million tonnes now built into the quota system, making this one important source of the EU surplus. The domestic guaranteed price is usually some three or four times above world prices. EU prices fluctuate in dollar terms but are stable in euro terms, providing a haven of stability in a volatile world market (Figure 5). Currently, the guaranteed price paid to sugar processors is around €632/tonne for white sugar, compared with a world market price of €157 tonne.5
Dumping on the world, Oxfam Briefing Paper. March 2004 10
Import restrictions are the counterpart to high guaranteed prices. Even with world prices for sugar locked at very low levels, it is impossible for other exporters to enter the EU market. In addition to a fixed tariff, the EU deploys a ‘special safeguard’ that increases as world prices fall, thereby creating a watertight system of protection6 (Figure 6). Current import duties create a tariff equivalent to around 324 per cent.
Export subsidies are the obverse of import tariffs. The surplus built into the guaranteed price quota and preferential imports (see below) has to be kept off the domestic market, otherwise it would force down guaranteed prices. Europe’s preferred solution is to dump the surplus on world markets. Export subsidies paid to processors and traders bridge the wide gap between domestic and world prices. At present, the EU pays around €525/tonne in export subsidies on quota sugar (Figure 6). In other words, every €1 in export sales generated by sugar costs the EU €3.30 in subsidies. Total export refunds from the EU budget amounted to €1.3bn in 2002. 7
Dumping on the world, Oxfam Briefing Paper. March 2004 11
This tripartite system of protection explains the cost structure of sugar support under the CAP. Consumer transfers account for the bulk of support, reflecting the gap between EU guaranteed prices and world prices. The EU Court of Auditors estimated the cost of this price difference to consumers at €6.5bn in 2001.8 However, world prices cannot be considered a fully objective indicator, because they are so heavily distorted, not least by policies in the EU. Taxpayers pick up part of the bill in the form of budget payments for export subsidies and some other interventions. Direct budget costs amounted to €1.4bn in 2002.9 Total costs therefore amount to around €8bn, or €64 for every family in the EU.
‘Non-quota’ sugar and trade preferences The complexity of the sugar regime derives from two arrangements, both of which are at the centre of controversy at the WTO: (1) provisions for dealing with sugar produced above the quota ceiling and (2) preferential trade agreements.
Non-quota sugar can be produced without limit. Because the guaranteed price for quota sugar produces such high margins (see below), it is profitable for growers and processors to produce ‘non-quota’ sugar. In effect, subsidies on quota sugar ‘spill over’ into non-quota sugar, creating a hidden cross-subsidy. Non-quota sugar used
Dumping on the world, Oxfam Briefing Paper. March 2004 12
to be of marginal importance. Now between 2-3 million tonnes is produced in a typical year. Although it is the product of subsidies, non-quota sugar is not eligible for price support. Nor can it be marketed domestically. Under EU rules, non-quota sugar must be stored or sold without export subsidies on the international market – hence the EU Commission’s claim that exports are non-subsidised. Non-quota sugar production has expanded rapidly. In 2002 it represented one-quarter of total production – twice the level in 1995 – and around half of total exports (though the proportions vary from year to year).10
Preferential trade arrangements give the CAP sugar regime its unique character, making the EU the world’s second-largest importer, as well as a major exporter. Under the Sugar Protocol, an arrangement with the African, Caribbean, and Pacific (ACP) countries, the EU imports up to 1.6 million tonnes of sugar at guaranteed prices on a duty-free basis.11 Broadly similar arrangements have been extended to least developed countries under the Everything But Arms (EBA) initiative (which is considered in more detail below), albeit for small amounts of sugar. Preferential imports from the Balkans have also increased in recent years.12
The EU ‘sugar balance sheet’ The EU likes to claim that the sugar regime is broadly in balance, and that there is no structural surplus. That claim is not consonant with the facts.
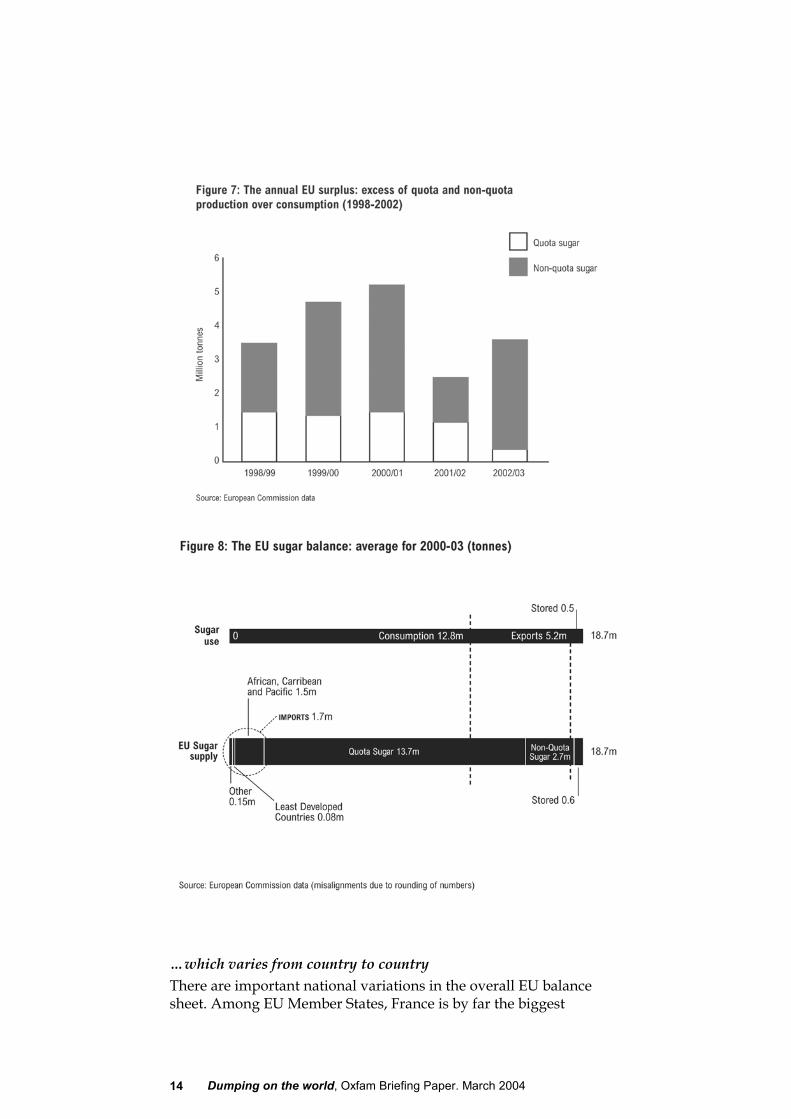
A built-in surplus… For the EU 15, sugar consumption averages around 12.8 million tonnes, while production ranges between 16 and 19 million tonnes.13 The surplus of domestic production over consumption varies from year to year, as does the distribution of that surplus between quota and non-quota sugar (Figure 7). In addition to sugar manufactured from domestically harvested beet, a further 1.6 million tonnes is manufactured from raw cane sugar imported from the ACP. The regime ensures that production that exceeds consumption levels is exported. Once again, the overall size of the export surplus varies with the level of non-quota sugar production. The balance sheet for the marketing years 2001 to 2003 shows that the regime produced on average a structural surplus slightly in excess of 5 million tonnes (Figure 8).
Dumping on the world, Oxfam Briefing Paper. March 2004 13
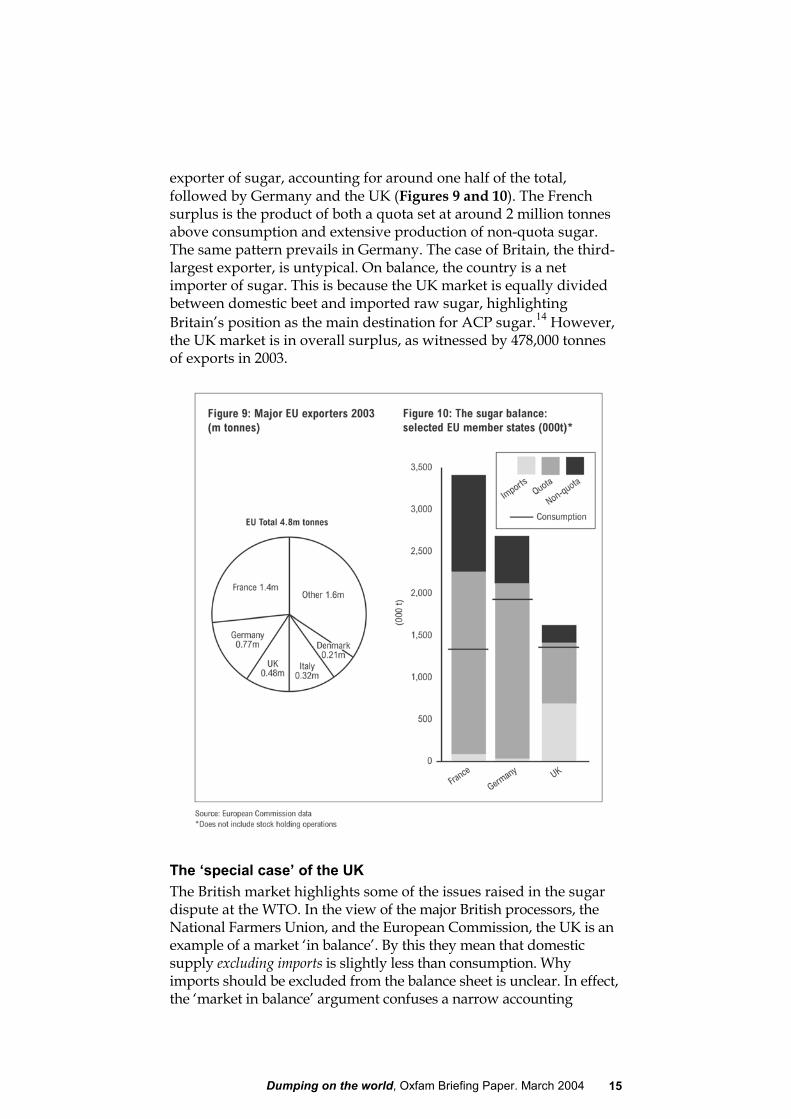
…which varies from country to country There are important national variations in the overall EU balance sheet. Among EU Member States, France is by far the biggest
Dumping on the world, Oxfam Briefing Paper. March 2004 14
exporter of sugar, accounting for around one half of the total, followed by Germany and the UK (Figures 9 and 10). The French surplus is the product of both a quota set at around 2 million tonnes above consumption and extensive production of non-quota sugar. The same pattern prevails in Germany. The case of Britain, the third-largest exporter, is untypical. On balance, the country is a net importer of sugar. This is because the UK market is equally divided between domestic beet and imported raw sugar, highlighting Britain’s position as the main destination for ACP sugar.14 However, the UK market is in overall surplus, as witnessed by 478,000 tonnes of exports in 2003.
The ‘special case’ of the UK The British market highlights some of the issues raised in the sugar dispute at the WTO. In the view of the major British processors, the National Farmers Union, and the European Commission, the UK is an example of a market ‘in balance’. By this they mean that domestic supply excluding imports is slightly less than consumption. Why imports should be excluded from the balance sheet is unclear. In effect, the ‘market in balance’ argument confuses a narrow accounting
Dumping on the world, Oxfam Briefing Paper. March 2004 15
definition of trade flows with real market activity. Britain may be a net importer, but it is also the EU’s third largest exporter. These exports are the product of the direct and indirect subsidies at the centre of the trade dispute at the WTO.
When a subsidy is not a subsidy Does the EU subsidise sugar exports? That apparently simple question is at the centre of a controversial trade dispute at the WTO, the outcome of which will have a major bearing on the debate about CAP reform and the future of the Doha development round.
Briefly summarised, the charge brought against the EU at the WTO by Brazil, Thailand, and Australia is that it ‘cross-subsidises’ exports of non-quota sugar, indirectly subsidises exports of quota sugar, and directly subsidises exports of a further amount equivalent to ACP imports.
The EU in denial Europe has responded with righteous indignation. Pascal Lamy, the EU Trade Commissioner, has condemned the WTO case as ‘nothing less than a direct attack on the EU’s trade preferences for developing countries’.15 The implication here is that preferential market access is contingent on the export of a volume of sugar equivalent to that imported – and that countries with preferential access are thereby threatened by the actions of Brazil and its co-complainants. The EU further claims that its sugar-export regime is consistent with a ‘waiver’ from WTO rules, agreed during the last round of trade negotiations, and with wider international trade rules.16 On the economics of the case, the EU is adamant that sugar is a ‘non-subsidising’ and ‘self-financing’ export regime.
None of these arguments withstands scrutiny (see Box 1). The government of Brazil has made it clear that the WTO case is a challenge not to the preferential import regime for sugar, but to the system of export subsidies.17 Europe could accommodate preferential imports and reduce exports by cutting the quota for EU producers. And, contrary to EU claims, its WTO ‘waiver’ does not incorporate a right to re-export an amount equivalent to ACP imports.
Assertions to the effect that the EU is a non-subsidising exporter are based on economic sophistry. The sheer complexity of the CAP sugar regime has enabled the EU Commission to create a fog of statistics, using opaque budget arrangements to obscure what are self-evidently export subsidies in all but name. In the absence of such subsidies, Europe would be a major net importer of sugar, not the world’s second-largest exporter. As the EU’s own Court of Auditors has recorded: ‘EU sugar is clearly not competitive on the world
Dumping on the world, Oxfam Briefing Paper. March 2004 16
market. Subsidies of the order of 75 per cent of the intervention price are currently needed to enable the quota surplus to be sold.’18
Box 1: Defending the indefensible – the EU in the dock at the WTO In 2002 the EU sugar regime was challenged at the WTO. Three countries – Brazil, Australia, and Thailand – have taken dispute-settlement action, claiming that EU export subsidies damage their sugar sectors. All WTO disputes raise complex legal and economic issues. This case is no different. But behind the complexity, the question at stake is whether or not the EU subsidises sugar exports. In its defence, the European Commission argues that exports under the sugar regime are non-subsidised.
Three claims underpin the defence, each of them severely lacking in credibility.
Claim 1: ‘Quota exports are self-financing’. The EU claims that the 1.2 million tonnes in quota exports are non-subsidised, because they are financed by the proceeds of the levy imposed on growers and processors, rather than by a payment from government. In fact, the levy represents the diversion of part of the consumer subsidy to processors into an export subsidy. The WTO Agreement on Agriculture explicitly recognises that export subsidies can take the form of non-budget transfers. Under Article 9 of the AoA, export subsidies include the following: ‘payments on the export of an agricultural product that are financed by virtue of a government action, whether or not a charge on the public account is involved, including payments that are financed from the proceeds of a levy’.19
Claim 2: ‘The EU has the right to subsidise the re-export of an amount equivalent to ACP imports’. According to the EU, this right is enshrined in a 2002 WTO waiver, allowing it to maintain preferential trade with the ACP countries. The EU cites the waiver as a justification for using export subsidies on 1.6 million tonnes. These subsidies are excluded from EU reports to the WTO and from subsidy-reduction commitments, ostensibly on the grounds that they are part of its development policy. Brazil has not contested the EU’s right to maintain preferential imports, but challenges its right to re-export20 - and rightly so. The WTO waiver allows the EU to import sugar on preferential terms, not to export on subsidised terms. Moreover, the EU does not ring-fence preferential sugar imports. Rather, it refines the imported raw sugar and treats the resulting white sugar as part of its domestic surplus.
Claim 3: ‘Non-quota sugar is not subsidised’. Brazil and Australia claim that non-quota sugar is exported at prices below costs of production, through a system of cross-subsidies that is incompatible with WTO rules.21 The claim is fully justified. EU sugar growers and processors are able to export non-quota sugar without direct subsidies for only one reason: they are cross-subsidised. High returns from subsidies on quota sugar ‘spill over’ into non-quota sugar. In effect, losses on the latter are financed by high profits on the former.22 Support prices for quota sugar make it possible for producers to cover their fixed costs, as long as world prices cover their marginal costs.23 Perhaps the most damning indictment of the EU’s defence comes from the EU’s own Court of Auditors. In a 2001 report the Court commented: ‘Production in excess of quotas…can be sold profitably at world market prices because the prices obtained for sales of quota sugar are sufficient to cover all fixed costs of the processing companies.’ The EU case has been further weakened by a precedent set at the WTO in a dispute involving the Canadian dairy sector. In this case, the dispute panel
Dumping on the world, Oxfam Briefing Paper. March 2004 17
found that domestic support applied to products in surplus had the same effects as export subsidies. To cite the panel’s findings: ‘We consider that the distinction between domestic support and export subsidy disciplines would be eroded if WTO members were entitled to use domestic support without limit to provide support for exports.’24 In other words, WTO rules would be diminished in their (already limited) effectiveness if the EU’s interpretation were to hold. On the substance of the argument that the EU exports non-quota sugar at prices below average costs of production, there is no credible defence. Current export prices are around one quarter of average production costs, pointing to an indirect subsidy that we estimate to be €833m, or $1bn (see text).
How the EU dumps sugar Reduced to its essentials, the CAP sugar regime subsidises exports through two intersecting channels: budget support and consumer support for non-quota sugar.
Budget support. The CAP budget for 2002 allocates €1.3bn to export subsidies. Taxpayers pay around €800-900m of this amount to cover the cost of exporting 1.6 million tonnes,25 said by the EU to be equivalent to ACP imports. The EU does not report these transfers as subsidies, claiming that they are part of its development policy. The balance of €500m is financed by a tax on the guaranteed price paid for quota sugar, currently up to a ceiling of 1.2 million tonnes. Processors maintain that the tax means that industry covers the cost of financing exports – hence the ‘self-financing’ claim. Back in the real world, it is consumers who pay. In all but name, the levy is a tax on consumer transfers to the processing industry. It has the effect of converting part of the overall transfer into an export subsidy.
Consumer support for non-quota sugar exports. An average of 2.7m tonnes of non-quota sugar is exported annually. According to the EU, these exports are non-subsidised. Viewed through the prism of EU budgeting arrangements, this is technically true: as explained above, non-quota sugar has to be stored or exported at world prices. However, this sugar can be produced and exported only because of the ‘cross-subsidies’ described above.
One way of assessing the EU’s claim to non-subsidising export credentials is to apply the same WTO criteria for measuring dumping that the EU itself applies when investigating developing-country export practices. The WTO defines dumping as sale in export markets at prices below normal value. In cases where prices are distorted by government interventions, as is the case with EU sugar, normal value can be constructed by reference to cost of production.26 On this definition, dumping is said to occur when export prices are below the cost of production.
We have used this definition to estimate the scale of dumping by the EU in non-quota sugar exports. Average costs of production in the
Dumping on the world, Oxfam Briefing Paper. March 2004 18
major exporters of the EU are currently around four times world price levels, or 25 cents/pound, compared with world prices of 8 cents/pound (see Figure 2). This translates into a price gap and implicit export subsidy of $374/tonne. Over the past three marketing years, non-quota exports have averaged 2.7m tonnes. Multiplying this volume by the implicit export subsidy produces a figure of $1bn. This can be taken as an approximation of the EU’s unreported subsidised dumping programme, which is now at the centre of the WTO dispute with Brazil and other countries at the WTO. The hidden $1bn in EU dumping subsidies is paid for by European consumers. Processing companies gain by virtue of the fact that the subsidies facilitate exports that would not otherwise be possible.
3 Reaping the subsidy harvest: who benefits from the sugar regime? The CAP sugar system imposes high costs on European taxpayers and consumers. On the other side of the equation, it generates large benefits for the processing industry and big farmers. Stripped to its essential, the sugar regime is a system of corporate welfare through which powerful private interests capture the benefits of public policy. Within this system, some very small farmers in the EU arable sector also benefit. Supply management and guaranteed prices have kept many of them in business, even though the bulk of support goes to processors and large farmers. Part of the challenge of reform is to redistribute the benefits of CAP support towards smaller farmers and environmental policy objectives.
The corporate cartel Public policies in the sugar sector create a highly regulated market. The problem is that regulation sanctions what is effectively a corporate cartel, even though the cartel in question operates within the law. This is a managed market in which the EU stipulates how much should be produced, provides a guaranteed price, excludes competition, and finances the export of surpluses that would otherwise disrupt the sugar market. Taxpayers and consumers meet the cost. Corporate processors reap the benefits.
Corporate control in the sugar sector is rooted in the quota system. Processing firms are the gatekeepers to that system. They are allocated quotas by national governments and in turn they license growers to produce fixed amounts of beet at guaranteed prices.
Dumping on the world, Oxfam Briefing Paper. March 2004 19
Quota holders rule Control over quotas is highly concentrated.27 A mere five companies hold more than half of the total EU quota. In ten countries the entire quota is in the hands of just one or two companies. In Britain, British Sugar enjoys a monopoly over beet, and Tate and Lyle controls the market for cane sugar. Between them, the two firms account for around 90 per cent of the British sugar market. The French giant Beghin Say accounts for more than one-third of the French quota and half of the Italian quota. Sudzucker accounts for 40 per cent of the German quota. Danisco, the Danish food giant, effectively controls the sugar market in the Baltic region: it has a monopoly over the quota in Denmark, Sweden, and Finland. In Spain, the company Ebro Puleva accounts for 80 per cent of the national quota.
The big are getting bigger… Concentration of ownership is becoming more marked. During the 1990s the number of sugar processing and refining firms fell by one third, to 53. Big processors have been getting bigger and expanding their reach. Ownership structures have also become more interlinked, both horizontally (with firms holding stakes in other processors) and vertically (with beet growers controlling some major processors).28
Sudzucker graphically illustrates the trend towards monopoly.29 The Sudzucker Group dominates the European sugar market. Since 1996, it has increased sugar production from 3m tonnes to 4.7m tonnes, or to just under one quarter of total EU production. Group sales of sugar amounted to €3.3bn in 2002/03, generating profits of €397m.30 The average annual return to shareholders has been 12 per cent since 1988, far outperforming returns for the manufacturing sector.31 The company has expanded through a relentless process of acquisition. It operates more than 56 sugar-processing factories across Europe. This includes four factories in the Raffinerie Tirlemontoise (RT) group in Belgium (which holds three-quarters of the national quota holder), five factories in France through the Saint Louis Sucre group (the second-largest quota holder in France), three factories in the Agrana group in Austria (the biggest national quota holder), and 14 factories in Poland.32
…and beet growers are in on the act Vertical integration between processing firms and beet growers is another feature of the sugar sector. In Germany, the controlling stake in both Nordzucker and Sudzucker is held by co-operatives of sugar-beet growers.33 Beet producers have also purchased a controlling stake in Beghin Say.34 This concentration of economic power, both within the processing sector and between producer and corporate processing interests, has important political implications. Most
Dumping on the world, Oxfam Briefing Paper. March 2004 20
obviously, it creates a united front and unity of interest between the industry and growers in negotiations with governments.
Anti-competitive practices? The high level of concentration in ownership and limited competition has made the sugar sector a focal point for the attention of anti-competition authorities. Very little sugar is traded across borders, creating scope for monopoly pricing practices. Investigation by the EU’s Court of Auditors has uncovered evidence of large variations in prices across markets, giving rise to suspicions about price-fixing cartels.35
The general problem identified by EU competition authorities not that of formal price-fixing, which is illegal, but informal ‘gentlemen’s agreements’ aimed at artificially raising prices. To cite the conclusions of a 2002 Swedish Competition Authority report: ‘Firms in the sugar market are able to charge higher prices through so-called tacit collusion. The most important feature…is that firms can succeed in charging a price that far exceeds marginal cost, as long as other firms in the market do the same.’36
Less tacit arrangements have been identified. Some firms – including British Sugar and Tate and Lyle – have been fined in the past for abuses of competition. In 1998, The European Commission ruled that British Sugar was “the driving force” behind a four-year price fixing agreement (running from 1986-90) involving Tate and Lyle and two smaller companies. The aim of the agreement, in the Commission’s ruling was “the restriction of price competition in the industrial and retail sugar markets in Great Britain, which markets were already characterised by a tendency towards reduced competition due to the concentration of the market and high barriers to entry.”37 There is no suggestion on Oxfam’s part that such practices continue.
Collecting the benefits: British Sugar in operation Tacit collusion operates within the letter of the law, while violating the spirit of fair competition. But it produces a system that generates some of the most impressive profit margins in the EU manufacturing sector. Few are more impressive than those registered by British Sugar (see Box 2). In 2002/03, the company registered a profit margin of 25 per cent, with overall profits of £187m. In any other sector, such margins would lead to the entry of new investors and market competition between processors. In the case of sugar, governments maintain artificial barriers to entry through the quota system. For British Sugar’s major shareholders, the system is a mechanism for converting a tax on consumers into large profits. The biggest beneficiaries in the company are the family of the Canadian multi-billionaire Galen Weston. The family’s private investment trust owns 54 per cent of Associated British Foods, which is British Sugar’s
Dumping on the world, Oxfam Briefing Paper. March 2004 21
parent company. The family dividend on its British Sugar shares amounted to around £25m in 2003.
Few companies in the EU can match British Sugar’s margins. One exception is Ebro Puleva, which registered a profit margin of 24 per cent in 2004. As in Britain, a near monopoly over beet-sugar quotas generates handsome returns for major shareholders. One of the biggest shareholders in Ebro is the family of Hernandez Barreda, one of the wealthiest landowners in Spain.
Sweet dividends: CAP subsidies (and how to get them) The opaque nature of the support provided through the CAP sugar regime has one major advantage for the main beneficiaries: it makes it difficult either to identify them, or to establish how much they receive. European Union Member State governments actively collude in maintaining the smokescreen by refusing to disclose information on subsidy transfers. Despite this, it is possible to identify the most favoured recipients of CAP sugar subsidies.
Big beet growers do nicely… Although many small farmers benefit from the sugar regime, large-scale sugar farmers collect the biggest dividends. They receive a guaranteed, stable price for their harvest, fixed under a formula set by the European Commission. In contrast to the reformed cereals sector, support to sugar-beet farmers takes place through the price system, rather than through government payments: consumers foot the bill for supporting farm incomes through higher prices. Transfers are not registered in national budgets. Even so, there is no question that those producers least in need of support reap the biggest subsidy dividends.
Sugar beet is grown on around 230,000 holdings in the EU, usually alongside other crops, such as cereals, in rotation systems. There are large numbers of relatively poor beet growers, especially in southern Europe. But production is concentrated in Europe’s most prosperous agricultural regions. These include East Anglia and Lincolnshire in Britain, the Paris Basin in France, Lower Saxony and Rhineland in Germany, and southern Denmark. Holdings growing sugar beet are almost four times the average holding size for agriculture in the EU, and incomes on sugar-beet holdings are double the level of average farm incomes.38
In much of northern Europe, sugar beet is by far the most profitable arable crop. For example, margins on sugar beet in eastern England are almost double those on cereals such as wheat and barley.39 The
Dumping on the world, Oxfam Briefing Paper. March 2004 22
CAP support system underpins the profitability of large-scale beet growers. That support translates into around €1668 per hectare.40
…especially in the UK We have attempted to estimate the overall level of support for large farms in Norfolk, one of the centres of the UK sugar industry. There are 27 holdings greater than 500 hectares growing sugar as a break crop. The average area under sugar on these holdings amounts to 171 hectares.41 This suggests a level of support averaging around €285,228. Importantly, this represents only one part of the CAP subsidy entitlement. The same farms collect an estimated €304,000 in direct payments from the CAP budget through the Arable Area Payments Scheme.42
But nobody does it like the processors Impressive as the subsidised profits of large-scale beet growers may be, they pale into insignificance against the corporate welfare transfers directed towards the sugar-processing sector. Mention has already been made of the large margins achieved by British Sugar as a result of its beet monopoly in Britain. But processors also capture the benefits of taxpayer-financed subsidies, notably in their export activities.
Processors, or traders linked to them, can claim export subsidies on around 2.5 million tonnes of sugar, amounting to between €1.2 and €1.4bn annually. The current subsidy rate is around €525 per tonne. There is no public disclosure of the export subsidies claimed by individual companies. However, we have estimated the value of export subsidies paid to the EU’s six largest exporters by considering two variables: the size of national surpluses on quota sugar and the share of individual companies in the national quota. This enables us to establish an approximation for the volume of exports, which we then multiply by the unit value of current export subsidies. In the case of Tate and Lyle, which exports around 300,000 tonnes of processed cane sugar, we have based export estimates on market information.43
Box 2: The British Sugar benefit club When it comes to reaping the CAP sugar-subsidy harvest, few companies do it better than British Sugar. The company is the jewel in the crown of Associated British Foods (ABF), one of the largest food groups in the world.
With annual sales of £7bn, ABF has a controlling stake in the London-based luxury store Fortnum and Mason, extensive interests in food distribution, and control over a large range of food brands, including Ryvita and Twinings Tea.44 It is also a company with political connections in the UK. Its senior non-executive director is Lord MacGregor, a former Minister
Dumping on the world, Oxfam Briefing Paper. March 2004 23
for Agriculture with nine years’ service in Conservative government Cabinets.
British Sugar is a wholly owned subsidiary of ABF. It shares the UK market on a 50:50 basis with Tate and Lyle, but has a total monopoly on the beet quota for the British market. It contracts out quotas to around 7,000 farmers, mostly in Lincolnshire and East Anglia, and produces about 1.4 million tonnes of white sugar each year in six factories.45 Each week, British Sugar sells around 4 million packs of sugar under the brand name Silver Spoon. The company is also among the largest manufacturers of molasses and animal feeds in the UK, supplying more than 20,000 livestock farmers with high-energy animal feeds.
British Sugar achieves profit margins that dwarf the average levels registered not only in the food sector, but in manufacturing as a whole. In 2003, the company registered a profit of £187m on a turnover of £738m – a margin of 25.3 per cent.46 Over the past three years, the margin has consistently exceeded 20 per cent: around three times the average rate for the food and manufacturing sectors. To put British Sugar’s performance in its wider corporate context, the profit margin for the ABF group as a whole was under 8 per cent.
Who benefits from British Sugar’s performance? The most immediate winners are the shareholders of ABF. In 2002, British Sugar accounted for 15 per cent of ABF’s turnover and 37 per cent of overall profit. Within ABF, the biggest winners are the biggest shareholders.
The ABF group is currently the largest family-controlled company quoted on the London stock exchange.47 It is controlled by Wittington Investments, which holds a 54 per cent stake. Wittington Investments is in turn the private family holding company of the Canadian Weston family. Its executive director is Galen Weston, the second-richest person in Canada, who ranks 43rd on the Forbes list of the world’s richest people.
We calculate that in 2003 the underlying element of the dividend paid by Associated British Foods to the Weston family’s Wittington Investment trust and related to operating profits from its British Sugar subsidiary amounted to around £25m, or €38m in 2003.48
British Sugar itself attributes its high profit margins to market efficiency – and the company is widely regarded as being among Europe’s lowest-cost processors. But in the case of sugar, the absence of anything resembling a market makes ‘market efficiency’ a difficult claim to assess. The British government allocates the entire UK beet quota to British Sugar, and the EU dictates the price paid to beet farmers and the price at which British Sugar sells. Meanwhile, EU import barriers protect British Sugar and sugar-beet growers from competition not just from suppliers who operate at far lower costs – such as Brazil and Thailand – but also from African exporters such as Mozambique and Ethiopia.
In practice, British Sugar operates as State-protected private-sector monopoly in the sugar beet sector. The Weston family is among the prime beneficiaries of a system of corporate welfare paid for by EU consumers. Perhaps unsurprisingly, British Sugar is among the most vociferous advocates for a continuation of the current CAP sugar regime (see Part 4).
On our estimate, six firms collect export refunds valued at €819m (Figure 11).49 The league of export-subsidy collectors is headed by the
Dumping on the world, Oxfam Briefing Paper. March 2004 24
French company Beghin Say, which received around €184m in 2003. The German firm Sudzucker, the largest processor in Europe, collected an estimated €164m on behalf of the south German beet farmers that control the company. Tate and Lyle received around €157m on exports of around 300,000 tons.
We emphasise that these are estimates, based on our assessment of available market information. There is no suggestion on our part that these transfers are illegal: they are a standard part of the operation of the CAP sugar regime. That said, fundamental questions must be asked about the extent to which this form of public spending reflects EU public interest, rather than the private interests of the companies concerned and their shareholders. At the same time, the good-governance principles of openness and transparency point to a strong case for improved disclosure.
Subsidy supplements While Tate and Lyle is an exceptionally efficient collector of export subsidies, it is unable to match the profit margins achieved by its
Dumping on the world, Oxfam Briefing Paper. March 2004 25
beet-processing competitor, British Sugar. Through the CAP, the European taxpayer is there to lend a helping hand.
Under an arrangement introduced in 1986, cane refiners are given an ‘adjustment aid’. This was introduced in the 1980s to correct what was perceived as an imbalance between beet and cane refining margins. The system was reviewed and renewed in 2001. Under the current regime, the aid level is set at €29.20/tonne. Annual cost to taxpayers are around €41m.50 Tate and Lyle accounts for around €31m of this amount – a sum equivalent to around one third of the total profit on its UK cane-processing operations. It is difficult to think of another industry in which taxpayers account for such a consistently large share of operating profits.
Food processors involved in export trading also get in on the export-refund act, though on a more modest scale. Europe-based manufacturers of confectionery and other items with a high sugar content have to pay EU guaranteed prices for processed sugar, their main input. The Association of Chocolate, Biscuit and Confectionery Industries (CABISCO) of the EU, the industrial body representing firms in the sector, has long claimed that this disadvantages exporters, since they are often competing against firms that are buying sugar at lower prices.51 Compensation has been duly claimed – and duly provided through the CAP. Exporters of food containing processed sugar can claim export subsidies of around €200m a year, with taxpayers footing the bill.52 Once again, the identity of the recipients is not publicly disclosed, although it is known that Cadbury’s Schweppes figures prominently.
Box 3. The sweetest deal: the US sugar programme53 The EU is not the only major industrialised country to lavish support on the sugar sector. Like Europe, the United States protects its sugar producers and processors through price supports and a quota system.
Under the 2002 Farm Bill, the USA guarantees prices at around 18 cents per pound for raw cane sugar and 23 cents per pound for refined beet sugar. Imports are tightly restricted. There is a quota ceiling of 1.1m tonnes for raw sugar imports, divided between 40 countries. Tariffs on imports above quota are just under 100 per cent.
While the USA pursues agricultural trade-liberalisation overseas, its domestic sugar regime remains resolutely protectionist. Sugar was excluded from the recent free trade agreement with Australia. Similarly, the Central American Free Trade Agreement (CAFTA) only modestly increases sugar quotas by 1.2 per cent of US production, and tariff rates remain the same. According to the US Trade Representative, Robert Zoellick, the USA could absorb 300,000 more tons of sugar from the Central American countries without upsetting the internal market.
The US sugar-subsidy programme has adversely affected a number of different interests. Thousands of jobs have been lost in the sugar-related industries. As a result of inflated prices of sugar on the US market, it is
Dumping on the world, Oxfam Briefing Paper. March 2004 26
cheaper for producers of sugar-containing products to operate abroad. In Chicago, one of the largest candy producing cities in the USA and home to familiar candies like Tootsie Roll, factories have closed and jobs have been exported overseas. Far from protecting jobs, the sugar programme undermines employment. The US sugar regime protects fewer than 20,000 workers, of whom only 3,000 would likely loose their jobs were the US sugar programme to be reformed. American consumers and taxpayers also incur costs. The General Accounting Office estimates that the sugar programme costs US sugar users nearly $2bn a year in higher prices, money that is passed to refiners and growers.
Environmental costs do not figure on the financial balance sheet – but they are high. The Florida Everglades, one of the world’s largest wetland reserves, is threatened from pollutants introduced into the natural water system from sugar-cane production. Sugar-cane production is situated in the northern third of the Everglades’ three million acres. Natural water overflow from Lake Okeechobee, situated to the north of the sugar cane fields, feeds the Everglades to the south. As water passes through the sugar-cane plantations, it is contaminated with phosphorus and other chemicals, destroying plant and animal life, and disrupting the ecosystem.
Despite these costs, the sugar programme remains in place. The reason: the power of the sugar lobby. Campaign contributions from the sugar industry have totalled more than $20 million over the past decade. During the 2000 election, Flo-Sun, the largest of Florida’s sugar companies, contributed $780,750 in ‘soft money’, $164,650 in direct funds to political candidates, and $68,200 to political-action committees during the 2000 election cycle, and already over $200,000 for the 2004 election campaign. Flo-Sun and other large sugar corporations are the primary beneficiaries of the US sugar programme, not small producers.
Whatever their wider differences in trade policy, when it comes to sugar the EU and the USA have two things in common: the first is a willingness to subordinate public interest to private vested interest. The second is a disregard for the impact of domestic sugar policies on developing countries.
4 The impact on developing countries The unique role of the EU as a major importer and exporter of sugar has important implications for the impact of the CAP sugar regime on developing countries. Preferential access to EU markets at guaranteed prices creates benefits for some, although the benefits are not equally distributed. Other developing countries are excluded from the EU market by high tariffs and have to compete against subsidised European sugar in third markets.
The EU likes to cite its various preferential schemes as evidence of a commitment to poverty reduction. The reality is less impressive. In sugar, as in other agricultural sectors, EU generosity to poor countries has distinct limits.
Dumping on the world, Oxfam Briefing Paper. March 2004 27
Rival exporters: the cost of EU dumping The CAP insulates EU sugar growers and processors from global markets, reducing import demand and creating large export surpluses. These twin effects force down international prices. At the same time, protection of the EU market makes production decisions immune to changes in world prices. Price stability in the domestic market is achieved at the cost of transmitting price instability on to global markets.
The costs of dumping Rival exporters have to adjust both to the lower prices and to price instability caused by the CAP sugar regime, and to subsidised competition in third markets. Through its elaborate system of direct and indirect export subsidies, the EU reduces both the value and the volume of exports from its competitors.
Estimating the scale of the costs to developing-country exporters is difficult. Economic models designed to assess these costs vary in their results. However, one of the most widely used models predicts that the removal of distortions associated with the CAP sugar regime would increase international prices by 20-23 per cent, with sugar-cane growers expanding their market share.54 Long-run price changes would depend on dynamic supply and demand responses. Projecting these changes is a matter of educated guesswork. Much would depend on the price at which Brazil would increase exports to replace EU exports – a subject on which opinions are divided.
Brazil and Thailand What is clear is that the CAP costs rival exporters substantial amounts of foreign exchange. The largest costs are borne by Brazil and Thailand, two of the countries that have initiated dispute actions against the WTO. Using 2002 exports as a basis for calculation, and assuming that the CAP lowers the unit value of those exports by 23 per cent, we estimate the immediate losses associated with CAP-sponsored sugar dumping at $494m for Brazil and $151m for Thailand.
The EU often defends the CAP sugar regime by arguing that only major exporters such as Brazil and Thailand would benefit from its reform. This is a curious approach to international trade. Leaving aside the fact that Brazil and Thailand are (unlike the EU) efficient producers, they have legitimate development interests in the sugar trade. Both countries face balance-of-payments pressures, and (again unlike the EU) both have large rural populations living in poverty.
Applied more widely to the field of international trade, the EU’s approach to sugar trading would be deeply damaging. Citing the
Dumping on the world, Oxfam Briefing Paper. March 2004 28
same rationale, a country subsidising the export of, say, motor vehicles, might defend the practice on the grounds that only one trader – perhaps the EU – would capture the benefits of an end to such subsidies. Applied more widely, the EU’s position on sugar would lead rapidly to the collapse of multilateralism in world trade.
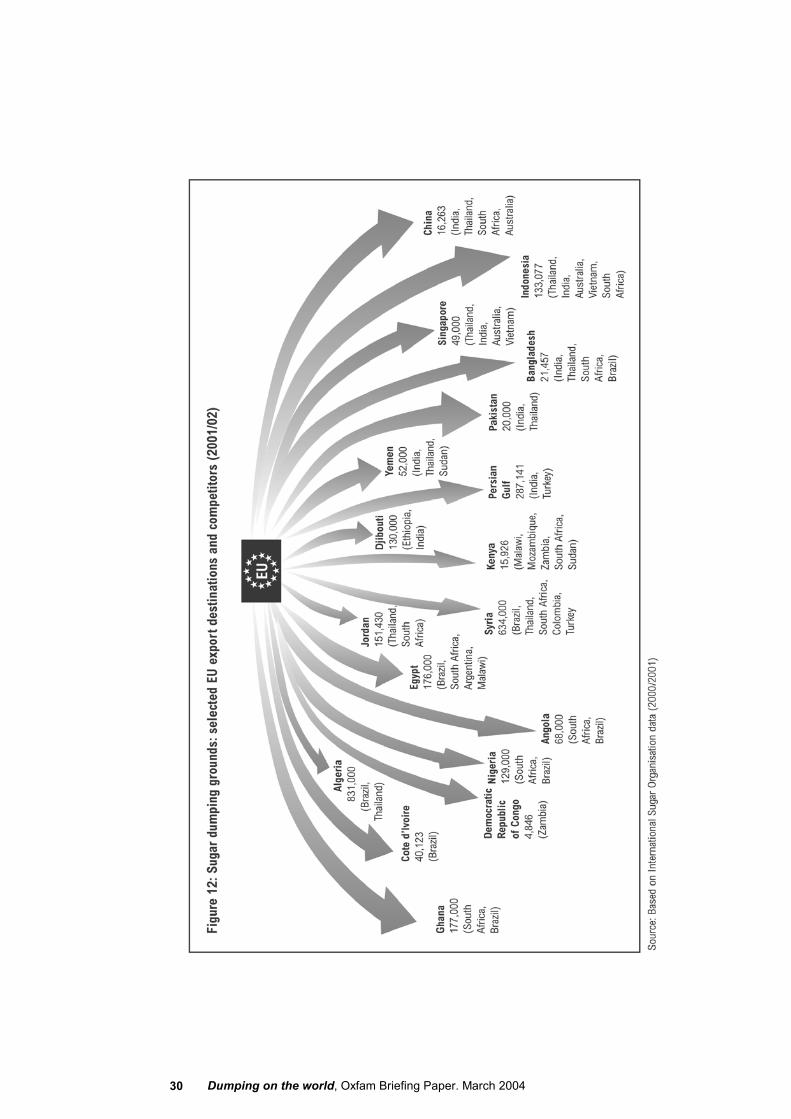
Worldwide export-subsidy distortions While Brazil and Thailand experience the biggest losses in absolute terms, the costs of EU sugar dumping are more widely dispersed. The EU is a major exporter to regional markets in the Middle East, Africa, South Asia, and, to a lesser degree, East Asia. This is highlighted in the map of EU sugar dumping in Figure 12. In many of these markets, subsidised European sugar deprives other exporters of market share:
South Africa faces subsidised competition from EU exports to Nigeria, Angola, Egypt, and Kenya.
��
��
��
India faces competition from the EU in Bangladesh, Indonesia, and Singapore.
A large group of exporters – including Brazil, Thailand, India, and South Africa – face subsidised competition from the EU in the Middle East.
Dumping on the world, Oxfam Briefing Paper. March 2004 29
Dumping on the world, Oxfam Briefing Paper. March 2004 30
Some regional exporters experience serious losses. Estimated losses for India amounted to $64m in 2002. Exports account for a relatively small share of India’s overall sugar production.55 Even so, these foreign-exchange losses are transmitted back to sugar farmers and labourers in the Uttar Pradesh and other sugar-producing States.
Reinforcing poverty in South Africa South Africa experiences losses comparable with those suffered by India – around $60m in 2002. Unlike India, however, the South African sugar industry depends heavily on exports. Around one-half of total production is sold on world markets. It follows that world market prices and export levels have an important bearing on conditions in the sugar sector.
There are around 51,000 small and medium-sized sugar growers and 2,000 large-scale estates producing in an arc stretching from the Eastern Cape province through Kwa Zulu Natal and Mpumlanaga. It is estimated that each medium-sized farm employs five full-time and ten seasonal workers. Overall, the sugar sector sustains around 250,000 full-time and 500,000 seasonal jobs.56
As in other countries, the relationship between sugar exports and poverty reduction in South Africa is complex. Historically, the sugar sector has been characterised by exploitative labour practices, inadequate protection, and low wages, with women workers suffering the worst conditions. However, new labour legislation introduced in 2003 has improved minimum-wage provision, and imposed more stringent requirements on employers in terms of contract protection and requirements for accommodation. The effectiveness of this legislation will inevitably be affected by the market conditions in which the South African sugar sector operates, including those created by the EU.57
Everything But Arms – or ‘everything but (sugar) farms’ The Everything But Arms (EBA) agreement was a unilateral trade concession from the EU to least developed countries. EU policy makers present the concession as a model for others to follow. Extravagant claims have been made about foreign-exchange gains. The reality of EBA implementation is less impressive – notably in the case of sugar.
Following intensive lobbying by the sugar-processing industry and big farm organisations, full liberalisation of sugar under the EBA was delayed. Duty-free access will not begin until 2009. In the interim, a small group of least developed countries can export duty-free up to a
Dumping on the world, Oxfam Briefing Paper. March 2004 31
quota limit. That limit is being increased by 15 per cent a year and is scheduled to reach 197,355 tonnes by 2009.58 In theory, import restrictions will be withdrawn after that date, providing least developed countries with duty-free access. In an extraordinary act of mean-mindedness, the EU chose to accommodate the increase in imports from least developed countries not by cutting back on domestic quotas, but by transferring quotas from the ACP. This was a case of robbing the poor to give to the very poor.
The EBA helps…. The importance of the EBA to some least developed countries should not be underestimated. Currently, there are ten countries with a total quota of just under 100,000 tonnes. Like the ACP countries, the least developed countries are able to sell sugar to the EU at a significant premium over world prices. That premium fluctuates with the size of the gap between EU guaranteed prices and world prices and (because the EU price is denominated in euros) the exchange rate between the euro and the US dollar. The decline in world prices and increase in the value of the euro against the dollar has increased the EBA price premium from around $271/tonne in 2001 to $474/tonne today.59
Assured access to the EU market has acted as a catalyst for domestic and foreign investment in the sugar sectors of some least developed countries. In Mozambique, the sugar sector is undergoing rapid rehabilitation, with major new investments in processing in Sofala and South Maputo Province. Cane production has increased from 368,000 in 1998 to 1.9 million tonnes in 2003.60 Since 2000, Mozambique has emerged as a net exporter, selling not just under preferential trade agreements with the EU and the USA, but also to regional markets such as Kenya and Mauritius, and in 2002 to China.
Ethiopia has followed a similar trajectory. It was a net importer through the 1990s when the sugar sector was stagnating, but new investment in processing plants has stimulated a sustained increase in output. In 1999 a new plant was opened in Finchaa, western Ethiopia, increasing national output by 50 per cent. Old factories located near to Addis Ababa at Wonji and Shoa have also been upgraded. In 2001, Ethiopia was given a small EBA quota, and the country has now emerged as a net exporter.61 Export capacity has increased to more than 70,000 tonnes a year, with Djibouti the main destination. The Ethiopian government sees sugar, and access to the EU market, as part of a wider strategy for diversifying and reducing dependence on coffee. The sugar sector also has the potential to generate important benefits for poverty reduction (see Box 4).
Dumping on the world, Oxfam Briefing Paper. March 2004 32
Box 4: Ethiopia: working towards diversification One of the poorest nations in the world, Ethiopia has been devastated in recent years by a collapse in prices for coffee, the country’s main source of foreign exchange. Sugar production is being developed as part of a wider strategy to diversify exports and create rural employment.
Some success has been achieved. Investment in one modern new plant and the rehabilitation of old plants has increased production. In 2001, Ethiopia became a net exporter. Expanded production has gone hand-in-hand with employment creation.
Located in the plains of the Awash valley about 100 miles east of the Ethiopian capital Addis Ababa, the Metahara sugar-processing plant is the biggest in the country. It produces 120,000 tonnes a year. Some 10,000 people are employed on the estate, and there are plans to develop new areas for cultivation by smallholder farmers. These plans are not without their problems. Pastoralists could see their grazing rights eroded, and greater sugar processing could pollute the Awash river. Government action is needed in both areas to avert damaging outcomes. But sugar can also produce benefits in terms of poverty reduction.
Bekele Telila, aged 33, is a migrant worker who has travelled up from the southern Wolayita Province. He works at Metahara for eight months a year as a cane cutter. This is an arduous and dangerous job, as evidenced by the scars on his fingers and shins. He is paid $45 a month. Viewed from Europe, this seems a paltry sum. But in a country with limited opportunities for income generation, it is a lifeline, providing desperately poor households with new opportunities. ‘All of my nine children go to school,’ says Bekel. ‘The money I earn in Metahara makes a massive difference, we can now buy books and basic goods for my family.’
Tanika, aged 26, is another worker on the estate. His father worked there as a cane cutter, and Tanika was educated at one of the estate’s primary schools. He also attended the estate’s high school. Currently he is working as a guard, with responsibility for protecting the cane from wild boar. He is provided with accommodation and earns slightly more than $1 a day, which he is using to pay for a training course on accountancy. He says: ‘Working as a cane guard has given me a chance to earn money and improve myself.’
The EBA has supported the development of Ethiopia’s sugar sector – up to a point. Today the country has an export quota amounting to 15,000 tonnes. The sugar is exported to Portugal, where it is refined. In 2003, the exports were worth about $20m. Access to the EU market at stable and remunerative prices has created incentives for investment. But export capacity has outstripped Ethiopia’s quota in the EU market. For 2002, the International Sugar Organisation estimates that Ethiopia exported 87,000 tonnes of raw sugar, mainly to Djibouti and Yemen.
An enlarged quota in the EU would boost foreign-exchange earnings, provide incentives for investment, and create employment. Current market access represents only 12 per cent of the capacity of the Metahara plant alone. The Metahara plant also produces large volumes of molasses, an ingredient in animal feed used in the EU livestock sector. However, it is unable to export to Europe because of high tariffs designed to protect domestic processors.
Dumping on the world, Oxfam Briefing Paper. March 2004 33
…but could do more Notwithstanding the importance of the EBA initiative in boosting investment in countries such as Mozambique and Ethiopia, sugar is a sector in which reality does not reflect EU rhetoric.
The EBA has to be viewed in relation to the needs of the least developed countries and the size of the EU market. From this perspective, the initiative appears modest in ambition and singularly lacking in achievement. Currently, the 49 least developed countries are entitled to export to Europe an amount equivalent to three days’ worth of EU consumption, or 1 per cent of the total market. By 2009, the quota will still represent less than one week’s worth of sugar consumption. For a group of countries characterised by chronic poverty, almost exclusive dependence on primary commodities, and acute balance-of-payments pressures, this would hardly appear to be a generous arrangement.
How the EBA is failing Ethiopia, Malawi, and Mozambique The limits to the EBA are starkly illustrated by the cases of Ethiopia and Mozambique, which are entitled to supply Europe with 15,248 tonnes and 10,116 tonnes respectively in 2003/04. This means that Ethiopia is permitted to supply the EU market with the equivalent of eight hours’ worth of sugar consumption. Mozambique’s quota represents the equivalent of around four hours of consumption. In other words, two of Africa’s poorest countries, both of which produce sugar more efficiently than the EU, have between them the right to supply Europe for one day.
Such facts highlight the limits of the EBA as a development policy. More than one third of the population in Mozambique and Ethiopia population survive on an income of less than $1 a day. Improved access to the EU market could provide the income that would help to lift people out of poverty, with attendant benefits for human development in terms of child survival, education, and nutrition. Yet the EU provides Mozambique and Ethiopia with a combined quota that is equivalent to the amount of sugar produced on 15 large farms in Norfolk, England – not a region that experiences rural deprivation on any scale.
When it comes to choosing between the sugar barons of East Anglia and the monopoly interests of the British Sugar corporation on the one side, and the development needs of two of Africa’s poorest countries on the other, the EU elects to support the former. It is difficult to imagine a starker contradiction between the rhetoric of development policy and the reality of trade policy.
Dumping on the world, Oxfam Briefing Paper. March 2004 34
Foreign-exchange losses For a number of least developed countries, quota restrictions translate into significant foreign-exchange losses. These losses are difficult to estimate. Exports to the EU provide least developed countries with far higher prices than they receive on world markets. However, for countries such as Mozambique and Malawi a significant share of exports is sold on preferential terms in regional markets, or to the USA. We have attempted to derive an estimate of the costs associated with EU trade restrictions by capturing the foreign-exchange gains that would accrue if exports at world market prices could be transferred to the European market on EBA terms.
In the case of Mozambique, new investment, rehabilitation of old plants, and improvements in infrastructure have led to a four-fold increase in sugar production since 2000 (Figure 13). Incentives created by the EBA have played an important role. Exports have also grown, far outstripping Mozambique’s quota in the EU market. The National Sugar Institute (NSI) projects overall exports to the international market at 82,000 tonnes – almost eight times the country’s quota in the EU market (Figure 14).
In theory, Mozambique could expand exports to the EU by more than 80,000 tonnes. In practice, it is prevented from doing so by quota restrictions. We estimate the cost of these restrictions at $38m for 2004. Or in other words, for every $1 provided through the EBA, Mozambique could gain another $8 with unrestricted access to the
Dumping on the world, Oxfam Briefing Paper. March 2004 35
EU market on preferential price terms.62 The losses incurred by Mozambique are equivalent to total government spending on rural development.
Losses for Malawi in 2004 are also large relative to the size of the industry. The country has the capacity to increase exports to the EU by around 68,000 tonnes in 2004.63 Market exclusion will deprive the country of $32m in foreign-exchange earnings, representing more than one third of total projected earnings from sugar. The losses are also very large in relation to government financing capacity. They are equivalent to around half of public expenditure on health services, for example. Behind these financial figures are real human costs. In Malawi, as in other LDC sugar exporters, the impact of international trade is transmitted back through local markets to vulnerable populations (see Box 5).
Box 5: Sugar and poverty in Malawi Malawi is one of the poorest countries in the world, with two thirds of the population living below the poverty line. Poverty is reinforced by an HIV/AIDS epidemic. Malawi has one of the highest infection rates in the world, and 850,000 orphans. The vast majority of the population live and work in rural areas – and agriculture holds the key to success in reducing poverty, improving access to health services, and extending educational opportunities.
Sugar is central to the Malawian economy, accounting for 5 per cent of GDP. Despite being landlocked, Malawi is among the most efficient and lowest-cost sugar producers in the world. It has preferential access to the EU and the US market, but is building an export capacity in excess of its preferential market quotas. The sector is still dominated by large estates, but there is an increasing emphasis on the part of government and the private sector on smallholder participation.
The Dwangwa Cane Growers Company illustrates the development of the smallholder sugar sector. Located in Nkhota Kota district in the north-east of the country, it is working with 268 cane growers, each with an average of three hectares under sugar. Current plans are to increase the number of farmers to 1,000 over the next four years. The constraint on development is access to mills and, by extension, the access of mills themselves to export markets.
Farmers in the Dwangwa Company sell their cane to mills owned by Illovo Sugar, a South African investor that is one of the largest sugar processors in southern Africa. Dwangwa assists farmers with the development of land, provides credit for inputs, and technical assistance. For smallholder farmers, the support comes at a cost. Loans are provided at the prevailing market rate (which is high in Malawi); cane growers bear the risks associated with fluctuating prices (including the risks of falling into unsustainable debt); and government taxes are high.
However, farmers interviewed by Oxfam emphasised the advantages of sugar in comparison with alternative crops. Cane can withstand bad weather conditions and requires less weeding. This in turn frees labour for work on household plots growing maize and rice, the main food staples. The seasonal calendar for labour allocation involves full-time work on sugar
Dumping on the world, Oxfam Briefing Paper. March 2004 36
cane from June to October, with labour transferred to work on maize and rice fields from November to March. Most farmers expressed the view that sugar improved household food-security by providing additional income without undermining food-staple production.
The incomes of farmers in the Dwangwa company range between $50 and $2,000 a year, depending on plot size and whether the plot is irrigated or rain-fed. In addition to this direct income, cane growers employ an average of two labourers per plot. Around 600 people are employed during peak periods by the Dwangwa company alone. The company also plays a number of important social roles, including the provision of low-cost health services, the construction and maintenance of three local schools, and boreholes for drinking water.
Experience on the ground in Nkhota Kota district refutes the argument that sugar exports are bad for poverty reduction. Mr P. Mwambene, a 52-year-old farmer in the Dwangwa Cane Company, purchased a small plot in the early 1980, on which he continues to grow sugar. These are his words:
‘Life has changed since I started growing cane. I have managed to build three houses with iron sheets, I own a motor cycle, I have managed to educate two of my children, and I also support my parents.’
Like other cane farmers, Mr Mwambene and his family are directly affected by world prices for sugar, since these are transmitted back to him by the sugar-processing companies. ‘When the price of sugar goes down, it affects the price we get for our cane,’ he comments, adding: ‘This is the biggest problem we face, and I wish it was resolved.’
The Dwangwa Company is planning to expand production from 100,000 tonnes to 300,000 tonnes over the next three years. Europe could support the company by expanding Malawi’s access under the EBA. It has an opportunity to provide this support through the reform of the CAP sugar regime by allowing more farmers like Mr Mwambene to supply European consumers, while reducing the quotas paid to the EU’s wealthiest sugar-beet growers and processors.
Annual losses have increased over time as a result of two factors. First, all three countries have increased their export capacity, so that the costs of quota restrictions are rising. Second, the decline in world prices and a parallel decline in the value of the dollar against the euro have increased the price premium in the EU market, and hence the costs of exclusion from that market. Cumulative losses for Mozambique, Ethiopia, and Malawi amount to $238m since the start of the EBA in 2001 (Figure 15).
Dumping on the world, Oxfam Briefing Paper. March 2004 37
Some provisos must be attached to these figures. These losses reflect what would happen if countries had the right to export sugar to the EU without restriction on current EBA terms. The proviso is important, because if EU prices were to fall below a level at which least developed countries could profitably export, supply would decline. As noted above, any assessment of cost is also highly sensitive to international exchange rates.
Other factors could be cited to suggest that we seriously under-estimate the costs of EBA restrictions. Our figures take into account only the static foreign-exchange costs at current export levels. But expanded market access could be expected to create dynamic new incentives for investment, which in turn would be expected to increase supply and enhance competitiveness. What is unambiguously clear is that a growing number of least developed countries have a capacity to increase exports to the EU. Projections by the International Sugar Organisation and the European Commission put export capacity in least developed countries at between 0.9m tonnes and 2.7 million tonnes by 2008/09.64 It should be emphasised that these projections are based on largely speculative assumptions about supply capacity, changes in prices, and other factors.
Dumping on the world, Oxfam Briefing Paper. March 2004 38
The African, Caribbean, and Pacific countries Countries in the ACP group linked to the EU through the Sugar Protocol are at the apex of Europe’s system of preferences. The future of this arrangement will have important implications for the viability of the sugar sectors in the countries concerned.
Under the Sugar Protocol and an associated agreement,65 17 ACP countries export 1.6 million tonnes of sugar to the EU. The ACP Sugar Protocol group includes four least developed countries: Malawi, Mozambique, Tanzania, and Madagascar. The revenue that they earn is a function of the price they get in the EU, which is usually two or three times world market prices, and the level of access.
ACP quotas are unequally distributed. Mauritius is the country that benefits most from the Sugar Protocol. It accounts for one third of the total quota, while Fiji and Guyana account for another quarter between them. The sugar industries in several ACP countries depend heavily on access to EU markets. Exports to the EU account for around 60 per cent of production for Fiji, Guyana, and a number of Caribbean islands, and for more than 90 per cent for Mauritius. In each of these cases, costs of production are significantly above current world market price levels, and more than double those of the most efficient ACP suppliers (such as Swaziland, Zambia, and Malawi).
Because prices received by ACP suppliers are linked to EU guaranteed prices, reform of the CAP has the potential to cause adjustment costs. Lower EU prices would be transmitted directly to ACP suppliers. Unlike EU sugar growers, who are guaranteed compensation in the event of falling prices, ACP countries enjoy no such automatic entitlement. This raises the spectre of serious adjustment costs. In the case of Guyana, where sugar accounts for more than 20 per cent of export earnings and 7 per cent of employment, lower prices could result in severe social and economic damage.66 The same is true for Fiji and Mauritius.
Within the ACP group, some countries are more vulnerable than others. Several Caribbean islands are by international standards exceptionally high-cost producers – and most would face acute difficulty in adjusting even to small reductions in EU prices. At the other extreme, countries like Zambia, Malawi, and Swaziland are among the lowest-cost producers in the world. Between these extremes, the major ACP quota holders Mauritius, Guyana, and Fiji, are reducing costs by restructuring their sugar industries; but an early transition to a lower price regime would again impose severe adjustment costs. Given that EU guaranteed prices are almost certain
Dumping on the world, Oxfam Briefing Paper. March 2004 39
to fall over the next decade, managing the transition to a lower EU price regime is an urgent priority both for the ACP and for the EU.
The ACP countries themselves are strong advocates of a continuation of a CAP regime that maintains high prices in the EU.67 Their governments cite the importance of sugar to a number of small island States and land-locked countries, claiming that some 300,000 livelihoods are at stake. In addition to the social and economic importance of sugar, the crop also has positive environmental benefits in providing permanent soil cover and preventing soil erosion on vulnerable hillsides.
But while the threats posed by CAP sugar reform are real, there are limits to the system of benefits provided through the Sugar Protocol. First, least developed countries are severely under-represented in the ACP group. To take one example, Malawi’s quota is 5 per cent of that for Mauritius, even though it is a far poorer country. Second, the indefinite nature of the Sugar Protocol has arguably engendered a long-run dependence on sugar, undermining incentives for diversification.
Finally, the Sugar Protocol is an extremely inefficient mechanism for transferring development finance. ACP countries currently receive a premium of around €433m a year by exporting to the EU rather than on the world market. On the other side of the balance sheet, EU taxpayers spend €800m subsidising the export of an amount of sugar equivalent to ACP imports. Clearly, the ACP countries cannot be held responsible for the idiosyncrasies of EU budget arrangements. Even so, it would be hard to design a less efficient mechanism for transferring development finance.
The inefficiency is built into the system. For reasons explained earlier, the EU insists on its right to re-export an amount of sugar equivalent to imports from the ACP countries. The export imperative is a product of the fact that the EU is in surplus. But the end-result is that the EU maintains the Sugar Protocol by spending €800m in export subsidies. This means that European taxpayers spend €2 on export subsidies for the European taxpayer for every €1 delivered to the ACP through the Sugar Protocol.
5 Moving towards reform: threats and opportunities The EU sugar regime is unlikely to survive in its current form. External pressures at the WTO, wider reform of the CAP, and enlargement of the EU are all creating pressures for change. While the sugar sector has been immune to earlier rounds of CAP reform
Dumping on the world, Oxfam Briefing Paper. March 2004 40
and emerged from the last round of international trade negotiations unscathed, there is now a near universal consensus that the current regime is unsustainable.
That is where the consensus ends. Consultations over the direction and pace of reform have revealed deep differences not just between Member States, but also between developing countries. The fault-line between countries with and without preferences has grown larger. Meanwhile, the prospect of reform has acted as a catalyst for an unprecedented corporate lobbying exercise, led by the sugar-processing industry and beet farmers.
The challenge of reform is to address four interlocking problems:
ending direct and indirect subsidies for export dumping; ��
��
��
��
��
��
��
��
expanding market access for least developed countries to meet poverty-reduction goals;
protecting the market position of ACP suppliers and compensating for adjustment costs;
promoting a socially and environmentally sustainable sugar sector in the EU.
The options – and the protagonists The European Commission has completed an extended assessment of various reform options. Broadly, these divide into four options, briefly summarised as follows:
Option 1: Status quo. Under this option the market would still be regulated, with production quotas adjusted annually in response to the level of imports. Preferential imports would increase under the EBA, with duty-free access commencing in 2009. Guaranteed prices would fall to reflect any cuts in tariffs agreed by the EU in the WTO negotiations.
Option 2: Fixed quotas. Production quotas would be reduced, but LDCs would be granted preferential quotas instead of unrestricted market access. Prices would remain at relatively high levels, declining by 10-15 per cent.
Option 3: Price fall. Quotas would be abandoned, and the market would be regulated by price. However, tariff barriers would continue to exclude imports from non-preferential trade partners. Guaranteed prices would fall by one-third – to €450/tonne – to balance supply and demand.
Option 4: Full liberalisation. This would entail the abandonment of the entire regime. Markets would be opened to international competition, and prices would fall to world market levels. ACP
Dumping on the world, Oxfam Briefing Paper. March 2004 41
and LDC suppliers would be forced out of the EU market by low-cost suppliers such as Brazil, Thailand, and Australia.
Options 1 and 4 have no political backers in the EU and may therefore be safely discounted, whatever their respective merits and demerits. The real debate battleground is over which variants of the other two options will be adopted.
Option 3 is favoured by Britain and, according to some accounts, by the European Commission. It would involve narrowing, though not eliminating, the gap between EU-guaranteed prices and world prices. Growers would be compensated by direct payments ‘decoupled’ from production, moving sugar in the direction of the reformed cereals sector.
Option 2 is favoured by an unlikely coalition of forces. Predictably, the French government, with its acute sensitivity to vested interests in agriculture, is strongly opposed to the price-cutting option. Less predictably, the least developed countries have expressed a strong preference for a continuation of quotas, even though this would involve surrendering duty-free access under the EBA. The reason: deep cuts in EU prices would make it unprofitable for many LDCs to export to the EU. However, one of the conditions for LDC support is a major increase in quotas in return for surrendering duty-free access. The ACP group supports fixed quotas for broadly the same reason as the LDCs support them: that is, suppliers have an obvious interest in minimising guaranteed price cuts.
The other confederates in the quota-option camp are the corporate sector and organisations representing the interests of sugar-beet growers. The Confederation of International Sugar Beet Growers is a joint partner in the CIBE campaign – and a strong advocate of high prices maintained through quotas. Sugar processors have an obvious interest in retaining a quota-based regime that generates the lucrative profits described in Part 3 of this paper, and beet growers have a parallel interest in restricting competition from cane imports. This shared interest has generated a major lobbying campaign intended to influence governments and public opinion.
Corporate lobbying At the centre of the campaign is the Committee of European Sugar Manufacturers (or CEFS, to use its French acronym). This is the industrial body representing the major processors such as Sudzucker, British Sugar, and Beghin Say. According to CEFS, a quota-based system is vital in order to maintain ‘the European model based on family farms and compliance with high social and environmental standards’.68 Dire warnings have been issued about the threat posed to EU farmers and ACP/LDC by low-cost exporters such as Brazil.69
Dumping on the world, Oxfam Briefing Paper. March 2004 42
Various national campaigns have been launched to sway public opinion and government decision-making in key Member States. Perhaps the largest and best financed is the ‘Save our Sugar’ campaign being run in Britain by British Sugar and the National Farmers’ Union.70 The claims advanced in the campaign are based on selective and misleading interpretation of facts, with a view to advancing corporate self-interest (see Box 5). Unfortunately, what is lacking in plausible argument is made up for by economic power and political influence.
Dilemmas for least developed countries Like the ACP sugar exporters, few least developed countries could compete against major exporters such as Brazil and Thailand in an unprotected EU market. As shown earlier, the benefits derived from preferential access are a function of two factors: the volume of exports, and the price paid for those exports. Any fall in EU guaranteed prices will automatically be transmitted to least developed countries. Moves towards an open market in the EU would compromise LDC interests on two counts. It would expose them to competition against low-cost exporters such as Brazil and Thailand, and reduce EU prices towards world market levels. In other words, they would lose out as a result of lower export volumes and also as a result of lower prices.
Faced with this threat, LDC governments have understandably opted for the future CAP regime to be based on a quota system. This implies a willingness on their part to waive their right to duty-free access under the EBA in 2009 in return for a larger import quota at prices linked to guaranteed EU prices. To this end, in January 2004, LDC ministers proposed a gradual move towards tariff elimination between 2006 and 2016, with an expansion of their current quota to 1.6 million tonnes over the same period.71 This is a conservative demand that almost certainly falls far short of LDC export capacity (which will in turn be influenced by the prices paid in the EU).
One explanation for the limited nature of LDCs’ demands can be traced to their political strategy. Like the ACP countries, least developed countries have formed an informal alliance with the EU sugar industry, based on a shared concern to see the quota system retained. Beyond this concern, the interests of the least developed countries and the EU industry sharply diverge. The European sugar- processing industry and the large-scale beet farmers will not support a substantial erosion of the domestic quota in the interests of least developed countries, especially at a time when prices are falling. British Sugar is unusual in that it now agrees in principle that the least developed countries should have a bigger quota. However, the company has yet to indicate the scale of cuts it envisages in its own quota, presumably on the grounds that other Member states should make the necessary adjustment.
Dumping on the world, Oxfam Briefing Paper. March 2004 43
Box 6: UK sugar industry myths72 Myth 1: The UK market is ‘in balance’‘The UK is roughly in balance between beet and cane sugar production and consumption so does not contribute to any EU quota surplus.’ (British Sugar) ‘The UK is in balance between supply and demand.’ (NFU) Credibility rating: 0/10
The truth: The UK market is not in balance. Britain exports 400,000 -500,000 tonnes annually, making it the third-largest exporter in the EU, after France and Germany.
Myth 2: The UK does not subsidise exports ‘EU exports…benefit from refunds funded by industry levies…non-quota sugar receives no refund payments.’ (British Sugar) ‘The UK beet sugar industry does not contribute to the European surpluses exported onto the world market with export subsidies.’ (NFU) Credibility rating 0/10
The truth: The UK is a subsidising exporter Tate and Lyle exports 250,000 –300,000 tonnes of cane sugar annually, for which it receives €157m annually in export subsidies. British Sugar typically sells between 100,000 and 200,000 tonnes of non-quota sugar on world markets. As shown in the text of this paper, these exports are cross-subsidised.
Myth 3: Brazil will gain from reform ‘Brazil is now exporting twice as much as the EU…The EU’s exports have remained static.’ (British Sugar) ‘If the EU sugar regime were liberalised immediately, then Brazil would be the major beneficiary.’ (British Sugar) Credibility rating 3/10
The truth: Brazil has been expanding its share of the world market, partly at the expense of the EU. But Brazil is also the world’s lowest-cost producer of sugar. ‘Static’ EU exports should be seen in context: Europe has 40 per cent of the world market for refined sugar. There is no merit in the EU having a static market share, if that share is gained through unfair trade practices. Brazil would benefit if the EU stopped dumping. But Brazil is a developing country with a legitimate interest in sugar exports.
Myth 4: Reform would cost jobs ‘The EU sugar industry employs almost 400,000 people. The UK industry supports over 20,000 jobs.’ (British Sugar) Credibility rating 2/10
The truth: Estimates vary, but sugar beet probably accounts for the equivalent of around 45,000 agricultural jobs. The whole EU processing industry employs 52,000 people, although most of the jobs are seasonal. There is also scope for transferring employment from beet processing to the cane-processing sector. Threats to employment have to be taken seriously – so do the threats posed by the current sugar regime to livelihoods in developing countries.
Dumping on the world, Oxfam Briefing Paper. March 2004 44
Myth 5: Sugar is good for the environment ‘Sugar beet production in the UK benefits the environment.’ (British Sugar) Credibility rating 3/10
The truth: Sugar beet has a mixed record. Pesticide use is declining, but sugar beet continues to use far more chemical inputs per hectare than cereals. Water requirement is three times that of wheat. Sugar-beet cultivation is also one of the major causes of soil erosion in UK agriculture. Research by DEFRA points to annual losses of 350,000 tonnes every harvest. An assessment by the EU Commission concluded: ‘Generally, a reduction in beet cultivation would contribute to protecting the environment.’
Myth 6: EU prices reflect real market conditions ‘The “world market” for sugar is a volatile residual market where prices seldom bear any relation to production costs…Suggestions that Europe’s prices are set at “three times world market levels” are misleading.’ (British Sugar) Credibility rating 2/10
The truth: The world market is a volatile residual market characterised by low prices, partly because of the EU’s contribution. Policies in other industrialised (and some developing) countries exacerbate the problem. The assertion that EU prices are set at three times market levels is correct. The current EU guaranteed price (€631) is currently four times the world price (€ 157).
Myth 7: Industry pays for the costs of exports ‘The industry (processors and growers together) is charged a levy to meet the full costs to the EU budget of exporting surplus quota sugar.’ (British Sugar) Credibility rating 0/10
The truth: The industry levy meets less than half of the costs of dumping surplus quota sugar. Taxpayers spend an additional €800m annually through the CAP budget. The industry levy is a disguised subsidy paid by consumers but collected through industry.
Myth 8: The EU already imports enough sugar ‘The EU is already the world’s second largest sugar importer – Importing more than Australia, Brazil, Canada, and Thailand combined.’ (British Sugar) Credibility rating 1/10
The truth: Technically accurate – and totally irrelevant. The EU has no competitive advantage in producing sugar, so it has every reason to import. Countries like Brazil, Australia, and Thailand are among the world’s lowest-cost sugar producers and major exporters. Why would they import?
An alternative option In their current forms, none of the proposed options will achieve the objectives of eliminating export dumping, significantly improving the market access of least developed countries, addressing ACP concerns, and promoting sustainable agriculture. New approaches are needed – and the reform model advocated by the sugar lobby
Dumping on the world, Oxfam Briefing Paper. March 2004 45
should be rejected. The starting point has to be rooted in sugar-policy realpolitik. No conceivable price cut would eliminate EU surplus dumping – and the reform process is not starting from a blank sheet. Historical ties with the ACP and the needs of least developed countries have to be taken into account.
It is widely accepted that price cuts will figure in any reform, although there is extensive debate over the appropriate depth and timing of such cuts. An agreement on agriculture at the WTO will inevitably include commitment to lower tariffs, which are the basis of the guaranteed-rice system in sugar. As tariffs are reduced, guaranteed prices will follow. Depending on the terms of the WTO agreement, guaranteed prices could fall to between €450/tonne and €600/tonne.73 Price adjustments on this scale would hurt smaller sugar growers, especially in southern Europe. But it is unlikely that they would eliminate the structural surplus in sugar. This is because sugar would remain profitable in the large-scale farming areas of northern Europe.
Deeper price cuts would have serious consequences for most ACP countries and many least developed countries. As the EU market became less attractive, the volume of exports supplied by the LDCs and ACP countries would fall. One scenario considered by the European Commission considered the impact of a 40 per cent price cut for ACP/LDC imports. It estimated a decline to 200,000 tonnes in supply, and losses of €300m for the ACP countries. This would destroy potentially viable industries developed, in part, because of the incentive created by the EU.
The alternative is to combine realistic price cuts with a more stringent quota regime. That regime should reflect a clear commitment to the elimination of dumping, the expansion of market access for least developed countries, the protection of ACP exports, and the promotion of sustainable agriculture in the EU.
We propose the following framework for implementation over the period 2006-13:
�� Deep cuts in EU quotas. A reduction of around 5.2 million tonnes, or around one-third, in the EU quota to end all exports, facilitate an increase in imports from least developed countries, and realign domestic production with consumption. The cut would take place in two stages, illustrated by reference to the average sugar balance for the period 2000-2003 (Figure 16):
Stage 1: An immediate prohibition on non-quota exports (2.7 million tonnes) and a domestic quota cut of around 2.5 million tonnes.
Stage 2: An incremental, graduated cut in quotas over the period 2006-13 to accommodate an additional 2.7 million tonnes in imports
Dumping on the world, Oxfam Briefing Paper. March 2004 46
from least developed countries at prices linked to those on the EU market.
The proposed cuts in quota would achieve two of the core goals for reform: namely the elimination of export dumping and the expansion of opportunities for least developed countries. Figure 16 illustrates the post-reform market balance. There is an obvious danger that production would exceed quota ceilings, giving rise to continued export surpluses. Much would depend on the new price regime and profitability levels. In order to avert an accumulation of export surpluses, any production in excess of quota in one marketing year could be followed by an equivalent and mandatory reduction in quotas the following year. An alternative approach would be that of imposing a punitive tax on production in excess of quota.
Management of LDC quotas. Quotas should be allocated on the basis of genuine export capacity, with restrictions on ‘round-tripping’ – a practice that involves the import of low-price sugar from the world market for re-export to the EU at prices linked to those on its domestic market. Trade should reflect genuine export
��
Dumping on the world, Oxfam Briefing Paper. March 2004 47
capacity, not rent-seeking behaviour. Quotas should be provided on a stable and predictable basis to prevent sudden adjustment shocks. Least developed country governments should strive to achieve a broad-based distribution of benefits from sugar exports. This implies the integration of the sugar sector into a wider strategy for poverty reduction that incorporates support for smallholder farmers, respect for international labour standards, and a commitment to environmental sustainability.
Transitional arrangements for ACP exporters. ACP exporters are entitled to a quota of 1.6 million tonnes. However, lower EU price may compromise the viability of some industries. Various options need to be considered. The EU could create a quota buy-back scheme under which some ACP suppliers could transfer their quota back to the EU in return for a guaranteed flow of development financing. Such a scheme would have advantages for very high-cost producers unable to adjust to new market conditions. For other ACP producers, the EU should create a sugar-development assistance fund. This fund would be used to support restructuring and poverty-mitigation measures through targeted assistance. The fund could be financed through the transfer of the €1bn currently allocated to export subsidies.
��
�� Redistribution of CAP support. Reform needs to be carried out in a way that avoids imposing disproportionate adjustment costs on small-scale farmers. Therefore ceilings should be placed on the level of support provided to individual sugar growers. Competition authorities in Member States should carry out a systematic, EU-wide investigation of the activities of sugar-processing companies with a view to lowering market-entry barriers, improving competition, and preventing price collusion.
Free-market purists will object to this approach. They will argue that it perpetuates the distortions of the current regime – and they are partly right. However, the proposal does offer major advantages, including the elimination of export dumping, the creation of a stable market for some very poor countries, and support for adjustment in the ACP group. Countries as diverse as Mozambique, Mauritius, and Brazil all stand to gain. Corporate lobbyists in the EU will reject the proposal on different grounds, notably that it is bad for large-scale beet growers and processors. They too are right. But there will be major advantages for EU taxpayers and consumers, and – if the proper measures are put in place – for small farmers and the environment. More broadly, our proposals would enable the EU to contribute in a meaningful way to global poverty-reduction efforts – and to a resumption of the WTO ‘development round’ negotiations. The EU is part of an interdependent world – and sugar is one of the commodities that link Europeans to poor countries. Interdependence brings with it the
Dumping on the world, Oxfam Briefing Paper. March 2004 48
potential for shared prosperity. But it also implies shared responsibility, including the responsibility to put public interest and a commitment to global poverty reduction before private vested interests in the sugar sector.
Dumping on the world, Oxfam Briefing Paper. March 2004 49
Appendix 1 Table 1 The cost of EU sugar market restrictions: estimated losses for Ethiopia, Malawi and Mozambique (2001-04)
Total loss 83.0 86.2 69.2 Sources: International Sugar Organisation, Reserve Bank of Malawi (National Accounts and Balance of Payments Committee), Mozambique National Sugar Institute, Ethiopian Sugar Industry Support Centre.
Column 2: Import price for EBA sugar converted into dollars at average annual exchange rate.
Columns 4,6,8: Exports on non-preferential terms to regional and international markets.
* Projected figures based on data from sources cited above.
Dumping on the world, Oxfam Briefing Paper. March 2004 50
Notes
1 Derived from International Sugar Organisation, ‘Quarterly Market Outlook’, September 2002, London. 2 D. Mitchell, ‘Sugar Policies: Opportunity for Change’, mimeo, World Bank, 2003. 3 Landell Mills Commodities and Oxford Policy Management, ‘Addressing the Impact of Preference Erosion in Sugar on Developing Countries’, mimeo, paper prepared for UK Department for International Development, September 2003. 4 OECD, ‘Agricultural Policies in OECD Countries: Monitoring and Evaluation’, Table 11.2.1, p.188, OECD, Paris, 2002.The Producer Support Estimate (PSE) for sugar in 2001 was €1.9bn, or 46 per cent of the value of production. Only the beef and veal sector had a higher PSE. The PSE for sugar in the United States was lower in value terms, reflecting the smaller volume of production, but slightly higher (48 per cent) as a proportion of the value of production. 5 As we point out below, world prices are artificially depressed by export dumping on the part of the EU and others. 6 Protection for sugar comprises a fixed duty of €419/tonne. Under the ‘special safeguard’ provision, an additional duty is applied which varies according to movements in world price. The ‘trigger price’ for imposing the ‘special safeguard’ is a world price of €531/tonne. The safeguard has been applied permanently since 1995. 7 The budget payment includes an amount allocated for the re-export of an amount equivalent to ACP imports of 1.6 million tonnes, and the export of surplus quota sugar. The latter is financed by a levy on industry. Financial provisions vary from year to year. The 2002/03 budget included €776m for the re-export of ‘ACP equivalent’ sugar. Resources from the levy amounted to €650m. 8 European Communities Court of Auditors, ‘Special Report concerning the Management of the Common Organisation of the Market for Sugar’, Official Journal of the European Communities, Volume 44, 15 February, para.81, 2001, Brussels. 9 Commission of the European Communities, ‘Financial statement concerning the European Agricultural Guidance and Guarantee Fund: Financial Year 2002’, Com (2003) 680 Final, Commission of the European Communities, Brussels, 2002. 10 European Communities, ‘Common Organisation of the Sugar Market: description’ Annex 111, (http://europa.eu.int/comm/agriculture/markets/sugar/reports/descri_en.pdf). 11 The EU has a quota of 1.3 million tonnes allocated to ACP countries under the Sugar Protocol. An additional variable amount is allocated under the Special Preferential System, amounting to 225,500 in 2002/03. 12 Imports of Balkan sugar peaked at 320,000 tonnes in 2002/03, but controls have been instituted to reduce quantities.
Dumping on the world, Oxfam Briefing Paper. March 2004 51
volume of non-quota sugar sold at world prices. This has the effect of reducing the profit margin but increasing overall profit levels. 31 The DAX index registered average return of just under 6 per cent. Source: The Sudzucker Group: Overview 2002/03, mimeo, p.16, Mannheim, Gemany, September 2003. 32 Ibid. 33 Southern German beet farmers control Sudzucker’s largest shareholder, Suddeutsche Zuckerruben-Verwertungsgenossenschaft (SZVG). Hoovers, ‘Sudzucker AG Fact Sheet’, Hoover’s Online (www.hoovers.com). 34 Hoover’s Online, Beghin-Say Fact Sheet’, (www.hoovers.com/beghin-say) 35 EU Court of Auditors, op. cit., para 82. 36 Swedish Competition Authority, op. cit. 37 Europa, ‘Commission Decision of 14 October 1998’, 1999/210/EC. Offocial Journal L706, 22/03/99 38 European Commission, ‘Reforming the European Union’s Sugar Policy: Summary of Impact Assessment Work’, European Commission, Brussels, 2003. 39 B. Lang, ‘Report on Farming in the Eastern Counties of England in 1999/2000’, University of Cambridge, Department of Land Economy, 2001. The gross margin for the largest 25 per cent of sugar beet farms is £1,077, compared with around £640 for cereals. 40 The gross value of sugar output per hectare amounted to £1486 in 1999. Using world current world prices as a benchmark, around three-quarters of this amount – or €1668 – can be treated as an indirect consumer subsidy. That is, exposure to world market prices would have lowered the value of output to around one quarter of the protected level. At one level this can be considered an artificial exercise. As noted in the text, the world price cannot be taken as a fully accurate indicator for market prices because of the distorted nature of the market. However, the gap between world and EU prices clearly generates large tarnsfers from consumers to large farmers. 41 Data provided by DEFRA. 42 Oxfam, ‘Spotlight on Subsidies: Cereal Injustice under the CAP in Britain’, Oxfam Briefing Paper 55, 2004. 43 Tate and Lyle, ‘Tate and Lyle: a Bridge into Europe’, mimeo, presentation by Patricia Jamieson and Chris Fox, 18 December 2002. Tate and Lyle imports around 1.1 million tonnes of raw sugar from cane suppliers, approximately two-thirds of total cane-sugar imports. Around 800,000 tonnes of this is marketed in Europe, leaving an average annual surplus of around 300,000 tonnes. 44 Globe and Mail, ‘Westons Gain Posh and Spice with Selfridges’, Retail News, 15 July 2003. (http://sympatico.workpolis.com/servlet/content/fasttrack). Globe and Mail, ‘Westons Gain Control of Selfridges: report’, Canadian Press Service, 14 July 2003 (www.evalu8.org/staticpage).
Dumping on the world, Oxfam Briefing Paper. March 2004 53
45 British Sugar, ‘British Sugar Today: An Overview’ (www.britishsugar.co.uk/bsweb/sfi/agricind/bstoday.htm). 46 British Sugar, ‘Financial Statements: Period Ending 13 September, 2003’, page 7, Companies House, London, 2003. 47 Time magazine, ‘Global business: the families that own Europe’, Time Online Edition (www.time.com/time/globalbusiness/article). 48 This calculation is derived from British Sugar's Operating Profit in 2003 of £187m, which is equivalent to 40 per cent of Associated British Food's Operating Profit before Amortisation of Goodwill for the same period. The generation of Operating Profit enables dividends to be paid. British Sugar can therefore be said to have enabled 40 per cent of ABF's £115 million declared dividends, which equals £46 million. Of this amount, 54 per cent of the relevant dividends went to Whittington Investments, refelcting its overall proportion of share ownership. This represents £25m. (Derived from British Sugar, ‘Financial Statements’, op cit., p.7; Associated British Foods, ‘Annual Report and Accounts’, Consolidated Profit and Loss Account for the Year Ended September, 2003, p.48) 49 These calculations are based on the share of national quota controlled by the company in question, the export surplus built into the national quota, and the export restitution level applied in March, 2004. 50 European Commission, White Sugar Equivalent regulation No 1646/2001, OJL 219, p.4. 51 Cadbury’s Schweppes, Memorandum submitted to the Environment, Food and Rural Affairs Committee, UK Parliament, Minutes of Evidence, June 30, 200 (www.parliament.the-stationery office.co.uk/pa/cm). 52 Ibid. 53 The box on the US is based the following sources: ‘Sugar: Long-term contribution trends,’ (Source www.opensecrets.org. Accessed March 19, 2004); ‘Sugar: Top Contributors’ (Sources www.opensecrets.org Accessed March 19, 2004) Will, George F. “Sweet and Sour Subsidies.” Washington Post, February 12, 2004.’Liberalizing Trade in Sugar: The Critical Link to Promoting Global Development, Free Trade, US Credibility, and Fairness’ The New York Times Company, 2003. 54 B. Borrell and L. Hubbard, ‘Global Economic Effects of the EU Common Agricultural Policy’, Institute of Economic Affairs, Blackwell Publishers, 2000. 55 India produced just under 20 million tonnes of sugar in 2002, making it the world’s second-largest producer after Brazil. Exports amounted to 1.8 million tonnes. 56 F. Bourgouin, ‘The South Africa Sugar Industry: Growing Export Markets and the Potential Impact on Livelihood Conditions for Labourers and Sugarcane Growers’, mimeo, report drafted for Oxfam Regional Management Centre, Pretoria, South Africa. 57 Ibid. 58 On the Everything But Arms Initiative, see International Sugar Organisation, ‘Everything But Arms: Implications for the World Sugar Market, London’, 11 November 2002. See also C. Stevens and J. Kennan, ‘The
Dumping on the world, Oxfam Briefing Paper. March 2004 54
Impact of the EU’s "Everything but Arms" Proposal: A Report to Oxfam’, mimeo, January 2001. 59 The 2001 figure is taken from International Sugar Organisation, ‘Everything But Arms’, op. cit. The current figure is derived from International Sugar Organisation data for 2004 prices and a $/€ exchange rate of 1.2 60 See also A. Locke, ‘The Mozambique Sugar Industry: Overview and Outlook’, mimeo, Address to the FAO/Mozambique 111 International Sugar Conference, October 2002. 61 Department of Agriculture, ‘Sugar Sweetens Ethiopian Export Prospects’, (http://usembassy.state.gov/ethiopia/wwwhec15.html). 62 National Institute of Sugar, ‘Balance for the Sugar Sector 2003’, mimeo, 2003. 63 Malawi is projected to export 68,000 tonnes of raw sugar to regional markets outside of preferential agreements. Source: Information provided by the Reserve Bank of Malawi. 64 International Sugar Organisation, ‘Everything But Arms Initiative’, op. cit, p.9. European Commission, ‘Reforming the EU’s Common Agricultural Policy’, op. cit., p.10. 65 The Special Protocol on Sugar is a government-to-government agreement under which ACP countries (and India) export between 200,000 and 345,000 tonnes a year. 66 C. Rohee, ‘Guyana Faces Ruin in EU Sugar Challenge Succeeds’, Starbroek News Service (www.landofsixpeoples.com/news). 67 See, for example, ACP London Sugar Group, ‘Options for Reform of the EU Sugar Regime: Response to DEFRA Consultation’, mimeo, January 2004, London. 68 Confederation of European Sugar Manufacturers, ‘Options for CAP reform’, Press Statement, 14 September, 2003 (www.comitesecure.org/cgi-bin/cefs). 69 J. Marihart, Speech on Future of Sugar Regime, 8 October 2003 (www.comitesecure.org/cgi-bin/cefs/dm/public/news). 70 For details see National Farmers’ Union, ‘Save our Sugar Campaign’, NFUonline (www.nfu.org.uk/stellnetdev/groups). 71 Least Developed Countries, ‘Proposal to the European Union on Regulation 416/2001’, mimeo, London, March 2004. 72 EU guaranteed prices are fixed for white sugar. A white-sugar price of €450-€600/tonne would translate into a raw-sugar price of €290-€435/tonne for ACP/LDC exports. 73 The statements are taken from the following documents. British Sugar, ‘The EU Sugar Regime’ (www.britishsugar.co.uk/bsweb/bsgroup/facts/fsheet1.htm); British Sugar, ‘The EU Sugar Regime and the World Market: Dispelling the Myths’ (www.britishsugar.co.uk/bsweb/bsgroup/facts/fsheet2.htm); National Farmers’ Union, ‘DEFRA Consultation: Review of the EU Sugar Sector’, NFUonline (www.nfu.org.uk/stellentdev/groups).
Dumping on the world, Oxfam Briefing Paper. March 2004 55
African, Caribbean and Pacific Countries, 'About Sugar', Description of ACP sugar industries (www.acpsugar.org/eusugardescription.htm)
African, Caribbean and Pacific London Sugar Group (2003) 'Options for Reform of the EU Sugar Regime', mimeo, ACP response to DEFRA consultation, December 2003 (www.acpsugar.org.htm)
Agra Europe (2003) 'Brazil to take EU to WTO over sugar subsidies', Agra Europe Weekly, Issue Number AE1991, Agra Europe, 22 February 2003, Basingstoke
Agritrade (2004) 'Sugar: executive brief', January 2004 (www.agritrade.cta. int/sugar/executive_brief.htm)
Alden, A. and N. Buckley (2004) 'Sweet Deals: big sugar fights threats from free trade', Financial Times, 27 February 2004
Amadeus (2004) 'Company Reports 2004', Reports for Wittington Investments and British Sugar (http://amadeus.bvdep.com/cgi/report)
Associated British Foods (2004) ‘Annual Report and Accounts 2003’, ABF: London
Associated British Foods (2004) 'Key Management Biographies', Profiles of senior managers (www.abf.co.uk/investors/biographies.html)
Borrell, B. and L. Hubbard (2000) Global Economic Effects of the EU Common Agricultural Policy, Institute of Economic Affairs, Oxford: Blackwell
Bourgouin, F. (2003) ‘The South African Sugar Industry’, mimeo, report prepared for Oxfam GB Regional Management Centre, Pretoria, February 2003
British Sugar (2003) 'Financial Statements: Period Ended 13 September 2003', London: Companies House (www.britishsugar.co.uk/bsweb/bsgroup/facts/fsheet2)
British Sugar (2003) 'The EU Sugar Regime and the World Market – dispelling the myths' (www.britishsugar.co.uk/bsweb/bsgroup/facts/fsheet2)
British Sugar (2003) 'The EU Sugar Regime', November 2003 (www.britishsugar.co.uk/bsweb/bsgroup/facts/fsheet12)
Commission of the European Communities (1999) 'Commission Decision of 14 October, 1988', Official Journal L076, 22/03/1999 (www.europa.eu.int/eur-lex/en/lif/reg/en_register_082010.html)
Commission of the European Communities (2003) 'Common Organisation of the Sugar Market – Description', Brussels (www.europa.eu.int/comm/agriculture/markets/sugar)
Commission of the European Communities (2003) 'Reforming the European Union’s Sugar Policy: Summary of Impact Assessment Work', Commission Staff Working Paper (SEC 2003), European Commission, Brussels (www.europa.eu.int/comm/agriculture/markets/sugar/index)
Commission of the European Communities (2003) 'The European Agricultural Guidance and Guarantee Fund, Guarantee Section, Financial Year 2002', European Commission, Brussels
Commission of the European Communities (2003) 'Extended Impact Assessment: sugar regime', European Commission (http://europa.eu.int/comm/agriculture/public/reports/sugar/fullrep_en.pdf)
Commission of the European Communities (2003) 'Communication from the Commission to the Council: Accomplishing a sustainable agricultural model for Europe through the reformed CAP – the tobacco, olive oil, cotton and sugar sectors, European Commission (COM 554)', European Commission, Brussels
Confederation of European Sugar Manufacturers (2003) 'The Future of EU Sugar', Speech by Johann Marihart, 8 October 2003 (www.comitesucre.org/cgi-bin/cefs/dm/public/news)
Confederation of European Sugar Manufacturers (2004) 'Position of the CEFS', January 2004 (www.ib.be/cefs/position.htm)
EU Court of Auditors (2001) 'Special Report No 20/2000: concerning the management of the common organisation of the market for sugar', Official Journal of the European Communities, Volume 44, 15 February 2001, Brussels
Dumping on the world, Oxfam Briefing Paper. March 2004 57
Frandsen, S. et al. (2003) 'Modelling the EU Sugar policy: a study of reform scenarios', mimeo, Working Paper, Danish Institute of Agricultural and Fisheries Economics, Copenhagen
Government of Australia (2004) 'European Communities: export subsidies on sugar', First Written Submission of Australia, February 2004, World Trade Organisation (WT/DS 265), Geneva
Government of Brazil (2004) 'European Communities: export subsidies on sugar', First Written Submission of Brazil, 12 February 2004, World Trade Organisation (WT/DS266): Geneva
Government of Mozambique (2004) ‘Balance in the Sugar Sector’, mimeo, National Sugar Institute, Ministry of Agriculture and Development, Maputo
Haley, S. et al. (2002) 'Sugar and Sweeteners Outlook', Economic Research Service, United States Department of Agriculture, Washington
Harris S. and S. Tangermann (1993) A Review of the EC Sugar Regime: Studies in International Trade Policy, Michigan: University of Michigan Press
Hoekman, B. and M. Kostecki (2001) The Political Economy of the World Trading System: the WTO and Beyond, New York: Oxford University Press
Hoover's OnLine, 'Company Fact Sheets', Profiles of major companies, 2004 (www.hoovers.com/free-co-factsheets)
Huan-Niemi, H. and J. Niemi (2004) 'The Impact of Preferential, Regional and Multilateral Trade Agreements on the EU Sugar Regime', Centre for European Policy Studies, Brussels
International Sugar Organisation (2002) 'Everything But Arms: implications for the world sugar market', International Sugar Organisation, London
International Sugar Organisation (2004) 'Statistical Bulletin', January 2004, International Sugar Organisation, London
Koo, W. (2002) 'Alternative US and EU Sugar Trade Liberalisation Policies and Their Implications', Review of Agricultural Economics, 24:336-52
Landell Mills Commodities and Oxford Policy Management (2003) 'Addressing the Impact of Preference Erosion in Sugar on Developing Countries', paper prepared for Department for International Development, September 2003, London
Dumping on the world, Oxfam Briefing Paper. March 2004 58
Lang, B. (2000) 'Report on Farming in the Eastern Counties of England 1999/2000’, Rural Business Unit, University of Cambridge
Least Developed Countries, 'Proposal for the Adaptation of Tariff Elimination for Sugar Imported from LDCs', mimeo, the LDC Commercial Group on EBA Sugar (www.rawsugar.co.uk)
Mataitoga, I. (2003) 'ACP Sugar: Winners and Losers', mimeo, Speech given to International Sugar Organisation Seminar, 25 November 2003, International Sugar Organisation, London
National Farmers’ Union, 'Review of the EU Sugar Sector', Briefing Document (www.nfu.org.uk/stellnetdev/groups/public/documents)
Netherland Economics Institute (NEI) (2003) 'Evaluation of the Common Organisation of the Market in Sugar', Report Prepared for European Commission, NEI (www.europa.eu.int/comm/agriculture/eval/reports/sugar)
OECD (2002) 'Agricultural Policies in the OECD: Monitoring and Evaluation', OECD, Paris
Raworth, K. (2002) 'The Great EU Sugar Scam: How Europe's Sugar Regime is Devastating Livelihoods in the Developing World', Oxfam Briefing Paper 27, August 2002, Oxford
Sheales, T. et al. (2000) 'Sugar: International Policies Affecting Market Expansion', Australian Bureau of Agricultural and Resource Economics, Research Report 99, Canberra
Dumping on the world, Oxfam Briefing Paper. March 2004 60
Oxfam International is a confederation of twelve development agencies which work in 120 countries throughout the developing world: Oxfam America, Oxfam-in-Belgium, Oxfam Canada, Oxfam Community Aid Abroad (Australia), Oxfam Germany, Oxfam Great Britain, Oxfam Hong Kong, Intermón Oxfam (Spain), Oxfam Ireland, Novib, Oxfam New Zealand, and Oxfam Quebec. Please call or write to any of the agencies for further information. Oxfam International Advocacy Office, 1112 16th St., NW, Ste. 600, Washington, DC 20036 Tel: 1.202.496.1170, E-mail: [email protected], www.oxfam.org Oxfam International Office in Brussels, 22 rue de Commerce, 1000 Brussels Tel: 322.502.0391 Oxfam International Office in Geneva, 15 rue des Savoises, 1205 Geneva Tel: 41.22.321.2371 Oxfam International Office in New York, 355 Lexington Avenue, 3rd Floor, New York, NY 10017 Tel: 1.212.687.2091 Oxfam International Office in Paris, C/O Agir Ici, 104 rue Oberkampf, 75011 Paris, France Tel: 33.1.5830.8469 Oxfam International Office in Tokyo, Maruko-Bldg. 2F, 1-20-6, Higashi-Ueno, Taito-ku, Tokyo 110-0015, Japan Tel/fax: 81.3.3834.1556 Oxfam Germany Greifswalder Str. 33a 10405 Berlin, Germany Tel: 49.30.428.50621 E-mail: [email protected] www.oxfam.de
Oxfam America 26 West St. Boston, MA 02111-1206 Tel: 1.617.482.1211 E-mail: [email protected] www.oxfamamerica.org
Oxfam-in-Belgium Rue des Quatre Vents 60 1080 Bruxelles, Belgium Tel: 32.2.501.6700 E-mail: [email protected] www.oxfamsol.be
Oxfam Canada 880 Wellington St. Suite 400, Ottawa, Ontario, Canada K1R 6K7 Tel: 1.613.237.5236 E-mail: [email protected] www.oxfam.ca
Oxfam Community Aid Abroad National & Victorian Offices 156 George St. (Corner Webb Street) Fitzroy, Victoria, Australia 3065 Tel: 61.3.9289.9444 E-mail: [email protected] www.caa.org.au
Oxfam Hong Kong 17/F, China United Centre 28 Marble Road, North Point Hong Kong Tel: 852.2520.2525 E-Mail: [email protected] www.oxfam.org.hk
Oxfam Quebec 2330 rue Notre-Dame Ouest Bureau 200, Montreal, Quebec Canada H3J 2Y2 Tel: 1.514.937.1614 www.oxfam.qc.ca E-mail: [email protected]
Oxfam New Zealand Level 1, 62 Aitken Terrace Kingsland, Auckland New Zealand PO Box for all Mail: PO Box 68 357 Auckland 1032 New Zealand Tel: 64.9.355.6500 E-mail: [email protected] www.oxfam.org.nz