26
Linking ADMS with Microsimulation Models Prof. Duncan Laxen and Dr Ben Marner
| Date post: | 17-Jul-2015 |
| Category: |
Environment |
| Upload: | institution-of-environmental-sciences |
| View: | 244 times |
| Download: | 0 times |
Linking ADMS with Microsimulation Models
Prof. Duncan Laxen
and
Dr Ben Marner
Outline of Presentation
• Will look at a study AQC carried out for Reigate and Banstead Borough Council to test options to address NO2 concentrations in a small AQMA at a road junction in the north of the borough
• The study used a microsimulation traffic model to provide emission factors taking into account vehicle acceleration

AQMA
AQMA is a single property in the north of the Borough
At the junction of two main roads Reigate Road and Fir Tree Road

Benefits of Microsimulation Traffic Models
• A conventional traffic model produces Link-average speeds and flows
• A microsimulation traffic model Can provide details of flows, speeds and
acceleration for individual lanes in great spatial detail
But resource intensive, so mainly applied to smaller sets of links and usually to peak hours

Traffic Models
Saturn-Type Model Microsimulation Model

Acceleration is a Key Benefit
Instantaneous Emission Factors (from David Carslaw)
Average Speed Emission Factors
NOx from Diesel Cars – remote sensing
20mph30mph
This Study
S-Paramics Microsimulation Traffic Model (run by SIAS)
+ AIRE Instantaneous Emission Model (maintained by SIAS
for Transport Scotland)
+ ADMS-Roads Dispersion Model(Annual mean NO2 from predicted annual mean road-NOx to Annual mean NO2 using Defra background maps and NOx to NO2 calculator)
Traffic and emissions models run for 3 x 24hr periods: typical weekday, Saturday and Sunday
Emissions were extracted for each 2m section of road network for each 5-minute period and for each for 1-hour period and then input to ADMS Roads
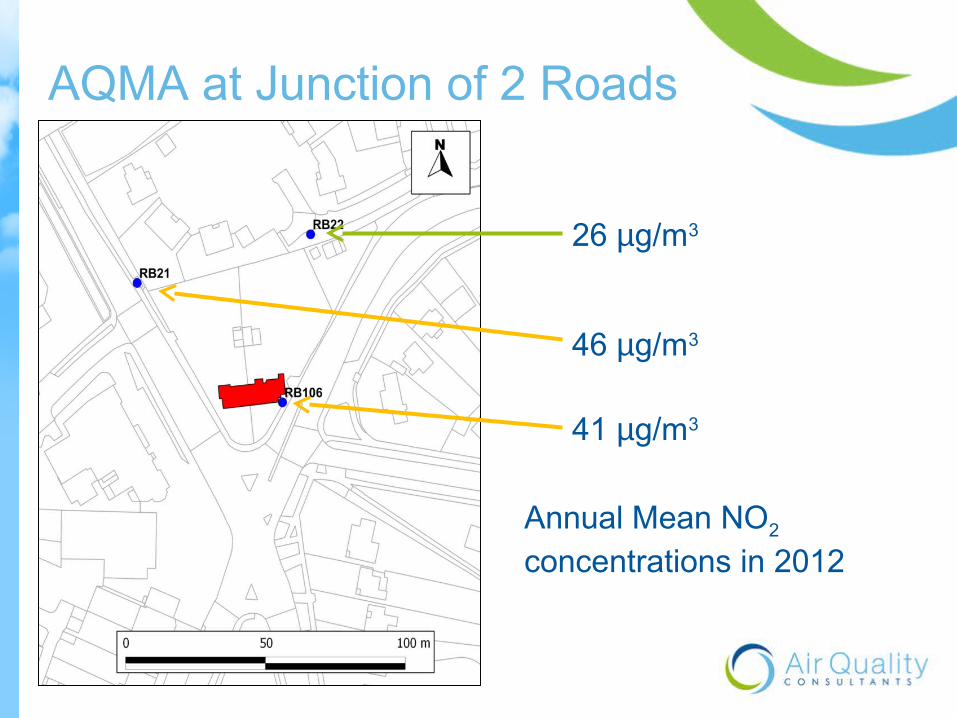
AQMA at Junction of 2 Roads
26 µg/m3
46 µg/m3
41 µg/m3
Annual Mean NO2 concentrations in 2012
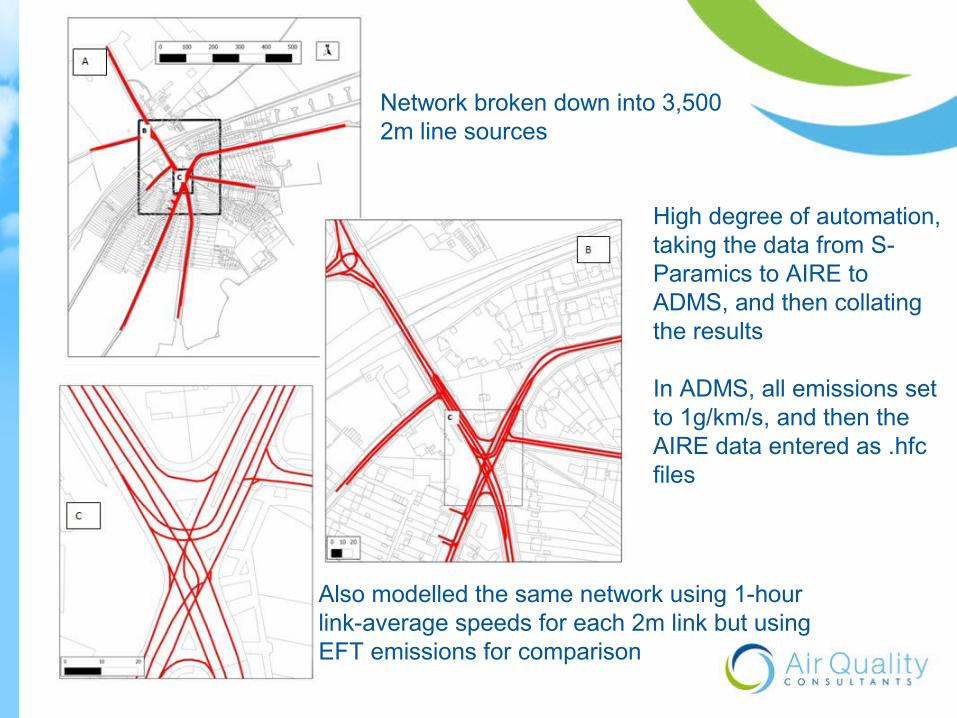
Network broken down into 3,500 2m line sources
High degree of automation, taking the data from S-Paramics to AIRE to ADMS, and then collating the results
In ADMS, all emissions set to 1g/km/s, and then the AIRE data entered as .hfc files
Also modelled the same network using 1-hour link-average speeds for each 2m link but using EFT emissions for comparison

Modelled Roads
58 road lane sections modelled
S-Paramics:
•Traffic counts
•Traffic speeds
•Vehicle mix
AIRE:
•1-hour emission profiles
•5-minute emission profiles
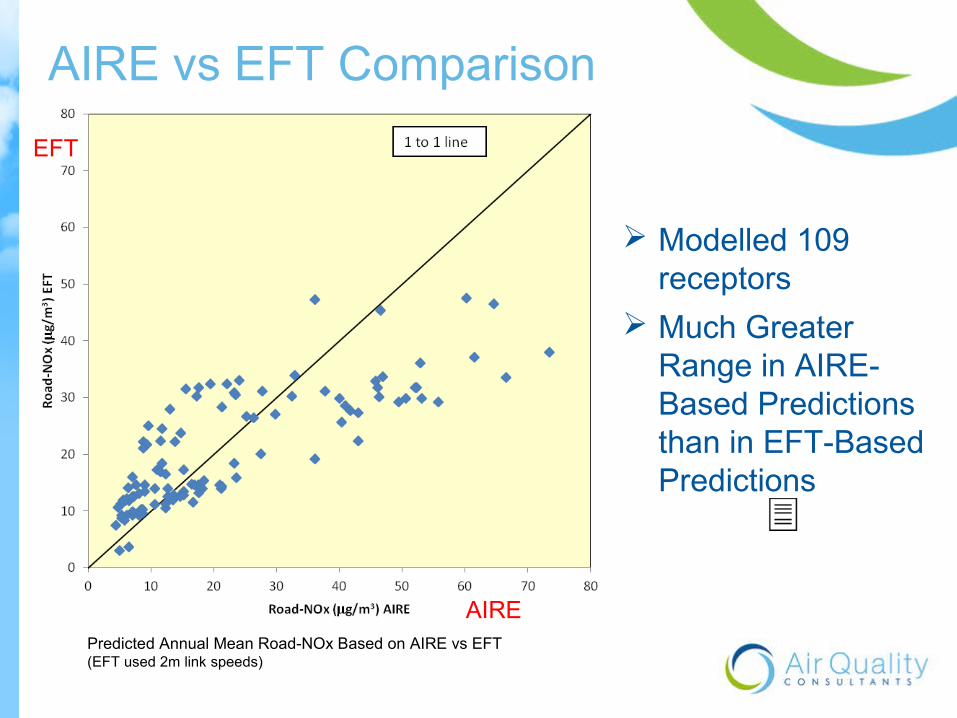
AIRE vs EFT Comparison
Predicted Annual Mean Road-NOx Based on AIRE vs EFT (EFT used 2m link speeds)
Modelled 109 receptors
Much Greater Range in AIRE-Based Predictions than in EFT-Based Predictions
EFT
AIRE
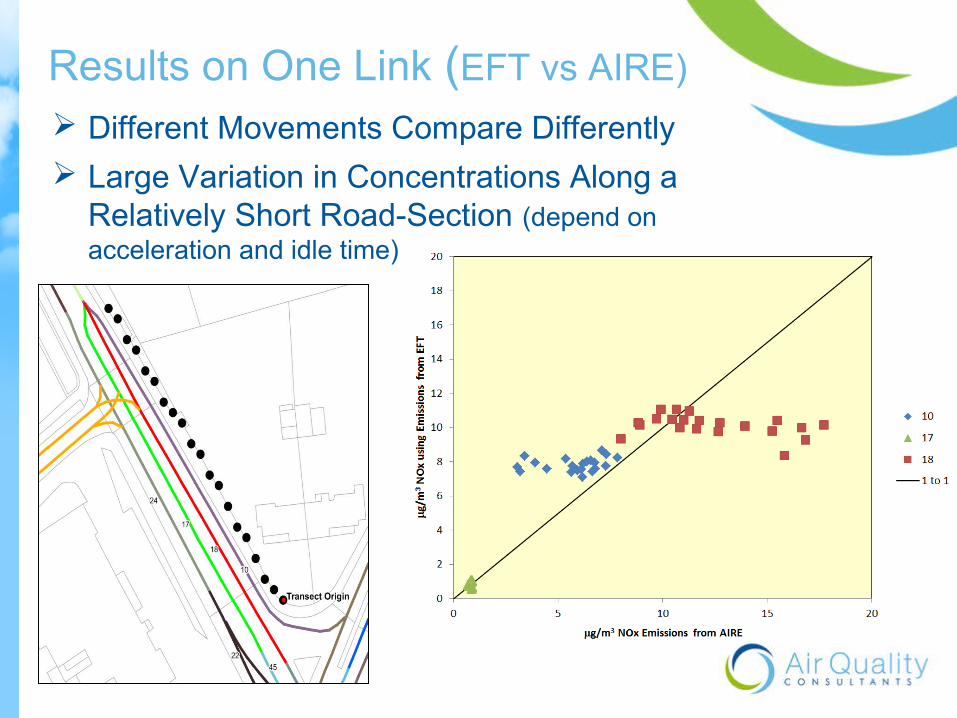
Results on One Link (EFT vs AIRE)
Different Movements Compare Differently
Large Variation in Concentrations Along a Relatively Short Road-Section (depend on acceleration and idle time)
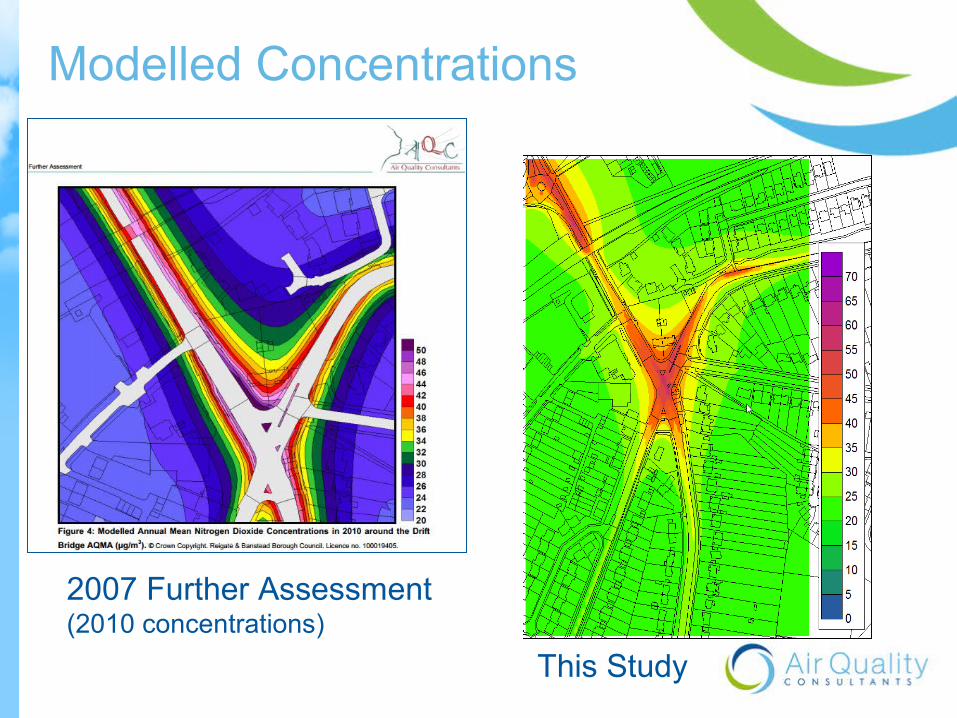
Modelled Concentrations
2007 Further Assessment (2010 concentrations)
This Study

Difference in Concentrations
Standard EFT assessment (redone) vs Microsimulation AIRE assessment
Red shows EFT>AIRE
Blue shows EFT<AIRE
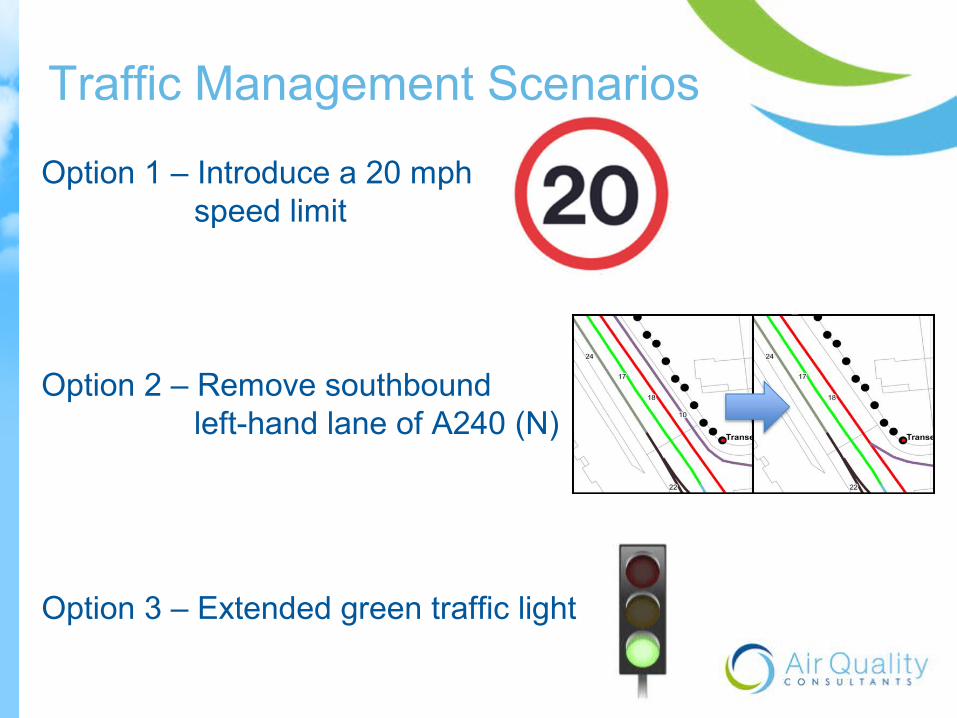
Traffic Management Scenarios
Option 1 – Introduce a 20 mph speed limit
Option 2 – Remove southbound left-hand lane of A240 (N)
Option 3 – Extended green traffic light
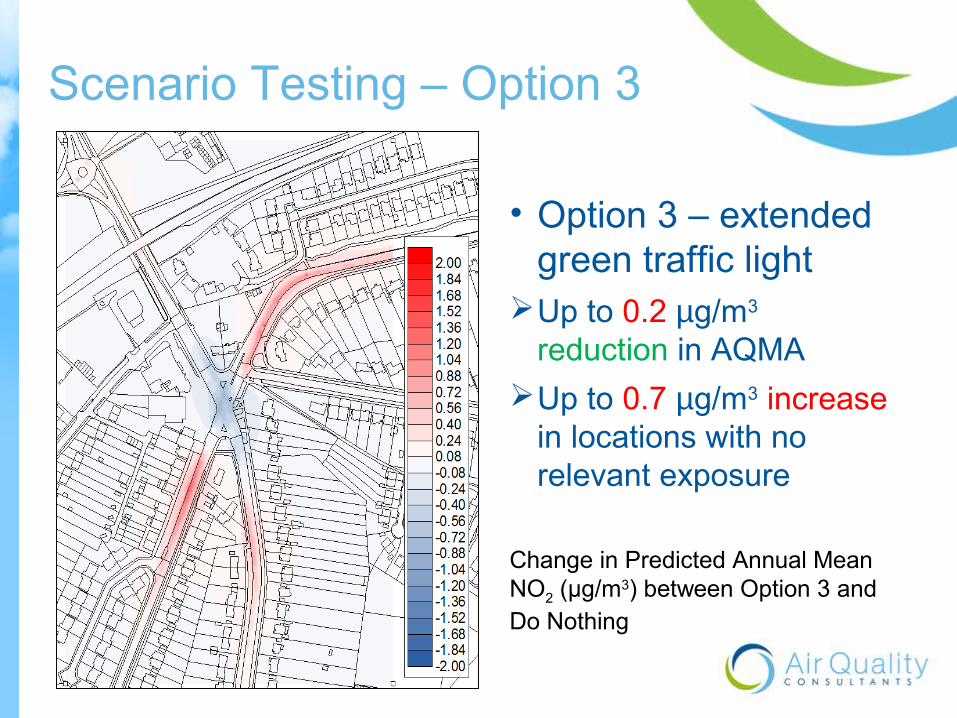
Scenario Testing – Option 3
• Option 3 – extended green traffic light
Up to 0.2 µg/m3 reduction in AQMA
Up to 0.7 µg/m3 increase in locations with no relevant exposure
Change in Predicted Annual Mean NO2 (µg/m3) between Option 3 and Do Nothing
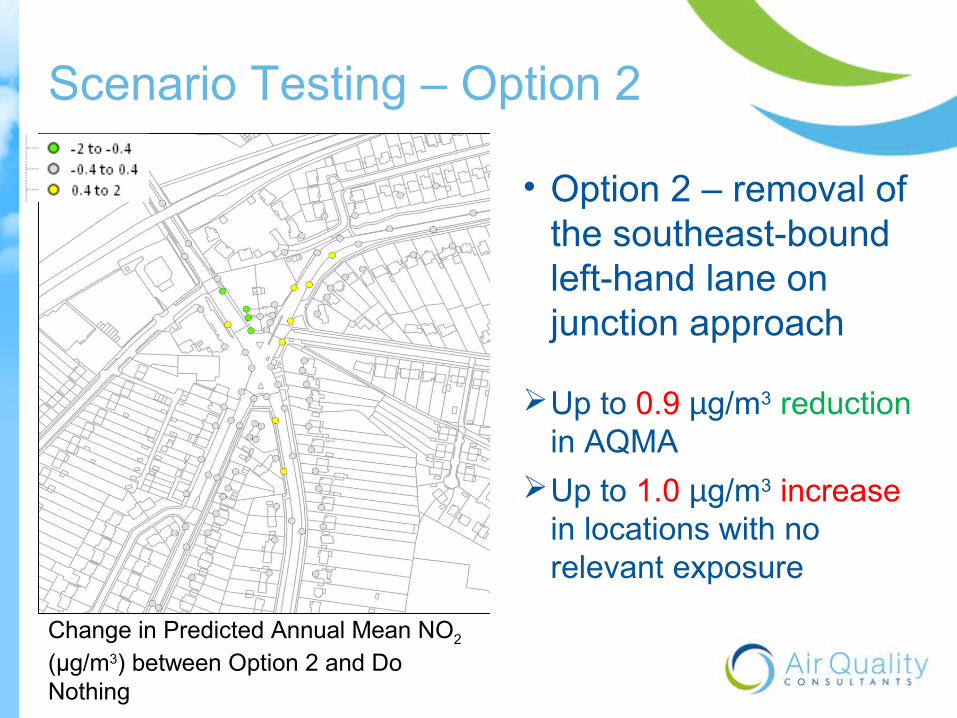
Scenario Testing – Option 2
Change in Predicted Annual Mean NO2 (µg/m3) between Option 2 and Do Nothing
• Option 2 – removal of the southeast-bound left-hand lane on junction approach
Up to 0.9 µg/m3 reduction in AQMA
Up to 1.0 µg/m3 increase in locations with no relevant exposure
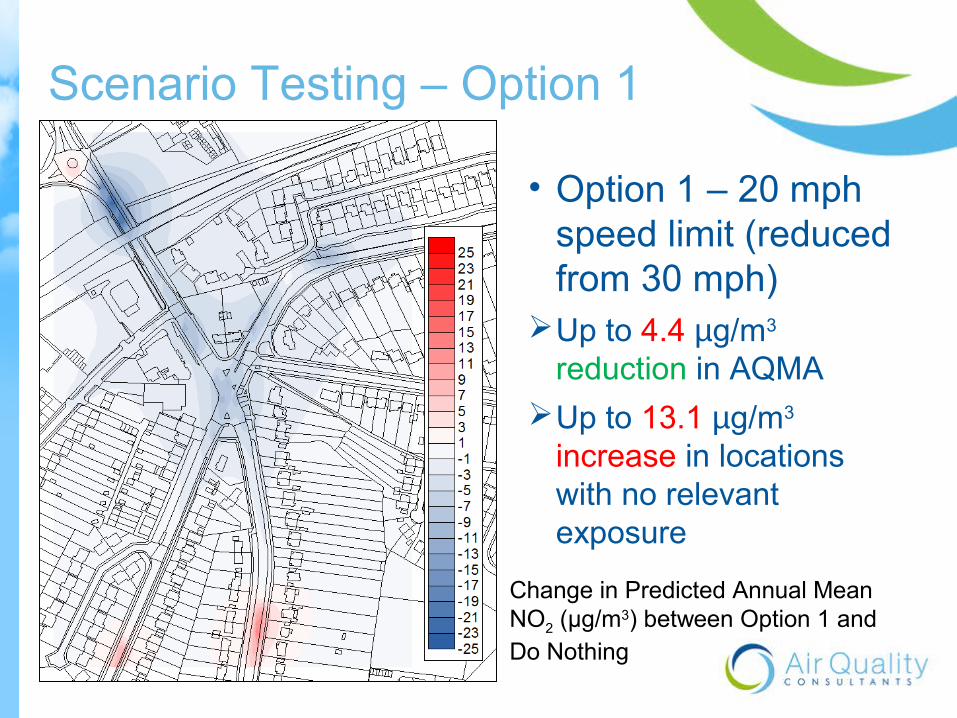
Scenario Testing – Option 1
Change in Predicted Annual Mean NO2 (µg/m3) between Option 1 and Do Nothing
• Option 1 – 20 mph speed limit (reduced from 30 mph)
Up to 4.4 µg/m3 reduction in AQMA
Up to 13.1 µg/m3 increase in locations with no relevant exposure
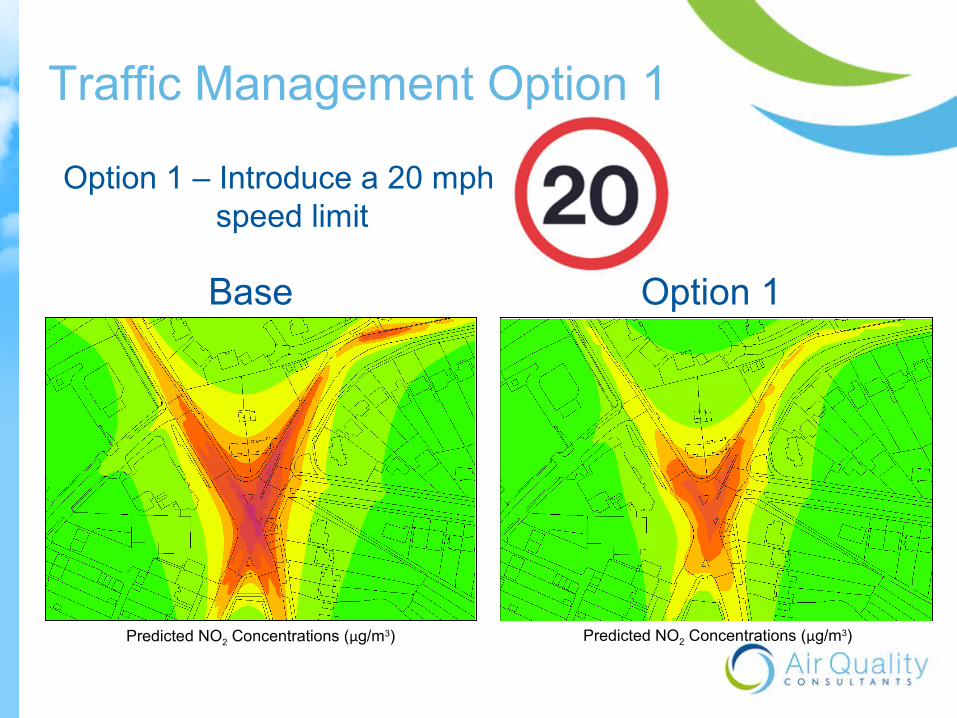
Traffic Management Option 1
Base Option 1
Option 1 – Introduce a 20 mph speed limit
Predicted NO2 Concentrations (µg/m3) Predicted NO2 Concentrations (µg/m3)
Study Limitations
The local monitoring was insufficient to fully verify the findings of the microsimulation modelling
The findings depend on the accuracy of the microsimulation model especially how acceleration is presented (it is understood that there are differences between microsimulation models and that S-Paramics handles acceleration more accurately)

Other Observations
2m links potentially over-kill for emissions subdivision, but facilitated automated link with ADMS source-geometry
Automation meant that a larger study area could have been modelled in ADMS relatively easily once systems in place
Even with this small network, volume of emissions data made QA onerous (1/4 million different emissions values per scenario)
Key Observations
Use of average speed emission factors would predict an adverse effect of implementing a 20mph speed limit
Use of microsimulation model shows that 20mph limit can reduce emissions by reducing accelerations, i.e. smoothing flows. There is support for this view from a recent study in London

Similar Findings for 20mph
• Used floating car on routes in London with 20 and 30mph limits
• Used drive-cycle profiles with AIRE emission factors
• Found reduction in NOx emissions on 20mph roads
Concluded: “.. it would be incorrect to assume a 20mph speed restriction would be detrimental to local air quality …”
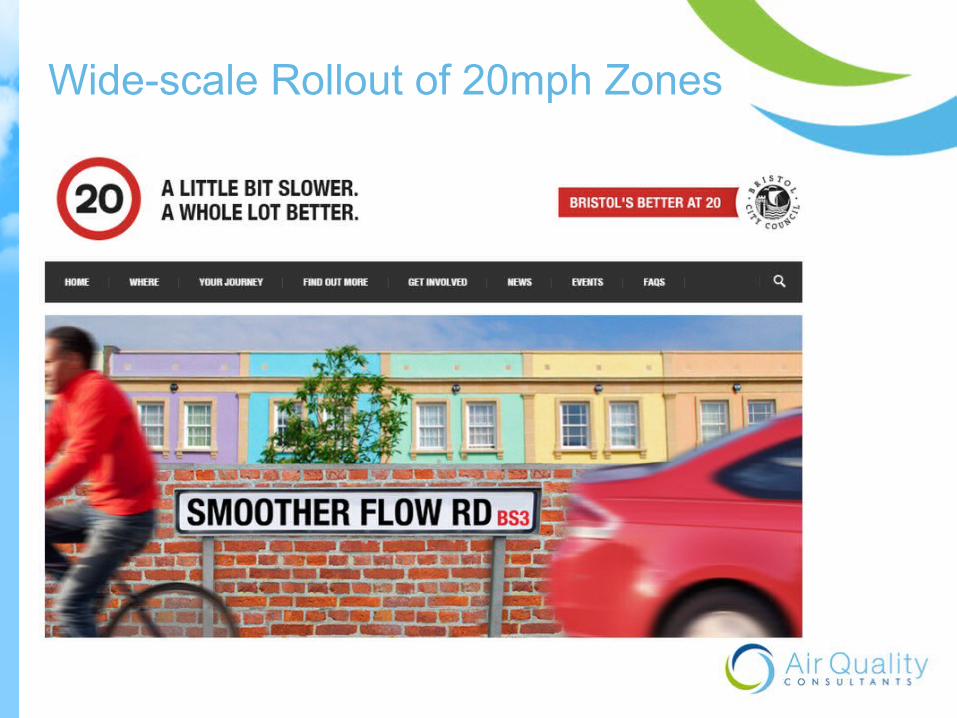
Wide-scale Rollout of 20mph Zones
Thanks to
• Dr Leon Hibbs at Reigate and Banstead BC
• SIAS Transport Planners
• Defra (for grant funding)
• and Dr Austin Cogan at AQC

Head Office 23 Coldharbour Road, Bristol BS6 7JTTel: 0117 974 1086
London Office12 Airedale Road, London SW12 8SFTel/Fax: 020 8673 4313


