26
Durability optimisation of powerful soft actuators for wearables (DROPSAW) – Milestone 2 Suraj Giri and Allan J. Veale August 26, 2020 i

Durability optimisation of powerful soft actuators forwearables (DROPSAW) – Milestone 2
Suraj Giri and Allan J. Veale
August 26, 2020
i
Summary
Actuators made using soft materials lend well to assisting human movement when worn on the body.However, these materials are vulnerable to failing. The DuRability Optimisation of Powerful Soft Actu-ators for Wearables (DROPSAW) project aimed to build a semi-realistic Active Wearable Test rig (AWT)and use it for improving the durability, and hence safety, of soft wearable actuators. This report sum-marises the methods and results of using the AWT to perform fatigue, failure, and performance testson a first prototype (P1) of a soft actuator. It also presents progress on a second prototype (P2) de-signed to improve on the durability shortcomings of P1.
Based on the results from this project, we recommend the AWT’s motion be automated, a thermalcamera used to monitor the actuator being tested, friction degradable material be placed where theactuator contacts the AWT’s leg, and that the AWT’s leg be inspected for permanent depressions aftertesting. Additionally, we recommend the soft actuators be designed so they remain aligned with thejoint they actuate over many actuation cycles, their inlet holes are as large as possible, and their dead-volume is minimised.
ii

Contents
1 Introduction 1
2 Prototype 1 22.1 Fatigue testing . . . . . . . . . . . . . . . . . . . . . . . . . . . . . . . . . . . . . . . . . . . . . 32.2 Failure testing . . . . . . . . . . . . . . . . . . . . . . . . . . . . . . . . . . . . . . . . . . . . . 92.3 Conclusions . . . . . . . . . . . . . . . . . . . . . . . . . . . . . . . . . . . . . . . . . . . . . . 12
3 Prototype 2 133.1 Design . . . . . . . . . . . . . . . . . . . . . . . . . . . . . . . . . . . . . . . . . . . . . . . . . 133.2 Proposed test methods . . . . . . . . . . . . . . . . . . . . . . . . . . . . . . . . . . . . . . . . 17
4 Conclusions 184.1 Guidelines for durability testing of soft and wearable actuators . . . . . . . . . . . . . . . . 184.2 Guidelines for design of reliable soft and wearable actuators . . . . . . . . . . . . . . . . . 18
A Risk analysis of the active wearable test rig (AWT) IIA.1 Mechanical failure . . . . . . . . . . . . . . . . . . . . . . . . . . . . . . . . . . . . . . . . . . IIA.2 Electrical failure . . . . . . . . . . . . . . . . . . . . . . . . . . . . . . . . . . . . . . . . . . . . IVA.3 Software failure . . . . . . . . . . . . . . . . . . . . . . . . . . . . . . . . . . . . . . . . . . . . V
iii

1 Introduction
Robotic exoskeletons have extensive applications in rehabilitation therapy due to their capacity toassist physically impaired people with performing repetitive exercises. One of the most outstandingapplication for an exoskeleton is in stroke rehabilitation. Powered exoskeletons can assist those withlower extremity weakness to walk. With the help of actuators, these exoskeletons assist leg joint mo-tion to automate walking. [1]
The traditional approach for an exoskeleton is a jointed rigid structure, which is heavy. The naturalmovement of the wearer is limited due to exoskeletons’ hard frames and nonbackdrivable actuatortransmissions. [2] A radically different approach is the use of flexible, elastic materials that are softand compliant to inherently offer safety, backdrivability, increased range of motion and adaptation tocomplexly shaped bodies.
The aim of the DROPSAW project was to create an active wearable test rig (AWT), and use it to optimisethe safety and comfort of active wearable structures through extensive fatigue (accelerated lifetime)and failure (overloading) test protocols.
An exosuit based on the Pleated Pneumatic Interference Actuator (PPIA) was developed with one de-gree of freedom (DOF). It was powerful enough to provide the torques required for all normal activitiesof daily living (ADLs). The AWT was used to evaluate how the actuator design failed due to fatigue andfailure testing. These results were used to further improve the actuator design for safety. The resultingdesign and test guidelines are useful for formulating test protocols, as used in the EU Horizon2020COVR project, [3] for validating the safety of soft actuators used in wearables.
This document reports the design, testing methods, results, and conclusions for a first prototype (P1)exosuit using the PPIA. It also describes how these conclusions led to the improvement of the testingprotocols and P1’s design (as implemented in a second prototype, P2). Finally, the guidelines for thedurability testing and design of reliable of soft and wearable actuators are presented in the conclu-sions. The reader is advised to refer to the report from the first milestone for a detailed description ofthe use and working of the AWT used in this report. [4]
1
2 Prototype 1
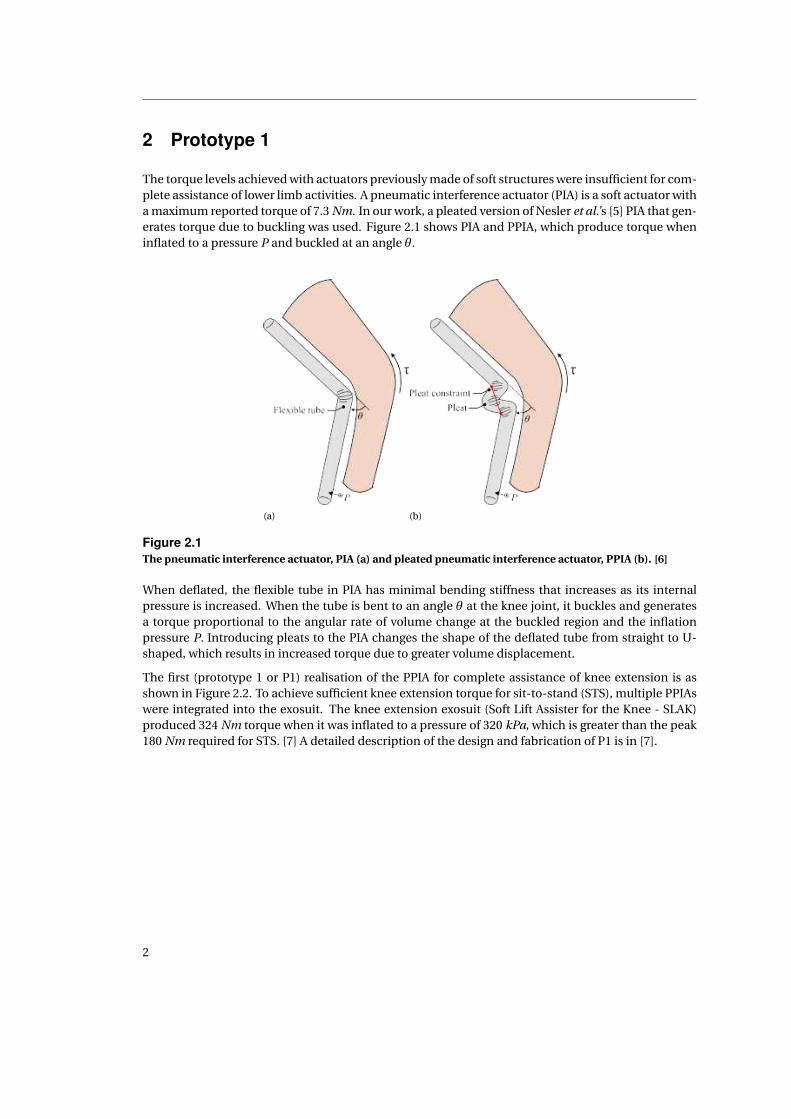
The torque levels achieved with actuators previously made of soft structures were insufficient for com-plete assistance of lower limb activities. A pneumatic interference actuator (PIA) is a soft actuator witha maximum reported torque of 7.3 Nm. In our work, a pleated version of Nesler et al.’s [5] PIA that gen-erates torque due to buckling was used. Figure 2.1 shows PIA and PPIA, which produce torque wheninflated to a pressure P and buckled at an angle θ.
(a) (b)
Figure 2.1The pneumatic interference actuator, PIA (a) and pleated pneumatic interference actuator, PPIA (b). [6]
When deflated, the flexible tube in PIA has minimal bending stiffness that increases as its internalpressure is increased. When the tube is bent to an angle θ at the knee joint, it buckles and generatesa torque proportional to the angular rate of volume change at the buckled region and the inflationpressure P. Introducing pleats to the PIA changes the shape of the deflated tube from straight to U-shaped, which results in increased torque due to greater volume displacement.
The first (prototype 1 or P1) realisation of the PPIA for complete assistance of knee extension is asshown in Figure 2.2. To achieve sufficient knee extension torque for sit-to-stand (STS), multiple PPIAswere integrated into the exosuit. The knee extension exosuit (Soft Lift Assister for the Knee - SLAK)produced 324 Nm torque when it was inflated to a pressure of 320 kPa, which is greater than the peak180 Nm required for STS. [7] A detailed description of the design and fabrication of P1 is in [7].
2

(a) (b) (c)
Figure 2.2Soft Lift Assister for the Knee (SLAK) in seated position (a), standing position (b), and on the AWT (c). Notethat in this study the SLAK from [7] has a padded interior (for increased comfort and grip between the leg andSLAK fabric). The padding was 3 mm thick.
2.1 Fatigue testing
Fatigue testing is a form of mechanical testing performed by applying cyclic loading to a structure.These tests help us evaluate the fatigue life and demonstrate the safety of the structure that is sus-ceptible to fatigue. In this study, fatigue testing was carried out by subjecting the SLAK to the loadconditions it would experience during its service life and assessing its performance. During the fa-tigue tests, P1 was subjected to a total of 6000 cycles. The source pressure was 450 kPa for the first3000 cycles, which was then increased to 650 kPa for the next 3000 cycles. The maximum actuatorpressure was 350 kPa. By increasing the source pressure, the inflation time was reduced from an av-erage of 5 s to 2.9 s. This is shown in Figure 2.3. Increasing source pressure was tested as a meansof accelerating the fatigue test. After every 1000 cycles, performance data was collect to evaluate thedecrease in performance of P1.
The AWT was built to test and optimise the safety of active wearable structures, and later, improve theirdesign. Its use and working is detailed in [4]. The schematic diagram of the AWT is shown in Figure 2.4.It consists of an instrumented leg (5 - see numbering in Figure 2.4) onto which the SLAK was attached.In order to mimic the compressibility of human tissue, the leg has an aluminium skeleton surroundedby soft polyurethane ‘tissue.’
A risk analysis of the AWT is in Appendix A. Based on this risk analysis, appropriate safety precautionswere taken when conducting all the testing described below.
3
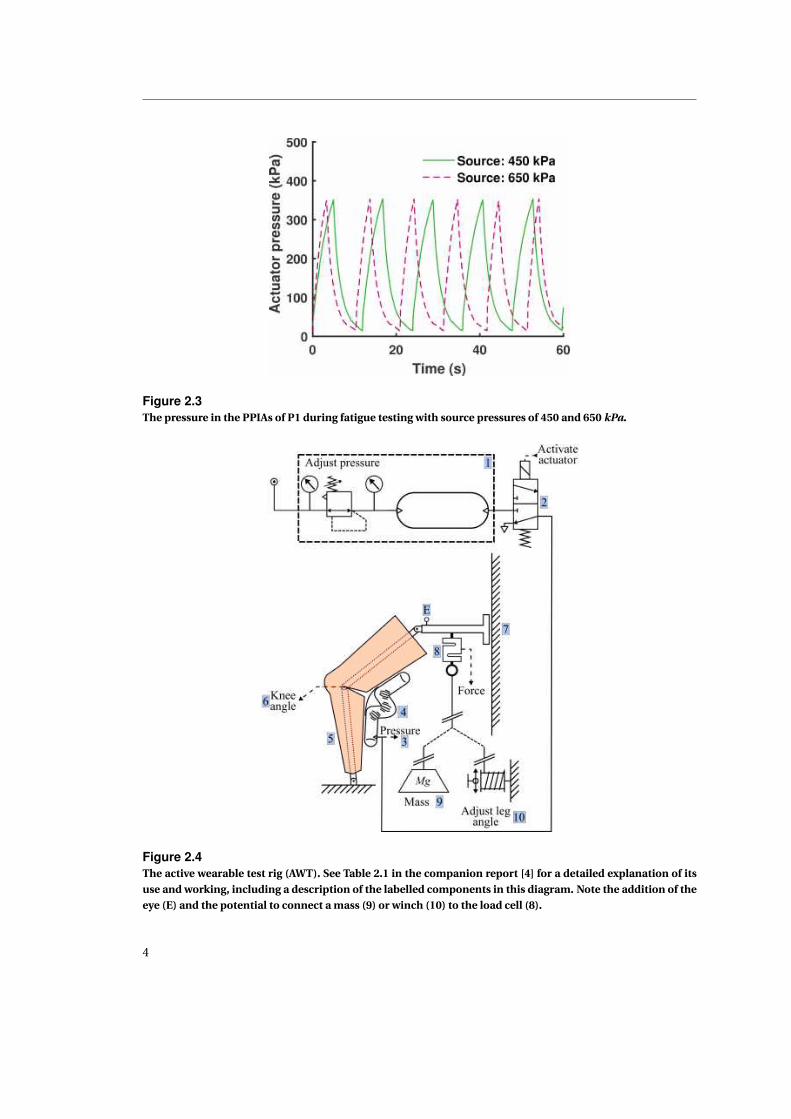
Figure 2.3The pressure in the PPIAs of P1 during fatigue testing with source pressures of 450 and 650 kPa.
Figure 2.4The active wearable test rig (AWT). See Table 2.1 in the companion report [4] for a detailed explanation of itsuse and working, including a description of the labelled components in this diagram. Note the addition of theeye (E) and the potential to connect a mass (9) or winch (10) to the load cell (8).
4
2.1.1 Alignment method
Before carrying out a fatigue, performance, or failure test the following steps were carried out:
1. After fitting the SLAK, but before fully tightening all the velcro straps, lock the AWT leg so itsknee joint is fully flexed.
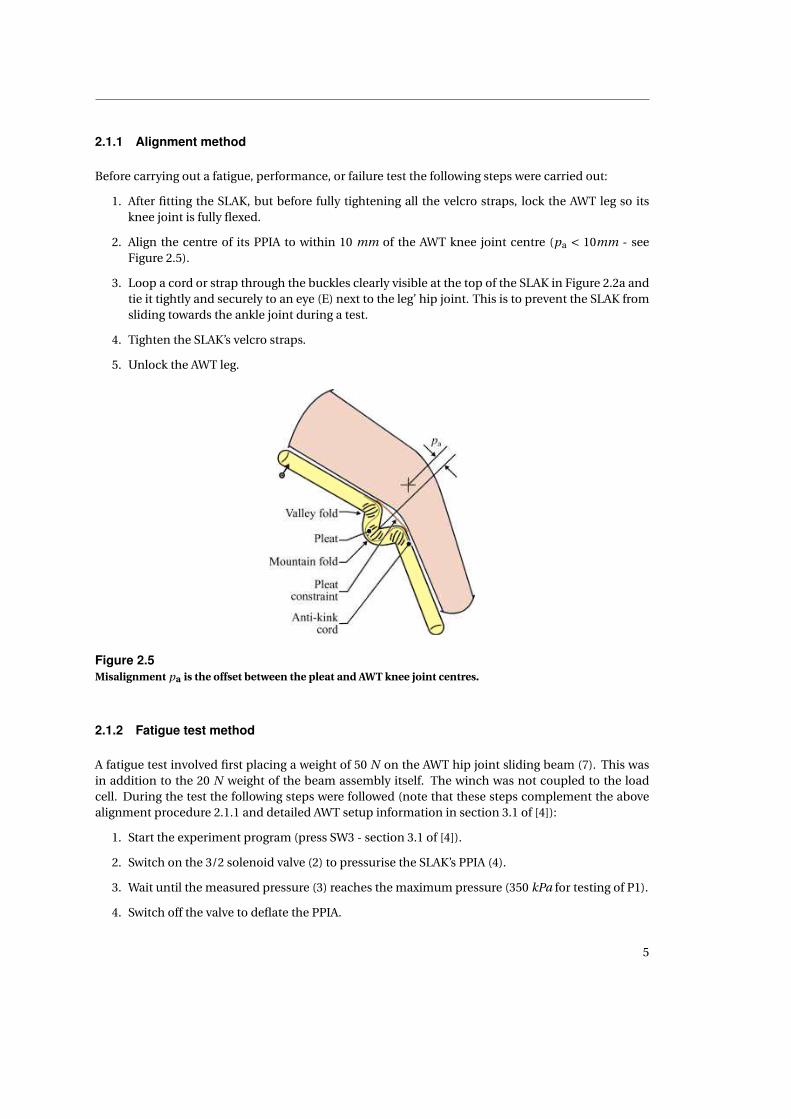
2. Align the centre of its PPIA to within 10 mm of the AWT knee joint centre (pa < 10mm - seeFigure 2.5).
3. Loop a cord or strap through the buckles clearly visible at the top of the SLAK in Figure 2.2a andtie it tightly and securely to an eye (E) next to the leg’ hip joint. This is to prevent the SLAK fromsliding towards the ankle joint during a test.
4. Tighten the SLAK’s velcro straps.
5. Unlock the AWT leg.
Figure 2.5Misalignment pa is the offset between the pleat and AWT knee joint centres.
2.1.2 Fatigue test method
A fatigue test involved first placing a weight of 50 N on the AWT hip joint sliding beam (7). This wasin addition to the 20 N weight of the beam assembly itself. The winch was not coupled to the loadcell. During the test the following steps were followed (note that these steps complement the abovealignment procedure 2.1.1 and detailed AWT setup information in section 3.1 of [4]):
1. Start the experiment program (press SW3 - section 3.1 of [4]).
2. Switch on the 3/2 solenoid valve (2) to pressurise the SLAK’s PPIA (4).
3. Wait until the measured pressure (3) reaches the maximum pressure (350 kPa for testing of P1).
4. Switch off the valve to deflate the PPIA.
5

5. Wait until the measured pressure is below 10 kPa.
6. Repeat above steps 2–5 1000 times (this is done automatically by the experiment program).
7. Stop the experiment program by pressing SW3 again.
2.1.3 Performance test method
A performance test was executed with a weight of 50 N on the AWT hip joint sliding beam (7). The testinvolved (again complementing the alignment procedure 2.1.1 and AWT setup information in section3.1 of [4]):
1. Prior to starting the experiment program, allow the leg to rest against its end stop with the kneein the fully flexed position.
2. Couple the load cell to the winch cable (10). Hence both the gravitational force of the weighton the sliding beam (7) and the force exerted by the winch are simultaneously acting on the hipjoint of the AWT leg.
3. Turn the winch until there is a slight tension (< 5 N) in its belt. Lock its ratchet in position so thetension is held.
4. Pressurise the PPIA to the desired test pressure (350 kPa for testing of P1). The leg should not beable to extend due to the winch restraining it.
5. When the experiment program is running, firmly grasp the winch’s handle and slowly and smoothlyunwind it so the leg can extend.
6. Continue unwinding until the measured winch belt force (8) is negligible (< 5 N). The extensionshould take at least 10 s.
7. Stop the experiment program.
8. Depressurise the PPIA.
This test characterised the torque produced by the SLAK from a fully flexed to an extended position.It also enabled us calculate the maximum torque reached by the SLAK and the energy produced overits extension (the area under a plot of torque versus knee angle).
2.1.4 Results
During the first block of 1000 cycles in the fatigue test it was observed that P1 slipped down the testleg, resulting in a misalignment of several centimetres. Slipping occurred over the first several dozencycles, after which the misalignment did not noticeably increase. In blocks from 4000 cycles onwardsthe slippage occurred at a faster rate. The misalignment reduced the effectiveness of the torque trans-mission from P1 to the test leg, decreasing the obtained knee extension during each cycle. Hence,during the 1000 cycle blocks from 1000 cycles onwards, the experiment was paused every 200–300cycles and the exosuit realigned (following section 2.1.1) before resuming the experiment. The hopebeing to mitigate the effect of the downwards slippage of the prototype on the fatigue test results.
Figure 2.6a shows the maximum torque recorded during three performance tests of P1 after every 1000cycles of the fatigue test. The average maximum torque at 0 cycles and a source pressure of 450 kPawas 272 Nm. The average value of maximum torque was reduced to 235 Nm after 3000 cycles, showinga decrease in performance of the actuator of 13.6%. Next, the source pressure was increased to 650 kPa
6

and there was further decrease in the maximum torque as the number of cycles increased. After 6000cycles, the average value of maximum torque was 216 Nm, a decrease of 20.6% compared to the 0cycle value. There was a variation in the maximum torque of nearly 10 Nm during the performancetests at 2000 and 6000 cycles. The average maximum torque was approximately 235 Nm from 2000–4000 cycles.
(a)
(b)
Figure 2.6Performance test maximum torque (a) and energy (b) as recorded during fatigue testing of P1 with sourcepressures of 450 kPa and 650 kPa.
The energy generated during each of these performance tests is shown in Figure 2.6b. The energy wascalculated using the ‘trapz’ function in MATLAB, which computes the approximate integral using thetrapezoidal method. The average energy reduced to 68.7% of the value recorded at 0 cycles after 3000cycles. The average energy further reduced to 58% after 6000 cycles.
7

Notable variation of 3–6 J was recorded at 2000, 4000, and 5000 cycles. Accounting for the variabil-ity shows a drop in energy from around 84 J at 0 cycles to somewhere between 52 and 63 J for theperformance tests executed at 1000–4000 cycles. The final energy value recorded for the 5000 and6000 cycle performance tests was between 42 and 50 J. Thus, the trend followed a decrease (0–1000cycles), then a plateau (1000–4000 cycles), then a decrease (4000–5000 cycles), and another plateau(5000–6000 cycles).
Although the performance of P1 decreased over the course of the fatigue test, its PPIAs did not appearto physically wear in any way.
During the fatigue test an interesting observation made was that the padding between P1 and the testleg wore over the tests. This can be seen by the deposition of the black padding material on the yellowtest leg in Figures 2.7a and 2.7b. Permanent depressions in the test leg (Figure 2.7c) also showed wherehigh normal pressures were applied to the leg (in this case by plastic buckles).
(a) (b) (c)
Figure 2.7Movement of P1 over the AWT’s leg resulted in wear of the P1’s padding, as evidenced by the black smudges onthe shin (a) and rear of the leg (b). Also visible are the permanent depressions circled in red in (c) on the frontof the knee.
Another observation made was that the lower part of P1’s PPIAs cooled and the upper part increased intemperature over the course of the fatigue test. Where exactly and to what extent was not determined.
2.1.5 Discussion
First, although the results indicate a definite decrease in P1’s performance (as characterised by maxi-mum torque and energy) over 6000 cycles, there are several factors that call into question the accuracyof the fatigue test.
The fatigue test did not consistently load the PPIAs as P1 slipped downwards over a number of cycles.Attempts to correct this during the test did not succeed. This is important as the downwards slippage
8
meant the PPIAs were misaligned with the AWT’s knee joint, which as observed here and in [7], re-sulted in decreased actuator torque production, and hence decreased maximum knee extension anddecreased energy. Thus, more attention must be given to ensuring the SLAK cannot slip downwards.Potential solutions could include testing the SLAK in the horizontal plane and replacing the cords thatanchor SLAK to the hip joint with a flexible structure that cannot creep or stretch.
A notable feature of the performance test results is the variability in maximum torque or energy ofsome of the tests for a given number of cycles. We believe this was due to misalignment and the tests’reliance on manual winding of the winch and hence inconsistencies in the extension motion of P1.In particular, inconsistencies in starting knee angle and the steadiness and rate of extension. Mis-alignment could be resolved with the suggestions made above, and inconsistencies in the extensionmotion by automating it.
Given the variability in the performance test results and other factors influencing the accuracy of thefatigue test, no conclusion can be drawn on the effect of a higher source pressure on these results.What can be concluded is that a higher source pressure decreases inflation time and that the perfor-mance of P1 decreased at both source pressures tested. Hence, when the accuracy of the performanceand fatigue tests is increased, the use of higher source pressures to accelerate fatigue testing shouldbe re-evaluated.
The wear of the padding is indicative of not only downwards slippage, but rubbing, or relative motionbetween the leg’s ‘skin’ and P1. It could be this wear that contributed to the increased rate of slippageafter 4000 cycles. Such wear indication is a highly useful yet unexpected outcome of the fatigue testas it shows where, and how much rubbing occurred. Both rubbing and normal pressure are factorsthat can easily cause severe skin damage [8, 9] and must be prevented to ensure the safety of a personwearing P1. Thus, the fatigue test not only can be used to show how the SLAK degrades over time, buthow its design must be altered for user comfort and safety.
Contributing to the temperature changes in the PPIAs of P1 were expansion of the air as it exhaustsfrom the inlets during each cycle and rubbing of P1’s padding against the test leg. The inlet was locatedin the lower part of the PPIAs and became particularly cold to touch as a fatigue test block progressed.Friction and rubbing between the leg and P1 could generate heat, explaining the warmth of the up-per part of its PPIAs. These effects are worth further investigating as temperature may influence theproperties of the materials in the SLAK and hence the results of a fatigue test. This could be done, forexample, with a thermal camera.
Last, a general observation of the fatigue tests is the relatively slow inflation, and particularly defla-tion, times of the PPIAs in P1. Addition of weight to the sliding beam did decrease the deflation time,and a higher source pressure decreased the inflation time. However, the large volume of P1’s PPIAs(about 5 l total) and small inlet hole diameter (5 mm) placed a fundamental limit on actuation speed.Reducing the dead-volume of the PPIAs and increasing the size of the inlet holes would increase theobtainable actuation speed. This is not only a performance benefit, but also enables fatigue testing tobe accelerated.
2.2 Failure testing
Safety is essential to wearable devices such as exoskeletons and exosuits. It is insufficient to only un-derstand how they work; it is also important to know how and when the system will fail. In inflatables,a failure or burst test is performed to determine the maximum pressure capacity of pressure contain-ing parts, which in our case, is the actuator. To verify the durability of the SLAK, it is important to
9

characterise the burst pressure of the PPIAs, which is when the system completely fails due to over-pressurisation.
2.2.1 Failure test method
To achieve a high source pressure during the failure test, a larger compressor (B2800B-50 CM3 V230,Herkules) was used instead of the 15 l air reservoir which was used previously. The failure test wascarried out without extra weight added to the sliding beam and by following these steps (again com-plementing the alignment procedure in section 2.1.1 and AWT setup information in section 3.1 of [4]):
1. Prior to starting the experiment program, ensure the winch is not coupled to the load cell.
2. Allow the leg to rest against the knee’s end stop in the flexed position.
3. Reset the source pressure to 0 kPa by adjusting the compressor’s regulator.
4. Switch on the 3/2 solenoid valve.
5. Start the experiment program.
6. Slowly and smoothly turn the compressor’s pressure regulator knob to gradually pressurise theSLAK’s PPIAs. This should be done at a rate of no more than 3 kPa/s to ensure the experiment isquasistatic (the inflation dynamics of the actuator do not influence the results of the test).
7. Continue increasing the source pressure the target pressure is reached or until the actuatorbursts, or significant leakage occurs. If bursting or excessive leakage occurs go to step 9.
8. If the target pressure is reached, wait for 60 s, stopping if the actuator bursts, or significant leak-age occurs. If bursting or excessive leakage occurs go to step 9.
9. Stop the experiment program.
10. Switch off the valve.
In the first failure test the target pressure was set to 700 kPa, and as the PPIAs did not burst or exces-sively leak a second test was carried out to the maximum pressure of the compressor.
2.2.2 Results
Figure 2.8 shows the PPIAs in P1 were able to withstand the maximum source pressure of the compres-sor, 882.2 kPa, resulting in a knee angle of 26 °. During the test, the PPIAs’ pressure vessels remainedintact, but there was some leakage near the PPIAs’ inlet connectors. The amount of leakage increasedas the pressure increased. This also occurred during the first test with a target pressure of 700 kPa.The leakage occurred in two of P1’s PPIAs around the washer used to clamp the inlet connector to thePPIAs’ tubes. Its location is indicated in Figure 2.9.
An additional observation was that the PPIAs became exceptionally warm.
10

Figure 2.8The source pressure applied to the PPIAs of P1 during failure testing. Progression of time is indicated by thearrow, showing pressure increased with time, and knee angle decreased with time.
Figure 2.9Leakage occurred around the base of the inlet connectors (as indicated by the red arrows).
2.2.3 Discussion
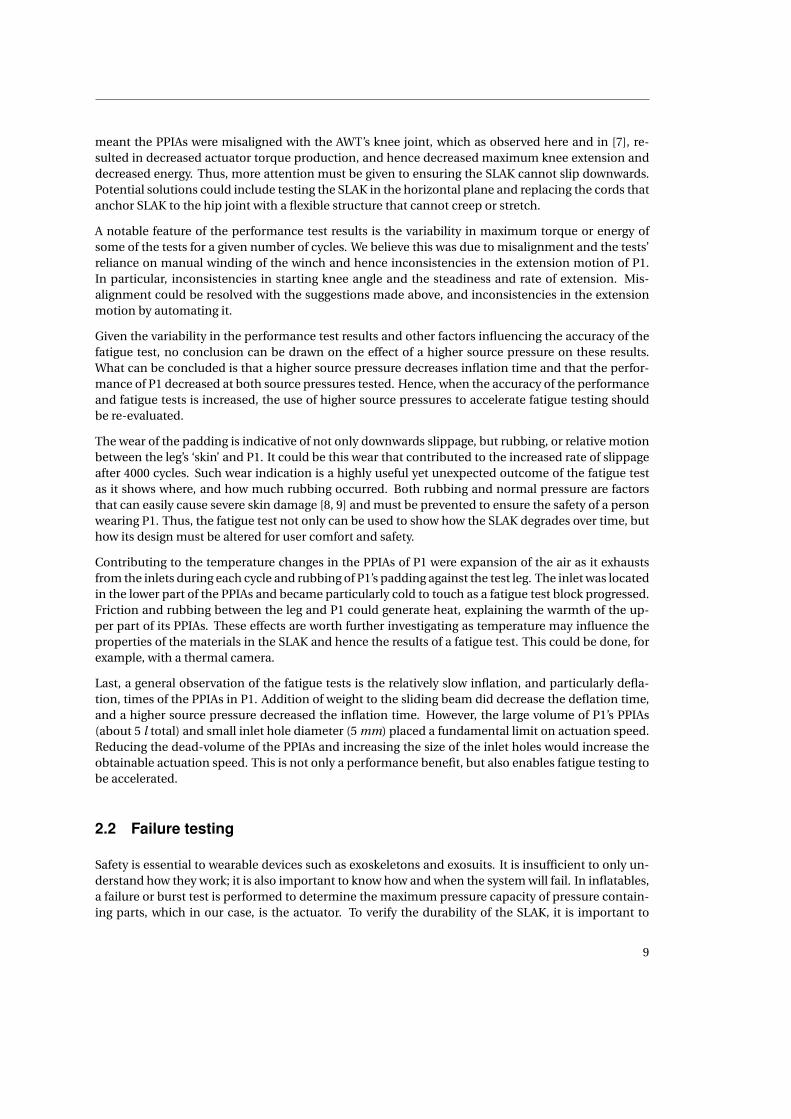
The inlet connectors in P1’s PPIAs were glued, stitched, and clamped onto the PPIAs’ tubing. In orderto prevent leakages near the inlet connectors, as occurred in the failure tests, the stitching around thebase of the connectors needs to be eliminated. Instead, mechanical fastening and strain relief of theconnector should be achieved using only clamping. This is shown schematically in Figure 2.10, wherethe inlet connector is pressed through a hole in the PPIA’s flexible tube and clamped in place with anut and washer. A sealant prevents air leakage through the hole in the PPIA tube wall.
The increase in temperature of the PPIAs was due to the high temperature of the air supplied to them,a result of compressing the air to a high pneumatic pressure. Ideally, the air would be cooled to roomtemperature before pressurising the PPIAs. This would require the addition of an air aftercooler to thecompressor.
The failure testing demonstrated, the sealing of the ends of the PPIA’s flexible tube was able to with-
11
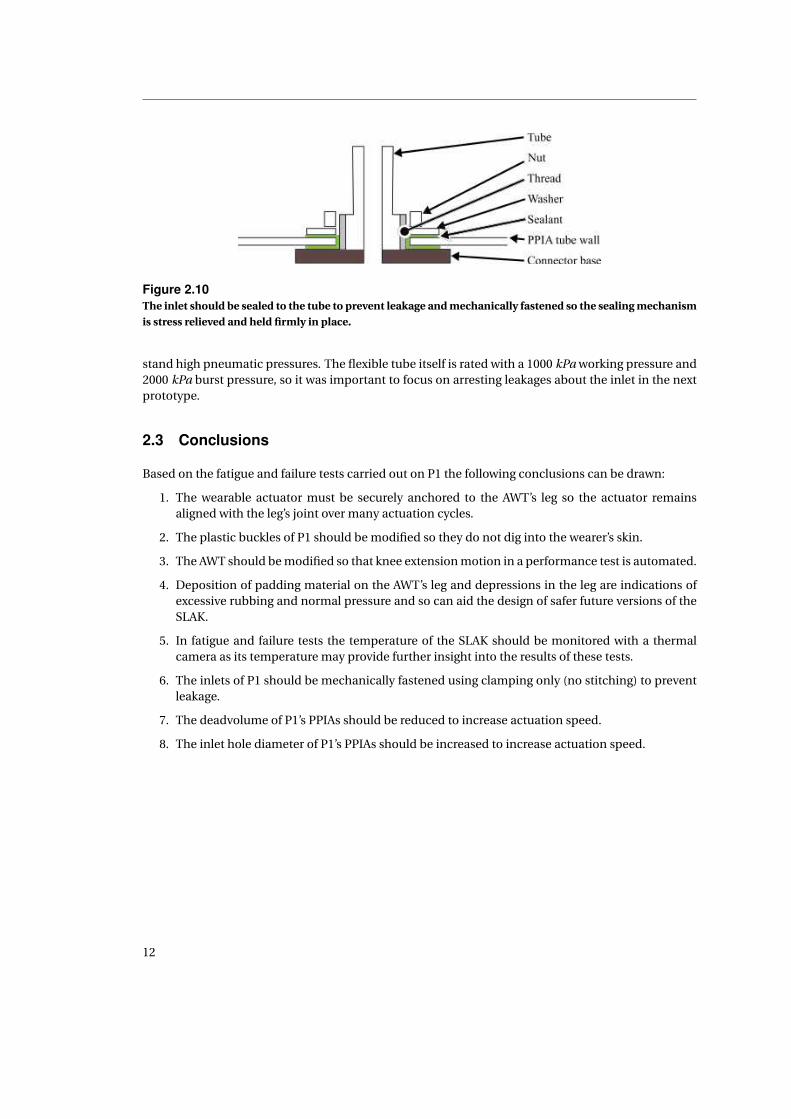
Figure 2.10The inlet should be sealed to the tube to prevent leakage and mechanically fastened so the sealing mechanismis stress relieved and held firmly in place.
stand high pneumatic pressures. The flexible tube itself is rated with a 1000 kPa working pressure and2000 kPa burst pressure, so it was important to focus on arresting leakages about the inlet in the nextprototype.
2.3 Conclusions
Based on the fatigue and failure tests carried out on P1 the following conclusions can be drawn:
1. The wearable actuator must be securely anchored to the AWT’s leg so the actuator remainsaligned with the leg’s joint over many actuation cycles.
2. The plastic buckles of P1 should be modified so they do not dig into the wearer’s skin.
3. The AWT should be modified so that knee extension motion in a performance test is automated.
4. Deposition of padding material on the AWT’s leg and depressions in the leg are indications ofexcessive rubbing and normal pressure and so can aid the design of safer future versions of theSLAK.
5. In fatigue and failure tests the temperature of the SLAK should be monitored with a thermalcamera as its temperature may provide further insight into the results of these tests.
6. The inlets of P1 should be mechanically fastened using clamping only (no stitching) to preventleakage.
7. The deadvolume of P1’s PPIAs should be reduced to increase actuation speed.
8. The inlet hole diameter of P1’s PPIAs should be increased to increase actuation speed.
12

3 Prototype 2
The aim of the second prototype (P2) of the SLAK was to improve on the durability of P1 and theaccuracy of the fatigue and failure testing methods used to test it. This was done by applying thelessons learnt in chapter 2 (listed in section 2.3). This chapter summarises the current progress ofdesigning P2 and the proposed changes to the AWT and test methods.
3.1 Design
The current design of P2 is shown in Figure 3.1. It currently uses a single PIA instead of multiple PPIAto simplify the fabrication process and increase its durability (by eliminating the stress concentrationsthat occur at the pleats and pleat constraints in a PPIA). If the actuator is not able to provide sufficienttorque for STS, it will be replaced by multiple PIAs or PPIA(s).
Conclusions 1, 2, 6, 7, and 8 from section 2.3 directly motivated the design of P2:
• Secure anchoring of the SLAK: A commercially available hinged knee brace (DonJoy PlaymakerII Spacer Wrap, DJO Global Inc., Vista, CA) was used to secure the SLAK to the body (Figure 3.2a).Non-slip silicone knob-patterned bands will be sewn to its inside to minimise slip (Figure 3.2b).It was reinforced with 1000 denier CORDURA fabric to provide a nonstretchable and strong basefabric for fastening actuators onto. The padded metal bars along the side of the orthosis give itstability. Holes will be made in the top and bottom of these bars so the top can be fastened to theeye (E - see Figure 2.4) in the sliding beam with webbing and a ratcheting tie down. If additionalsupport is required, lightweight flexible rods will be attached between the bottom holes and theAWT leg’s skeleton.
• No components of the SLAK should dig into the skin: The knee brace used in P2 is optimisedfor comfort in everyday use. After any modifications are made to it (such as attaching the PIA),its comfort will be reassessed to ensure it does not dig into the skin.
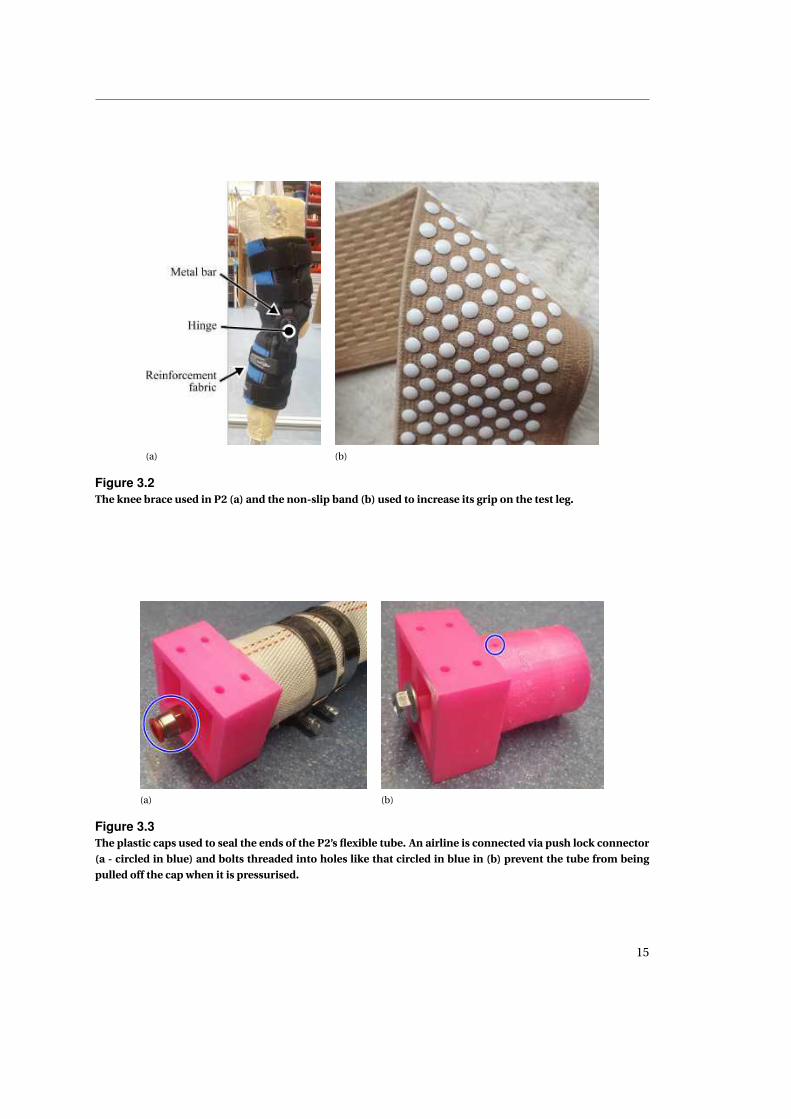
• The inlets of the SLAK’s PPIAs should be mechanically fastened using clamping only: The in-lets have been replaced with a different system that does not rely on stitching. This method ofconnecting the air to the actuator ensures that no mechanical stress is directly applied to thesealing mechanisms. Figure 3.3a shows how in P2 the PIA flexible tube is clamped to a plasticcap with two hose clamps. Silicone sealant was smeared around the outside of the cap for seal-ing. The flexible tube is prevented from sliding off the cap with bolts that pierce the flexible tubeand thread into the cap (Figure 3.3b). A 10 mm pneumatic airline is connected to the cap with apush lock connector (QS-G1/4-10, Festo, Esslingen, Germany) threaded into its end and sealedwith an o-ring (Figure 3.3a).
• The inlet hole diameter of the SLAK’s PPIAs should not be too small: The minimum inlet holediameter has been increased to 6 mm over a length of about 10 mm (instead of 5 mm over alength of 30 mm. Further, the internal diameter of the airline pressurising the actuator has beenincreased from 6.75 to 8.5 mm.
• The dead-volume of the SLAK’s PPIAs should be minimised: This problem has been solvedby adopting the approach of Sridar et al. [10] and using rigid structures to apply the torquegenerated by the buckling portion of the actuator. This eliminates the need for long segments ofactuator tube either side of the buckling region to be used to transmit torque from the actuatorto its load. Thus, the actuator dead-volume is significantly reduced. In P2, the rigid structures
13

take the form of plastic plates connected to the caps at either end of the PIA’s flexible tube (Figure3.4).
(a) (b)
(c) (d)
Figure 3.1The current state of prototype 2 in the extended (a) and flexed (b) positions from the side. Additional viewsfrom the rear (c) and when worn (d).
14
(a) (b)
Figure 3.2The knee brace used in P2 (a) and the non-slip band (b) used to increase its grip on the test leg.
(a) (b)
Figure 3.3The plastic caps used to seal the ends of the P2’s flexible tube. An airline is connected via push lock connector(a - circled in blue) and bolts threaded into holes like that circled in blue in (b) prevent the tube from beingpulled off the cap when it is pressurised.
15

(a) (b)
Figure 3.4The top (a) and bottom (b) plastic plates that transmit the torque generated by P2’s PIA to the leg.
16

3.2 Proposed test methods
The testing of P1 highlighted that the performance test knee extension motion should be automatedand the temperature of the actuator monitored in the fatigue and failure tests. The AWT will be modi-fied as shown in Figure 3.5 so that an electromechanical linear actuator (ELA) can be connected to thesliding beam via the load cell. Further a thermal camera (TC) will be used to monitor the temperatureprofile of P2 as it is tested.
Figure 3.5P2 should be tested with the addition of a thermal camera (TC) to monitor its temperature and during perfor-mance tests an electromechanical linear actuator (ELA) should be connected to the load cell to automate theknee extension motion (instead of a mass or the winch).
17

4 Conclusions
Although P2 could not be completed and tested to compare its fatigue and failure test results withthose of P1, we believe a number of important guidelines can be given for the durability testing anddesign of reliable, soft, and wearable actuators.
The reason P2 could not be completed and reassessed for milestone 2 was due to university imposedcampus closure in response to the COVID-19 pandemic. The facilities we used for our testing andprototype development were closed until June, after which up to two people were allowed in the roomwhere the AWT is located. As this space is a workshop used by technicians, and is currently open from9:00–17:00 during weekdays, we could only use it once or twice a week until the end of July, whenrestrictions were changed to allow four people in the room. However, this coincided with the projectend.
Hence, P2’s development was largely carried out using limited resources available at home and pro-gressed slower than anticipated. Further, the findings from the first testing iteration were more ex-tensive than expected (for instance, modifications of the AWT), requiring more time than allowed inthe project time frame to implement them and move on to the testing of P2. On a positive note, thisresulted in a good number of testing and design guidelines, as listed below.
4.1 Guidelines for durability testing of soft and wearable actuators
• The AWT performance test motion should be completely automated for consistent results.
• The temperature of the actuator on the AWT should be monitored with a thermal camera duringfatigue and failure tests. This can provide insight into where abrasion in the actuator, or betweenit and the AWT occurs. It can also indicate where potentially harmful temperatures are reacheddue to air compression or expansion.
• Friction degradable material should be placed between the actuator and the surface of theAWT’s leg such that excessive rubbing in a given location will leave visible traces on the actu-ator or AWT leg.
• The AWT’s leg should be inspected for permanent depressions after testing sessions as theseindicate excessive normal pressures applied by the actuator.
4.2 Guidelines for design of reliable soft and wearable actuators
• The actuator should be designed such that it can be securely anchored to the AWT’s leg so itremains aligned with the leg’s knee joint even after many cycles. This is important as actuatormisalignment can reduce the accuracy of the test results.
• The sealing and stress relief of the actuator’s inlet connection should be carefully designed asthis is a location vulnerable to leakage.
• The actuator’s inlet hole diameter should be maximised for maximal actuation speed.
• The actuator’s dead-volume should be minimised for maximal actuation speed.
18

References
[1] Di Shi, Wuxiang Zhang, Wei Zhang, and Xilun Ding. A review on lower limb rehabilitation ex-oskeleton robots. Chinese J. Mech. Eng., 32(1):74, 2019.
[2] Allan Joshua Veale and Shane Quan Xie. Towards compliant and wearable robotic orthoses: Areview of current and emerging actuator technologies. Med. Eng. Phys., 38(4):317–25, 2016.
[3] Horizon2020 grant agreement No. 779966. COVR: Welcome to safety. https://safearoundrobots.com/, 2020.
[4] Allan J Veale. Use instructions and working of the active wearable test rig v2.0. Technical report,2019.
[5] Christopher R Nesler, Tim A Swift, and Elliott J Rouse. Initial design and experimental evaluationof a pneumatic interference actuator. Soft Robotics, 5(2):138–48, 2018.
[6] Allan J Veale, Kyrian Staman, and Herman van der Kooij. Realizing soft high torque actuatorsfor complete assistance wearable robots. In Int. Symp. Wearable Robotics, pages 39–43. Springer,2018.
[7] Allan Joshua Veale, Kyrian Staman, and Herman van der Kooij. Soft, wearable, and pleated pneu-matic interference actuator provides knee extension torque for sit-to-stand. Soft Robotics, 2020.
[8] Ashish Rathore, Matthew Wilcox, Dafne Zuleima Morgado Ramirez, Rui Loureiro, and Tom Carl-son. Quantifying the human-robot interaction forces between a lower limb exoskeleton andhealthy users. In 2016 38th Ann. Int. Conf. IEEE Eng. Med. Biol. Soc., pages 586–9, 2016.
[9] Yilin Wang, Jing Qiu, Hong Cheng, and Xiaojuan Zheng. Analysis of human–exoskeleton systeminteraction for ergonomic design. Human Factors, 2020.
[10] Saivimal Sridar, Souvik Poddar, Yida Tong, Panagiotis Polygerinos, and Wenlong Zhang. To-wards untethered soft pneumatic exosuits using low-volume inflatable actuator composites anda portable pneumatic source. IEEE Robot. Automat. Lett., 5(3):4062–9, 2020.
I
A Risk analysis of the active wearable test rig (AWT)
A.1 Mechanical failure
• Pneumatic tubing failure A push-lock pneumatic fitting connects the actuator hose and thepressurised air tube. The tube may get pulled from the fitting or get damaged. This may lead toinsufficient torque produced by the actuator for supporting itself.
Safety measures: The AWT leg has an end stop preventing more than 90° knee flexion. This limitshow far it can drop.
Action: Press the emergency stop button and close the manual valve to the air pressure supply.
• Air pressure supply failure When the air pressure supply fails, the actuator will no longer beable to deliver sufficient torque to support the AWT leg.
Safety measures: The AWT leg has an end stop preventing more than 90° knee flexion. This limitshow far it can drop.
Action: Press the emergency stop button and close the manual valve to the air pressure supply.
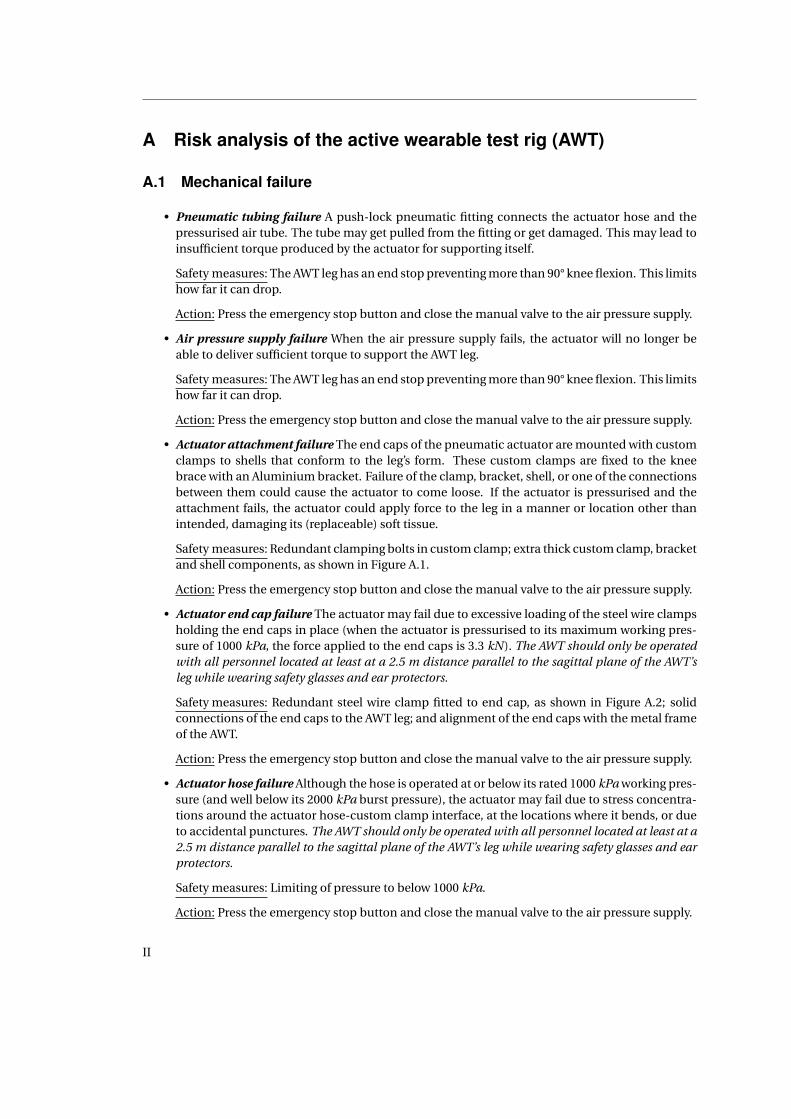
• Actuator attachment failure The end caps of the pneumatic actuator are mounted with customclamps to shells that conform to the leg’s form. These custom clamps are fixed to the kneebrace with an Aluminium bracket. Failure of the clamp, bracket, shell, or one of the connectionsbetween them could cause the actuator to come loose. If the actuator is pressurised and theattachment fails, the actuator could apply force to the leg in a manner or location other thanintended, damaging its (replaceable) soft tissue.
Safety measures: Redundant clamping bolts in custom clamp; extra thick custom clamp, bracketand shell components, as shown in Figure A.1.
Action: Press the emergency stop button and close the manual valve to the air pressure supply.
• Actuator end cap failure The actuator may fail due to excessive loading of the steel wire clampsholding the end caps in place (when the actuator is pressurised to its maximum working pres-sure of 1000 kPa, the force applied to the end caps is 3.3 kN). The AWT should only be operatedwith all personnel located at least at a 2.5 m distance parallel to the sagittal plane of the AWT’sleg while wearing safety glasses and ear protectors.
Safety measures: Redundant steel wire clamp fitted to end cap, as shown in Figure A.2; solidconnections of the end caps to the AWT leg; and alignment of the end caps with the metal frameof the AWT.
Action: Press the emergency stop button and close the manual valve to the air pressure supply.
• Actuator hose failure Although the hose is operated at or below its rated 1000 kPa working pres-sure (and well below its 2000 kPa burst pressure), the actuator may fail due to stress concentra-tions around the actuator hose-custom clamp interface, at the locations where it bends, or dueto accidental punctures. The AWT should only be operated with all personnel located at least at a2.5 m distance parallel to the sagittal plane of the AWT’s leg while wearing safety glasses and earprotectors.
Safety measures: Limiting of pressure to below 1000 kPa.
Action: Press the emergency stop button and close the manual valve to the air pressure supply.
II

Figure A.1The actuator is gripped by a PLA custom clamp with eight clamping bolts on each end. The clamp is bolted toa nylon shell, which is bolted to the Aluminium knee brace frame with Aluminium brackets.
Figure A.2The actuator hose is clamped to its end caps with redundant double wrapped steel wire wraps.
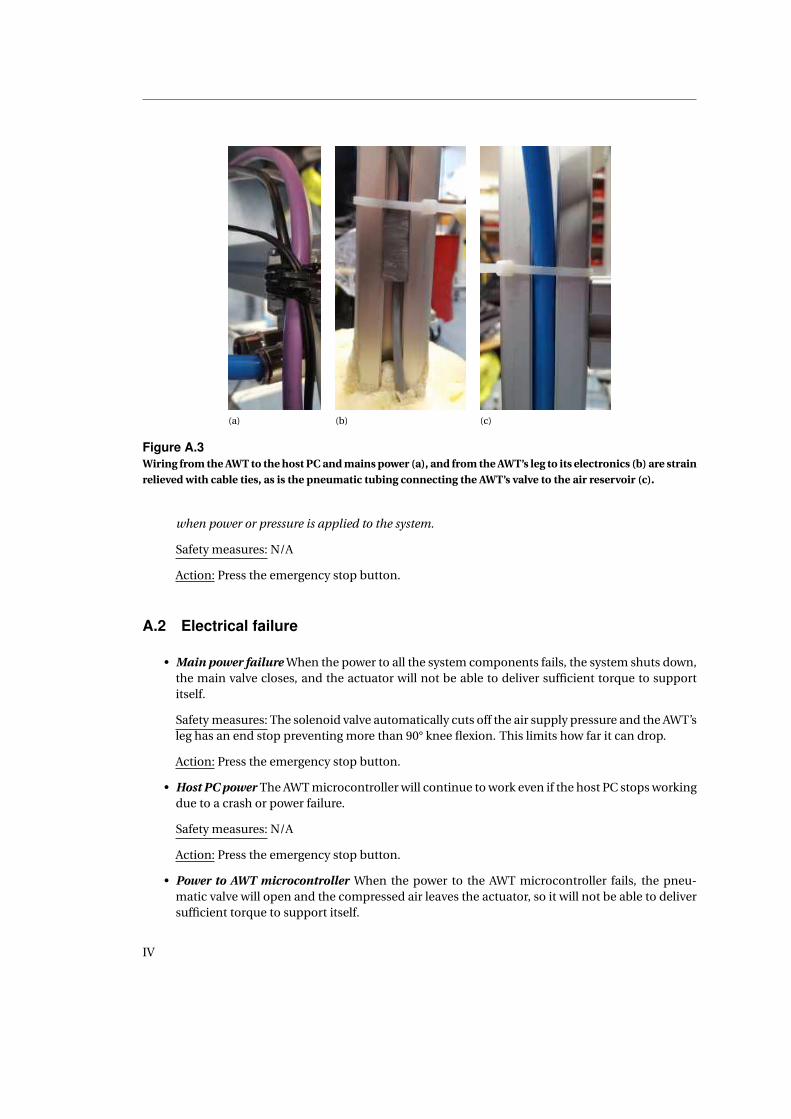
• Disconnection of sensor/actuator cables When the AWT is in use and the leg is constantly ex-tending/flexing, the cables that connect the linear actuator and the sensors to the AWT’s micro-controller and electronics may get disconnected. Due to this, sensor values may not be recorded,the linear actuator may stop, or the pressure supply tubing to the actuator may come loose.
Safety measures: All the cables and pneumatic tubing are fixed to the test rig using cable ties forstrain relief (Figure A.3).
Action: Press the emergency stop button.
• Contact with moving parts The hip joint, ankle joint and guided horizontal sliding beam cartare not covered and can cause harm if touched when in motion. Do not touch any of these parts
III
(a) (b) (c)
Figure A.3Wiring from the AWT to the host PC and mains power (a), and from the AWT’s leg to its electronics (b) are strainrelieved with cable ties, as is the pneumatic tubing connecting the AWT’s valve to the air reservoir (c).
when power or pressure is applied to the system.
Safety measures: N/A
Action: Press the emergency stop button.
A.2 Electrical failure
• Main power failure When the power to all the system components fails, the system shuts down,the main valve closes, and the actuator will not be able to deliver sufficient torque to supportitself.
Safety measures: The solenoid valve automatically cuts off the air supply pressure and the AWT’sleg has an end stop preventing more than 90° knee flexion. This limits how far it can drop.
Action: Press the emergency stop button.
• Host PC power The AWT microcontroller will continue to work even if the host PC stops workingdue to a crash or power failure.
Safety measures: N/A
Action: Press the emergency stop button.
• Power to AWT microcontroller When the power to the AWT microcontroller fails, the pneu-matic valve will open and the compressed air leaves the actuator, so it will not be able to deliversufficient torque to support itself.
IV
Safety measures: The solenoid valve automatically cuts off the air supply pressure and the AWT’sleg has an end stop preventing more than 90° knee flexion. This limits how far it can drop.
Action: Press the emergency stop button.
• Short circuit of the valve or linear actuator If the pneumatic valve plunger does not close, thehigh inrush current can cause the coil to overheat and burn out. Also, in the linear actuator,there is no built-in fuse that helps to protect against short circuits.
Safety measures: The solenoid valve automatically exhausts the actuator if its plunger cannotclose.
Action: Press the emergency stop button.
A.3 Software failure
Future software versions should include more built-in safety checks in the library.
• Software failure Any failure in the software or programming errors may cause unstable be-haviour of the AWT, affecting the extension and flexion of the leg. The AWT should only beoperated with all personnel located at least at a 2.5 m distance parallel to the sagittal plane ofthe AWT’s leg while wearing of safety glasses and ear protectors.
Safety measures: Include error checks and thoroughly check the code.
Action: Press the emergency stop button.
V


