12
• • •

Durham Research Online
Deposited in DRO:
19 August 2014
Version of attached �le:
Published Version
Peer-review status of attached �le:
Peer-reviewed
Citation for published item:
Kettula, K. and Finoguenov, A. and Massey, R. and Rhodes, J. and Hoekstra, H. and Taylor, J.E. andSpinelli, P.F. and Tanaka, M. and Ilbert, O. and Capak, P. and McCracken, H.J. and Koekemoer, A. (2013)'Weak lensing calibrated M-T scaling relation of galaxy groups in the COSMOS �eld.', Astrophysical journal.,778 (1). p. 74.
Further information on publisher's website:
http://dx.doi.org/10.1088/0004-637X/778/1/74
Publisher's copyright statement:
c© 2013. The American Astronomical Society. All rights reserved.
Additional information:
Use policy
The full-text may be used and/or reproduced, and given to third parties in any format or medium, without prior permission or charge, forpersonal research or study, educational, or not-for-pro�t purposes provided that:
• a full bibliographic reference is made to the original source
• a link is made to the metadata record in DRO
• the full-text is not changed in any way
The full-text must not be sold in any format or medium without the formal permission of the copyright holders.
Please consult the full DRO policy for further details.
Durham University Library, Stockton Road, Durham DH1 3LY, United KingdomTel : +44 (0)191 334 3042 | Fax : +44 (0)191 334 2971
http://dro.dur.ac.uk

The Astrophysical Journal, 778:74 (11pp), 2013 November 20 doi:10.1088/0004-637X/778/1/74C© 2013. The American Astronomical Society. All rights reserved. Printed in the U.S.A.
WEAK LENSING CALIBRATED M–T SCALING RELATION OF GALAXY GROUPSIN THE COSMOS FIELD∗
K. Kettula1, A. Finoguenov1, R. Massey2, J. Rhodes3,4, H. Hoekstra5, J. E. Taylor6,P. F. Spinelli7,8, M. Tanaka9, O. Ilbert10, P. Capak11, H. J. McCracken12, and A. Koekemoer131 Department of Physics, University of Helsinki, Gustaf Hallstromin katu 2a, FI-00014 Helsinki, Finland; [email protected]
2 Institute for Computational Cosmology, Durham University, South Road, Durham DH1 3LE, UK3 California Institute of Technology, 1200 East California Boulevard, Pasadena, CA 91125, USA
4 Jet Propulsion Laboratory, California Institute of Technology, Pasadena, CA 91109, USA5 Leiden Observatory, Leiden University, Niels Bohrweg 2, NL-2333-CA Leiden, The Netherlands
6 Department of Physics and Astronomy, University of Waterloo, 200 University Avenue West, Waterloo, ON N2L 3G1, Canada7 Instituto de Astronomia, Geofısica e Ciencias Atmosfericas (IAG), Rua do Matao,
1226 Cidade Universitaria 05508-090, Sao Paulo, SP, Brazil8 Museu de Astronomia e Ciencias Afins (MAST), Rua General Bruce, 586 Bairro Imperial de Sao Cristovao 20921-030,
Rio de Janeiro, RJ, Brazil9 National Astronomical Observatory of Japan, Osawa 2-21-1, Mitaka, Tokyo 181-8588, Japan
10 LAM, CNRS-UNiv Aix-Marseille, 38 rue F. Joliot-Curis, F-13013 Marseille, France11 Spitzer Science Center, 314-6 Caltech, 1201 East California Boulevard Pasadena, CA 91125, USA
12 Institut d’Astrophysique de Paris, UMR 7095, 98 bis Boulevard Arago, F-75014 Paris, France13 Space Telescope Science Institute, 3700 San Martin Drive, Baltimore, MD 21218, USA
Received 2013 June 20; accepted 2013 September 25; published 2013 November 6
ABSTRACT
The scaling between X-ray observables and mass for galaxy clusters and groups is instrumental for cluster-basedcosmology and an important probe for the thermodynamics of the intracluster gas. We calibrate a scaling relationbetween the weak lensing mass and X-ray spectroscopic temperature for 10 galaxy groups in the COSMOS field,combined with 55 higher-mass clusters from the literature. The COSMOS data includes Hubble Space Telescopeimaging and redshift measurements of 46 source galaxies per arcminute2, enabling us to perform unique weaklensing measurements of low-mass systems. Our sample extends the mass range of the lensing calibrated M–Trelation an order of magnitude lower than any previous study, resulting in a power-law slope of 1.48+0.13
−0.09. The slopeis consistent with the self-similar model, predictions from simulations, and observations of clusters. However, X-rayobservations relying on mass measurements derived under the assumption of hydrostatic equilibrium have indicatedthat masses at group scales are lower than expected. Both simulations and observations suggest that hydrostaticmass measurements can be biased low. Our external weak lensing masses provide the first observational supportfor hydrostatic mass bias at group level, showing an increasing bias with decreasing temperature and reaching alevel of 30%–50% at 1 keV.
Key words: cosmology: observations – galaxies: groups: general – gravitational lensing: weak
Online-only material: color figures
1. INTRODUCTION
As the largest gravitationally bound objects in the universe,galaxy clusters and groups have proven to be important cosmo-logical probes. They reside in the high-mass end of the cosmicmass function and have a formation history that is strongly de-pendent on cosmology. Therefore, the mass function of galaxy
∗ Based on observations with the NASA/ESA Hubble Space Telescope,obtained at the Space Telescope Science Institute, which is operated by AURAInc., under NASA contract NAS 5-26555. Also based on data collected at theSubaru Telescope, which is operated by the National AstronomicalObservatory of Japan; the XMM-Newton, an ESA science mission withinstruments and contributions directly funded by ESA Member States andNASA; the European Southern Observatory under Large Program 175.A-0839,Chile; Kitt Peak National Observatory, Cerro Tololo Inter-AmericanObservatory, and the National Optical Astronomy Observatory, which areoperated by the Association of Universities for Research in Astronomy, Inc.(AURA) under cooperative agreement with the National Science Foundation;the National Radio Astronomy Observatory, which is a facility of the NationalScience Foundation operated under cooperative agreement by AssociatedUniversities, Inc.; and the Canada–France–Hawaii Telescope (CFHT) withMegaPrime/MegaCam operated as a joint project by the CFHT Corporation,CEA/DAPNIA, the National Research Council of Canada, the CanadianAstronomy Data Centre, the Centre National de la Recherche Scientifique deFrance, TERAPIX, and the University of Hawaii.
clusters and groups functions as an independent tool for con-straining cosmological parameters.
Clusters and groups are now readily detected up to redshiftsof unity and above through X-ray emission of hot intraclustergas,14 optical surveys of galaxies and the Sunyaev–Zel’dovicheffect in the millimeter range. The masses of these systems havetypically been inferred through thermal X-ray emission or thevelocity dispersion of galaxies. Both of these methods rely onthe assumption of hydrostatic or gravitational equilibrium inthe cluster or group, which is not always valid. Clusters andgroups are found in a myriad of dynamical states and thereis increasing evidence for non-thermal pressure support in theintracluster gas, skewing the mass estimates derived underthe assumptions of a hydrostatic equilibrium (HSE; e.g., Nagaiet al. 2007; Mahdavi et al. 2008, 2013; Shaw et al. 2010; Rasiaet al. 2012).
Fortunately, gravitational lensing has proven to be a directway of measuring cluster and group masses regardless of thedynamical state or non-thermal pressure support in the system.
14 With intracluster gas, we refer to the intergalactic gas in both galaxy groupsand clusters. We follow the convention of referring to those systems with masslower than ∼1014 M� as groups and higher as clusters.
1

The Astrophysical Journal, 778:74 (11pp), 2013 November 20 Kettula et al.
In gravitational lensing, the presence of a large foreground masssuch as a galaxy cluster or group will bend the light radiatingfrom a background source galaxy. In weak gravitational lensing,the ellipticity of a source galaxy is modified, whereas stronglensing also produces multiple images of a single source. Theweak lensing-induced change in ellipticity is commonly referredto as shear. However, source galaxies typically have a randomlyoriented intrinsic ellipticity that is significantly larger than thelensing-induced shear. Therefore, the shear has to be averagedover a large sample of source galaxies in order to measurea weak lensing signal used to infer the mass of the lensingsystem.
The direct mass measurement methods described above areobservationally expensive and not always applicable to low-mass or high-redshift systems. This has spurred the study ofmass scaling relations for observables, which can be used asmass proxies. As X-ray observations have proven to be the mostefficient way for constructing cluster and group catalogs, typ-ically X-ray observables such as luminosity, LX , spectroscopictemperature, TX , and thermal energy of the intracluster gas,YX = TX ×Mgas, are used as mass proxies. Consequently, defin-ing and calibrating these X-ray mass proxies is instrumental forcluster- and group-based cosmology.
The scaling between cluster or group temperature and massis very fundamental. The simple self-similar model for clus-ter evolution developed by Kaiser (1986), which assumes puregravitational heating of intracluster gas, predicts that clus-ter temperature is a direct measure of the total gravitationalpotential and thus mass of the system. The predicted scal-ing of mass to temperature is a power law with a slope of3/2. Deviations from the self-similar prediction can conse-quently be used to study non-gravitational physics affectingthe gas.
Unfortunately, cluster and group masses are typically de-rived from X-ray observations under the assumption of HSEregardless of dynamical state. Also, temperatures are usuallyderived from the same observation as hydrostatic masses, in-troducing possible covariance between the observed quantities.The hydrostatic M–T relations typically give power-law slopesin the range of 1.5–1.7 (see Bohringer et al. 2012; Giodiniet al. 2013, for summaries of recent literature). Notably, sam-ples that only include higher-mass systems with temperaturesabove 3 keV tend to predict M–T relations that have a slopeclose to the self-similar prediction of 1.5, whereas samples in-cluding lower-mass systems tend to predict a slightly steeperproportionality.
The accuracy of the calibration of mass–temperature scalingcan be significantly improved by using independent weaklensing cluster mass measurements. However, this type of studyhas only been performed in the cluster mass regime by Smithet al. (2005), Hoekstra (2007), Okabe et al. (2010), Jee et al.(2011), Hoekstra et al. (2012), and Mahdavi et al. (2013). Theaim of this work is to calibrate the scaling between weak lensingmasses and X-ray temperatures of the hot intracluster gas fora sample of galaxy groups in the COSMOS survey field. Thiswork is an extension to Leauthaud et al. (2010), who investigatedthe scaling between weak lensing mass and X-ray luminosity inthe same field.
This paper is organized as follows. We present the data andgalaxy group sample used for our analysis in Sections 2 and 3,and give details on the X-ray and weak lensing analysis inSections 4 and 5. We present the resulting M–T relation inSection 6, discuss our findings in Section 7, and conclude and
summarize our findings in Section 8. Throughout this paper, weassume WMAP nine year cosmology (Hinshaw et al. 2012), withH0 = 70 h70 km s−1 Mpc−1, ΩM = 0.28, and ΩΛ = 0.72. Alluncertainties are reported at a 68% significance, unless statedotherwise.
2. COSMOS DATA
In this section, we briefly present the observations of theCOSMOS survey field used for our analysis. The COSMOSsurvey consists of observations of a contiguous area of 2 deg2
with imaging at wavelengths from radio to X-ray and deepspectroscopic follow-up (see, e.g., overview by Scoville et al.2007b).
2.1. Lensing Catalog
The shear measurements of source galaxies are based onHubble Space Telescope (HST) imaging of the COSMOS fieldusing the Advanced Camera for Surveys (ACS) Wide FieldChannel (WFC; Scoville et al. 2007a; Koekemoer et al. 2007).As the COSMOS field was imaged during 640 orbits duringHST cycles 12 and 13, the ACS/WFC imaging of the COSMOSfield is the HST survey with the largest contiguous area to date.The derivation of shear measurement is described in detail byLeauthaud et al. (2007, 2010, 2012). The shear measurement hasbeen calibrated on simulated ACS images containing a knownshear (Leauthaud et al. 2007), and we have updated that witheach subsequent improvement of the catalog.
The final weak lensing catalog contains accurate shape mea-surements of 272,538 galaxies, corresponding to approximately46 galaxies per arcminute2, and a median redshift of z = 1.06.Of the source galaxies, 25,563 have spectroscopic redshift mea-surements from the zCOSMOS program (Lilly et al. 2007), theremaining source galaxies have photometric redshifts measuredusing more than 30 bands (Ilbert et al. 2009).
2.2. X-Ray Group Catalog
The X-ray group catalog we used has been presented inGeorge et al. (2011) and is available online. In brief, we used allXMM-Newton (described in Hasinger et al. 2007; Cappellutiet al. 2009) and Chandra observations (Elvis et al. 2009)performed prior to 2010 in catalog construction. Point sourceremoval has been produced separately for Chandra and XMMbefore combining the data, as described in Finoguenov et al.(2009), producing a list of 200+ extended sources. We run ared-sequence finder to identify the galaxy groups followingthe procedure outlined in Finoguenov et al. (2010). Extensivespectroscopy available for the COSMOS field allowed a 90%spectroscopic identification of the z < 1 group sample. Georgeet al. (2012) explored the effect of centering by taking an X-raycenter or the most massive group galaxy (MMGG).
Previously, the X-ray group catalog had been used inLeauthaud et al. (2010) to calibrate the M–L relation. It hasbeen shown there that there is a correlation between the level ofX-ray emission and the significance of the weak lensing signal.In the current work, we take advantage of the fact that the signif-icance required to measure the mean X-ray temperature allowsus to perform individual mass measurements, and although thesample size is much smaller when compared to the M–L rela-tion, we do not need to stack several groups in order to producethe results. The high significance of the selected groups also hasa much better defined X-ray centering.
2

The Astrophysical Journal, 778:74 (11pp), 2013 November 20 Kettula et al.
Table 1Properties of the Galaxy Group Sample
Ida NHb z R.A. (J2000)c Decl. (J2000)c
(1020 cm−2) (deg) (deg)
11 1.80 0.220 150.18980 1.6572517 1.78 0.372 149.96413 1.6803325 1.75 0.124 149.85146 1.7731929 1.74 0.344 150.17996 1.76887
120 1.80 0.834 150.50502 2.22506149 1.77 0.124 150.41566 2.43020193 1.69 0.220 150.09093 2.39116220 1.71 0.729 149.92343 2.52499237 1.70 0.349 150.11774 2.68425262 1.84 0.343 149.60007 2.82118
Notes.a Id number in the COSMOS X-ray group catalog (Section 2.2).b The Leiden/Argentine/Bonn Survey weighted average galactic absorptioncolumn density (Kalberla et al. 2005).c R.A. and decl. of the X-ray peak.
3. SAMPLE SELECTION
We selected sources from the COSMOS X-ray group catalog(Section 2.2) with a detection significance of 10σ and above.As we chose to exclude cluster cores from temperature determi-nation (see Section 4) and consequently only use regions withlow scatter in pressure (Arnaud et al. 2010), our sample shouldbe unaffected by selection bias.
Our initial sample contained 13 sources. However, we ex-cluded the group with id number 6 because X-ray coverage wasnot sufficient to constrain the spectroscopic temperature. Wefurther excluded the sources with id numbers 246 and 285, asthey are located at the edge of the COSMOS field and thus falloutside the coverage of the HST observations (Section 2.1).
The remaining 10 sources in our sample all have a clear X-raypeak with a single optical counterpart and are free of projections(Finoguenov et al. 2007, XFLAG = 1). As our data allowsus to extend our lensing analysis out to large radii, possiblesubstructure in the central parts visible in X-rays is not relevantfor our mass estimates. Instead, infalling subgroups at clusteroutskirts are more important. Based on our X-ray group catalog,we can rule out this kind of substructure at >20%–30% level inmass.
We adopt the coordinates of the X-ray peaks as the locationsof the group centers, but we also tested the effect of usingthe MMGG as a center in performing the lensing analysis(Section 5.3). The properties of the clusters in our sample arepresented in Table 1. The deep X-ray coverage and high densityof background galaxies with determined shear in the COSMOSfield allows us to treat each system individually in our analysis.
4. X-RAY REDUCTION AND ANALYSIS
For the X-ray analysis, we used EPIC-pn data from the XMM-Newton wide field survey of the COSMOS field (Hasingeret al. 2007) with the latest calibration information availablein 2012 October and XMM Scientific Analysis System releasexmmsas_20120621_1321-12.0.1. We produced event files withthe epchain tool and merged the event files of pointings thatwere within 10′ of the adopted group center for each system.The merged event files were filtered, excluding bad pixels andCCD gaps and periods contaminated by flares, and includingonly events with patterns 0–4. We generated out-of-time event
Table 2Results of the X-Ray Analysis
Id 0.1 R500a 0.5 R500
b TXc fscat
d Sign.e χ2 f Degrees of(arcmin) (arcmin) (keV) (%) (σ ) Freedom
11 0.35 1.77 2.2+0.2−0.1 5 24.5 273.42 263
17 0.19 0.96 2.1+0.2−0.2 21 18.2 96.36 91
25 0.37 1.87 1.3+0.1−0.1 3 11.8 139.40 121
29 0.18 0.89 2.3+1.7−0.5 · · · 3.2 24.75 26
120 0.13 0.67 3.9+0.6−0.5 10 16.6 66.49 69
149 0.42 2.08 1.4+0.1−0.1 4 19.1 123.95 132
193 0.20 1.02 1.2+0.2−0.1 14 3.9 27.54 23
220 0.16 0.79 4.6+1.0−0.7 · · · 15.8 43.49 32
237 0.20 0.99 2.2+2.1−0.5 12 5.3 24.99 26
262 0.21 1.03 3.3+2.8−1.6 5 5.7 40.14 33
Notes.a Inner radii of the extraction region.b Outer radii of the extraction region.c X-ray temperature of the group.d Fraction of the flux in the 0.1–0.5 R500 region scattered from the central region.e Statistical significance of the thermal X-ray component.f χ2 of the best-fit model.
files, which we subsequently used to subtract events registeredduring pn readout.
We extracted spectra from an annulus corresponding to0.1–0.5 R500 (see Table 2). As differences of a few 10%in the inner and outer radii of the X-ray extraction regionwill be smeared out by the point-spread function (PSF), wedetermined R500 from the virial radius in the X-ray group catalog(Section 2.2, based on the M–L relation of Leauthaud et al.2010), assuming a halo concentration of five. The groups werevisually inspected for point sources, which we masked using acircular mask with a 0.′5 radius. We grouped the spectra to aminimum of 25 counts bin−1.
As the groups in the COSMOS field do not fill the field ofview, we used the merged event files to extract local backgroundspectra. We selected background regions using the criteriathat they are located at a minimum distance of R200 (∼2′–6′,determined from the X-ray group catalog Section 2.2) and amaximum distance of 10′ from the adopted group center, andthat they do not contain any detectable sources. The backgroundspectra where used as Xspec background files in subsequentspectral fits and thus subtracted from the data.
For X-ray spectroscopy, we used an Xspec model consistingof an absorbed thermal APEC component in a 0.5–7.0 keVenergy band, with solar abundance tables of Grevesse & Sauval(1998) and absorption cross-sections of Balucinska-Church &McCammon (1992). We fixed the metal abundance to 0.3 of thesolar value, and used redshift and Galactic absorption columndensity values listed in Table 1. In order to account for spatialvariation in the Galactic foreground, we included an additionalthermal component with a temperature of 0.26 keV and solarabundance and found that the contribution from this componentwas negligible.
As the inner radii of the extraction regions is smaller thanthe EPIC-pn PSF, some flux from the excluded central 0.1 R500region might scatter to the extraction region. We accountedfor this scatter by extracting spectra from the excluded centralregions and fitting them with a similar model as described above.We estimated the scatter to the 0.1–0.5 R500 extraction regionsusing the best-fit model and added the contribution due tothe scatter to our analysis. The core regions of groups withid numbers 29 and 220 did not posses a sufficient number
3

The Astrophysical Journal, 778:74 (11pp), 2013 November 20 Kettula et al.
Figure 1. Plot showing X-ray temperature TX versus redshift z of the COSMOSsystems analyzed in this work.
of photons to fit a spectrum and we estimate that the scatterfrom the central region is negligible for these systems. For theremaining systems, the fraction of flux in the extraction regionscattered from the central region varies between 3% and 21%(see Table 2).
We detected the thermal emission component in the 0.1–0.5R500 region with a statistical significance of 3.2σ–24.5σ andbest-fit temperatures in the range of 1.2–4.6 keV (see Figure 1and Table 2). Thus our sample extends the measurements ofweak lensing based M–T relations to a lower temperature rangethan previous studies by a factor of four (Hoekstra 2007; Okabeet al. 2010; Jee et al. 2011; Mahdavi et al. 2013).
5. WEAK LENSING ANALYSIS
For our weak lensing analysis, we used the COSMOS shearcatalog.
5.1. Lensing Signal
In our analysis, we measured the lensing signal independentlyfor each system in our sample in terms of azimuthally averagedsurface mass density contrast ΔΣ(r). A spherically symmetricmass distribution is expected to induce a shear, which is orientedtangentially to the radial vector. This signal is also known as theE mode. The cross-component shear, or B-mode signal, is angledat 45◦ from the tangential shear and the azimuthally averagedvalue is expected to be consistent with zero for a perfect lensingsignal.
The azimuthally averaged surface mass density contrast isrelated to the projected tangential shear of source galaxies γt by
ΔΣ(r) = Σ(<r) − Σ(r) = Σcrit × γt (r), (1)
where Σ(<r) is the mean surface mass density within the radiusr, Σ(r) is the azimuthally averaged surface mass density at radiusr, and Σcrit is the critical surface mass density. The critical surfacemass density depends on the geometry of the lens–source systemas
Σcrit = c2
4πG
DOS
DOLDLS. (2)
Here c is the speed of light; G is Newton’s gravitational constant;and DOS,DOL, and DLS are the angular diameter distancesbetween observer and source, observer and lens, and lens andsource, respectively.
Figure 2. Stacked ΔΣ showing the total tangential (solid data) and cross-component (dotted data) lensing shear of all galaxy groups in the sample. Errorsrepresent the total error given by Equation (3). The data are binned to 20 equallyspaced bins in a radial range of 0.1–4 Mpc.
For each lensing system, we selected the source galaxiesfrom the COSMOS shear catalog with a projected distance of0.1–4 Mpc in the lens plane and a lower limit for the 68%confidence interval for the photometric redshift higher than theredshift of the lensing system. Approximately 23% of the sourcegalaxies in the lensing catalog have secondary photometricredshift peaks. In order to avoid biasing mass estimates dueto catastrophic outliers, we exclude these galaxies from ouranalysis.
The lensing signal might be diluted, if a significant numberof group galaxies are scattered into the source sample. Forinstance, Hoekstra (2007) showed in Figure 3 that the effect ismodest for high-mass clusters using ground based data (∼20%at R2500). As our space based data is deeper, giving a largernumber of sources, and we analyze low-mass systems with asmaller number of member galaxies, the effect on our sampleis significantly smaller. The effect is mainly limited to thecentral parts of the groups, which we cut out from our analysis.Furthermore, as our photometric redshifts are based on 30+bands and we exclude source galaxies with secondary redshiftpeaks, our lensing masses are unaffected by contamination bygroup members.
We calculated the surface mass density contrast ΔΣi,j foreach lens–source pair using Equations (1) and (2). For thecomputation of ΔΣi,j , spectroscopic redshift was used insteadof photometric redshift for those source galaxies where it wasavailable. As we compute ΔΣ at radii greater than 0.1 Mpc,our lensing signals are largely unaffected by non-weak shear orcontributions from the central galaxy (Leauthaud et al. 2010). Asan illustration, we show the combined and binned tangential andcross-component lensing signals for all sources in the sample inFigure 2.
The uncertainty of the observed tangential shear σγtis affected
by the measurement error of the shape σmeas and the uncertaintydue to the intrinsic ellipticity of source galaxies σint, known asintrinsic shape noise. Leauthaud et al. (2007, 2010) estimatedthe intrinsic shape noise of source galaxies in the COSMOSshear catalog to σint = 0.27.
Nearby large-scale structure (LSS) can also contribute to theuncertainty of lensing mass estimates (Hoekstra 2001, 2003).For the COSMOS field, Spinelli et al. (2012) found that theLSS affects the shear measurements as an external source ofnoise, where the average contribution to the uncertainty of the
4

The Astrophysical Journal, 778:74 (11pp), 2013 November 20 Kettula et al.
Figure 3. Plot of the χ2 as a function of mass for NFW profile fits to azimuthally averaged mass surface density contrast. The dashed vertical line shows the best-fitM200, the dotted lines indicate the 1σ confidence intervals of M200.
tangential shear is σLSS = 0.006. We ignore the correlation ofthe σLSS contribution between different source galaxies. Thus,the total uncertainty of the tangential shear measurements foreach source galaxy can be approximated by
σ 2γt
≈ σ 2meas + σ 2
int + σ 2LSS, (3)
since the correlation between the terms σmeas and σLSS is small,the correlation between σint and the other two terms vanishes.For this work, we use σmeas,j from the updated Leauthaud et al.(2010) catalog, σint = 0.27 and σLSS = 0.006.
5.2. Lensing Mass Estimates
Numerical simulations indicate that the density pro-file of galaxy clusters or groups typically follow theNavarro–Frenk–White (NFW) profile (Navarro et al. 1997),given by
ρ(r) = δcρcr
(r/rs)(1 + r/rs)2. (4)
In this work, we define total group mass as the mass in-side which the mean NFW mass density 〈ρ〉 = 200 ρcr,where ρcr is the critical density of the universe at the groupredshift zd . We denote this mass by M200 and define it asM200 ≡ M(r200) = 200 ρcr
43πr3
200. The NFW concentrationparameter c200 = r200/rs gives the relation between r200 and thecharacteristic scale radius rs. Finally, the density contrast in theNFW profile (Equation(4)) is defined as
δc200 = 200
3
c3200
ln(1 + c200) − c2001+c200
. (5)
The analytic solution for the surface mass density contrastsignal corresponding to a NFW profile ΔΣNFW is given by
ΣNFW(x) =
⎧⎪⎪⎪⎪⎪⎪⎪⎨⎪⎪⎪⎪⎪⎪⎪⎩
2rs δcρcr
(x2−1)
[1 − 2√
1−x2 arctanh√
1−x1+x
]x < 1,
2rs δcρcr
3 x = 1,
2rs δcρcr
(x2−1)
[1 − 2√
x2−1arctan
√x−11+x
]x > 1,
(6)
where x = R/rs (e.g., Bartelmann 1996; Wright & Brainerd2000; Kneib & Natarajan 2011). The solution depends onthe mass, concentration parameter, and redshift of the lensingsystem. For this work, we assume that M200 and c200 are relatedby
c200 = 5.71
(1 + zd )0.47
(M200
2.0 × 10²h−1M�
)−0.084
(7)
given by Duffy et al. (2008). We experimented with lettingconcentration vary freely, however, the shear data did not allowfor this extra degree of freedom. Thus as the redshifts of thesystems in our sample are known, the only unknown in thesolution of ΔΣNFW is mass M200.
We estimated the masses by fitting ΔΣNFW to the measuredΔΣ (Section 5.1), in a radial range of 0.1–4 Mpc. The datawere not binned for the fit. We used the Metropolis–HastingsMarkov Chain Monte Carlo algorithm for χ2 minimization(see Figures 3 and 4) and found best-fit M200 in the range of
5
The Astrophysical Journal, 778:74 (11pp), 2013 November 20 Kettula et al.
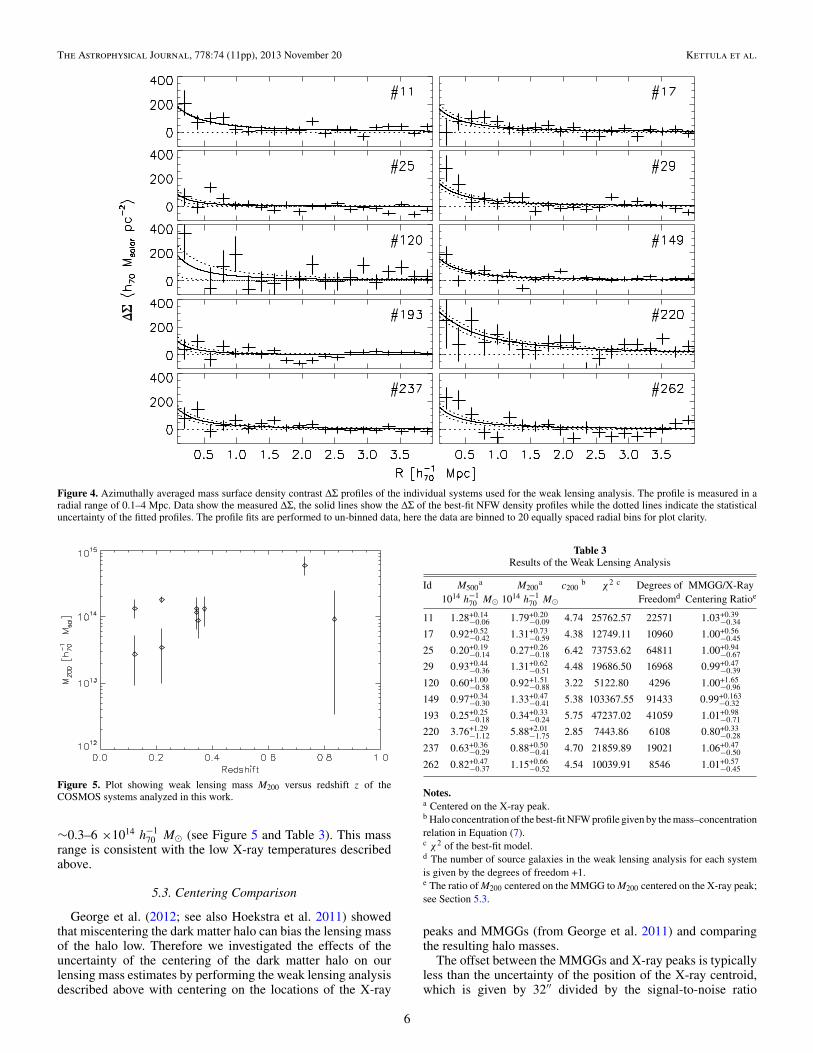
Figure 4. Azimuthally averaged mass surface density contrast ΔΣ profiles of the individual systems used for the weak lensing analysis. The profile is measured in aradial range of 0.1–4 Mpc. Data show the measured ΔΣ, the solid lines show the ΔΣ of the best-fit NFW density profiles while the dotted lines indicate the statisticaluncertainty of the fitted profiles. The profile fits are performed to un-binned data, here the data are binned to 20 equally spaced radial bins for plot clarity.
Figure 5. Plot showing weak lensing mass M200 versus redshift z of theCOSMOS systems analyzed in this work.
∼0.3–6 ×10¹⁴ h−170 M� (see Figure 5 and Table 3). This mass
range is consistent with the low X-ray temperatures describedabove.
5.3. Centering Comparison
George et al. (2012; see also Hoekstra et al. 2011) showedthat miscentering the dark matter halo can bias the lensing massof the halo low. Therefore we investigated the effects of theuncertainty of the centering of the dark matter halo on ourlensing mass estimates by performing the weak lensing analysisdescribed above with centering on the locations of the X-ray
Table 3Results of the Weak Lensing Analysis
Id M500a M200
a c200b χ2 c Degrees of MMGG/X-Ray
1014 h−170 M� 1014 h−1
70 M� Freedomd Centering Ratioe
11 1.28+0.14−0.06 1.79+0.20
−0.09 4.74 25762.57 22571 1.03+0.39−0.34
17 0.92+0.52−0.42 1.31+0.73
−0.59 4.38 12749.11 10960 1.00+0.56−0.45
25 0.20+0.19−0.14 0.27+0.26
−0.18 6.42 73753.62 64811 1.00+0.94−0.67
29 0.93+0.44−0.36 1.31+0.62
−0.51 4.48 19686.50 16968 0.99+0.47−0.39
120 0.60+1.00−0.58 0.92+1.51
−0.88 3.22 5122.80 4296 1.00+1.65−0.96
149 0.97+0.34−0.30 1.33+0.47
−0.41 5.38 103367.55 91433 0.99+0.163−0.32
193 0.25+0.25−0.18 0.34+0.33
−0.24 5.75 47237.02 41059 1.01+0.98−0.71
220 3.76+1.29−1.12 5.88+2.01
−1.75 2.85 7443.86 6108 0.80+0.33−0.28
237 0.63+0.36−0.29 0.88+0.50
−0.41 4.70 21859.89 19021 1.06+0.47−0.50
262 0.82+0.47−0.37 1.15+0.66
−0.52 4.54 10039.91 8546 1.01+0.57−0.45
Notes.a Centered on the X-ray peak.b Halo concentration of the best-fit NFW profile given by the mass–concentrationrelation in Equation (7).c χ2 of the best-fit model.d The number of source galaxies in the weak lensing analysis for each systemis given by the degrees of freedom +1.e The ratio of M200 centered on the MMGG to M200 centered on the X-ray peak;see Section 5.3.
peaks and MMGGs (from George et al. 2011) and comparingthe resulting halo masses.
The offset between the MMGGs and X-ray peaks is typicallyless than the uncertainty of the position of the X-ray centroid,which is given by 32′′ divided by the signal-to-noise ratio
6

The Astrophysical Journal, 778:74 (11pp), 2013 November 20 Kettula et al.
Figure 6. Plot showing the ratio of lensing mass estimates for COSMOS galaxygroups centering on the MMGGs to mass estimates centering on the locationsof the X-ray peaks versus the offset between the location of MMGGs and X-raypeaks.
(∼10–15 for our sample) for XFLAG = 1 groups in theCOSMOS group catalog (see Figure 6). The only exceptionsare groups with X-ray id numbers 149 and 220, which haveoffsets of 43′′ and 59′′, respectively.
The best-fit M200 using MMGG and X-ray centering istypically consistent within a few percent (Table 3 and Figure 6).The only deviant group is X-ray id number 220, which has anMMGG-centered mass ∼20% lower than the X-ray centeredmass. This system has a peculiar S-shape morphology, whichmakes accurate center determination difficult (Guzzo et al.2007). However, the mass discrepancy with MMGG and X-ray centering is at a less than 1σ statistical significance (see alsoSection 5.5 for further discussion on this system).
A miscentered cluster is expected to show a suppression inthe lensing signal at small scales. We do not detect this effectin the mass surface density contrast profiles (Figure 4), includingthe two groups with significant offsets between MMGG and X-ray centers. We thus conclude that the chosen X-ray centersare accurate and that our lensing masses are not significantlyaffected by uncertainties in centering.
5.4. Bias due to M–c Relation
A possible systematic bias in the lensing analysis is anincorrect assumed mass–concentration relation for the NFWprofile (Equation (7)). For example, Hoekstra et al. (2012)showed that varying the normalization of the M–c relationby ±20% biases lensing NFW mass estimates by ∼5%–15%,depending on the mass definition. However, the sensitivity ofNFW mass estimates to possible biases in the M–c relationdiminishes when the mass estimates are extended further fromthe cluster center.
Our lensing masses are measured within R200 and are consis-tent with the stacked lensing analysis of galaxy groups in theCOSMOS field by Leauthaud et al. (2010), who used the M–crelation of Zhao et al. (2009) instead of the Duffy et al. (2008)relation we used. Furthermore, the mass range implied by bothour lensing analysis and the lensing analysis of Leauthaud et al.(2010) is consistent with the typical dark matter halo mass de-rived with clustering analysis in the COSMOS field (Allevatoet al. 2012). An incorrect assumed NFW concentration wouldresult in lensing masses contradicting the clustering analysis.
5.5. Massive Galaxy Group at z = 0.73
Guzzo et al. (2007) performed a weak lensing analysis of themassive galaxy group at redshift z = 0.73 in the COSMOS fieldwith id number 220 in the X-ray group catalog. They reporteda very high weak lensing mass of 6 ± 3 × 10¹⁵ M� for the darkmatter halo, which is in apparent tension with the X-ray mass ofM500 1.6 × 10¹⁴ M� derived from their X-ray spectroscopictemperature TX = 3.51+0.60
−0.46 keV using M–T relations from theliterature.
Our X-ray spectroscopic temperature of 4.6+1.0−0.7 keV is con-
sistent with the X-ray analysis of Guzzo et al. (2007). However,we found a weak lensing M200 of 4.12+1.41
−1.23 × 10¹⁴ M� (scaledto h = 1.0 as used by Guzzo et al. 2007). This is more than anorder of magnitude lower than the lensing mass of Guzzo et al.(2007), but consistent within errors with the mass predictionsfrom X-ray analyses. This implies that the previously reportedhigh lensing mass is the total mass of the whole superstruc-ture, whereas the lower mass implied by both X-rays and ourlensing analysis is the mass of the galaxy group. This argumentis further supported by the clustering analysis of groups in theCOSMOS field (see Section 5.4 and Allevato et al. 2012). Wefurther note that the exclusion of this source from our samplewould not affect our results.
6. M–T SCALING RELATION
We used our center-excised X-ray temperatures and weaklensing group masses in the COSMOS field (Tables 2 and 3)to calibrate the scaling relation between these two quantities.As the systems in our sample have both low mass and tem-perature, we are probing a largely unexplored region of themass–temperature plane.
In the self-similar model cluster, group mass and temperatureare related by a power law
M × E(z) = N × T αX , (8)
with slope α = 3/2 (Kaiser 1986). Here E(z), defined as
E(z) = H (z)
H0=
√ΩM (1 + z)3 + Ωλ (9)
for flat cosmologies, describes the scaling of overdensity withredshift.
Scaling relations at galaxy group masses are typically derivedfor M500 (e.g., Finoguenov et al. 2001; Sun et al. 2009; Eckmilleret al. 2011), i.e., the mass inside the radius where the averagedensity is 500 times the critical density of the universe. Werescaled the lensing masses derived above to this value using thebest-fit NFW profiles to enable direct comparison. We assumedthe power-law relation given by Equation (8) and linearized itby taking a logarithm
log10M500E(z)
1014h−170
= log10 N + α × log10TX
3 keV. (10)
We evaluated the logarithm of the normalization and the slope ofthe M–T relation using the FITEXY linear regression methodwith bootstrap resampling to compute statistical uncertaintiesof the fit parameters.
For the COSMOS systems, we obtained the best-fit parame-ters α = 1.71+0.57
−0.40 and log10 N = 0.39+0.04−0.10, with χ2 = 5.07 for
8 degrees of freedom (see Table 4, Figures 7 and 8). However, as
7

The Astrophysical Journal, 778:74 (11pp), 2013 November 20 Kettula et al.
Table 4Best-fit Parameters of the M500–TX Scaling Relation
Sample Slope Normalization Intrinsic Scatter χ2 Degrees of(α) (log10 N ) (%) Freedom
COSMOS 1.71+0.57−0.40 0.39+0.04
−0.10 28 ± 13 5.07 8
COSMOS+CCCP+160SD 1.48+0.13−0.09 0.34+0.02
−0.04 28 ± 7 112.57 63
COSMOS+CCCP+160SD, modified TX 1.40+0.12−0.10 0.32+0.02
−0.03 35 ± 9 117.99 63
Figure 7. Scaling of cluster mass M500 to X-ray temperature TX . The bluediamonds show COSMOS systems analyzed in this work, the red triangles aresystems from the CCCP cluster catalog, and the black circles are from the 160SDsurvey. The solid line and dark shaded region show the best-fit scaling relationwith statistical uncertainties fitted to all data points and the dashed line and lightshaded region show the relation fitted to COSMOS data points.
(A color version of this figure is available in the online journal.)
all our systems have low masses and large errors, the constrainton the scaling relation suffers from rather large uncertainties.
We therefore extended our sample with additional measure-ments at higher temperatures/masses. Hoekstra et al. (2011)determined weak lensing masses for a sample of 25 moderateX-ray luminosity clusters drawn from the 160 square degreesurvey (160SD; Vikhlinin et al. 1998; Mullis et al. 2003) usingHST ACS observations. Unfortunately, X-ray temperatures areavailable for only five systems, which we use here. To extendthe mass range further, we also include measurements for 50massive clusters that were studied as part of the Canadian Clus-ter Comparison Project (CCCP). The lensing masses, based ondeep CFHT imaging data, are presented in Hoekstra et al. (2012),whereas the X-ray temperatures are taken from Mahdavi et al.(2013). The X-ray temperatures in Mahdavi et al. (2013) areobtained with both Chandra and XMM-Newton, but the Chan-dra temperatures are adjusted to match the XMM-Newton cali-bration.
This gives us a total sample of 65 systems with masses andtemperatures spanning the range of a few times 1013 to a fewtimes 1015 M� and 1–12 keV. Fitting the M500–TX relation tothe whole extended sample, we obtained the best-fit parametersα = 1.48+0.13
−0.09 and log10 N = 0.34+0.02−0.04 with χ2 = 112.57 for
63 degrees of freedom (see Table 4, Figures 7 and 8).We evaluated the intrinsic scatter of the relation by making
a distribution of the ratio of data to the best-fit model for eachpoint and computing the dispersion. The resulting scatter inmass at fixed T for the relation fitted to COSMOS data pointsand to the full sample are consistent, 28% ±13% and 28% ±
Figure 8. Likelihood contours at 68%, 90%, and 99% statistical significancefor the parameters of the M500–TX scaling relation fitted to COSMOS systemsdescribed in this work (dashed contours) and to all data points shown in Figure 7(solid contours).
7%, respectively, indicating that the samples are consistent witheach other.
7. DISCUSSION
The slope of our best-fit relation of the full sample 1.48+0.13−0.09
is consistent with the self-similar prediction of 3/2 (Kaiser1986). Unfortunately, direct comparison of our best-fit relationto most other weak lensing calibrated M–T relations is notpossible. Okabe et al. (2010) calibrated deprojected center-excised temperatures (whereas our temperatures are projected)to M500 for the LoCuSS cluster sample, consisting of only clustermass systems, and attained a slope of 1.49 ± 0.58. Hoekstra(2007) and Jee et al. (2011) calibrated X-ray temperaturesto weak lensing M2500 for cluster mass systems and attainedslopes of 1.34+0.30
−0.28 and 1.54 ± 0.23, respectively. As their massdefinition differs from ours and masses are thus derived from asmaller region, their relations are not directly comparable to ouranalysis. In the case of Jee et al. (2011), the clusters are also ata significantly higher redshift than our sample, representing acluster population at an earlier evolutionary stage.
However, Mahdavi et al. (2013) used the 50 CCCP clusters,which are also included in our sample, to fit scaling relationsbetween X-ray observables and lensing masses. For M500–TXscaling, they obtained a slope of 1.97 ± 0.89 and 1.42 ± 0.19with a scatter in mass of 46% ± 23% and 17 ± 8 using R500derived from weak lensing and X-ray analysis, respectively.Both of these are consistent within the error bars with ourfindings.
The fact that the published lensing-calibrated M–T relationsat cluster masses and our group mass predict consistent slopesindicates that both clusters and groups follow the same mass-to-temperature scaling. This is in apparent tension with relations
8
The Astrophysical Journal, 778:74 (11pp), 2013 November 20 Kettula et al.
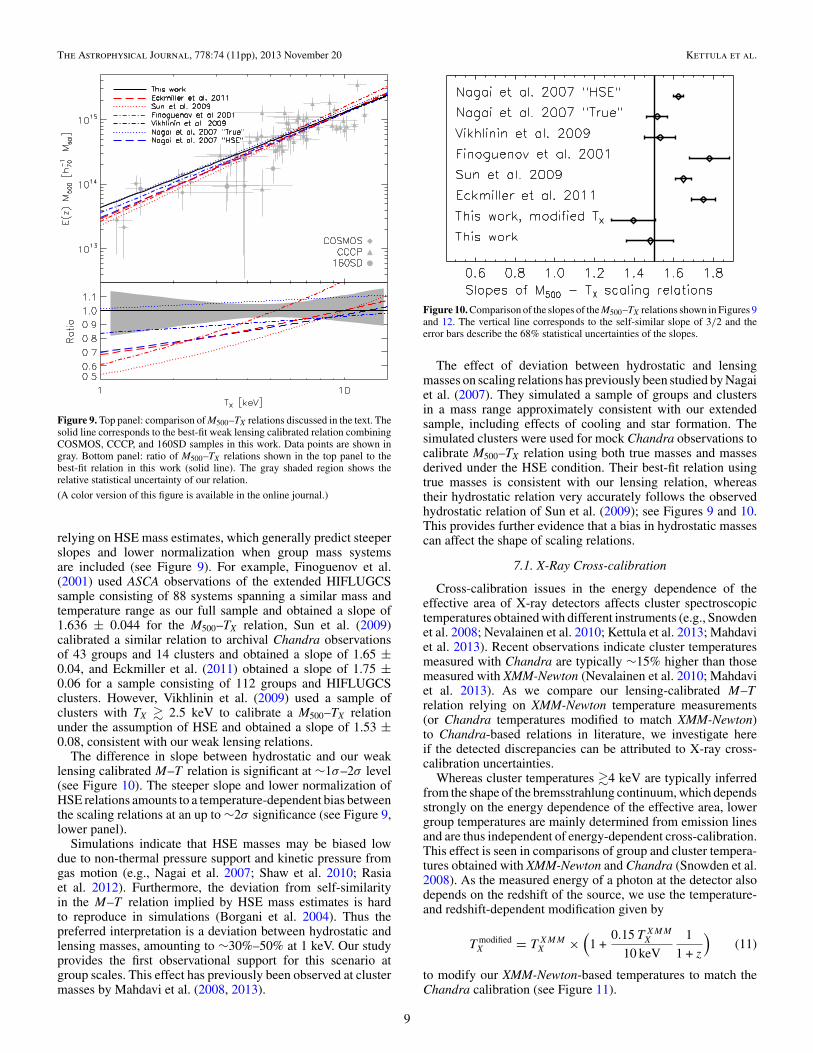
Figure 9. Top panel: comparison of M500–TX relations discussed in the text. Thesolid line corresponds to the best-fit weak lensing calibrated relation combiningCOSMOS, CCCP, and 160SD samples in this work. Data points are shown ingray. Bottom panel: ratio of M500–TX relations shown in the top panel to thebest-fit relation in this work (solid line). The gray shaded region shows therelative statistical uncertainty of our relation.
(A color version of this figure is available in the online journal.)
relying on HSE mass estimates, which generally predict steeperslopes and lower normalization when group mass systemsare included (see Figure 9). For example, Finoguenov et al.(2001) used ASCA observations of the extended HIFLUGCSsample consisting of 88 systems spanning a similar mass andtemperature range as our full sample and obtained a slope of1.636 ± 0.044 for the M500–TX relation, Sun et al. (2009)calibrated a similar relation to archival Chandra observationsof 43 groups and 14 clusters and obtained a slope of 1.65 ±0.04, and Eckmiller et al. (2011) obtained a slope of 1.75 ±0.06 for a sample consisting of 112 groups and HIFLUGCSclusters. However, Vikhlinin et al. (2009) used a sample ofclusters with TX � 2.5 keV to calibrate a M500–TX relationunder the assumption of HSE and obtained a slope of 1.53 ±0.08, consistent with our weak lensing relations.
The difference in slope between hydrostatic and our weaklensing calibrated M–T relation is significant at ∼1σ–2σ level(see Figure 10). The steeper slope and lower normalization ofHSE relations amounts to a temperature-dependent bias betweenthe scaling relations at an up to ∼2σ significance (see Figure 9,lower panel).
Simulations indicate that HSE masses may be biased lowdue to non-thermal pressure support and kinetic pressure fromgas motion (e.g., Nagai et al. 2007; Shaw et al. 2010; Rasiaet al. 2012). Furthermore, the deviation from self-similarityin the M–T relation implied by HSE mass estimates is hardto reproduce in simulations (Borgani et al. 2004). Thus thepreferred interpretation is a deviation between hydrostatic andlensing masses, amounting to ∼30%–50% at 1 keV. Our studyprovides the first observational support for this scenario atgroup scales. This effect has previously been observed at clustermasses by Mahdavi et al. (2008, 2013).
Figure 10. Comparison of the slopes of the M500–TX relations shown in Figures 9and 12. The vertical line corresponds to the self-similar slope of 3/2 and theerror bars describe the 68% statistical uncertainties of the slopes.
The effect of deviation between hydrostatic and lensingmasses on scaling relations has previously been studied by Nagaiet al. (2007). They simulated a sample of groups and clustersin a mass range approximately consistent with our extendedsample, including effects of cooling and star formation. Thesimulated clusters were used for mock Chandra observations tocalibrate M500–TX relation using both true masses and massesderived under the HSE condition. Their best-fit relation usingtrue masses is consistent with our lensing relation, whereastheir hydrostatic relation very accurately follows the observedhydrostatic relation of Sun et al. (2009); see Figures 9 and 10.This provides further evidence that a bias in hydrostatic massescan affect the shape of scaling relations.
7.1. X-Ray Cross-calibration
Cross-calibration issues in the energy dependence of theeffective area of X-ray detectors affects cluster spectroscopictemperatures obtained with different instruments (e.g., Snowdenet al. 2008; Nevalainen et al. 2010; Kettula et al. 2013; Mahdaviet al. 2013). Recent observations indicate cluster temperaturesmeasured with Chandra are typically ∼15% higher than thosemeasured with XMM-Newton (Nevalainen et al. 2010; Mahdaviet al. 2013). As we compare our lensing-calibrated M–Trelation relying on XMM-Newton temperature measurements(or Chandra temperatures modified to match XMM-Newton)to Chandra-based relations in literature, we investigate hereif the detected discrepancies can be attributed to X-ray cross-calibration uncertainties.
Whereas cluster temperatures �4 keV are typically inferredfrom the shape of the bremsstrahlung continuum, which dependsstrongly on the energy dependence of the effective area, lowergroup temperatures are mainly determined from emission linesand are thus independent of energy-dependent cross-calibration.This effect is seen in comparisons of group and cluster tempera-tures obtained with XMM-Newton and Chandra (Snowden et al.2008). As the measured energy of a photon at the detector alsodepends on the redshift of the source, we use the temperature-and redshift-dependent modification given by
T modifiedX = T XMM
X ×(
1 +0.15 T XMM
X
10 keV
1
1 + z
)(11)
to modify our XMM-Newton-based temperatures to match theChandra calibration (see Figure 11).
9

The Astrophysical Journal, 778:74 (11pp), 2013 November 20 Kettula et al.
Figure 11. Plot showing XMM-Newton X-ray temperatures modified forChandra calibration versus unmodified XMM-Newton temperatures for ourgroup and cluster sample.
(A color version of this figure is available in the online journal.)
Re-fitting the M500–TX relation with the modified XMMtemperatures, we find a marginally flatter slope than usingunmodified temperatures. The slope is still consistent with theself-similar prediction of 3/2 (Table 4 and Figures 10 and 12).Comparing this result with HSE relations from the literature, wefind that HSE still predicts lower masses at group scales thanlensing. We conclude that the differences between HSE andlensing M–T relations cannot be explained by X-ray cross-calibration uncertainties and that lensing-calibrated relationshave slopes consistent with self-similarity for both Chandra-and XMM-Newton-based temperatures.
8. SUMMARY AND CONCLUSIONS
We calibrated a scaling relation between weak lensing massesand spectroscopic X-ray temperatures for a sample of 10 galaxygroups in the COSMOS field, 5 clusters from the 160SD survey,and 50 clusters from the CCCP survey. This gave a sample of65 systems spanning a wide mass and temperature range ofM500 ∼ 1013–1015 M� and TX ∼1–12 keV extending weaklensing calibrated M–T relations to an unexplored region of themass–temperature plane.
We found that the best-fit slope of the relation is consistentwith the prediction for self-similar cluster evolution of Kaiser(1986). This is in apparent tension with M–T relations at groupscales in literature, which use X-ray masses derived underHSE. These relations typically predict steeper slopes and lowernormalizations.
The deviations from self-similarity implied by HSE relationsare likely due to HSE masses being biased low in comparisonto unbiased lensing masses. We find that the bias increases withdecreasing temperature, amounting to ∼30%–50% at 1 keV.This effect has been detected in simulations and our studyprovides the first observational evidence for it at group scales.We also show that this effect is not a product of cross-calibrationissues between X-ray detectors.
We conclude that this work demonstrates the importance ofunbiased weak lensing calibrated scaling relations for precisioncosmology with galaxy clusters and groups. Although costly,more weak lensing surveys of galaxy groups are needed toextend the statistical analysis of this work.
Figure 12. Top panel: the solid line and shaded region show the M500–TXrelation and statistical uncertainties using XMM-Newton temperatures modifiedfor Chandra calibration with comparison to other relations discussed in the text.Bottom panel: ratio of the relations shown in the top panel to the relation-fitteddata with XMM-Newton temperatures modified for Chandra calibration (solidline). The shaded region shows the relative statistical uncertainty of the modifiedXMM relation.
(A color version of this figure is available in the online journal.)
The authors thank F. Miniati for useful discussion. K.K. ac-knowledges support from the Magnus Ehrnrooth Foundation.A.F. acknowledges the Academy of Finland (decision 266918).R.M. is supported by a Royal Society University Research Fel-lowship and ERC grant MIRG-CT-208994. J.R. was supportedby JPL, which is run by Caltech under a contract for NASA. H.H.acknowledges NWO Vidi grant 639.042.814. This research hasmade use of NASA’s Astrophysics Data System.
Facilities: HST (ACS), XMM (EPIC).
REFERENCES
Allevato, V., Finoguenov, A., Hasinger, G., et al. 2012, ApJ, 758, 47Arnaud, M., Pratt, G. W., Piffaretti, R., et al. 2010, A&A, 517, A92Balucinska-Church, M., & McCammon, D. 1992, ApJ, 400, 699Bartelmann, M. 1996, A&A, 313, 697Bohringer, H., Dolag, K., & Chon, G. 2012, A&A, 539, A120Borgani, S., Murante, G., Springel, V., et al. 2004, MNRAS, 348, 1078Cappelluti, N., Brusa, M., Hasinger, G., et al. 2009, A&A, 497, 635Duffy, A. R., Schaye, J., Kay, S. T., & Dalla Vecchia, C. 2008, MNRAS,
390, L64Eckmiller, H. J., Hudson, D. S., & Reiprich, T. H. 2011, A&A, 535, A105Elvis, M., Civano, F., Vignali, C., et al. 2009, ApJS, 184, 158Finoguenov, A., Connelly, J. L., Parker, L. C., et al. 2009, ApJ, 704, 564Finoguenov, A., Guzzo, L., Hasinger, G., et al. 2007, ApJS, 172, 182Finoguenov, A., Reiprich, T. H., & Bohringer, H. 2001, A&A, 368, 749Finoguenov, A., Watson, M. G., Tanaka, M., et al. 2010, MNRAS, 403, 2063George, M. R., Leauthaud, A., Bundy, K., et al. 2011, ApJ, 742, 125George, M. R., Leauthaud, A., Bundy, K., et al. 2012, ApJ, 757, 2Giodini, S., Lovisari, L., Pointecouteau, E., et al. 2013, SSRv, 177, 247Grevesse, N., & Sauval, A. J. 1998, SSRv, 85, 161Guzzo, L., Cassata, P., Finoguenov, A., et al. 2007, ApJS, 172, 254Hasinger, G., Cappelluti, N., Brunner, H., et al. 2007, ApJS, 172, 29Hinshaw, G., Larson, D., Komatsu, E., et al. 2012, ApJS, 208, 19Hoekstra, H. 2001, A&A, 370, 743Hoekstra, H. 2003, MNRAS, 339, 1155Hoekstra, H. 2007, MNRAS, 379, 317
10

The Astrophysical Journal, 778:74 (11pp), 2013 November 20 Kettula et al.
Hoekstra, H., Donahue, M., Conselice, C. J., McNamara, B. R., & Voit, G. M.2011, ApJ, 726, 48
Hoekstra, H., Mahdavi, A., Babul, A., & Bildfell, C. 2012, MNRAS, 427, 1298Ilbert, O., Capak, P., Salvato, M., et al. 2009, ApJ, 690, 1236Jee, M. J., Dawson, K. S., Hoekstra, H., et al. 2011, ApJ, 737, 59Kaiser, N. 1986, MNRAS, 222, 323Kalberla, P. M. W., Burton, W. B., Hartmann, D., et al. 2005, A&A, 440, 775Kettula, K., Nevalainen, J., & Miller, E. D. 2013, A&A, 552, A47Kneib, J.-P., & Natarajan, P. 2011, A&ARv, 19, 47Koekemoer, A. M., Aussel, H., Calzetti, D., et al. 2007, ApJS, 172, 196Leauthaud, A., Finoguenov, A., Kneib, J.-P., et al. 2010, ApJ, 709, 97Leauthaud, A., Massey, R., Kneib, J.-P., et al. 2007, ApJS, 172, 219Leauthaud, A., Tinker, J., Bundy, K., et al. 2012, ApJ, 744, 159Lilly, S. J., Le Fevre, O., Renzini, A., et al. 2007, ApJS, 172, 70Mahdavi, A., Hoekstra, H., Babul, A., & Henry, J. P. 2008, MNRAS, 384, 1567Mahdavi, A., Hoekstra, H., Babul, A., et al. 2013, ApJ, 767, 116Mullis, C. R., McNamara, B. R., Quintana, H., et al. 2003, ApJ, 594, 154Nagai, D., Kravtsov, A. V., & Vikhlinin, A. 2007, ApJ, 668, 1
Navarro, J. F., Frenk, C. S., & White, S. D. M. 1997, ApJ, 490, 493Nevalainen, J., David, L., & Guainazzi, M. 2010, A&A, 523, A22Okabe, N., Zhang, Y.-Y., Finoguenov, A., et al. 2010, ApJ, 721, 875Rasia, E., Meneghetti, M., Martino, R., et al. 2012, NJPh, 14, 055018Scoville, N., Abraham, R. G., Aussel, H., et al. 2007a, ApJS, 172, 38Scoville, N., Aussel, H., Brusa, M., et al. 2007b, ApJS, 172, 1Shaw, L. D., Nagai, D., Bhattacharya, S., & Lau, E. T. 2010, ApJ,
725, 1452Smith, G. P., Kneib, J.-P., Smail, I., et al. 2005, MNRAS, 359, 417Snowden, S. L., Mushotzky, R. F., Kuntz, K. D., & Davis, D. S. 2008, A&A,
478, 615Spinelli, P. F., Seitz, S., Lerchster, M., Brimioulle, F., & Finoguenov, A.
2012, MNRAS, 420, 1384Sun, M., Voit, G. M., Donahue, M., et al. 2009, ApJ, 693, 1142Vikhlinin, A., Burenin, R. A., Ebeling, H., et al. 2009, ApJ, 692, 1033Vikhlinin, A., McNamara, B. R., Forman, W., et al. 1998, ApJL, 498, L21Wright, C. O., & Brainerd, T. G. 2000, ApJ, 534, 34Zhao, D. H., Jing, Y. P., Mo, H. J., & Boerner, G. 2009, ApJ, 707, 354
11


