DUSTAND ATOMIC GAS IN DWARF IRREGULAR GALAXIES OF THE M81 GROUP: THE SINGS AND THINGS VIEW Fabian Walter, 1 John M. Cannon, 1, 2 He ´le `ne Roussel, 1 George J. Bendo, 3 Daniela Calzetti, 4 Daniel A. Dale, 5 Bruce T. Draine, 6 George Helou, 7 Robert C. Kennicutt, Jr., 8,9 John Moustakas, 9,10 George H. Rieke, 9 Lee Armus, 7 Charles W. Engelbracht, 9 Karl Gordon, 9 David J. Hollenbach, 11 Janice Lee, 9 Aigen Li, 12 Martin J. Meyer, 4 Eric J. Murphy, 13 Michael W. Regan, 4 John-David T. Smith, 9 Elias Brinks, 14 W. J. G. de Blok, 15 Frank Bigiel, 1 and Michele D. Thornley 16 Received 2006 September 26; accepted 2007 February 12 ABSTRACT We present observations of the dust and atomic gas phase in seven dwarf irregular galaxies of the M81 group from the Spitzer SINGS and VLA THINGS surveys. The Spitzer observations provide a first glimpse of the nature of the nonatomic ISM in these metal-poor (Z 0:1 Z ), quiescent (SFR 0:001 Y 0:1 M yr 1 ) dwarf galaxies. Most detected dust emission is restricted to H i column densities >1 ; 10 21 cm 2 , and almost all regions of high H i column density (>2:5 ; 10 21 cm 2 ) have associated dust emission. Spitzer spectroscopy of two regions in the brightest galaxies (IC 2574 and Holmberg II ) show distinctly different spectral shapes and aromatic features, although the galaxies have comparable gas-phase metallicities. This result emphasizes that the strength of the aromatic features is not a simple linear function of metallicity. We estimate dust masses of 10 4 Y 10 6 M for the M81 dwarf galaxies, resulting in an average dust-to-gas ratio (M dust /M H i ) of 3 ; 10 4 (1:5 ; 10 3 if only the H i that is associated with dust emission is considered); this is an order of magnitude lower than the typical value derived for the SINGS spirals. The dwarf galaxies are underluminous per unit star formation rate at 70 "m as compared to the more massive galaxies in SINGS by a factor of 2. However, the average 70/160 "m ratio in the sample dwarf galaxies is higher than what is found in the other galaxies of the SINGS sample. This can be explained by a combination of a lower dust content in conjunction with a higher dust temperature in the dwarfs. Subject headin gg s: galaxies: dwarf — galaxies: individual (DDO 53, DDO 165, Holmberg I, Holmberg II, IC 2574, M81 dwA, M81 dwB) — galaxies: irregular — galaxies: ISM — infrared: galaxies 1. INTRODUCTION Nearby dwarf galaxies have proven to be ideal laboratories to investigate how stars form out of gas and how, in turn, violent star formation shapes the ambient interstellar medium ( ISM ). These systems are highly susceptible to the formation of shells and holes in the neutral gas phase; more energetic star formation can lead to the formation of gaseous outflows from these systems. Previous studies have shown that dwarf galaxies can be used as test beds of ‘‘simple’’ prescriptions for star formation (since these systems are typically in solid-body rotation and are therefore less affected by shear in the ISM ) and for understanding the connection between mechanical energy input into the ISM (‘‘feedback’’) and future star formation. Given their low metallicities, they also provide a unique opportunity to study the conditions of the ISM in environ- ments that may resemble those in the earliest star-forming systems at high redshift. Based on their ISM properties, dwarf galaxies can be roughly divided into two subgroups: gas-rich dwarf irregulars (dIrrs) and gas-poor dwarf spheroidals/ellipticals (dSph /dE). The gas-rich dIrrs are particularly interesting for studies of current star for- mation, since they still contain the ‘‘fuel’’ for star formation. Although many studies have shown that these objects are rich in atomic hydrogen ( H i; for a review see Skillman 1996), little is known about their molecular gas properties. Many searches for molecular gas (through observations of the most abundant tracer molecule, CO) have been performed but very few dwarf galaxies have been detected in CO so far: no dwarf has been detected in CO at metallicities P 10% Z (Taylor et al. 1998; Barone et al. 2000; Leroy et al. 2005). Similarly, little is known about the dust properties in faint, low-metallicity dwarf galaxies. Some of the brightest dwarfs have been detected with previous far-infrared (far-IR) observatories such as IRAS and ISO (see, e.g., Hunter et al. 1989; Gallagher et al. 1991; Melisse & Israel 1994a, 1994b; Hunter et al. 2001). These early studies found that dwarfs typically have higher dust temperatures than those derived for more massive galaxies, with the peak of the infrared spectral energy distribution (SED) shifted to shorter wavelengths. The more typical ‘‘quiescent’’ dIrr galaxies (with SFR 0:1 M yr 1 ) had remained undetected in the far-IR prior to the advent of the Spitzer Space Telescope; its dramatically increased sensitivity compared to previous observatories has opened up the 1 Max-Planck-Institut fu ¨r Astronomie, D-69117 Heidelberg, Germany. 2 Astronomy Department, Wesleyan University, Middletown, CT 06459. 3 Imperial College London, London SW7 2AZ, UK. 4 Space Telescope Science Institute, Baltimore, MD 21218. 5 Department of Physics and Astronomy, University of Wyoming, Laramie, WY 82071. 6 Princeton University Observatory, Princeton, NJ 08544. 7 California Institute of Technology, Pasadena, CA 91101. 8 Institute of Astronomy, University of Cambridge, Cambridge CB3 0HA, UK. 9 Steward Observatory, University of Arizona, Tucson, AZ 85721. 10 Department of Physics, NewYork University, New York, NY 10003. 11 NASA/Ames Research Center, Moffett Field, CA, 94035. 12 Department of Physics and Astronomy, University of Missouri, Columbia, MO 65211. 13 Department of Astronomy, Yale University, New Haven, CT 06520. 14 Centre for Astrophysics Research, University of Hertfordshire, Hatfield AL10 9AB, UK. 15 Research School of Astronomy & Astrophysics, Mount Stromlo Obser- vatory, Weston ACT 2611, Australia. 16 Department of Physics, Bucknell University, Lewisburg, PA 17837. 102 The Astrophysical Journal, 661:102 Y 114, 2007 May 20 # 2007. The American Astronomical Society. All rights reserved. Printed in U.S.A.
Transcript
DUST AND ATOMIC GAS IN DWARF IRREGULAR GALAXIES OF THE M81 GROUP:THE SINGS AND THINGS VIEW
Fabian Walter,1John M. Cannon,
1,2Helene Roussel,
1George J. Bendo,
3Daniela Calzetti,
4Daniel A. Dale,
5
Bruce T. Draine,6George Helou,
7Robert C. Kennicutt, Jr.,
8,9John Moustakas,
9,10George H. Rieke,
9
Lee Armus,7Charles W. Engelbracht,
9Karl Gordon,
9David J. Hollenbach,
11Janice Lee,
9Aigen Li,
12
Martin J. Meyer,4Eric J. Murphy,
13Michael W. Regan,
4John-David T. Smith,
9Elias Brinks,
14
W. J. G. de Blok,15
Frank Bigiel,1and Michele D. Thornley
16
Received 2006 September 26; accepted 2007 February 12
ABSTRACT
We present observations of the dust and atomic gas phase in seven dwarf irregular galaxies of the M81 group fromthe Spitzer SINGS and VLATHINGS surveys. The Spitzer observations provide a first glimpse of the nature of thenonatomic ISM in these metal-poor (Z � 0:1 Z�), quiescent (SFR � 0:001Y0:1 M� yr�1) dwarf galaxies. Mostdetected dust emission is restricted to H i column densities >1 ; 1021 cm�2, and almost all regions of high H i columndensity (>2:5 ; 1021 cm�2) have associated dust emission. Spitzer spectroscopy of two regions in the brightestgalaxies (IC 2574 and Holmberg II) show distinctly different spectral shapes and aromatic features, although thegalaxies have comparable gas-phase metallicities. This result emphasizes that the strength of the aromatic features isnot a simple linear function of metallicity. We estimate dust masses of �104Y106 M� for the M81 dwarf galaxies,resulting in an average dust-to-gas ratio (Mdust/MH i) of �3 ; 10�4 (1:5 ; 10�3 if only the H i that is associated withdust emission is considered); this is an order of magnitude lower than the typical value derived for the SINGS spirals.The dwarf galaxies are underluminous per unit star formation rate at 70 �m as compared to the more massive galaxiesin SINGS by a factor of �2. However, the average 70/160 �m ratio in the sample dwarf galaxies is higher than what isfound in the other galaxies of the SINGS sample. This can be explained by a combination of a lower dust content inconjunction with a higher dust temperature in the dwarfs.
Nearby dwarf galaxies have proven to be ideal laboratories toinvestigate how stars form out of gas and how, in turn, violentstar formation shapes the ambient interstellarmedium (ISM). Thesesystems are highly susceptible to the formation of shells and holesin the neutral gas phase; more energetic star formation can lead tothe formation of gaseous outflows from these systems. Previousstudies have shown that dwarf galaxies can be used as test beds of‘‘simple’’ prescriptions for star formation (since these systems aretypically in solid-body rotation and are therefore less affected byshear in the ISM) and for understanding the connection betweenmechanical energy input into the ISM (‘‘feedback’’) and future
star formation. Given their low metallicities, they also provide aunique opportunity to study the conditions of the ISM in environ-ments that may resemble those in the earliest star-forming systemsat high redshift.Based on their ISM properties, dwarf galaxies can be roughly
divided into two subgroups: gas-rich dwarf irregulars (dIrrs) andgas-poor dwarf spheroidals/ellipticals (dSph/dE). The gas-richdIrrs are particularly interesting for studies of current star for-mation, since they still contain the ‘‘fuel’’ for star formation.Although many studies have shown that these objects are rich inatomic hydrogen (H i; for a review see Skillman 1996), little isknown about their molecular gas properties. Many searches formolecular gas (through observations of the most abundant tracermolecule, CO) have been performed but very few dwarf galaxieshave been detected in CO so far: no dwarf has been detected inCO at metallicities P10% Z� (Taylor et al. 1998; Barone et al.2000; Leroy et al. 2005).Similarly, little is known about the dust properties in faint,
low-metallicity dwarf galaxies. Some of the brightest dwarfs havebeen detectedwith previous far-infrared (far-IR) observatories suchas IRAS and ISO (see, e.g., Hunter et al. 1989;Gallagher et al. 1991;Melisse & Israel 1994a, 1994b; Hunter et al. 2001). These earlystudies found that dwarfs typically have higher dust temperaturesthan those derived for more massive galaxies, with the peak ofthe infrared spectral energy distribution (SED) shifted to shorterwavelengths.The more typical ‘‘quiescent’’ dIrr galaxies (with SFR �
0:1 M� yr�1) had remained undetected in the far-IR prior to theadvent of the Spitzer Space Telescope; its dramatically increasedsensitivity compared to previous observatories has opened up the
1 Max-Planck-Institut fur Astronomie, D-69117 Heidelberg, Germany.2 Astronomy Department, Wesleyan University, Middletown, CT 06459.3 Imperial College London, London SW7 2AZ, UK.4 Space Telescope Science Institute, Baltimore, MD 21218.5 Department of Physics and Astronomy, University of Wyoming, Laramie,
WY 82071.6 Princeton University Observatory, Princeton, NJ 08544.7 California Institute of Technology, Pasadena, CA 91101.8 Institute of Astronomy,University of Cambridge, CambridgeCB30HA,UK.9 Steward Observatory, University of Arizona, Tucson, AZ 85721.10 Department of Physics, New York University, New York, NY 10003.11 NASA/Ames Research Center, Moffett Field, CA, 94035.12 Department of Physics andAstronomy, University of Missouri, Columbia,
MO 65211.13 Department of Astronomy, Yale University, New Haven, CT 06520.14 Centre for Astrophysics Research, University of Hertfordshire, Hatfield
AL10 9AB, UK.15 Research School of Astronomy & Astrophysics, Mount Stromlo Obser-
vatory, Weston ACT 2611, Australia.16 Department of Physics, Bucknell University, Lewisburg, PA 17837.
102
The Astrophysical Journal, 661:102Y114, 2007 May 20
# 2007. The American Astronomical Society. All rights reserved. Printed in U.S.A.
low-metallicity regime of the extragalactic ISM to exploration inthe far-IR. Early Spitzer observations have naturally concentratedon the brightest and most extremely metal-poor dwarfs. Houcket al. (2004b) show that SBS 0335�052, one of the most metal-poor dwarf galaxies known, has an exceptional SED that is shiftedblueward with a peak at�28 �m (compared to�80 �m for moremetal-rich starburst galaxies and >100 �m for local star-formingspirals). Engelbracht et al. (2004) presented observations of thedwarf galaxy NGC 55, and a larger sample of galaxies showedthat there is a metallicity threshold above which emission fromaromatic features appear (Engelbracht et al. 2005). Smith et al.(2007) used Spitzer spectroscopy to study how the spectral sig-natures of aromatic features change as a function of metallicity.Other recent Spitzer studies of actively star-forming dwarf gal-axies include spectroscopic observations byWu et al. (2006) andO’Halloren et al. (2006), and imaging studies of star-formingdwarfs and Local Group galaxies (including dwarf galaxies) byRosenberg et al. (2006) and Jackson et al. (2006). Cannon et al.(2005, 2006a, 2006b) have presented detailed Spitzer studies ofsome of the most luminous and nearby dwarfs ( IC 2574, NGC1705, and NGC 6822). These case studies have shown that lo-calized star formation has dramatic effects on the multiphaseISM, altering the relative strengths of nebular, far-IR dust, andradio continuum emission.
Here we discuss the distribution of dust and atomic hydrogenin seven dwarf irregular galaxies in the M81 group of galaxies.Our sample spans 2 orders of magnitude in H imasses and a sim-ilar range in star formation rates, from<0.001M� yr�1 (H� non-detections) to�0.1M� yr�1. The general properties of the sampledwarfs are summarized in Table 1. All these dwarf irregular gal-axies are part of the Spitzer Infrared Nearby Galaxies Survey(SINGS; see Kennicutt et al. 2003) and have also been includedin The H iNearby Galaxy Survey (THINGS;Walter et al. 2005).
This paper is organized as follows. In x 2 we summarize theSpitzer MIPS and the VLA H i observations. In x 3 we presentour results, i.e., the distribution of the atomic gas and the dust,IRS spectra of two galaxies, estimates of the dust masses, and acomparison to other galaxies in the SINGS sample. In x 4 wepresent a summary of our study.
2. OBSERVATIONS
2.1. Spitzer MIPS Observations
The 24, 70, and 160 �m data were taken with MIPS on theSpitzer Space Telescope as part of the SINGS survey (Kennicutt
et al. 2003). The observations were obtained using the scan-mapping mode in two separate visits to each galaxy (facilitatingremoval of asteroids and detector artifacts). Each pixel in the mapwas observed 40, 20, and 4 times at 24, 70, and 160 �m, respec-tively, resulting in integration times per pixel of 160, 80, and 16 s,respectively. All MIPS data were processed using the MIPS In-strument Team Data Analysis Tool (Gordon et al. 2005). Sys-tematic uncertainties (e.g., detector nonlinearities, time-dependentresponsivity variations, background removal, etc.) limit the ab-solute flux calibration to�4%, 7%, and 12% in the MIPS 24, 70,and 160 �m bands. The FWHM of the MIPS point-spread func-tions (PSFs) are 600, 1800, and 40 00 at 24, 70, and 160 �m, respec-tively. Formore details on theMIPS data reduction, see Bendo et al.(2006); for a general description of the SINGS observing strategies,see Kennicutt et al. (2003).
The flux densities presented in this paper were derived for aper-tures much larger than theMIPS PSFs, and therefore aperture cor-rections have not been applied. The M81 group is located in adirection inwhich theGalaxy is rich in infrared cirrus (deVries et al.1987). Inspection of individual images reveals that Galactic cirrusemission is indeed present in the longer wavelength MIPS images.However, this emission is distributed over much larger angularscales than the sources of interest and can thus be easily sepa-rated from the galaxies presented in this study.
The aperture for each individual galaxy has been chosencarefully to encompass all the emission visible in all three MIPSbands; apertures were compared with IRAC band 1 and H i im-aging to ensure that the total galaxy extent (i.e., gas and stars)was measured. For each individual galaxy, we used the sameaperture to extract the flux densities from the three MIPS bands.To account for the variations in the background (both instrumentaland due to Galactic cirrus) we have defined multiple backgroundregions for each galaxy that contain the same area as the targetaperture. The (background-subtracted) source flux densities wederived using this technique are the same (within the errors) as thevalues derived by Dale et al. (2005, 2006) in their study of theentire SINGS sample. For consistency we therefore adopt the val-ues of Dale et al. (2006) for our study. The global flux densities aresummarized in Table 1—note that M81 dwA and DDO 165 areMIPS nondetections. The reader is referred to Dale et al. (2006)for the IRAC flux densities of the dwarf galaxies in our sample.
2.2. VLA Observations
H i data for six of the seven M81 group dwarfs presented herewere obtained as part of THINGS, a survey to obtain high-resolution
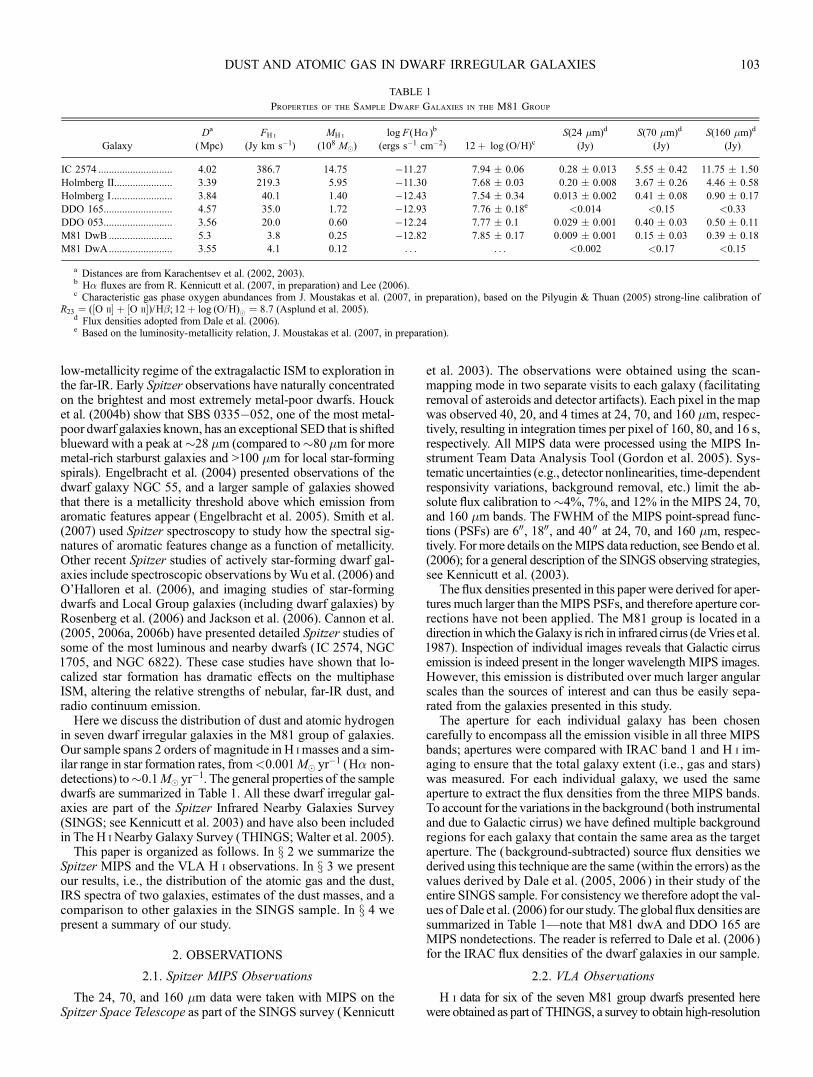
TABLE 1
Properties of the Sample Dwarf Galaxies in the M81 Group
a Distances are from Karachentsev et al. (2002, 2003).b H� fluxes are from R. Kennicutt et al. (2007, in preparation) and Lee (2006).c Characteristic gas phase oxygen abundances from J. Moustakas et al. (2007, in preparation), based on the Pilyugin & Thuan (2005) strong-line calibration of
R23 ¼ (½O ii� þ ½O ii�)/H�; 12þ log (O/H)� ¼ 8:7 (Asplund et al. 2005).d Flux densities adopted from Dale et al. (2006).e Based on the luminosity-metallicity relation, J. Moustakas et al. (2007, in preparation).
DUST AND ATOMIC GAS IN DWARF IRREGULAR GALAXIES 103
NRAO17 VLA H i imaging for 35 nearby galaxies (Walter et al.2005). H i data for DDO 165 were taken from J. M. Cannon et al.2007 (in preparation).
For THINGS, each galaxywas observedwith the VLA in D, C,and B configurations with typical integration times of 1.5, 2.5,and 7 hr, respectively. The calibration and data reduction weredone using the AIPS package.18 The absolute flux scale for thedata was determined by observing the quasar 3C 286 in all ob-serving runs. The time-variable phase and amplitude calibrationwere done using the nearby, secondary calibrators 1313+549 and1252+565, which are unresolved for the arrays used. The uv datawere inspected for each array and bad data points due to eitherinterference or cross-talk between antennae were removed, afterwhich the data were calibrated. After final editing, all data foreach target were combined to form a single data set that was sub-sequently used to create maps of the brightness distribution onthe sky as a function of frequency/velocity (data cubes).
In order to remove the continuum from the line data, we firstdetermined the line-free channels in our observations and sub-tracted the continuum emission in the (u, v)-plane. After that,data cubes (1024 ; 1024 pixels ; 80 channels each)were producedusing the task imagr inAIPS. To boost the angular resolutionwhilestill maintaining a reasonable noise, we use a robust parameter of0.5 for the final imaging. To ensure that we reach identical beamsizes for all THINGSobservations, the datawere subsequently con-volved to a common resolution of 10 00. This resulted in a typical rmsnoise per channel of 0.5mJy beam�1 for a 2.5 km s�1 channel (cor-responding to NH i ¼ 1:5 ; 1019 cm�2). To separate real emissionfrom noise in the final integrated H i maps, we only consider re-gions that show emission in consecutive channels above a set level(�2 �) in slightly convolved (20 00 ) cubes. Note that the data forDDO 165 are at a resolution of 2100.
The fluxes in the integrated THINGSH imap are corrected forthe fact that typically the residual flux of the source in cleaned
channel maps is overestimated (sometimes by a factor of a few)due to the different beam sizes of the dirty and cleaned beams(for details see, e.g., Jorsater & vanMoorsel 1995;Walter &Brinks1999). In the integrated H i maps this typically leads to flux cor-rections of order 25%Y40%. To correct for this, we have scaledthe residual fluxes by the ratio of the dirty and clean beam sizesand estimate that our column densities are correct within 10%(including the intrinsic uncertainties of the flux calibration; theinferred H i masses are given in Table 1).
3. DUST AND H i CHARACTERISTICS
In Figures 1Y7 we present images of the individual galaxies(in order of decreasing H i mass). For each galaxy, we show sixpanels: panel a is the integrated THINGS H imap at 10 00 resolu-tion (only exception: DDO 165 beam size: 2100 ); unless otherwisestated, one H i contour is drawn at NH i ¼ 1 ; 1021 cm�2 (i.e.,close to the canonical star formation threshold; e.g., Skillman1996). An optical R-band and the Spitzer IRAC band 1 (3.6 �m)image of the galaxies are shown in panels b and c (the optical im-ages have been observed either at the Calar Alto 2.2 m telescopeor are taken from the ancillary SINGS data archive). Panels d, e,and f are the MIPS 24, 70, and 160 �m images of the same area.All panels show the same H i contour as presented in the firstpanel. The beam sizes for both theH i andMIPS images are shownin the lower left of the respective images.For each galaxy with THINGS H i imaging, we compare the
radial profiles of theH i, 70 and160�mMIPS images inFigure 8 (asdiscussed for the individual systems below). The deprojectionparameters (inclination, position angle) used for the creation ofthe radial profiles have been derived from the H imaps (see cap-tion Fig. 8).In the following, we briefly discuss the individual galaxies:IC 2574 (Fig.1).—IC 2574 is the largest galaxy in our sample,
and its H imorphology is dominated by the presence of H i holes(Walter & Brinks 1999). The brightest region in the MIPS bandsis the supergiant shell (SGS) region in the northeast (Walter et al.1998); a spatially resolved Spitzer case study of this SGS regionis presented in Cannon et al. 2005. The elevated emission towardthe southeast corner in the 160 �m image is caused by Galactic
Fig. 1.—IC 2574: (a) integrated THINGSH imap (contour shown atNH i ¼ 1021 cm�2 in all panels); (b) R-band image; (c) IRAC 3.6 �m image; (d, e, and f ) 24, 70, and160 �m images, respectively. The sizes of the H i and MIPS beams are given in the lower left corners of their respective panels.
17 The National Radio Astronomy Observatory is a facility of the NationalScience Foundation operated under cooperative agreement by Associated Uni-versities, Inc.
18 The Astronomical Image Processing System (AIPS) has been developedby the NRAO.
WALTER ET AL.104 Vol. 661
cirrus emission (but this emission can be separated from theemission of IC 2574). Dust emission traced by the 70 �memission is detected out to galactocentric radii of 70 (�7 kpc;see Fig. 8).
Holmberg II (Fig. 2).—The distribution of H i in Holmberg IIis also characterized by the presence of numerous H i holes (Puche
et al. 1992). As in the case of IC 2574, the changing morphol-ogies in the individual MIPS bands and the corresponding chang-ing spectral energy distributions stress the importance of localeffects in characterizing the far-infrared emission (e.g., Cannonet al. 2005). The radial surface brightness profiles (Fig. 8) showthat dust is detected out to at least 40 (�4 kpc).
Fig. 3.—Holmberg I: (a) integrated THINGSH imap (contour shown atNH i ¼ 1021 cm�2 in all panels); (b)R-band image; (c) IRAC3.6�m image; (d, e, and f ) 24, 70,and 160 �m images, respectively. The sizes of the H i and MIPS beams are given in the lower left corners of their respective panels.
Fig. 2.—Holmberg II: (a) integrated THINGSH imap (contour shown atNH i ¼ 1021 cm�2 in all panels); (b) R-band image; (c) 3.6 �m image; (d, e, and f ) 24, 70, and160 �m images, respectively. The sizes of the H i and MIPS beams are given in the lower left corners of their respective panels.
DUST AND ATOMIC GAS IN DWARF IRREGULAR GALAXIES 105No. 1, 2007
Holmberg I (Fig. 3).—The H i distribution in Holmberg I ischaracterized by one giant H i hole (Ott et al. 2001). The H i struc-ture encompasses the optical emission and faint star formation ispresent on the rim toward the southeast (see also x 3.4). This is theregion where faint emission is detected in all three MIPS bands. At70�m, there is also diffuse emission present toward the western H i
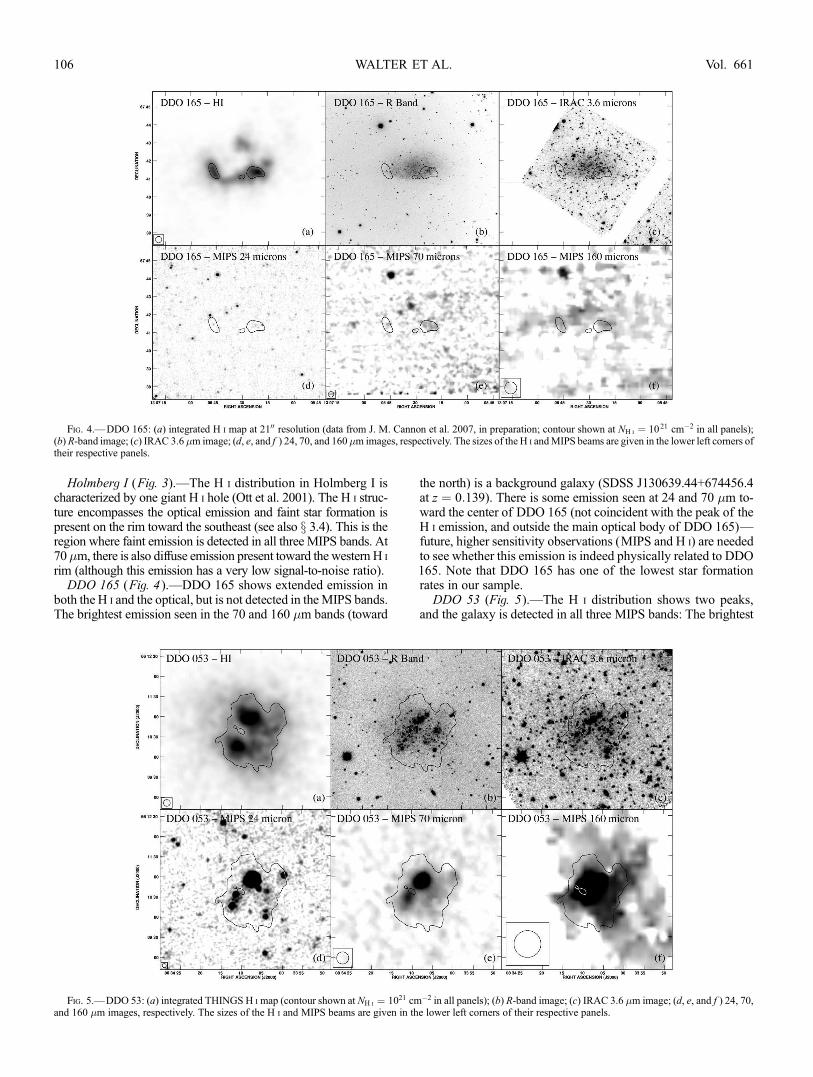
rim (although this emission has a very low signal-to-noise ratio).DDO 165 (Fig. 4 ).—DDO 165 shows extended emission in
both the H i and the optical, but is not detected in theMIPS bands.The brightest emission seen in the 70 and 160 �m bands (toward
the north) is a background galaxy (SDSS J130639.44+674456.4at z ¼ 0:139). There is some emission seen at 24 and 70 �m to-ward the center of DDO 165 (not coincident with the peak of theH i emission, and outside the main optical body of DDO 165)—future, higher sensitivity observations (MIPS and H i) are neededto see whether this emission is indeed physically related to DDO165. Note that DDO 165 has one of the lowest star formationrates in our sample.DDO 53 (Fig. 5).—The H i distribution shows two peaks,
and the galaxy is detected in all three MIPS bands: The brightest
Fig. 5.—DDO 53: (a) integrated THINGS H imap (contour shown at NH i ¼ 1021 cm�2 in all panels); (b) R-band image; (c) IRAC 3.6 �m image; (d, e, and f ) 24, 70,and 160 �m images, respectively. The sizes of the H i and MIPS beams are given in the lower left corners of their respective panels.
Fig. 4.—DDO 165: (a) integrated H i map at 2100 resolution (data from J. M. Cannon et al. 2007, in preparation; contour shown at NH i ¼ 1021 cm�2 in all panels);(b) R-band image; (c) IRAC 3.6 �m image; (d, e, and f ) 24, 70, and 160 �m images, respectively. The sizes of the H i andMIPS beams are given in the lower left corners oftheir respective panels.
WALTER ET AL.106 Vol. 661
emission seen at 24 �m is associated with the northern and south-ern H i peak; the northern region is also the strongest in the 70 �mimage. The 160 �m data are noisy, but 160 �m emission is stillpresent in the regions seen in the 70 �m image. The compact natureof DDO 53 is also evidenced by the radial surface brightness pro-files shown in Fig. 8.
M81 dwB (Fig. 6 ).—M81 dwB is the galaxy with the lowestmeasured star formation rate in our sample. The galaxy shows acompact structure in H i and the MIPS bands (cf. Fig. 8). The
detection at 160 �m is marginal (see Table 1) and is surroundedby elevated background emission present.
M81 dwA (Fig. 7).—M81 dwA is the faintest dwarf in oursample. Similar to Holmberg I, the H i distribution is character-ized by one large H i shell which encompasses most of the op-tical galaxy. No ongoing star formation has been detected inM81 dwA (Miller&Hodge 1994); it is also aMIPS nondetection.This may be explained by the fact that H i column densities donot reach values higher than NH i ¼ 5 ; 1020 cm�2 in this galaxy
Fig. 7.—M81 dwA: (a) integrated THINGSH imap (contour shown atNH i¼ 3 ; 1020 cm�2 in all panels); (b) R-band image; (c) IRAC 3.6 �m image; (d, e, and f ) 24,
70, and 160 �m images, respectively. The sizes of the H i and MIPS beams are given in the lower left corners of their respective panels.
Fig. 6.—M81 dwB: (a) integrated THINGSH imap (contour shown atNH i ¼ 1021 cm�2 in all panels); (b) R-band image; (c) IRAC 3.6 �m image; (d, e, and f ) 24, 70,and 160 �m images, respectively. The sizes of the H i and MIPS beams are given in the lower left corners of their respective panels.
DUST AND ATOMIC GAS IN DWARF IRREGULAR GALAXIES 107No. 1, 2007
(i.e., the H i column densities are below the canonical thresholdfor star formation).
3.1. H i Threshold for Warm Dust
From an inspection of the morphologies (Figs. 1Y7) and ra-dial profiles (Fig. 8) it is clear that the dust emission appears tobe related to the distribution of the H i, at least to first order. Toquantify this, we investigate whether there is a certain H i thresh-old above which most of the dust emission is present. In the fol-lowingwe use the 70�mdata as a tracer for thewarmdust emissionas they are (unlike the 24 �m data) not affected by the presenceof contaminating point sources (stars and background objects) inthe field. Furthermore, they have higher resolution and signal-to-noise ratio (S/N) than the 160 �mmeasurements. In Figure 9 weplot histograms of the distribution of the 70�mflux density abovea threshold of 1.8MJy sr�1 (about the 5� level, i.e., encompassingmost of the detected dust emission) as a function of H i columndensity for each galaxy (solid histogram). For each galaxy we alsoshow the pixel-by-pixel distribution of all H i column densities(dashed histogram). From Figure 9 (and the previous discussionon the relative distribution of H i and 70 �m emission) we drawthe following conclusions:
1. Most of the detected 70 �m emission is coincident withH i column densities of NH i > 1021 cm�2 [with a peak around
(1Y2) ; 1021 cm�2]. In the case of Holmberg I, the peak in the firsthistogram bin at low surface densities is spurious and a result ofthe lower S/N in these data.2. At high column densities (>2:5 ; 1021 cm�2), the solid
(70 �m) and dashed (H i) histograms follow each other closely,implying that most of the high H i column density regions are as-sociated with dust emission. In other words, there appear to beonly few regions of high H i column densities that are not as-sociated with warm dust emission.
3.2. IRS Spectroscopy
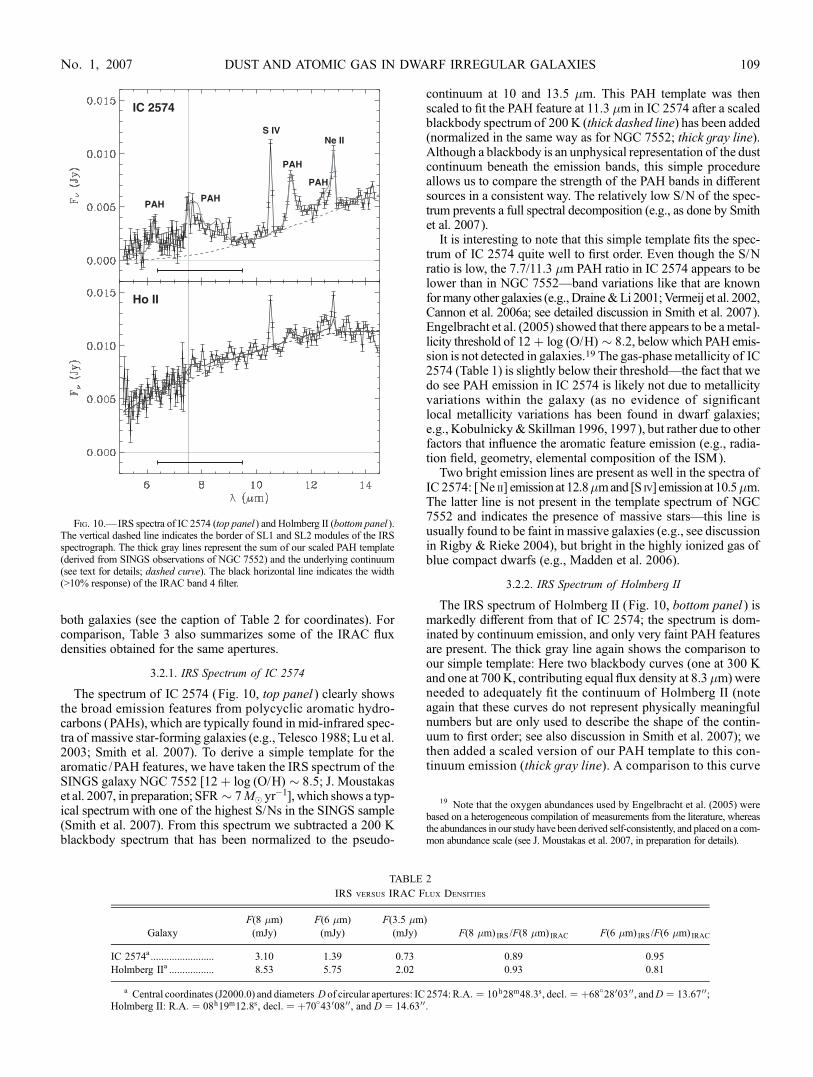
Selected regions in some of the galaxies in this sample havealso been observed with the Spitzer IRS spectrograph (Houcket al. 2004a) as part of SINGS. In the following we will discussIRS 5Y14 �m, low-resolution spectra obtained for specific re-gions in the two most active galaxies in our sample, IC 2574 andHolmberg II (Fig. 10, both SFR � 0:1 M� yr�1). The spectrahave been extracted over a circular aperture of a diameter of�1400 that was centered on the brightest region seen at 8 �m in
Fig. 8.—Comparison of the H i (solid lines), 70 �m (short-dashed lines), and160 �m (long-dashed lines) radial profile of five M81 group dwarf irregular gal-axies. The following deprojection parameters (position angle ¼ P:A.; inclination ¼i )were used to create these profiles: IC 2574 [P:A: ¼ þ60�, i ¼ 57�], Holmberg II[P:A: ¼ �15�, i ¼ 26�], Holmberg I [P:A: ¼ 55�, i ¼ 46�], DDO 53 [P:A: ¼�45�, i ¼ 40�], and M81 dwB [P:A: ¼ �60�, i ¼ 46�].
Fig. 9.—Solid histogram: Distribution of the 70 �m flux density above athreshold of 1.8 MJy sr�1 (�5 �) as a function of H i column density. Dashedhistogram: Total distribution of H i column densities.
WALTER ET AL.108 Vol. 661
both galaxies (see the caption of Table 2 for coordinates). Forcomparison, Table 3 also summarizes some of the IRAC fluxdensities obtained for the same apertures.
3.2.1. IRS Spectrum of IC 2574
The spectrum of IC 2574 (Fig. 10, top panel ) clearly showsthe broad emission features from polycyclic aromatic hydro-carbons (PAHs), which are typically found in mid-infrared spec-tra of massive star-forming galaxies (e.g., Telesco 1988; Lu et al.2003; Smith et al. 2007). To derive a simple template for thearomatic /PAH features, we have taken the IRS spectrum of theSINGS galaxy NGC 7552 [12þ log (O/H) � 8:5; J. Moustakaset al. 2007, in preparation; SFR � 7M� yr�1], which shows a typ-ical spectrum with one of the highest S/Ns in the SINGS sample(Smith et al. 2007). From this spectrum we subtracted a 200 Kblackbody spectrum that has been normalized to the pseudo-
continuum at 10 and 13.5 �m. This PAH template was thenscaled to fit the PAH feature at 11.3 �m in IC 2574 after a scaledblackbody spectrum of 200 K (thick dashed line) has been added(normalized in the same way as for NGC 7552; thick gray line).Although a blackbody is an unphysical representation of the dustcontinuum beneath the emission bands, this simple procedureallows us to compare the strength of the PAH bands in differentsources in a consistent way. The relatively low S/N of the spec-trum prevents a full spectral decomposition (e.g., as done by Smithet al. 2007).
It is interesting to note that this simple template fits the spec-trum of IC 2574 quite well to first order. Even though the S/Nratio is low, the 7.7/11.3 �m PAH ratio in IC 2574 appears to belower than in NGC 7552—band variations like that are knownformany other galaxies (e.g., Draine&Li 2001;Vermeij et al. 2002,Cannon et al. 2006a; see detailed discussion in Smith et al. 2007).Engelbracht et al. (2005) showed that there appears to be ametal-licity threshold of 12þ log (O/H) � 8:2, belowwhich PAH emis-sion is not detected in galaxies.19 The gas-phasemetallicity of IC2574 (Table 1) is slightly below their threshold—the fact that wedo see PAH emission in IC 2574 is likely not due to metallicityvariations within the galaxy (as no evidence of significantlocal metallicity variations has been found in dwarf galaxies;e.g., Kobulnicky&Skillman 1996, 1997), but rather due to otherfactors that influence the aromatic feature emission (e.g., radia-tion field, geometry, elemental composition of the ISM).
Two bright emission lines are present as well in the spectra ofIC 2574: [Ne ii] emission at 12.8�mand [S iv] emission at 10.5�m.The latter line is not present in the template spectrum of NGC7552 and indicates the presence of massive stars—this line isusually found to be faint in massive galaxies (e.g., see discussionin Rigby & Rieke 2004), but bright in the highly ionized gas ofblue compact dwarfs (e.g., Madden et al. 2006).
3.2.2. IRS Spectrum of Holmberg II
The IRS spectrum of Holmberg II (Fig. 10, bottom panel ) ismarkedly different from that of IC 2574; the spectrum is dom-inated by continuum emission, and only very faint PAH featuresare present. The thick gray line again shows the comparison toour simple template: Here two blackbody curves (one at 300 Kand one at 700K, contributing equal flux density at 8.3 �m)wereneeded to adequately fit the continuum of Holmberg II (noteagain that these curves do not represent physically meaningfulnumbers but are only used to describe the shape of the contin-uum to first order; see also discussion in Smith et al. 2007); wethen added a scaled version of our PAH template to this con-tinuum emission (thick gray line). A comparison to this curve
Fig. 10.—IRS spectra of IC 2574 (top panel ) and Holmberg II (bottom panel ).The vertical dashed line indicates the border of SL1 and SL2 modules of the IRSspectrograph. The thick gray lines represent the sum of our scaled PAH template(derived from SINGS observations of NGC 7552) and the underlying continuum(see text for details; dashed curve). The black horizontal line indicates the width(>10% response) of the IRAC band 4 filter.
a Central coordinates (J2000.0) and diameters D of circular apertures: IC 2574: R:A: ¼ 10h28m48:3s, decl: ¼ þ68�2800300, andD ¼ 13:6700;Holmberg II: R:A: ¼ 08h19m12:8s, decl: ¼ þ70�4300800, and D ¼ 14:6300.
19 Note that the oxygen abundances used by Engelbracht et al. (2005) werebased on a heterogeneous compilation of measurements from the literature, whereasthe abundances in our study have been derived self-consistently, and placed on a com-mon abundance scale (see J. Moustakas et al. 2007, in preparation for details).
DUST AND ATOMIC GAS IN DWARF IRREGULAR GALAXIES 109No. 1, 2007
shows that, although the S/N is low, faint PAH features appear tobe present at 6.2, 7.7, 11.3, and 12.7�m—e.g., the 11.3 �mPAHfeature is detected at 7 � (total flux; peak: 4 �). From this it isclear that the PAH-to-continuum ratio in Holmberg II is muchlower than in the case of IC 2574 as discussed below. We notethat the gas-phase metallicity of Holmberg II (Table 1) is lowerthan in IC 2574 by nearly a factor of 2 (below the threshold de-rived by Engelbracht et al., 2005). This result emphasizes thefact that the strength of the PAH features is not a simple linear func-tion of metallicity (see also Smith et al. [2007], who find a widerange of PAH strengths [factor of �10] near the Engelbrachtet al. threshold). As in the case of IC 2574, line emission from[Ne ii] and [S iv] is detected in Holmberg II.
3.2.3. PAH-to-Continuum Ratios
Using our simple decomposition of the PAH features andthe continuum emission, we can now constrain the PAH-to-continuum ratios for both galaxies. We do this for two bands:(1) the IRAC band 4 (‘‘8 �m band’’), encompassing the broadPAH features at 7.7 and 8.6 �m (see the horizontal line inFig. 10 for the wavelength range covered by the 10% responseof the IRAC band 4); and (2) the PAH band at 11.3 �m (here in-tegrated within a mock square filter between 10.8 and 11.8 �m).We also calculate the PAH-to-total IR luminosity ratios for bothregions below (but note that the method employed here is notdirectly comparable to the one used in Smith et al. 2007).
IC 2574.—From the IRS spectrum we derive a flux density of2.7 mJy for the IRAC band 4 bandpass, which is in good agree-ment with the value derived from the actual IRAC band 4 mea-surement (3.0 mJy; see Table 3). The continuum contribution is0.7 mJy and the contribution from the PAH features is 2.0 mJy;i.e., we derive a PAH-to-continuum ratio for this spectral regionof �2.9. For the 11 �m feature we derive a ratio of 0.5 (con-tinuum: 3.3 mJy, PAH: 1.7 mJy). Using our definitions for the8 and 11 �m bandpasses and the total infrared (TIR) luminositiesin this aperture (LTIR, derived from theMIPS images and using therelation in Dale & Helou 2002), we get the following ratios:LPAH; 8 �m/LTIR ¼ 0:0089 and LPAH; 11 �m/LTIR ¼ 0:0011.
Holmberg II.—From the IRS spectrum we derive a flux den-sity of 7.9 mJy for the IRAC band 4 bandpass, which is in goodagreement with the value derived from the actual IRAC band 4measurement (8.53 mJy; Table 3). The continuum contributionis 7.2 mJy, the contribution from PAHs is 0.7 mJy, leading to aPAH-to-continuum ratio of 0.1. For the 11 �m feature the ratio iseven lower, 0.02 (continuum: 10.4 mJy, PAH: 0.2 mJy). The cor-responding ratios compared to the total infrared luminosity inthis aperture are LPAH; 8 �m/LTIR ¼ 0:0037 and LPAH; 11 �m/LTIR ¼0:0002. Given the faintness of the PAH features in Holmberg II,these values are uncertain (by �50%).
For comparison, we also derive the PAH-to-continuum ratiosfor our template galaxy NGC 7552 and get flux density ratios of6.3 and 0.9 for the IRAC 4 and [10.8; 11.8] �m bandpasses, re-spectively. For the TIR luminosities we get the following ratiosfor NGC 7552: LPAH; 8 �m/LTIR ¼ 0:070 and LPAH; 11 �m/LTIR ¼0:0077; i.e., the ratio in IC 2574 is about a factor of 7 (HolmbergII: factor of >20) less than in our template galaxy (see Smith et al.2007 for variations within the SINGS sample).
3.3. Global Relations for the M81 Group Dwarfs
In the following we compare the properties found for theM81 dwarf irregular galaxies to other galaxies in the SINGSsample (Kennicutt et al. 2003). To do so, we have divided theSINGS galaxies into four categories: the M81 group dwarf ir-regular galaxies of this study (11Y13, circles), other dwarf gal-axies (open circles), elliptical /S0s (open squares), and spiralgalaxies (crosses). All MIPS flux densities for the SINGS galax-ies are taken from Dale et al. (2006), and the gas-phase metal-licities are taken from J. Moustakas et al. (2007, in preparation,based on the Pilyugin & Thuan 2005 strong-line abundancecalibration).As there apparently exists some correlation between the H i
and the 70 �m emission (see discussion in the previous sec-tions), we start by comparing the H imasses to the 70 �m specificluminosity20 in Figure 11a. It is obvious that there is a largescatter between the two quantities (the dashed line indicates alinear relationship). If we plot the absolute blue magnitudes (MB,taken from J. Moustakas et al. 2007, in preparation) as a functionof the 70 �m specific luminosity instead (Fig. 11b), this relationgets tighter (dashed line). The larger scatter in the H iY70 �mrelation is due to the fact that the dwarf irregular galaxies of oursample havemore H imass per bluemagnitude compared tomoremassive spirals. This fact, i.e., that MH i/MB increases for dwarfirregular galaxies was noted long before (e.g., Skillman 1996).As a next step, we plot the star formation rates (SFRs) of in-
dividual galaxies as a function of the 70 �m specific luminosity(Fig. 12a). TheSFRswere derived using SFR ¼ L(H� corr)/1:26 ;1041 ergs s�1 (M� yr�1) (Kennicutt 1998; assuming solarmetallicityand the Salpeter [1955]) initial mass function between 0.1 and100M�). L(H� corr) is theH� luminosity corrected for extinctionwithin the galaxy. Here we use the relation derived for SINGSgalaxies byR.Kennicutt et al. (2007, in preparation) andD.Calzettiet al. (2007, in preparation): F(H� )corr ¼ F(H� )obs þ 0:035 ;F 0(24 �m). F(H� )obs is the observed H� flux (in ergs s�1 cm�2,corrected for Galactic absorption and contribution from [N ii])taken from R. Kennicutt et al. (2007, in preparation) and Lee2006; F0(24 �m) is defined as F 0(24 �m) ¼ 1:25 ; 1013 Hz ;F(24 �m) (Jy) [i.e., F(24 �m) multiplied by the observed fre-quency in Hz]. SFRs were only derived for those SINGS gal-axies for which accurate H� measurements are available. Thetighter relation between L(70 �m) and SFR [as compared to theMB-L (70 �m) relation discussed above], can (to first order) beexplained by the fact that, typically, 70 �m is close to the peak ofthe far-IR emission and thus is a measure of the total bolometricluminosity, which is expected to scale with the SFR.However, from Figure 12a it is also obvious that the galaxies
do not follow a linear relation over all luminosities (as indicatedby the dashed line). To exemplify this, the ratio of the 70 �m
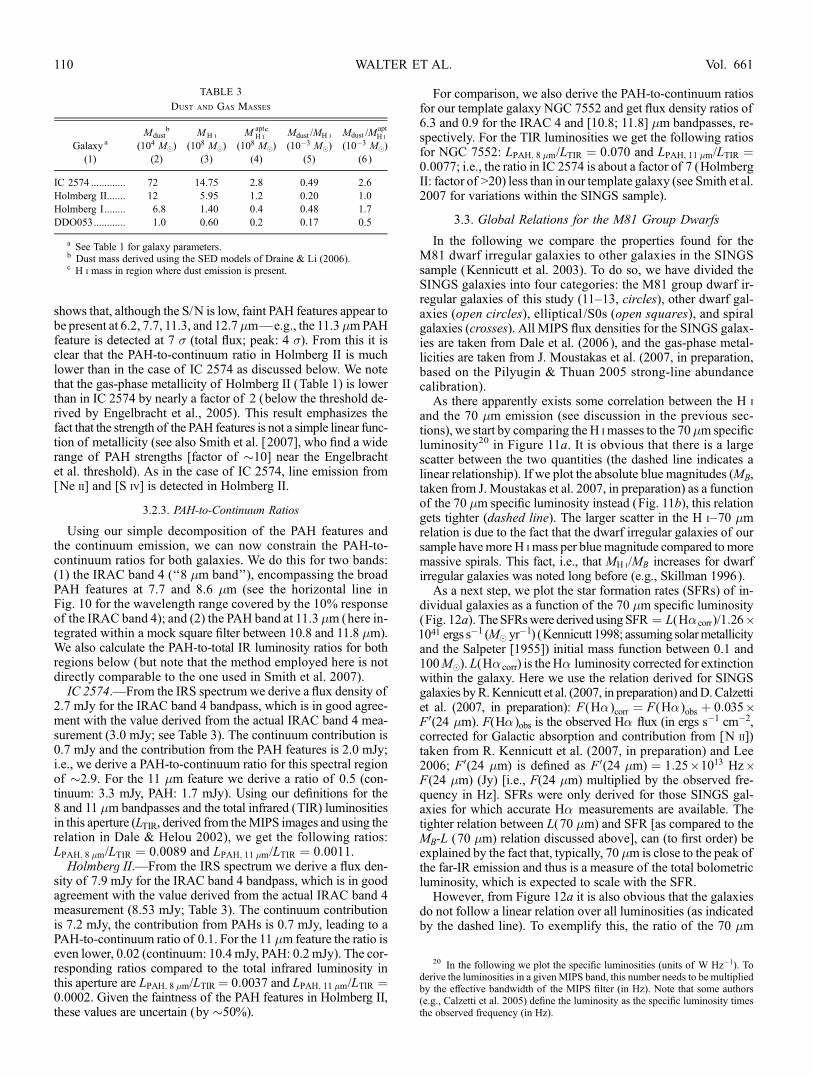
TABLE 3
Dust and Gas Masses
Galaxya
(1)
Mdustb
(104 M�)
(2)
MH i
(108 M�)
(3)
MaptH i
c
(108 M�)
(4)
Mdust /MH i
(10�3 M�)
(5)
Mdust /MaptH i
(10�3 M�)
(6 )
IC 2574 ............. 72 14.75 2.8 0.49 2.6
Holmberg II....... 12 5.95 1.2 0.20 1.0
Holmberg I........ 6.8 1.40 0.4 0.48 1.7
DDO053............ 1.0 0.60 0.2 0.17 0.5
a See Table 1 for galaxy parameters.b Dust mass derived using the SED models of Draine & Li (2006).c H i mass in region where dust emission is present.
20 In the following we plot the specific luminosities (units of W Hz�1). Toderive the luminosities in a givenMIPS band, this number needs to be multipliedby the effective bandwidth of the MIPS filter (in Hz). Note that some authors(e.g., Calzetti et al. 2005) define the luminosity as the specific luminosity timesthe observed frequency (in Hz).
WALTER ET AL.110 Vol. 661
specific luminosity and the SFR is plotted in Figure 12b as a func-tion of the gas-phase oxygen abundance (taken from J.Moustakaset al. 2007, in preparation). If there was a linear relation betweenthe 70�memission and the SFR, onewould expect the symbols tolie near a horizontal line in this plot. However, the dwarfs, shownas circles, clearly occupy a lower L70 �m/SFR space compared tothe more massive galaxies. On average, the dwarf galaxies ap-pear to be underluminous in 70�memission relative to their SFRby a factor of �2.A similar conclusion (dwarfs have lowerLIR/LH�)has been reached by Hunter et al. 1989, albeit for more luminoussystems. This behavior may, to first order, be attributed to the factthat these objects have low metallicities and low dust contents
(see discussion in x 3.5 and Draine et al. 2007). However, it isalso clear that the scatter is large and that there is no simple relationbetween oxygen abundance and 70 �m luminosities per unit SF.
We now investigate how the global MIPS colors (here the70/160 and 70/24 �m ratios) of the M81 groups dwarfs compareto the other SINGS galaxies. In Figure 13 we plot both ratios as afunction of the oxygen abundance: Although the scatter is large,the dwarf galaxies have elevated 70/160 and 70/24�mratios com-pared to the spiral galaxies in SINGS. The elevated 70/160 �mratios imply that the effective temperature of the dust in the dwarfirregular galaxies is on average higher than in more massivespirals. In this simplistic picture, the higher effective temperature
Fig. 11.—(a) H imass as a function of 70 �m specific luminosity. (b) Blue magnitudes (MB) as a function of 70 �m specific luminosity. The dashed line in both plotsrepresents a linear relationship between the two variables.
Fig. 12.—(a) SFR as a function of 70 �m specific luminosity. (b) Ratio of 70 �m specific luminosity and SFR as a function of metallicity. The dashed line in the leftpanel represents a linear relationship between the two variables (same relation as shown in the right panel).
DUST AND ATOMIC GAS IN DWARF IRREGULAR GALAXIES 111No. 1, 2007
results in a peak of the SED that is shifted toward the 70 �mwaveband (cf. Hunter et al. 1989; Dale et al. 2005). In this context it isinteresting to keep in mind that the L70 �m/SFR ratio in dwarfs islower than in the spirals (see above). In other words, if the dusttemperature in our sample dwarfs were the same as in the spirals,the L70 �m/SFR ratio would decrease even further.
The elevated 70/24 �m ratio in our sample dwarfs is moredifficult to interpret as the origin of the 24 �m emission is notcertain.According to themodels byDraine&Li (2006), this emis-sion is due to in part to single-photon heating, although in galaxieswith strong 24 �m emission it is primarily due to warm grains instrong radiation fields. The 24 �m luminosity thus depends on theintensity of the radiation heating the dust (which depends on the
density in the H ii regions, the degree of clustering of O stars, aswell as on the dust abundance). Future detailed modeling of theSEDs is needed to fully describe this behavior. We also note thatour results do not necessarily hold for all classes of dwarf gal-axies; i.e., extreme cases such as the metal-poor blue compactdwarf SBS 0335�052 have more extreme colors (very low70/24 �m ratio; Houck et al. 2004b).
3.4. Spatial Comparison to H�
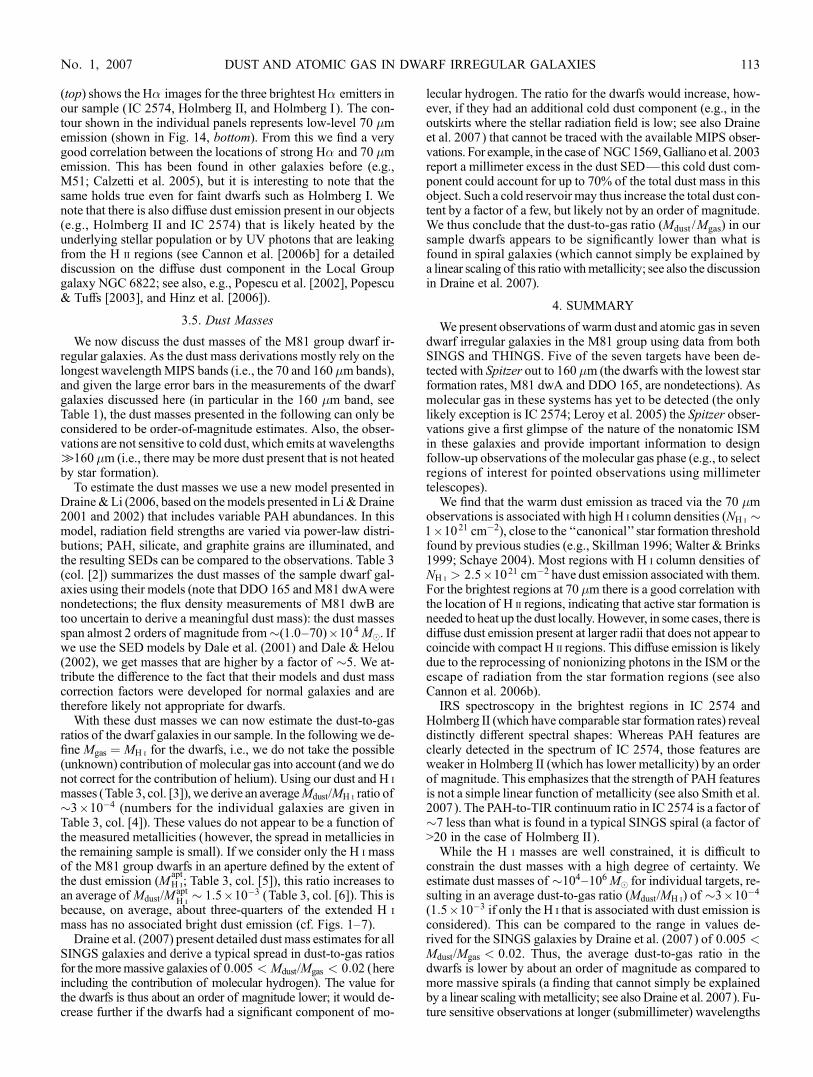
The apparent strong correlation between the 70 �m lumi-nosities and the SFR implies that the ongoing star formation isthe main heating source for the warm dust. We now compare thespatial distribution of the H� and the 70 �m emission: Figure 14
Fig. 13.—(a) 70Y24 �m flux density ratio as a function of oxygen abundance. (b) 70Y160 �m flux density ratio as a function of oxygen abundance.
Fig. 14.—Top: H� images for the three brightest dwarf galaxies in our sample: (a) IC 2574, (b) Holmberg II, and (c) Holmberg I. Contours indicate 70 �m surfacebrightness levels: (a) 1.8 MJy sr�1, (b) 4 MJy sr�1, and (c) 2.6 MJy sr�1. Bottom: 70 �m maps of the three galaxies with the same contour overlaid (the emission seentoward the northwest of Holmberg I is noise).
WALTER ET AL.112 Vol. 661
(top) shows the H� images for the three brightest H� emitters inour sample (IC 2574, Holmberg II, and Holmberg I). The con-tour shown in the individual panels represents low-level 70 �memission (shown in Fig. 14, bottom). From this we find a verygood correlation between the locations of strong H� and 70 �memission. This has been found in other galaxies before (e.g.,M51; Calzetti et al. 2005), but it is interesting to note that thesame holds true even for faint dwarfs such as Holmberg I. Wenote that there is also diffuse dust emission present in our objects(e.g., Holmberg II and IC 2574) that is likely heated by theunderlying stellar population or by UV photons that are leakingfrom the H ii regions (see Cannon et al. [2006b] for a detaileddiscussion on the diffuse dust component in the Local Groupgalaxy NGC 6822; see also, e.g., Popescu et al. [2002], Popescu& Tuffs [2003], and Hinz et al. [2006]).
3.5. Dust Masses
We now discuss the dust masses of the M81 group dwarf ir-regular galaxies. As the dust mass derivations mostly rely on thelongest wavelengthMIPS bands (i.e., the 70 and 160 �m bands),and given the large error bars in the measurements of the dwarfgalaxies discussed here (in particular in the 160 �m band, seeTable 1), the dust masses presented in the following can only beconsidered to be order-of-magnitude estimates. Also, the obser-vations are not sensitive to cold dust, which emits at wavelengths3160 �m (i.e., there may be more dust present that is not heatedby star formation).
To estimate the dust masses we use a new model presented inDraine&Li (2006, based on themodels presented in Li&Draine2001 and 2002) that includes variable PAH abundances. In thismodel, radiation field strengths are varied via power-law distri-butions; PAH, silicate, and graphite grains are illuminated, andthe resulting SEDs can be compared to the observations. Table 3(col. [2]) summarizes the dust masses of the sample dwarf gal-axies using their models (note that DDO 165 andM81 dwAwerenondetections; the flux density measurements of M81 dwB aretoo uncertain to derive a meaningful dust mass): the dust massesspan almost 2 orders of magnitude from�(1:0Y70) ; 104 M�. Ifwe use the SED models by Dale et al. (2001) and Dale & Helou(2002), we get masses that are higher by a factor of �5. We at-tribute the difference to the fact that their models and dust masscorrection factors were developed for normal galaxies and aretherefore likely not appropriate for dwarfs.
With these dust masses we can now estimate the dust-to-gasratios of the dwarf galaxies in our sample. In the following we de-fine Mgas ¼ MH i for the dwarfs, i.e., we do not take the possible(unknown) contribution of molecular gas into account (andwe donot correct for the contribution of helium). Using our dust and H i
masses (Table 3, col. [3]), we derive an averageMdust/MH i ratio of�3 ; 10�4 (numbers for the individual galaxies are given inTable 3, col. [4]). These values do not appear to be a function ofthe measured metallicities (however, the spread in metallicies inthe remaining sample is small). If we consider only the H i massof the M81 group dwarfs in an aperture defined by the extent ofthe dust emission (M
aptH i; Table 3, col. [5]), this ratio increases to
an average of Mdust/MaptH i
� 1:5 ; 10�3 (Table 3, col. [6]). This isbecause, on average, about three-quarters of the extended H i
mass has no associated bright dust emission (cf. Figs. 1Y7).Draine et al. (2007) present detailed dust mass estimates for all
SINGS galaxies and derive a typical spread in dust-to-gas ratiosfor themoremassive galaxies of 0:005 < Mdust/Mgas < 0:02 (hereincluding the contribution of molecular hydrogen). The value forthe dwarfs is thus about an order of magnitude lower; it would de-crease further if the dwarfs had a significant component of mo-
lecular hydrogen. The ratio for the dwarfs would increase, how-ever, if they had an additional cold dust component (e.g., in theoutskirts where the stellar radiation field is low; see also Draineet al. 2007) that cannot be traced with the available MIPS obser-vations. For example, in the case of NGC1569,Galliano et al. 2003report a millimeter excess in the dust SED—this cold dust com-ponent could account for up to 70% of the total dust mass in thisobject. Such a cold reservoir may thus increase the total dust con-tent by a factor of a few, but likely not by an order of magnitude.We thus conclude that the dust-to-gas ratio (Mdust /Mgas) in oursample dwarfs appears to be significantly lower than what isfound in spiral galaxies (which cannot simply be explained bya linear scaling of this ratiowithmetallicity; see also the discussionin Draine et al. 2007).
4. SUMMARY
We present observations of warm dust and atomic gas in sevendwarf irregular galaxies in the M81 group using data from bothSINGS and THINGS. Five of the seven targets have been de-tected with Spitzer out to 160 �m (the dwarfs with the lowest starformation rates, M81 dwA and DDO 165, are nondetections). Asmolecular gas in these systems has yet to be detected (the onlylikely exception is IC 2574; Leroy et al. 2005) the Spitzer obser-vations give a first glimpse of the nature of the nonatomic ISMin these galaxies and provide important information to designfollow-up observations of the molecular gas phase (e.g., to selectregions of interest for pointed observations using millimetertelescopes).
We find that the warm dust emission as traced via the 70 �mobservations is associated with high H i column densities (NH i �1 ; 1021 cm�2), close to the ‘‘canonical’’ star formation thresholdfound by previous studies (e.g., Skillman 1996; Walter & Brinks1999; Schaye 2004). Most regions with H i column densities ofNH i > 2:5 ; 1021 cm�2 have dust emission associatedwith them.For the brightest regions at 70 �m there is a good correlation withthe location of H ii regions, indicating that active star formation isneeded to heat up the dust locally. However, in some cases, there isdiffuse dust emission present at larger radii that does not appear tocoincide with compact H ii regions. This diffuse emission is likelydue to the reprocessing of nonionizing photons in the ISM or theescape of radiation from the star formation regions (see alsoCannon et al. 2006b).
IRS spectroscopy in the brightest regions in IC 2574 andHolmberg II (which have comparable star formation rates) revealdistinctly different spectral shapes: Whereas PAH features areclearly detected in the spectrum of IC 2574, those features areweaker in Holmberg II (which has lower metallicity) by an orderof magnitude. This emphasizes that the strength of PAH featuresis not a simple linear function of metallicity (see also Smith et al.2007). The PAH-to-TIR continuum ratio in IC 2574 is a factor of�7 less than what is found in a typical SINGS spiral (a factor of>20 in the case of Holmberg II).
While the H i masses are well constrained, it is difficult toconstrain the dust masses with a high degree of certainty. Weestimate dust masses of �104Y106M� for individual targets, re-sulting in an average dust-to-gas ratio (Mdust/MH i) of �3 ; 10�4
(1:5 ; 10�3 if only the H i that is associated with dust emission isconsidered). This can be compared to the range in values de-rived for the SINGS galaxies by Draine et al. (2007) of 0:005 <Mdust/Mgas < 0:02. Thus, the average dust-to-gas ratio in thedwarfs is lower by about an order of magnitude as compared tomore massive spirals (a finding that cannot simply be explainedby a linear scaling withmetallicity; see also Draine et al. 2007). Fu-ture sensitive observations at longer (submillimeter) wavelengths
DUST AND ATOMIC GAS IN DWARF IRREGULAR GALAXIES 113No. 1, 2007
are critical to constrain the possible presence of a colder dust com-ponent in the galaxies (not heated by the stellar population) thatmay be missed by the MIPS observations.
We also find that the dwarf galaxies in our sample are un-derluminous at 70 �m for a given SFR by about a factor of �2compared to the more massive and metal-rich galaxies in SINGS.However, interestingly, the average 70/160 �m ratio in the dwarfsis higher (factor of �2) than in the spiral galaxies. In a simplisticpicture, this can be attributed to higher effective dust temperaturesin the dwarf galaxies (which shifts the peak of the warm dust SEDtoward 70 mm; cf. Dale et al. 2005). Similar conclusions on thedust temperature have been derived by other authors studyingmore luminous dwarf systems (Hunter et al. 1989; Dale et al.2005; Engelbracht et al. 2005; Cannon et al. 2005; 2006a, 2006b)and have been explained in the context of stronger radiation fieldsin the dwarfs. It is interesting to note that, if the dwarf galaxies had
the same temperature as the more massive spirals, the 70 �m lu-minosity for a given SFR would decrease further (relative to thespirals). Overall, there is a better correlation between the SFR (oroptical magnitudes) and the 70 �m luminosity than between theH imass and L(70 �m). This provides additional evidence that thefar-IR emission in the sample dwarf galaxies is powered by on-going star formation and does not strongly depend on the total H i
mass of the galaxy host.
Some of the data presented here are part of the Spitzer SpaceTelescopeLegacy Science Program The SpitzerNearby GalaxiesSurvey (SINGS), which was made possible by NASA throughcontract 1224769 issued by JPL/Caltech under NASA contract1407. This work was also supported in part by NSF grant AST04-06883.
REFERENCES
Asplund, M., Grevesse, N., & Sauval, A. J. 2005, in ASP Conf. Ser. 336,Cosmic Abundances as Records of Stellar Evolution and Nucleosynthesis,ed. T. G. Barnes III & F. N. Bash (San Francisco: ASP), 25
Barone, L. T., Heithausen, A., Huttemeister, S., Fritz, T., & Klein, U. 2000,MNRAS, 317, 649
Bendo, G. J., et al. 2006, ApJ, 652, 283Calzetti, D., et al. 2005, ApJ, 633, 871Cannon, J. M., et al. 2005, ApJ, 630, L37———. 2006a, ApJ, 647, 293———. 2006b, ApJ, 652, 1170Dale, D. A., & Helou, G. 2002, ApJ, 576, 159Dale, D. A., Helou, G., Contursi, A., Silbermann, N. A., & Kolhatkar, S. 2001,ApJ, 549, 215
Dale, D. A., et al. 2005, ApJ, 633, 857———. 2006, ApJ, 646, 161de Vries, H. W., Thaddeus, P., & Heithausen, A. 1987, ApJ, 319, 723Draine, B. T., & Li, A. 2001, ApJ, 551, 807———. 2006, ApJ, 657, 810Draine, B., et al. 2007, ApJ, in press (astro-ph /0703213)Engelbracht, C. W., Gordon, K. D., Rieke, G. H., Werner, M. W., Dale, D. A.,& Latter, W. B. 2005, ApJ, 628, L29
Engelbracht, C. W., et al. 2004, ApJS, 154, 248Gallagher, J. S., Hunter, D. A., Gillett, F. C., & Rice, W. L. 1991, ApJ, 371, 142Galliano, F., Madden, S. C., Jones, A. P., Wilson, C. D., Bernard, J.-P., & Le Peintre,F. 2003, A&A, 407, 159
Gordon, K. D., et al. 2005, PASP, 117, 503Hinz, J. L., Misselt, K., Rieke, M. J., Rieke, G. H., Smith, P. S., Blaylock, M.,& Gordon, K. D. 2006, ApJ, 651, 874
Houck, J. R., et al. 2004a, ApJS, 154, 18———. 2004b, ApJS, 154, 211Hunter, D. A., Gallagher, J. S., Rice, W. L., & Gillett, F. C. 1989, ApJ, 336,152
Hunter, D. A., et al. 2001, ApJ, 553, 121Jackson, D. C., Cannon, J. M., Skillman, E. D., Lee, H., Gehrz, R. D.,Woodward, C. E., & Polomski, E. 2006, ApJ, 646, 192
Jorsater, S., & van Moorsel, G. A. 1995, AJ, 110, 2037Karachentsev, I. D., et al. 2002, A&A, 383, 125———. 2003, A&A, 398, 479Kennicutt, R. C. 1998, ARA&A, 36, 189Kennicutt, R. C., et al. 2003, PASP, 115, 928
Kobulnicky, H. A., & Skillman, E. D. 1996, ApJ, 471, 211———. 1997, ApJ, 489, 636Lee, J. C. 2006, Ph.D. thesis, Univ. ArizonaLeroy, A., Bolatto, A. D., Simon, J. D., & Blitz, L. 2005, ApJ, 625, 763Li, A., & Draine, B. T. 2001, ApJ, 554, 778———. 2002, ApJ, 576, 762Lu, N., et al. 2003, ApJ, 588, 199Madden, S. C., Galliano, F., Jones, A. P., & Sauvage, M. 2006, A&A, 446, 877Melisse, J. P. M., & Israel, F. P. 1994a, A&A, 285, 51———. 1994b, A&AS, 103, 391Miller, B. W., & Hodge, P. 1994, ApJ, 427, 656O’Halloran, B., Satyapal, S., & Dudik, R. P. 2006, ApJ, 641, 795Ott, J., Walter, F., Brinks, E., Van Dyk, S. D., Dirsch, B., & Klein, U. 2001, AJ,122, 3070
Pilyugin, L. S., & Thuan, T. X. 2005, ApJ, 631, 231Popescu, C. C., & Tuffs, R. J. 2003, A&A, 410, L21Popescu, C. C., Tuffs, R. J., Volk, H. J., Pierini, D., & Madore, B. F. 2002, ApJ,567, 221
Puche, D., Westpfahl, D., Brinks, E., & Roy, J.-R. 1992, AJ, 103, 1841Rigby, J. R., & Rieke, G. H. 2004, ApJ, 606, 237Rosenberg, J. L., Ashby, M. L. N., Salzer, J. J., & Huang, J.-S. 2006, ApJ, 636,742
Salpeter, E. E. 1955, ApJ, 121, 161Schaye, J. 2004, ApJ, 609, 667Skillman, E. D. 1996, in ASP Conf. Ser. 106: The Minnesota Lectures onExtragalactic Neutral Hydrogen, ed. E. D. Skillman (San Francisco: ASP),208
Smith, J. D. T., et al. 2007, ApJ, 656, 770Taylor, C. L., Kobulnicky, H. A., & Skillman, E. D. 1998, AJ, 116, 2746Telesco, C. M. 1988, ARA&A, 26, 343Vermeij, R., Peeters, E., Tielens, A. G. G. M., & van der Hulst, J. M. 2002,A&A, 382, 1042
Walter, F., & Brinks, E. 1999, AJ, 118, 273Walter, F., Brinks, E., de Blok, W. J. G., Thornley, M. D., & Kennicutt, R. C.2005, in ASP Conf. Ser. 331, Extra-Planar Gas, ed. R. Braun (San Francisco:ASP), 269
Walter, F., Walter, F., Kerp, J., Duric, N., Brinks, E., & Klein, U. 1998, ApJ,502, L143
Wu, Y., Charmandaris, V., Hao, L., Brandl, B. R., Bernard-Salas, J., Spoon, H.W. W., & Houck, J. R. 2006, ApJ, 639, 157