I. INTRODUCTION As the basic principle of an electrostatic precipitator, the dust particles are being charged by applying high voltages at the discharge electrodes. These charged particles leave the main air stream and move towards the collection electrodes, forming a dust layer on them as shown in Fig. 1. The charge emitted by the discharge electrodes accumulates on the surface of the dust layer and causes an increase of the magnitude of electric field within the layer. The dust layer itself consists of a collection of single particles with individual dielectric properties together with the gas filled voids and adsorbed water layers depending on the environmental humidity. It accommodates the distribution of accumulated surface charge to the inner body of the dust layer. Different dielectric properties of solids and gas, cause a non- uniformity of the electric field with higher field strength at the contact points of the particles. Precipitators work well when the dust resistivity lies between 10 2 to 10 10 Ω•cm [1, 2]. Some authors assume this range between 10 4 to 10 11 Ω•cm [3]. Lower resistivity dust tends to fall off the collection electrodes and creates re- entrainment while for higher resistivity a considerable voltage gradient builds up across the dust layer, and local voltage break down of the layer could occur which results in a glow discharge. This phenomenon is known as back corona (also stated as back discharge in literature). This corona creates ions opposite to the discharge ions, which tend to neutralize the main action of the precipitator and to re-entrain the dust into the surrounding atmosphere and the overall efficiency of an electrostatic precipitator is reduced. Dust resistivity can be measured in-situ by installing a measurement probe inside the precipitator [4]. But mostly it is done using a laboratory apparatus such as one used by Llyod [1], White [5], Rose [6], Wiggers et al. [7, 8], Lee et al. [9] etc. White [5] explained the current flow through a dust layer using two resistivity measurement methods: plate-plate and point-plate. He stated much higher in-homogeneity in current flow for the point-plate as compared to the plate-plate method. He found the maximum current flow density directly under the tip of the point electrode and smaller in the radial direction. Wiggers et al. [7, 8] developed a new method for the direct detection of onset of back corona and its immediate elimination from the system with reduced current by lowering the applied voltage. They also discussed the onset of back corona under typical current densities in industrial electrostatic precipitators i.e. 0.1- 0.5 mA/m 2 . Three different types of dust samples, including sinter dust, fly ash and glass powder were investigated because of their different chemical composition to determine the relevant parameters of the back corona. Miller et al. [10] analyzed the influence of back corona on the current density in electrostatic precipitators. Hoferer et al. [11] performed the experiments with limestone dust to explain the strong dependence of local back corona on the dust layer thickness, the porosity and the particle size. They mentioned the higher electric field strengths within the porous dust layer as the basic reason for the onset of back corona. Masuda et al. [12-15] performed experiments to study the modes of back discharge occurring in the electrostatic precipitators using a point-plate laboratory setup. Samples of glass and mica plates with a pinhole and tissue papers were used as test materials. They summarized that the local occurrence of back corona strongly depends on the thickness, porosity and the nature of the dust layer. With the help of a photomultiplier tube and an image convertor camera connected to an image intensifier, they detected two types of light signal during the onset of back corona: the first one develops very rapidly in the space between point and plate electrodes while the second signal propagates Dust Resistivity Measurement and Onset of Back Corona in Electrostatic Precipitators M. Majid, H. Wiggers, and P. Walzel Faculty of Bio and Chemical Engineering, Technical University of Dortmund, Germany Abstract—Electrical resistivity of the dust, to be separated in an electrostatic precipitator, is an important parameter from the design and operation point of view. Mostly it is measured in the laboratories using a measurement apparatus and the dust sample collected from the hopper beneath the precipitator. A laboratory setup will be introduced to measure the dust resistivity using a new method. Here, the onset of back corona can be detected directly during the experiment which can be eliminated immediately from the system by reducing the current by controlling the supplied voltage. Experiments were performed with a fly ash sample with 11μm and four glass samples with 75, 112, 278 and 394 μm mean particle sizes. Results will be presented and discussed about the influence on resistivity results of dust resistivity measurement method: point-plate and plate-plate, mode of temperature variation: ascending and descending, air temperature, particle size and air humidity. Finally, the visualization of back corona in such systems will be presented. Keywords— Dust resistivity, back discharge, back corona, electrostatic precipitator Corresponding author: Muhammad Majid e-mail: [email protected]Presented at the 12th International Conference of Electrostatic Precipitation, ICESP, in May 2011 (Nuremberg, Germany) 185 Majid et al.
Transcript
I. INTRODUCTION
As the basic principle of an electrostatic precipitator, the dust particles are being charged by applying high voltages at the discharge electrodes. These charged particles leave the main air stream and move towards the collection electrodes, forming a dust layer on them as shown in Fig. 1. The charge emitted by the discharge electrodes accumulates on the surface of the dust layer and causes an increase of the magnitude of electric field within the layer. The dust layer itself consists of a collection of single particles with individual dielectric properties together with the gas filled voids and adsorbed water layers depending on the environmental humidity. It accommodates the distribution of accumulated surface charge to the inner body of the dust layer. Different dielectric properties of solids and gas, cause a non- uniformity of the electric field with higher field strength at the contact points of the particles. Precipitators work well when the dust resistivity lies between 102 to 1010 Ω•cm [1, 2]. Some authors assume this range between 104 to 1011 Ω•cm [3]. Lower resistivity dust tends to fall off the collection electrodes and creates re-entrainment while for higher resistivity a considerable voltage gradient builds up across the dust layer, and local voltage break down of the layer could occur which results in a glow discharge. This phenomenon is known as back corona (also stated as back discharge in literature). This corona creates ions opposite to the discharge ions, which tend to neutralize the main action of the precipitator and to re-entrain the dust into the surrounding atmosphere and the overall efficiency of an electrostatic precipitator is reduced.
Dust resistivity can be measured in-situ by installing a measurement probe inside the precipitator [4]. But
mostly it is done using a laboratory apparatus such as one used by Llyod [1], White [5], Rose [6], Wiggers et al. [7, 8], Lee et al. [9] etc. White [5] explained the current flow through a dust layer using two resistivity measurement methods: plate-plate and point-plate. He stated much higher in-homogeneity in current flow for the point-plate as compared to the plate-plate method. He found the maximum current flow density directly under the tip of the point electrode and smaller in the radial direction. Wiggers et al. [7, 8] developed a new method for the direct detection of onset of back corona and its immediate elimination from the system with reduced current by lowering the applied voltage. They also discussed the onset of back corona under typical current densities in industrial electrostatic precipitators i.e. 0.1-0.5 mA/m2. Three different types of dust samples, including sinter dust, fly ash and glass powder were investigated because of their different chemical composition to determine the relevant parameters of the back corona. Miller et al. [10] analyzed the influence of back corona on the current density in electrostatic precipitators. Hoferer et al. [11] performed the experiments with limestone dust to explain the strong dependence of local back corona on the dust layer thickness, the porosity and the particle size. They mentioned the higher electric field strengths within the porous dust layer as the basic reason for the onset of back corona. Masuda et al. [12-15] performed experiments to study the modes of back discharge occurring in the electrostatic precipitators using a point-plate laboratory setup. Samples of glass and mica plates with a pinhole and tissue papers were used as test materials. They summarized that the local occurrence of back corona strongly depends on the thickness, porosity and the nature of the dust layer. With the help of a photomultiplier tube and an image convertor camera connected to an image intensifier, they detected two types of light signal during the onset of back corona: the first one develops very rapidly in the space between point and plate electrodes while the second signal propagates
Dust Resistivity Measurement and Onset of Back Corona in Electrostatic Precipitators
M. Majid, H. Wiggers, and P. Walzel Faculty of Bio and Chemical Engineering, Technical University of Dortmund, Germany
Abstract—Electrical resistivity of the dust, to be separated in an electrostatic precipitator, is an important parameter from the design and operation point of view. Mostly it is measured in the laboratories using a measurement apparatus and the dust sample collected from the hopper beneath the precipitator. A laboratory setup will be introduced to measure the dust resistivity using a new method. Here, the onset of back corona can be detected directly during the experiment which can be eliminated immediately from the system by reducing the current by controlling the supplied voltage. Experiments were performed with a fly ash sample with 11µm and four glass samples with 75, 112, 278 and 394 µm mean particle sizes. Results will be presented and discussed about the influence on resistivity results of dust resistivity measurement method: point-plate and plate-plate, mode of temperature variation: ascending and descending, air temperature, particle size and air humidity. Finally, the visualization of back corona in such systems will be presented.
Keywords— Dust resistivity, back discharge, back corona, electrostatic precipitator
Corresponding author: Muhammad Majid e-mail: [email protected] Presented at the 12th International Conference of Electrostatic Precipitation, ICESP, in May 2011 (Nuremberg, Germany)
185Majid et al.
much slowly along the layer surface. Rothenberg et al. [16] measured the rates of adsorption and desorption of water by coal fly ash over the temperature range 0-300°C. They concluded that the monolayer formation by physical adsorption is usually rapid, but the micro pores fill and empty slowly over a wide range of temperatures. Kruppa et al. [17] used a point-plate method to visualize the re-entrainment of fly ash and spherical acrylic particles as a result of the back corona in the system.
Fig. 1. Principle of electrostatic precipitation.
II. THEORETICAL MODEL
The ohmic resistance ’R’ of the dust layer can be explained as follows:
A
sR (1)
where ’ρ’ is the electrical resistivity, ’s’ is the thickness of the dust layer and ’A’ is the surface area of the dust carrier electrode. ‘R’ can also be defined by the relation of current ’I’ passing through the dust layer as a result of the applied voltage ’U’ across the discharge electrode:
I
UR (2)
Is
AU (3)
js
U (4)
where ’j’ is the current density. The mean electric field strength ’E’ present in the dust layer can be calculated as:
s
UE (5)
jE (6)
‘E’ increases with the dust resistivity. At a certain level, it has enough potential to produce local electric discharges resulting in the break-down of the dust layer known as back corona. As a consequence, the field strength must be kept lower at this point to get rid of back corona. Above described relations is the simplified explanation of the complicated phenomena taking place during the function of an electrostatic precipitator. The arrangement and shape of the dust particles and specially the contact points have a great influence on the dielectric nature of the dust layer. Inhomogeneous nature of dust particles also makes it difficult to track out the reasons of back discharge onset. Considering these complications, the above explained model yields the reliable and impressive estimate of the back corona in electrostatic precipitators. Further detail of this model has been documented by Wiggers et al. [7, 8].
III. EXPERIMENTAL SETUP
Fig. 2 shows the schematic of the dust resistivity measurement setup. Experiments are carried out using two electrodes, made up of a porous sintered material to facilitate the humidity equilibrium between the dust layer and the surrounding gas inside the measuring chamber. The dust sample was placed on the lower electrode while the upper electrode served as the counter electrode electrode. It was connected to a laboratory high voltage unit (Heinzinger PNC 40000-5 ump). Air passes through a temperature controlled water bath which is then introduced into the test chamber. A digital thermometer
Fig. 2. Schematic of the dust resistivity measurement setup.
was used to record the air temperature. Gas temperature entering the test chamber, was successively raised by an air heater control. The temperature ramp rate was adjusted to < 3°C/minute to achieve an acceptable stability of humidity exchange between the dust layer and the environmental gas [7, 8]. The measurement chamber was insulated properly to minimize the heat losses. Dust temperature was measured by using a thermocouple
186 International Journal of Plasma Environmental Science & Technology, Vol.5, No.2, SEPTEMBER 2011
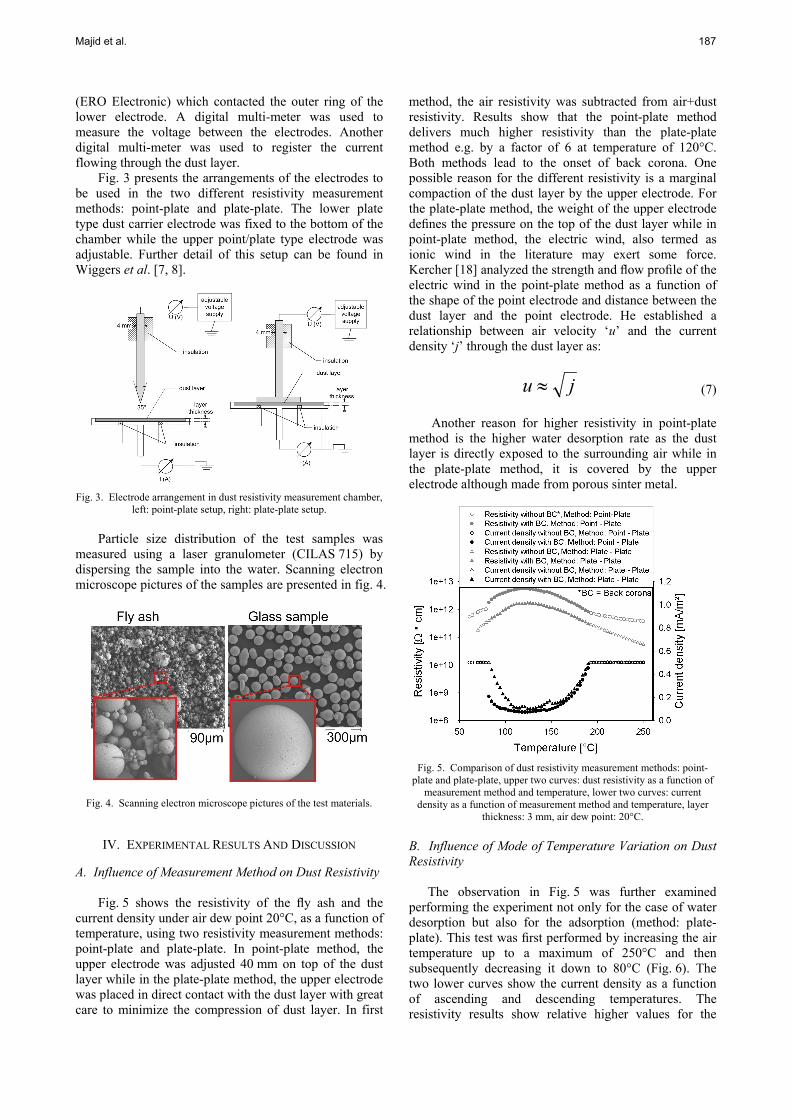
(ERO Electronic) which contacted the outer ring of the lower electrode. A digital multi-meter was used to measure the voltage between the electrodes. Another digital multi-meter was used to register the current flowing through the dust layer. Fig. 3 presents the arrangements of the electrodes to be used in the two different resistivity measurement methods: point-plate and plate-plate. The lower plate type dust carrier electrode was fixed to the bottom of the chamber while the upper point/plate type electrode was adjustable. Further detail of this setup can be found in Wiggers et al. [7, 8].
Particle size distribution of the test samples was
measured using a laser granulometer (CILAS 715) by dispersing the sample into the water. Scanning electron microscope pictures of the samples are presented in fig. 4.
Fig. 4. Scanning electron microscope pictures of the test materials.
IV. EXPERIMENTAL RESULTS AND DISCUSSION
A. Influence of Measurement Method on Dust Resistivity Fig. 5 shows the resistivity of the fly ash and the
current density under air dew point 20°C, as a function of temperature, using two resistivity measurement methods: point-plate and plate-plate. In point-plate method, the upper electrode was adjusted 40 mm on top of the dust layer while in the plate-plate method, the upper electrode was placed in direct contact with the dust layer with great care to minimize the compression of dust layer. In first
method, the air resistivity was subtracted from air+dust resistivity. Results show that the point-plate method delivers much higher resistivity than the plate-plate method e.g. by a factor of 6 at temperature of 120°C. Both methods lead to the onset of back corona. One possible reason for the different resistivity is a marginal compaction of the dust layer by the upper electrode. For the plate-plate method, the weight of the upper electrode defines the pressure on the top of the dust layer while in point-plate method, the electric wind, also termed as ionic wind in the literature may exert some force. Kercher [18] analyzed the strength and flow profile of the electric wind in the point-plate method as a function of the shape of the point electrode and distance between the dust layer and the point electrode. He established a relationship between air velocity ‘u’ and the current density ‘j’ through the dust layer as:
ju (7)
Another reason for higher resistivity in point-plate method is the higher water desorption rate as the dust layer is directly exposed to the surrounding air while in the plate-plate method, it is covered by the upper electrode although made from porous sinter metal.
Fig. 5. Comparison of dust resistivity measurement methods: point-plate and plate-plate, upper two curves: dust resistivity as a function of
measurement method and temperature, lower two curves: current density as a function of measurement method and temperature, layer
thickness: 3 mm, air dew point: 20°C.
B. Influence of Mode of Temperature Variation on Dust Resistivity The observation in Fig. 5 was further examined performing the experiment not only for the case of water desorption but also for the adsorption (method: plate-plate). This test was first performed by increasing the air temperature up to a maximum of 250°C and then subsequently decreasing it down to 80°C (Fig. 6). The two lower curves show the current density as a function of ascending and descending temperatures. The resistivity results show relative higher values for the
187Majid et al.
descending temperatures but only for low temperatures, i.e. T < 160°C. For higher temperatures, both curves exist very close to each other. It can be explained on the basis of irreversibility in isotherms obtained with water vapor as adsorbate and the fly ash as adsorbent [16]. Further, the back corona was observed in both modes: for ascending temperatures, it lasted from 90°C to 195°C whereas for descending temperatures, it expanded itself between 70°C and 195°C. Desorption rate increases with increasing temperature and achieves a peak value at T ≈ 125°C. This is caused by desorption of physically adsorbed water molecules [16].
Fig. 6. Upper: dust resistivity as a function of temperature, mode of operation (ascending/ descending temperature) and humidity, lower:
current density as a function of temperature, mode of operation (ascending/descending temperature) and humidity, air point point: 20°C,
layer thickness: 3 mm, method: plate-plate.
Desorption rate starts decreasing with further increase in temperature which is controlled by the removal of water molecules from the inner body of particles. For descending temperature, water starts to adsorb on particle surface but probably not so quick as it desorbed in case of ascending temperature. Rothenberg et al. [16] obtained the hysteresis loops for adsorption and desorption of pure water vapor to fly ash sample using BET measurement method. At constant temperature (20°C), for the desorption case, the amount of water residual in the sample was 12.5 mg/g while it is reduced to 6 mg/g for adsorption. The specific surface area (Sg) of this material was 2.1 m²/g. In our case, Sg was measured with a Gemini 2360 surface area analyzer, using BET measurement method and found to be 1.069 m²/g.
C. Influence of Particle Size on Dust Resistivity In Fig. 7, resistivity of the four glass samples with mean particle sizes, dp,50 75, 112, 278 and 394 µm, has been plotted against the air temperature under current density 0.5 mA/m² and air dew point 40°C. The results show that the resistivity is different for different mode of experiments (ascending and descending) up to air
temperature T = 170°C. In temperature range of T = 180-190°C, all curves stay fairly close to each other. For low temperatures i.e. T < 170°C, the current flows through the particle surface which is strongly influenced by the presence of water layer on the particle surface. At higher temperatures, water desorbs from the particle surface and the conduction takes place through the core of the particles. Here, the chemical composition of the material
Fig. 7. Influence of particle size on dust resistivity, s = 3 mm, method: plate-plate.
plays a dominant role. Further, in case of ascending temperatures, the resistivity of the smaller particles is less than the bigger ones for low temperatures i.e. T < 170°C, while in case of descending temperatures, the smaller particles have higher resistivity. Additionally, the difference in the resistivity for ascending and descending temperatures gets smaller with the increase in the particle size. To determine the possible reasons of such phenomena, firstly, the porosity ‘ε’ of the samples was considered. According to Stieß [19], the porosity of an irregular packing of the mono-dispersed particles does not change remarkably for the non-cohesive and free flowing granular media with particle size above 100 µm. Porosity of our test samples was calculated experimentally and the results are shown in Table I. It can be seen that it does not change by big margins with change in the particle size. Under such circumstances, it can be concluded in our case that the porosity was not amongst the highly influencing parameter.
Next, the specific surface area was considered as the influencing parameter. Naganuma et al. [20] measured the specific surface area of the four glass particle samples with mean particle diameters of 26, 42, 59 and 85 µm with N2 and Kr gases using a surface area pore size analyzer (BEL SORP 36, Nihon Bell Corp., Tokyo, Japan). They found that the specific surface of the glass particles increases with decrease in the average particle size. The presence of higher moisture content for the smaller particles due to their higher spec. surface area could be one possible reason for the observations in Fig. 7.
188 International Journal of Plasma Environmental Science & Technology, Vol.5, No.2, SEPTEMBER 2011
TABLE I POROSITY OF THE TEST GLASS SAMPLES
dp (µm) 75 112 278 394
ε (%) 37.9 36.9 35.1 35.6
D. Influence of air humidity on dust resistivity To understand the role of water content for the dust resistivity more clearly, the fly ash sample was tested under three different air dew points ‘Td’ i.e. 25°C, 40°C and 55°C respectively. For the case of ‘Td’: 25°C, the
material shows the maximum resistivity 2 x 10¹²
Ω•cm at air temperature 130°C (Fig. 8). The onset of back corona was observed for the temperature range 90-190°C. Further, ‘Td’ was increased to 40 °C, keeping the same other experimental conditions. In doing so, the maximum resistivity decreased to 5 x 10¹¹ Ω•cm at the same air temperature. The back corona region was also reduced between 115–170°C. Complete elimination of back corona was observed with dew point 55°C while the maximum resistivity was also decreased to 2 x 10¹¹ Ω•cm.
Fig. 8. Influence of air humidity on the dust resistivity, s = 2.5 mm, method: plate-plate.
E. Visualization of Back Corona To visualize the onset of back corona during the resistivity measurement, a high speed camera HSS3 LaVision was added to the experimental setup explained in section III. Experimental conditions were set to the dust layer thickness 3 mm and air dew point 20°C using point-plane method. At an inter-electrode distance of
29 mm, the electric wind was too strong, which resulted in particle re-entrainment right from the beginning of the test. At an inter-electrode distance of 41.5 mm, it was possible to visualize the back corona in form of tiny light glows on the dust layer surface. Back corona started at air temperature 80°C and lasted till 180°C. At the start of the experiment, the upper surface of the dust layer was almost smooth which can be seen in Fig. 9a. It also shows the light glow at just the start of the back corona in the system. Due to the continuous back corona, a small amount of dust particle was continuously blown into the air from the upper surface of the dust layer which made it very rough. It is shown in Fig. 9 b, which also shows the blow or re-entrainment of the dust particles into the surrounding environment as a result of the back corona.
Fig. 9. Visualization of back corona in the fly ash layer, inter-electrode distance: 41.5 mm, air dew point: 20°C, a) visible light glow, b) blow
or re-entrainment of the dust particles.
REFERENCES [1] D. A. Lloyd, Electrostatic Precipitator Handbook, IOP
Publishing Ltd. England, 1998, ch. 9, pp. 65-67. [2] N. Tachibana and H. Fujishima, "Application of electrostatic
precipitation with the intermittent energization," in Proc. International conference on modern electrostatics, Beijing, 1988, pp. 14-19.
[3] W. Simm, "Electrical characteristics of dust regarding the separation in electrostatic precipitator" (in German: Die elektrischen Eigenschaften des Staubes in Hinblick auf die Abscheidung im Elektrofilter), Staub - Reinhaltung der Luft, no. 22, pp. 43-49.
[4] Wahlco resistivity probe User’s Guide, revised version, USA, 1985.
[5] H. J. White, Industrial electrostatic precipitators, Addison-Wesley Publishing Company, Inc., USA, 1963.
[6] T. Men H. E. Rose, and A. J. Wood, An introduction to electrostatic precipitation in theory and practice, Constable & Company Ltd., England, 1956, ch. 6, pp. 123-127.
[7] H. Wiggers, "Measurement of dust resistivity - Back corona in electrostatic precipitators," VGB Power Tech., Germany, no. 3, pp. 93-96, 2007.
[8] H. Wiggers and S. Nasri, "Dust resistivity measurements by typical current densuties in electrostatic precipitators" (in German: Staubwiderstands-messungen bei Elektrofiltertypischen
189Majid et al.
Strom-dichten), Gefahrstoffe - Reinhaltung der Luft., vol. 68, pp. 177-181, 2008.
[9] J. K. Lee, O. C. Hyun, and J. E. Lee, "High Resistivity Characteristics of the Sinter Dust Generated from the Steel Plant," KSME International Journal, vol. 15, pp. 630-638, 2001.
[10] J. Miller, B. Hoferer, and A. Schwab, Separation of fine dusts in optimized electrostatic precipitators (in German: Fein-staubabscheidung in betriebsoptimierten Elektrofiltern), Part II, PEF - Project, European Research Center for Air Quality Control, (in German: Europäisches Forschungszentrum für Maßnahmen zur Luftreinhaltung), Germany, 1977.
[11] B. Hoferer and A. Schwab, "Local occurrence of back corona at the dust layer of electrostatic precipitators," in 2000 Annual Report Conference on Electrical Insulation and Dielectric Phenomena, Victoria, BC , Canada, pp. 93-96.
[12] S. Masuda and A. Mizuno, "Light measurements of back discharge," Journal of Electrostatics, vol. 2, pp. 375-396, 1977.
[13] S. Masuda and A. Mizuno, "Initiation condition and mode of back discharge," Journal of Electrostatics, vol. 4, pp. 35-52, 1977.
[14] S. Masuda and A. Mizuno, "Flashover measurements of back discharge," Journal of Electrostatics, vol. 5, pp. 215-231, 1978.
[15] S. Masuda, A. Mizuno, and M. Akimoto, "Effects of gas composition on sparking characteristics of back discharge - Preliminary study," Journal of Electrostatics, vol. 6, pp. 333-347, 1979.
[16] S. J. Rothenberg and Y. S. Cheng, "Coal combustion fly ash characterization - Rates of adsorption and desorption of water," Journal of Physical Chemistry, vol. 84, pp. 1644-1649, 1980.
[17] A. Krupa, M. Lackowski, and T. Czech, "Dust particles motion in back discharge," Journal of Physics: Conference Series, vol. 142, 012040 (4 pp.), 2008.
[18] H. Kercher, "Electric wind, back discharge and dust resistivity as the influencing parameters in electrostatic precipitators" (in German: Elektrischer Wind, Rücksprühen und Staubwiderstand als Einflußgrößen im Elektrofilter), VDI-Z. series 6, no. 27, p. 52, 1970.
[19] M. Stieß, Mechanical Processes Vol. 1 (in German: Mechanische Verfahrenstechnik 1), 2nd Edition, Springer-Verlag Berlin, 1998, pp. 64-67.
[20] T. Naganuma and Y. Kagawa, "Effect of particle size on light transmittance of glass particle dispersed epoxy matrix optical composites," Acta Materials, vol. 47, pp. 4321-4327, 1999.
190 International Journal of Plasma Environmental Science & Technology, Vol.5, No.2, SEPTEMBER 2011