DYE-FLUORESCENCE LED-SPEC: A BATTERY-OPERATED, ON-CHIP, WAVELENGTH-TUNABLE OPTICAL SOURCE FOR DETECTION OF BIOCHEMICALS Long Que, P. Selvaganapathy, Bhaskar Mitra, Chester G. Wilson, and Yogesh B. Gianchandani Department of Electrical Engineering and Computer Science University of Michigan, Ann Arbor ABSTRACT This paper reports a wavelength-tunable microfluidic optical source for the fluorescence of dye-labeled biochemicals. A pulsed micro-arc is struck between a metal anode and a microfluidic cathode filled with an aqueous solution of BaCl 2 . Atomic transitions from the Ba atoms, which are sputtered into the glow region, provide strong emissions at 493 nm and 454 nm wavelengths. Undesirable wavelengths are blocked out by an integrated optical filter. The emission is used to fluoresce calf thymus DNA tagged with SYBR™ green dye, achieving brightness levels comparable to commercially-available macro-scale apparatus. This method can be easily adapted for other fluorophores. Keywords: DNA, fluorescence, microfluidic, microdischarge I. INTRODUCTION Fluorescence detection is a widely used technique in medical and biochemical diagnostics for studying the structure and dynamics of biomolecules [1,2]. In particular, the fluorescence of tagged dyes is used to detect DNA. A typical fluorescence imaging system consists of an excitation source, an analysis chamber/channel, and a detection setup. Recent efforts at miniaturization have focused on solid-state diodes and lasers as optical sources [3- 6], which have sophisticated manufacturing processes, and use non-standard compound semiconductors. In contrast, this paper reports a micromachined liquid-based optical source which is battery-operated, wavelength-tunable, and can be integrated with microfluidic diagnostic systems. It uses a pulsed arc between a metal anode and a doped liquid cathode. Atomic and molecular transitions of impurities sputtered from the liquid cathode (at room temperature and atmospheric pressure) provide the desired spectral output which stimulates fluorescent dyes. This is named the dye-fluorescence LEd-SpEC (liquid-electrode spectral- emission chip), and is based on an approach for spectral measurement of inorganic impurities in water [7-9]. II. MICROSYSTEM DESIGN The dye-fluorescence LEd-SpEC device (Fig.1a) consists of six glass layers and an integrated optical filter. The upper three layers form the microdischarge source chip, including a metal anode and the liquid cathode reservoir, while the bottom three layers form the DNA sample reservoir. The DNA sample reservoir, which is aligned to the optical source, can be part of a larger fluidic system or a disposable plastic chip. In the figure, the downward-pointing arrows indicate how the system is assembled.
Transcript
DYE-FLUORESCENCE LED-SPEC: A BATTERY-OPERATED,ON-CHIP, WAVELENGTH-TUNABLE OPTICAL SOURCE FOR
DETECTION OF BIOCHEMICALS
Long Que, P. Selvaganapathy, Bhaskar Mitra, Chester G. Wilson,and Yogesh B. Gianchandani
Department of Electrical Engineering and Computer ScienceUniversity of Michigan, Ann Arbor
ABSTRACTThis paper reports a wavelength-tunable microfluidic optical source for the
fluorescence of dye-labeled biochemicals. A pulsed micro-arc is struck between a metalanode and a microfluidic cathode filled with an aqueous solution of BaCl2. Atomic transitionsfrom the Ba atoms, which are sputtered into the glow region, provide strong emissions at 493nm and 454 nm wavelengths. Undesirable wavelengths are blocked out by an integratedoptical filter. The emission is used to fluoresce calf thymus DNA tagged with SYBR™ greendye, achieving brightness levels comparable to commercially-available macro-scale apparatus.This method can be easily adapted for other fluorophores.
I. INTRODUCTIONFluorescence detection is a widely used technique in medical and biochemical
diagnostics for studying the structure and dynamics of biomolecules [1,2]. In particular, thefluorescence of tagged dyes is used to detect DNA. A typical fluorescence imaging systemconsists of an excitation source, an analysis chamber/channel, and a detection setup. Recentefforts at miniaturization have focused on solid-state diodes and lasers as optical sources [3-6], which have sophisticated manufacturing processes, and use non-standard compoundsemiconductors. In contrast, this paper reports a micromachined liquid-based optical sourcewhich is battery-operated, wavelength-tunable, and can be integrated with microfluidicdiagnostic systems. It uses a pulsed arc between a metal anode and a doped liquid cathode.Atomic and molecular transitions of impurities sputtered from the liquid cathode (at roomtemperature and atmospheric pressure) provide the desired spectral output which stimulatesfluorescent dyes. This is named the dye-fluorescence LEd-SpEC (liquid-electrode spectral-emission chip), and is based on an approach for spectral measurement of inorganic impuritiesin water [7-9].
II. MICROSYSTEM DESIGNThe dye-fluorescence LEd-SpEC device (Fig.1a) consists of six glass layers and an
integrated optical filter. The upper three layers form the microdischarge source chip,including a metal anode and the liquid cathode reservoir, while the bottom three layers formthe DNA sample reservoir. The DNA sample reservoir, which is aligned to the optical source,can be part of a larger fluidic system or a disposable plastic chip. In the figure, thedownward-pointing arrows indicate how the system is assembled.
Cathode
Liquid cathodeReservoir
Microdischarge
DNA SampleReservoir High pass optical filter
DetectorEmission light
Band pass optical filter
Battery operatedcontrol circuit
Anode
Optical path I
Optical path II
ReservoirLid
300 350 400 450 500 550 600 650 7000
20
40
60
80
100
Flu
ores
cenc
e ex
cita
tion
(%)
Flu
ores
cenc
e em
issi
on (
%)
Wavelength (nm)
Fig. 1: (a-left): Exploded view of theminiaturized device. (b-right): ThedsDNA-bound SYBR green dye ismost efficiently excited near 498 nm.The emission peak is at 522 nm [1].
The present manifestation of the device is intended for fluorescing SYBR green dye(Molecular Probes, Inc.), tagged to calf thymus dsDNA. The excitation of this dye peaks over491-503 nm while emission peaks over 510-600 nm (Fig. 1b). The liquid cathode used is 20%W/V BaCl2. The emission spectrum of Ba provides peaks at 454 and 493 nm, correspondingto 25% and 97% efficiency for this dye, respectively [1]. The proximity of the absorption andemission peaks and the miniature size of the instrument pose a challenge in the optical designof the device. A dichroic band-pass filter (350-500 nm), chosen for its low sensitivity toincident angle and its superior reliability over other types of filters (e.g., interference filter),separates the optical source from the sample reservoir to block unwanted wavelengths [10].The filtered emission from the discharge pulse follows optical path I (Fig. 1a), and stimulatesfluorescence in the biochemical sample reservoir, which is detected along optical path II. PathI and II are orthogonal to minimize the possibility of stray light feeding-through from the arcto the detector. In addition, a high pass (>500 nm) optical filter placed along path II blocksstray light scattered by the sample from entering the detector. All the glass layers are #7740Pyrex™ glass (506 µm thick) which has transmittance >80% for 300-700 nm wavelengths.
S1
220ΩFeedbackWinding
PrimaryWinding
High VoltageSecondaryWinding
-3V
Testpoint
To Cathode
-300
-100
0
100
200
300
-200
Time (µs)
Vol
tage
(V
)
50 100 150
Fig. 2: (a-left): Schematicof the ringing chokeconverter high voltagecircuit.(b-right): Waveform attest point obtained bySPICE simulation of thecircuit driven by a 1.5 Vbattery.
The microdischarge is powered by a pulsed high voltage generated by a 3 V battery-operated circuit (Fig. 2a). The design is based on the ringing choke converter [11], whichconsists of a transistor-transformer oscillator in which secondary windings on the transformerboost the voltage. When the switch S1 is closed, a small base current starts to flow into thetransistor. The rising collector current leads to increasing base current due to positive
feedback from the transformer. This drives the transistor into saturation. The rate of changeof current then decreases, and the voltage induced in the feedback winding decreases. Thebase current decreases and transistor turns off. Due to the sudden decrease of collectorcurrent, a large voltage drop occurs across the primary winding, and consequently on thesecondary winding. Figure 2b shows the SPICE simulated waveform at this test point (forwhich the circuit is driven by a 1.5 V battery). This high voltage AC waveform is rectifiedand used to charge up the capacitor, which powers the cathode for the pulsed discharge.
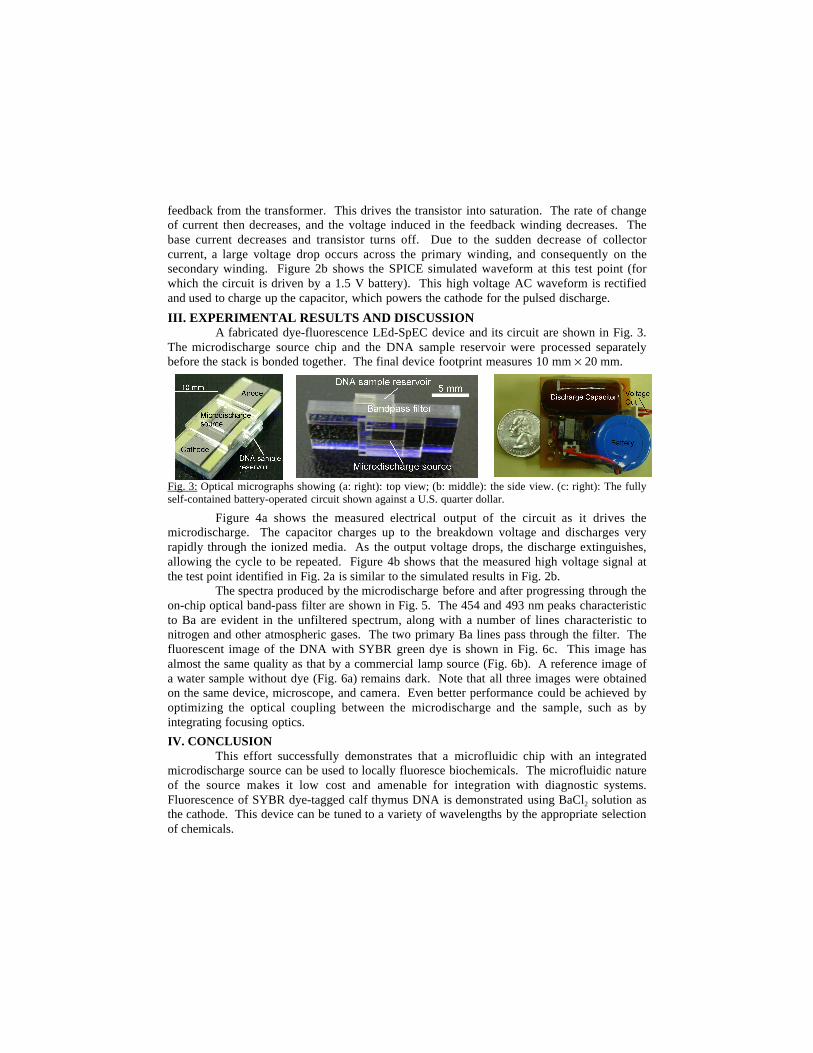
III. EXPERIMENTAL RESULTS AND DISCUSSIONA fabricated dye-fluorescence LEd-SpEC device and its circuit are shown in Fig. 3.
The microdischarge source chip and the DNA sample reservoir were processed separatelybefore the stack is bonded together. The final device footprint measures 10 mm × 20 mm.
Fig. 3: Optical micrographs showing (a: right): top view; (b: middle): the side view. (c: right): The fullyself-contained battery-operated circuit shown against a U.S. quarter dollar.
Figure 4a shows the measured electrical output of the circuit as it drives themicrodischarge. The capacitor charges up to the breakdown voltage and discharges veryrapidly through the ionized media. As the output voltage drops, the discharge extinguishes,allowing the cycle to be repeated. Figure 4b shows that the measured high voltage signal atthe test point identified in Fig. 2a is similar to the simulated results in Fig. 2b.
The spectra produced by the microdischarge before and after progressing through theon-chip optical band-pass filter are shown in Fig. 5. The 454 and 493 nm peaks characteristicto Ba are evident in the unfiltered spectrum, along with a number of lines characteristic tonitrogen and other atmospheric gases. The two primary Ba lines pass through the filter. Thefluorescent image of the DNA with SYBR green dye is shown in Fig. 6c. This image hasalmost the same quality as that by a commercial lamp source (Fig. 6b). A reference image ofa water sample without dye (Fig. 6a) remains dark. Note that all three images were obtainedon the same device, microscope, and camera. Even better performance could be achieved byoptimizing the optical coupling between the microdischarge and the sample, such as byintegrating focusing optics.
IV. CONCLUSIONThis effort successfully demonstrates that a microfluidic chip with an integrated
microdischarge source can be used to locally fluoresce biochemicals. The microfluidic natureof the source makes it low cost and amenable for integration with diagnostic systems.Fluorescence of SYBR dye-tagged calf thymus DNA is demonstrated using BaCl2 solution asthe cathode. This device can be tuned to a variety of wavelengths by the appropriate selectionof chemicals.
Fig. 4: (a: left): Oscillo-scope trace of circuitoutput while creatingpulsed arcs with a 3 Vbattery; (b: right):Measured waveform atthe test point in theabsence of a discharge,with a 1.5 V battery.
200 300 400 500 600 700 800 900
100
80
40
0
Wavelength (nm)
Rel
ativ
e In
tens
ity (
a.u.
)
60
20
493 nm
454 nm
UNFILTERED
200 300 400 500 600 700 800 900
100
80
60
0
Wavelength (nm)
Rel
ativ
e In
tens
ity (
a.u.
)
40
493 nm
454 nm FILTERED
20
Fig.5: Measuredspectrum of the pulse-driven BaCl2-basedmicrodischarge sourcewithout the filter (a-left); and with a (350nm-500 nm) band passdichroic color filter (b-right).
Fig. 6: The measured image of water (a-left), the glowing DNA image using the filtered lamp source (b-middle) and pulse-driven microdischarge source (c-right).
ACKNOWLEDGEMENTSThis research was supported in part by a grant from the National Science Foundation and DARPA.
REFERENCES[1] R.P. Haugland, Handbook of fluorescence probes and research chemicals, Molecular Probes, Inc. Eugene,OR, 1996[2] A. Pease, D. Solas, E. Sullivan, M. Cronin, C.P. Holmes, P. Fodor, “Light-generated oligonucleotide arraysfor rapid DNA sequence analysis,” Proc. Natl. Acad. Sci., 91, pp. 5022-6, 1994[3] H. Chou, C. Spence, A. Scherer, S. Quake, “A microfabricated device for sizing and sorting DNAmolecules,” Proc. Natl. Acad. Sci., 96, pp. 11-13, 1999[4] J.Webster, M.A. Burns, D.T. Burke, C.H. Mastrangelo, “Monolithic capillary electrophoresis device withintegrated fluorescence detector,” Anal. Chem, 73, pp. 1622-6, 2001[5] M. Warren, W.C. Sweatt, J.R. Wendt, C.G. Bailey, C.M. Matzke, D.M. Arnold, S.A. Kemme, A.A.Allerman, T.R. Carter, R.E. Asbill, S. Samora, “Integrated micro-optical fluorescence detection system formicrofluidic electrochromatography,” SPIE, v. 3878, pp. 185-192, 1999[6] E. Thrush, O. Levi, K. Wang, M. Wistey, J. Harris Jr., S. Smith, “Integrated semiconductor fluorescentdetection system for biochip and biomedical applications,” SPIE, 4626, pp. 289-96, 2002[7] G. Jenkins, A. Manz, “Optical emission detection of liquid analytes using a micro-machined DC glowdischarge device at atmospheric pressure,” µTAS, pp. 349-50, 2001[8] C. Wilson, Y. Gianchandani, “LEd-SpEC: Spectroscopic detection of water contaminants using glowdischarges from liquid electrodes,” Proc. IEEE Intl. MEMS Conf., pp. 248-51, Jan 2002[9] L. Que, C. Wilson, J.de La Rode, Y. Gianchandani, “A water spectroscopy microsystem with integrateddischarge source, dispersion optics, and sample delivery,” Transducers’03, pp.32-35, Boston, 2003[10] Model number K30-635 and K43-456, Edmund Industrial Optics, Inc. Barrington, NJ[11] L.H. Light, P.M. Hooker, “Transistor D.C. Convertors,” Proc. of IEE, B, 102, pp. 775-786, 1955