Putnam Dynamic Asset Allocation Conservative Fund FUND SYMBOL CLASS A PACAX Annual report 9 | 30 | 18 Asset allocation funds invest in a mix of many different types of investments to help weather changing market environments.
Transcript
Putnam Dynamic Asset Allocation Conservative Fund
FUND SYMBOL CLASS A
PACAX
Annual report 9 | 30 | 18
Asset allocation funds invest in a mix of many different types of investments to help weather changing market environments.
Important notice regarding Putnam’s privacy policy 17
Trustee approval of management contract 18
Financial statements 22
Federal tax information 116
About the Trustees 117
Officers 119
Consider these risks before investing: Allocation of assets among asset classes may hurt performance. Stock and bond prices may fall or fail to rise over time for several reasons, including general financial market conditions, changing market perceptions (including, in the case of bonds, perceptions about the risk of default and expectations about monetary policy or interest rates), changes in government interven-tion in the financial markets, and factors related to a specific issuer or industry. These and other factors may lead to increased volatility and reduced liquidity in the fund’s portfolio holdings. International investing involves currency, economic, and political risks. Emerging-market securities carry illiquidity and volatility risks. Investments in small and/or midsize companies increase the risk of greater price fluctua-tions. Growth stocks may be more susceptible to earnings disappointments, and value stocks may fail to rebound. Funds that invest in government securities are not guaranteed. Mortgage-backed investments, unlike traditional debt investments, are also subject to prepayment risk, which means that they may increase in value less than other bonds when interest rates decline and decline in value more than other bonds when interest rates rise. Bond investments are subject to interest-rate risk (the risk of bond prices falling if interest rates rise) and credit risk (the risk of an issuer defaulting on interest or principal payments). Default risk is generally higher for non-qualified mortgages. Interest-rate risk is generally greater for longer-term bonds, and credit risk is generally greater for below-investment-grade bonds. Unlike bonds, funds that invest in bonds have fees and expenses. The use of derivatives may increase these risks by increasing investment exposure (which may be considered leverage) or, in the case of over-the-counter instruments, because of the potential inability to terminate or sell derivatives positions and the potential failure of the other party to the instrument to meet its obligations. You can lose money by investing in the fund.
November 15, 2018
Dear Fellow Shareholder:
Global financial markets met with increased challenges as we entered the final quarter of 2018. After rising to record highs in the summer, U.S. stocks declined in October as concerns mounted over rising interest rates and the escalating U.S.–China trade conflict. International stock markets, which had already been lagging, experienced selloffs as well. Fixed-income markets have also encountered headwinds as the Federal Reserve has continued its path of normalizing monetary policy. Against this backdrop, markets may remain choppy, despite a solid economy. Fortunately, navigating changing markets is nothing new to Putnam’s experienced investment professionals, who continue to monitor risks and seek opportunities.
We would like to take this opportunity to extend our thanks to Jameson A. Baxter, who retired from her position as Chair of your Board of Trustees on June 30, 2018. It is hard to express in a few words the extent of Jamie’s commitment to protecting the interests of Putnam shareholders like you. In addition to her professional and directorship experience, Jamie brought intelligence, insight, and compassion to a board she served for decades. Jamie began as a Trustee in 1994, served as Vice Chair for six years, and became Chair in 2011. We are also pleased to announce the appointment of Kenneth R. Leibler as your new Board of Trustees Chair. Ken became a Trustee in 2006, has served as Vice Chair since 2016, and now leads the Board in overseeing your fund and protecting your interests.
Thank you for investing with Putnam.
Respectfully yours,
Robert L. ReynoldsPresident and Chief Executive OfficerPutnam Investments
Kenneth R. LeiblerChair, Board of Trustees
Message from the Trustees
About the fund
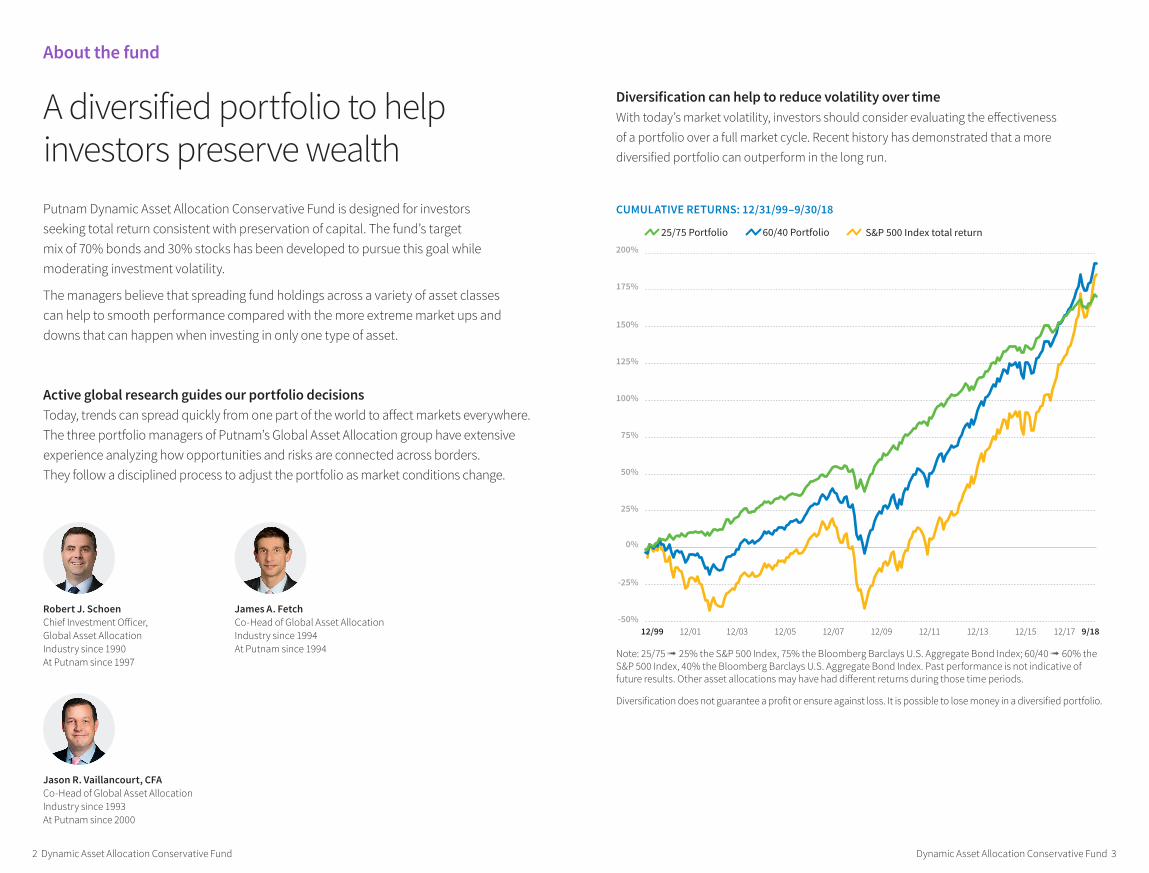
A diversified portfolio to help investors preserve wealthPutnam Dynamic Asset Allocation Conservative Fund is designed for investors seeking total return consistent with preservation of capital. The fund’s target mix of 70% bonds and 30% stocks has been developed to pursue this goal while moderating investment volatility.
The managers believe that spreading fund holdings across a variety of asset classes can help to smooth performance compared with the more extreme market ups and downs that can happen when investing in only one type of asset.
Active global research guides our portfolio decisions
Today, trends can spread quickly from one part of the world to affect markets everywhere. The three portfolio managers of Putnam’s Global Asset Allocation group have extensive experience analyzing how opportunities and risks are connected across borders. They follow a disciplined process to adjust the portfolio as market conditions change.
Robert J. Schoen
Chief Investment Officer, Global Asset Allocation Industry since 1990At Putnam since 1997
James A. Fetch
Co-Head of Global Asset AllocationIndustry since 1994At Putnam since 1994
Jason R. Vaillancourt, CFA
Co-Head of Global Asset AllocationIndustry since 1993At Putnam since 2000
Diversification can help to reduce volatility over time
With today’s market volatility, investors should consider evaluating the effectiveness of a portfolio over a full market cycle. Recent history has demonstrated that a more diversified portfolio can outperform in the long run.
CUMULATIVE RETURNS: 12/31/99–9/30/18
25/75 Portfolio 60/40 Portfolio S&P 500 Index total return
Note: 25/75 ➟ 25% the S&P 500 Index, 75% the Bloomberg Barclays U.S. Aggregate Bond Index; 60/40 ➟ 60% the S&P 500 Index, 40% the Bloomberg Barclays U.S. Aggregate Bond Index. Past performance is not indicative of future results. Other asset allocations may have had different returns during those time periods.
Diversification does not guarantee a profit or ensure against loss. It is possible to lose money in a diversified portfolio.
Dynamic Asset Allocation Conservative Fund 3 2 Dynamic Asset Allocation Conservative Fund
Performance history as of 9/30/18
Annualized total return (%) comparison
LIFE OF FUND†
(since 2/7/94)10 YEARS 5 YEARS 3 YEARS 1 YEAR
5.825.08
5.56
6.68
3.77
6.435.41 5.44
2.16
5.30
4.14
5.44
1.31
5.925.35
3.17
–1.22
3.71
2.53
The fund — class A sharesbefore sales chargePutnam Dynamic AssetAllocation ConservativeFund (PACAX)
Fund’s primarybenchmarkBloomberg BarclaysU.S. AggregateBond Index
Current performance may be lower or higher than the quoted past performance, which cannot guarantee future results. Share price, principal value, and return will fluctuate, and you may have a gain or a loss when you sell your shares. Performance of class A shares assumes reinvestment of distributions and does not account for taxes. Fund returns in the bar chart do not reflect a sales charge of 5.75%; had they, returns would have been lower. See below and pages 10–12 for additional performance information. For a portion of the periods, the fund had expense limitations, without which returns would have been lower. To obtain the most recent month-end performance, visit putnam.com.
* The Putnam Conservative Blended Benchmark is a blended benchmark administered by Putnam Management and comprises 65% the Bloomberg Barclays U.S. Aggregate Bond Index, 25% the Russell 3000 Index, 5% the MSCI EAFE Index (ND), and 5% the JPMorgan Developed High Yield Index.
† The fund’s secondary benchmark, the Putnam Conservative Blended Benchmark, was introduced on 12/31/94, which post-dates the inception of the fund’s class A shares.
Recent broad market index and fund performance
17.91%
3.71%
3.17%
1.59%
–1.22%
U.S. stocks
(S&P 500 Index)
Fund’s secondary benchmark
(Putnam Conservative Blended Benchmark)
Putnam Dynamic Asset Allocation Conservative Fund
(class A shares before sales charge)
Cash
(ICE BofAML U.S. 3-Month Treasury Bill Index)
Fund’s primary benchmark
(Bloomberg Barclays U.S. Aggregate Bond Index)
This comparison shows your fund’s performance in the context of broad market indexes for the 12 months ended 9/30/18. See above and pages 10–12 for additional fund performance information. Index descriptions can be found on page 15.
4 Dynamic Asset Allocation Conservative Fund
Interview with your fund’s portfolio manager
Jason R. Vaillancourt, CFAPortfolio Manager
Jason is Co-Head of Global Asset Allocation. He has an M.B.A. from the Booth School of Business at the University of Chicago and a B.S. from Northeastern University. Jason joined Putnam in 1999 and has been in the investment industry since 1993.
In addition to Jason, your fund’s portfolio managers are James A. Fetch and Robert J. Schoen.
What was the market environment during the annual reporting period ended September 30, 2018?Stock markets around the world advanced during the reporting period, though not without a few bouts of volatility from trade conflicts and geopolitical concerns. However, steady global growth and corporate earnings remained a positive backdrop for equity markets. A more hawkish-sounding U.S. Federal Reserve, trade-war jitters, and global political risks were not enough to dampen gains in international and U.S. equities during the trailing 12 months.
U.S. equity markets posted gains. Both the Dow Jones Industrial Average and the S&P 500 Index have now advanced in 11 of the past 12 quarters, and the Nasdaq marked its ninth consecutive quarterly gain. Stocks were lifted by strong economic growth and positive corporate earnings. The broad S&P 500 rose 17.9% during the reporting period and international stocks as measured by the MSCI EAFE Index [ND] returned 2.7% for the year. Markets did experience some downward pressure, particularly in February and March of 2018, but volatility generally remained low.
Jason Vaillancourt discusses fund performance and the investing environment for the 12 months ended September 30, 2018, as well as his outlook for the global financial markets in the months ahead.
Interview with your fund’s portfolio managerPerformance history as of 9/30/18
Annualized total return (%) comparison
LIFE OF FUND†
(since 2/7/94)10 YEARS 5 YEARS 3 YEARS 1 YEAR
5.825.08
5.56
6.68
3.77
6.435.41 5.44
2.16
5.30
4.14
5.44
1.31
5.925.35
3.17
–1.22
3.71
2.53
The fund — class A sharesbefore sales chargePutnam Dynamic AssetAllocation ConservativeFund (PACAX)
Fund’s primarybenchmarkBloomberg BarclaysU.S. AggregateBond Index
Current performance may be lower or higher than the quoted past performance, which cannot guarantee future results. Share price, principal value, and return will fluctuate, and you may have a gain or a loss when you sell your shares. Performance of class A shares assumes reinvestment of distributions and does not account for taxes. Fund returns in the bar chart do not reflect a sales charge of 5.75%; had they, returns would have been lower. See below and pages 10–12 for additional performance information. For a portion of the periods, the fund had expense limitations, without which returns would have been lower. To obtain the most recent month-end performance, visit putnam.com.
* The Putnam Conservative Blended Benchmark is a blended benchmark administered by Putnam Management and comprises 65% the Bloomberg Barclays U.S. Aggregate Bond Index, 25% the Russell 3000 Index, 5% the MSCI EAFE Index (ND), and 5% the JPMorgan Developed High Yield Index.
† The fund’s secondary benchmark, the Putnam Conservative Blended Benchmark, was introduced on 12/31/94, which post-dates the inception of the fund’s class A shares.
Recent broad market index and fund performance
17.91%
3.71%
3.17%
1.59%
–1.22%
U.S. stocks
(S&P 500 Index)
Fund’s secondary benchmark
(Putnam Conservative Blended Benchmark)
Putnam Dynamic Asset Allocation Conservative Fund
(class A shares before sales charge)
Cash
(ICE BofAML U.S. 3-Month Treasury Bill Index)
Fund’s primary benchmark
(Bloomberg Barclays U.S. Aggregate Bond Index)
This comparison shows your fund’s performance in the context of broad market indexes for the 12 months ended 9/30/18. See above and pages 10–12 for additional fund performance information. Index descriptions can be found on page 15.
Dynamic Asset Allocation Conservative Fund 5
Top 10 holdingsHOLDING (PERCENTAGE OF FUND’S NET ASSETS) SECURITY TYPE SECTOR/INDUSTRY
Government National Mortgage Association Pass-Through Certificates 3.50%, 8/20/47 (3.9%)
U.S. government agency mortgage obligations Government/Agency
Federal National Mortgage Association Pass-Through Certificates 3.50%, 1/1/48 (3.5%)
U.S. government agency mortgage obligations Government/Agency
Federal National Mortgage Association Pass-Through Certificates 3.00%, 12/1/31 (1.6%)
U.S. government agency mortgage obligations Government/Agency
Federal Home Loan Mortgage Corporation Pass-Through Certificates 4.00%, 5/1/48 (1.6%)
U.S. government agency mortgage obligations Government/Agency
Alphabet, Inc. (1.5%) Common stocks Technology/Technology services
JPMorgan Chase & Co. (1.0%) Common stocks Financials/Banking
Apple, Inc. (0.9%) Common stocks Technology/Computers
Cisco Systems, Inc. (0.8%) Common stocks Technology/Communications equipment
Boeing Co. (The) (0.8%) Common stocks Capital goods/Aerospace and defense
Verizon Communications, Inc. (0.8%) Common stocks Communication services/Telephone
This table shows the fund’s top 10 individual holdings and the percentage of the fund’s net assets that each represented as of 9/30/18. Short-term investments, TBA commitments, and derivatives, if any, are excluded. Holdings may vary over time.
Portfolio composition
U.S. Investment-grade bonds 64.6%
U.S. large-cap equity 18.3
International equity 6.6
U.S. small- and mid-cap equity 5.5
U.S. high-yield bonds 3.4
Commodities 1.0
U.S. money markets 0.6
Allocations are shown as a percentage of the fund’s net assets as of 9/30/18. Cash and net other assets, if any, represent the market value weights of cash, derivatives, short-term securities, and other unclassified assets in the portfolio. Summary information may differ from the portfolio schedule included in the financial statements due to the inclusion of derivative securities, any interest accruals, the exclusion of as-of trades, if any, the use of different classifications of securities for presentation purposes, and rounding. Holdings and allocations may vary over time.
6 Dynamic Asset Allocation Conservative Fund
The U.S. economy remained healthy. The economy has continued to add jobs, and wages have been rising. The unemployment rate fell to 3.7% in September 2018, the lowest level since December 1969. Real U.S. gross domestic product increased at an annual rate of 4.2% in the second quarter, its best performance in nearly four years, and a gauge of consumer sentiment also reached new highs.
The dollar surged after the Fed raised rates three times this year and signaled that it is on track to hike one more time in 2018. The September interest-rate increase takes the federal funds rate to a range of 2% to 2.25%, and it is the eighth increase since the Fed began normalizing policy in December 2015. Across the Atlantic, the European Central Bank [ECB] confirmed that it will cut bond-buying in half in October 2018 and anticipates that new purchases will be halted by the end of the year.
How did bond markets perform?Short-term interest rates continued to increase steadily during the past 12 months. The yield on the two-year U.S. Treasury bill traded above 2.8%, and the benchmark 10-year Treasury yield rose steadily to above the psychologically important 3% level in the final two weeks of the reporting period. As mentioned, the Fed raised short-term rates at the end of September, the third hike this year, and officials have penciled in another hike by the end of the year. U.S. economic strength, including a tightening labor market and an improving outlook for wage gains, also drove bond yields higher. High-yield bonds gained during the period, and spreads remained tight due to steady risk appetite from investors, though emerging-market debt came under pressure due to higher U.S. rates and a strong dollar. The Bloomberg Barclays U.S. Aggregate Bond Index finished slightly lower over these 12 months, with the steady move higher in interest rates causing negative total return.
How did Putnam Dynamic Asset Allocation Conservative Fund perform during the fiscal year?Class A shares of the fund returned 3.17% over the trailing 12 months, and outperformed its primary benchmark, the Bloomberg Barclays U.S. Aggregate Bond Index, an all-fixed-income index. The fund underperformed its secondary benchmark, the Putnam Conservative Blended Benchmark, which contains both stocks and bonds in similar allocations as the fund.
What strategies contributed to performance?Relative to the secondary benchmark, our asset allocation strategies during the year were a small positive. We maintained a slightly over-weight tactical position in equities relative to the custom benchmark allocations and held an out-of-benchmark position in commodities. Those positions were net positive contributors owing to the strength in equity markets and the rally in oil prices. Our slightly underweight position in high-yield fixed-income securities was a small detractor.
What strategies had an adverse impact?Security selection was a very slight detractor during the period relative to the custom benchmark. Our U.S. large-cap stocks under-performed the broad market during the period, which resulted in a negative security selection impact. An active currency strategy, where we take positions in major currencies that we feel are over- or undervalued, also detracted over these 12 months. Some of this selection weakness was balanced by strategic global macro positions, which performed well.
In terms of our investment strategies, we recently reduced our equities exposure to neutral. Jason Vaillancourt
Dynamic Asset Allocation Conservative Fund 7
How did the fund use derivatives?The fund used futures and forward currency contracts to hedge among other things, market risk, interest-rate risk, and foreign exchange risk.
What is the outlook for the next year?This year is turning out to be more mixed than 2017. Global growth prospects are expected to remain relatively stable for the remainder of 2018 and into next year. In our view, the U.S. economy is poised to expand further this year given indicators for consumer spending, corporate investment, and government fiscal stimulus. The labor market has remained strong as Americans saw wage gains accelerate and hiring improve. Meanwhile, U.S. inflation has remained benign, in our view. However, concerns about an escalation in the trade wars between the United States and other major economies has continued to plague markets around the world.
Despite strong underlying fundamentals, we believe stocks may be affected by continued trade tensions, the trajectory of
U.S. interest rates, and geopolitical risks. At the September 2018 rate meeting, the Fed raised its projection for economic growth this year and next and provided a road map of what lies ahead through 2021. Along with the rate increase, the Federal Open Market Committee continued to project one more hike before the end of the year and three in 2019. The federal funds rate serves as the baseline for multiple forms of consumer debt as well as savings accounts and CD rates.
In terms of our investment strategies, we recently reduced our equities exposure to neutral. We are concerned that the markets are shrugging off risks from trade policies and tariffs. In addition, we believe companies are operating at near peak margins and the bar may be too high for 2019 company earnings. In credit, while fundamentals appear fair, high-yield bond spreads remain near their tightest levels of the year, skewing potential outcomes to the negative, in our view. For commodities, we are maintaining a slightly bullish outlook for the asset class as a whole although we have reduced our exposure from earlier in the year.
Portfolio composition comparison
57.4%64.6%
U.S. Investment-grade bonds
as of 3/31/18
as of 9/30/18
3.5%3.4%
U.S. high-yield bonds
6.0%5.5%
U.S. small- and mid-cap equity
7.3%6.6%
International equity
23.2%18.3%
U.S. large-cap equity
This chart shows how the fund’s top weightings have changed over the past six months. Allocations are shown as a percentage of the fund’s net assets. Current period summary information may differ from the portfolio schedule included in the financial statements due to the inclusion of derivative securities, any interest accruals, the exclusion of as-of trades, if any, the use of different classifications of securities for presentation purposes, and rounding. Holdings and allocations may vary over time.
8 Dynamic Asset Allocation Conservative Fund
We expect bond yields in the United States and globally to continue rising over the next few years. However, we expect that we will increase our exposure over the short term if we believe that U.S. rates are rising too quickly. There is potential for Fed rate hikes to pressure risky assets, specifically U.S. equities, and drive people to the safety of Treasuries, in our view. We believe bond yields may also dip and prices rise if the weakness in emerging-market assets prompts investors to reduce their appetite for riskier assets or if U.S. economic data are weaker than anticipated.
Thank you, Jason, for your time and insights today.
The views expressed in this report are exclusively those of Putnam Management and are subject to change. They are not meant as investment advice.
Please note that the holdings discussed in this report may not have been held by the fund for the entire period. Portfolio composition is subject to review in accordance with the fund’s investment strategy and may vary in the future. Current and future portfolio holdings are subject to risk.
Of special interestDuring the fiscal year, the fund increased its dividend on two occasions. The rate was first raised from $0.015 per class A share to $0.016 per share in November 2017 due to a higher level of income in the portfolio. In July 2018, the rate was further raised to $0.017. Similar increases were made to other share classes.
ABOUT DERIVATIVES
Derivatives are an increasingly common type of investment instrument, the performance of which is derived from an underlying security, index, currency, or other area of the capital markets. Derivatives employed by the fund’s managers generally serve one of two main purposes: to implement a strategy that may be difficult or more expensive to invest in through traditional securities, or to hedge unwanted risk associated with a particular position.
For example, the fund’s managers might use currency forward contracts to capitalize on an anticipated change in exchange rates between two currencies. This approach would require a significantly smaller outlay of capital than purchasing traditional bonds denomi-nated in the underlying currencies. In another example, the managers may identify a bond that they believe is undervalued relative to its risk of default, but may seek to reduce the interest-rate risk of that bond by using interest-rate swaps, a derivative through which two parties “swap” payments based on the movement of certain rates. In other examples, the managers may use options and futures contracts to hedge against a variety of risks by establishing a combination of long and short exposures to specific equity markets or sectors.
Like any other investment, derivatives may not appreciate in value and may lose money. Derivatives may amplify traditional invest-ment risks through the creation of leverage and may be less liquid than traditional securities. And because derivatives typically represent contractual agreements between two financial institutions, derivatives entail “counterparty risk,” which is the risk that the other party is unable or unwilling to pay. Putnam monitors the counterparty risks we assume. For example, Putnam often enters into collateral agreements that require the counterparties to post collateral on a regular basis to cover their obligations to the fund. Counterparty risk for exchange-traded futures and centrally cleared swaps is mitigated by the daily exchange of margin and other safeguards against default through their respective clearinghouses.
Dynamic Asset Allocation Conservative Fund 9
Your fund’s performanceThis section shows your fund’s performance, price, and distribution information for periods ended September 30, 2018, the end of its most recent fiscal year. In accordance with regulatory requirements for mutual funds, we also include expense information taken from the fund’s current prospectus. Performance should always be considered in light of a fund’s investment strategy. Data represent past performance. Past performance does not guarantee future results. More recent returns may be less or more than those shown. Investment return and principal value will fluctuate, and you may have a gain or a loss when you sell your shares. Performance information does not reflect any deduction for taxes a shareholder may owe on fund distributions or on the redemption of fund shares. For the most recent month-end performance, please visit the Individual Investors section at putnam.com or call Putnam at 1-800-225-1581. Class P, R, R5, R6, and Y shares are not available to all investors. See the Terms and definitions section in this report for definitions of the share classes offered by your fund.
Fund performance Total return for periods ended 9/30/18
Net asset value 6.10 96.94 7.01 32.21 5.74 18.27 5.75 3.47
Class R (1/21/03)
Net asset value 5.64 87.64 6.50 28.59 5.16 16.30 5.16 2.91
Class R5 (7/2/12)
Net asset value 6.11 97.19 7.03 32.29 5.76 18.28 5.76 3.45
Class R6 (7/2/12)
Net asset value 6.12 97.86 7.06 32.65 5.81 18.39 5.79 3.40
Class Y (7/14/94)
Net asset value 6.09 96.46 6.99 31.89 5.69 17.98 5.67 3.39
Current performance may be lower or higher than the quoted past performance, which cannot guarantee future results. After-sales-charge returns for class A and M shares reflect the deduction of the maximum 5.75% and 3.50% sales charge, respectively, levied at the time of purchase. Class B share returns after contingent deferred sales charge (CDSC) reflect the applicable CDSC, which is 5% in the first year, declining over time to 1% in the sixth year, and is eliminated thereafter. Class C share returns after CDSC reflect a 1% CDSC for the first year that is eliminated thereafter. Class P, R, R5, R6, and Y shares have no initial sales charge or CDSC. Performance for class B, C, M, R, and Y shares before their inception is derived from the historical performance of class A shares, adjusted for the applicable sales
10 Dynamic Asset Allocation Conservative Fund
charge (or CDSC) and the higher operating expenses for such shares, except for class Y shares, for which 12b-1 fees are not applicable. Performance for class P, R5, and R6 shares prior to their inception is derived from the historical performance of class Y shares and has not been adjusted for the lower investor servicing fees applicable to class P, R5, and R6 shares; had it, returns would have been higher.
For a portion of the periods, the fund had expense limitations, without which returns would have been lower.
Class B share performance reflects conversion to class A shares after eight years.
Class C share performance reflects conversion to class A shares after 10 years.
Comparative index returns For periods ended 9/30/18
Annual average
(life of fund) 10 yearsAnnual average 5 years
Annual average 3 years
Annual average 1 year
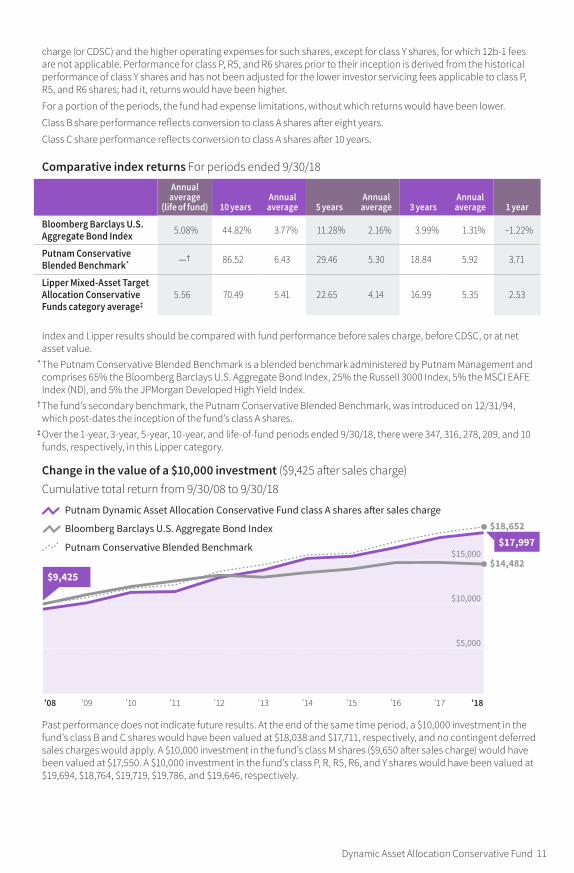
Bloomberg Barclays U.S. Aggregate Bond Index 5.08% 44.82% 3.77% 11.28% 2.16% 3.99% 1.31% –1.22%
Index and Lipper results should be compared with fund performance before sales charge, before CDSC, or at net asset value.
* The Putnam Conservative Blended Benchmark is a blended benchmark administered by Putnam Management and comprises 65% the Bloomberg Barclays U.S. Aggregate Bond Index, 25% the Russell 3000 Index, 5% the MSCI EAFE Index (ND), and 5% the JPMorgan Developed High Yield Index.
† The fund’s secondary benchmark, the Putnam Conservative Blended Benchmark, was introduced on 12/31/94, which post-dates the inception of the fund’s class A shares.
‡ Over the 1-year, 3-year, 5-year, 10-year, and life-of-fund periods ended 9/30/18, there were 347, 316, 278, 209, and 10 funds, respectively, in this Lipper category.
Change in the value of a $10,000 investment ($9,425 after sales charge)Cumulative total return from 9/30/08 to 9/30/18
Past performance does not indicate future results. At the end of the same time period, a $10,000 investment in the fund’s class B and C shares would have been valued at $18,038 and $17,711, respectively, and no contingent deferred sales charges would apply. A $10,000 investment in the fund’s class M shares ($9,650 after sales charge) would have been valued at $17,550. A $10,000 investment in the fund’s class P, R, R5, R6, and Y shares would have been valued at $19,694, $18,764, $19,719, $19,786, and $19,646, respectively.
$5,000
$10,000
$15,000
’08 ’09 ’10 ’11 ’12 ’13 ’14 ’15 ’16 ’17 ’18
$14,482
$18,652
Putnam Dynamic Asset Allocation Conservative Fund class A shares a�er sales charge
Bloomberg Barclays U.S. Aggregate Bond Index
Putnam Conservative Blended Benchmark
$9,425
$17,997
Dynamic Asset Allocation Conservative Fund 11
Fund price and distribution information For the 12-month period ended 9/30/18
Distributions Class A Class B Class C Class M Class P Class R Class R 5 Class R 6 Class Y
Number 12 12 12 12 12 12 12 12 12
Income $0.194 $0.113 $0.114 $0.140 $0.237 $0.165 $0.225 $0.230 $0.218
The classification of distributions, if any, is an estimate. Before-sales-charge share value and current dividend rate for class A and M shares, if applicable, do not take into account any sales charge levied at the time of purchase. After-sales-charge share value, current dividend rate, and current 30-day SEC yield, if applicable, are calculated assuming that the maximum sales charge (5.75% for class A shares and 3.50% for class M shares) was levied at the time of purchase. Final distribution information will appear on your year-end tax forms.
Your fund’s expensesAs a mutual fund investor, you pay ongoing expenses, such as management fees, distribution fees (12b-1 fees), and other expenses. Using the following information, you can estimate how these expenses affect your investment and compare them with the expenses of other funds. You may also pay one-time transaction expenses, including sales charges (loads) and redemption fees, which are not shown in this section and would have resulted in higher total expenses. For more information, see your fund’s prospectus or talk to your financial representative.
Expense ratiosClass A Class B Class C Class M Class P Class R Class R5 Class R6 Class Y
Total annual operating expenses for the fiscal year ended 9/30/17 1.02% 1.77% 1.77% 1.52% 0.62% 1.27% 0.73% 0.66% 0.77%
Annualized expense ratio for the six-month period ended 9/30/18* 0.99% 1.74% 1.74% 1.49% 0.60% 1.24% 0.71% 0.64% 0.74%
Fiscal-year expense information in this table is taken from the most recent prospectus, is subject to change, and may differ from that shown for the annualized expense ratio and in the financial highlights of this report.
Expenses are shown as a percentage of average net assets. * Expense ratios for each class are for the fund’s most recent fiscal half year. As a result of this, ratios may differ from
expense ratios based on one-year data in the financial highlights.
12 Dynamic Asset Allocation Conservative Fund
Expenses per $1,000The following table shows the expenses you would have paid on a $1,000 investment in each class of the fund from 4/1/18 to 9/30/18. It also shows how much a $1,000 investment would be worth at the close of the period, assuming actual returns and expenses.
Class A Class B Class C Class M Class P Class R Class R5 Class R6 Class Y
* Expenses for each share class are calculated using the fund’s annualized expense ratio for each class, which represents the ongoing expenses as a percentage of average net assets for the six months ended 9/30/18. The expense ratio may differ for each share class.
† Expenses are calculated by multiplying the expense ratio by the average account value for the period; then multiplying the result by the number of days in the period; and then dividing that result by the number of days in the year.
Estimate the expenses you paidTo estimate the ongoing expenses you paid for the six months ended 9/30/18, use the following calculation method. To find the value of your investment on 4/1/18, call Putnam at 1-800-225-1581.
How to calculate the expenses you paid
Value of your investment on 4/1/18 ÷ $1,000 x Expenses paid per $1,000 = Total expenses paid
Example Based on a $10,000 investment in class A shares of your fund.
$10,000 ÷ $1,000 x $5.03 (see preceding table) = $50.30
Compare expenses using the SEC’s methodThe Securities and Exchange Commission (SEC) has established guidelines to help investors assess fund expenses. Per these guidelines, the following table shows your fund’s expenses based on a $1,000 investment, assuming a hypothetical 5% annualized return. You can use this information to compare the ongoing expenses (but not transaction expenses or total costs) of investing in the fund with those of other funds. All mutual fund shareholder reports will provide this information to help you make this comparison. Please note that you cannot use this information to estimate your actual ending account balance and expenses paid during the period.
Class A Class B Class C Class M Class P Class R Class R5 Class R6 Class Y
* Expenses for each share class are calculated using the fund’s annualized expense ratio for each class, which represents the ongoing expenses as a percentage of average net assets for the six months ended 9/30/18. The expense ratio may differ for each share class.
† Expenses are calculated by multiplying the expense ratio by the average account value for the six-month period; then multiplying the result by the number of days in the six-month period; and then dividing that result by the number of days in the year.
Dynamic Asset Allocation Conservative Fund 13
Terms and definitions
Important termsTotal return shows how the value of the fund’s shares changed over time, assuming you held the shares through the entire period and reinvested all distributions in the fund.
Before sales charge, or net asset value, is the price, or value, of one share of a mutual fund, without a sales charge. Before-sales-charge figures fluctuate with market conditions, and are calculated by dividing the net assets of each class of shares by the number of outstanding shares in the class.
After sales charge is the price of a mutual fund share plus the maximum sales charge levied at the time of purchase. After-sales-charge perfor-mance figures shown here assume the 5.75% maximum sales charge for class A shares and 3.50% for class M shares.
Contingent deferred sales charge (CDSC) is generally a charge applied at the time of the redemption of class B or C shares and assumes redemption at the end of the period. Your fund’s class B CDSC declines over time from a 5% maximum during the first year to 1% during the sixth year. After the sixth year, the CDSC no longer applies. The CDSC for class C shares is 1% for one year after purchase.
Share classesClass A shares are generally subject to an initial sales charge and no CDSC (except on certain redemptions of shares bought without an initial sales charge).
Class B shares are closed to new investments and are only available by exchange from another Putnam fund or through dividend and/or capital gains reinvestment. They are not subject to an initial sales charge and may be subject to a CDSC.
Class C shares are not subject to an initial sales charge and are subject to a CDSC only if the shares are redeemed during the first year.
Class M shares have a lower initial sales charge and a higher 12b-1 fee than class A shares and no CDSC.
Class P shares require no minimum initial investment amount and no minimum subsequent investment amount. There is no initial or deferred sales charge. They are available only to other Putnam funds and other accounts managed by Putnam Management or its affiliates.
Class R shares are not subject to an initial sales charge or CDSC and are only available to employer-sponsored retirement plans.
Class R5 shares are not subject to an initial sales charge or CDSC and carry no 12b-1 fee. They are only available to employer-sponsored retirement plans.
Class R6 shares are not subject to an initial sales charge or CDSC and carry no 12b-1 fee. They are generally only available to employer-sponsored retirement plans, corporate and institutional clients, and clients in other approved programs.
Class Y shares are not subject to an initial sales charge or CDSC and carry no 12b-1 fee. They are generally only available to corporate and institutional clients and clients in other approved programs.
Fixed-income termsCurrent rate is the annual rate of return earned from dividends or interest of an investment. Current rate is expressed as a percentage of the price of a security, fund share, or principal investment.
Mortgage-backed security (MBS), also known as a mortgage “pass-through,” is a type of asset-backed security that is secured by a mortgage or collection of mortgages. The following are types of MBSs:
• Agency “pass-through” has its principal and interest backed by a U.S. government
14 Dynamic Asset Allocation Conservative Fund
agency, such as the Federal National Mortgage Association (Fannie Mae), Govern-ment National Mortgage Association (Ginnie Mae), and Federal Home Loan Mortgage Corporation (Freddie Mac).
• Collateralized mortgage obligation (CMO) represents claims to specific cash flows from pools of home mortgages. The streams of principal and interest payments on the mortgages are distributed to the different classes of CMO interests in “tranches.” Each tranche may have different principal balances, coupon rates, prepay-ment risks, and maturity dates. A CMO is highly sensitive to changes in interest rates and any resulting change in the rate at which homeowners sell their properties, refinance, or otherwise prepay loans. CMOs are subject to prepayment, market, and liquidity risks.
• Interest-only (IO) security is a type of CMO in which the underlying asset is the interest portion of mortgage, Treasury, or bond payments.
• Non-agency residential mortgage-backed security (RMBS) is an MBS not backed by Fannie Mae, Ginnie Mae, or Freddie Mac. One type of RMBS is an Alt-A mortgage-backed security.
• Commercial mortgage-backed security (CMBS) is secured by the loan on a commercial property.
Yield curve is a graph that plots the yields of bonds with equal credit quality against their differing maturity dates, ranging from shortest to longest. It is used as a benchmark for other debt, such as mortgage or bank lending rates.
Comparative indexesBloomberg Barclays U.S. Aggregate Bond Index is an unmanaged index of U.S. investment-grade fixed-income securities.
ICE BofAML (Intercontinental Exchange Bank of America Merrill Lynch) U.S. 3-Month Treasury Bill Index is an unmanaged index that seeks to measure the performance of U.S. Treasury bills available in the marketplace.
JPMorgan Developed High Yield Index is an unmanaged index of high-yield fixed-income securities issued in developed countries.
Putnam Conservative Blended Benchmark is a benchmark administered by Putnam Management, comprising 65% the Bloomberg Barclays U.S Aggregate Bond Index, 25% the Russell 3000 Index, 5% the MSCI EAFE Index (ND), and 5% the JPMorgan Developed High Yield Index.
MSCI EAFE Index (ND) is a free float-adjusted market capitalization index that is designed to measure the equity performance of large and mid-cap markets in developed countries, excluding the U.S. and Canada. Calculated with net dividends (ND), this total return index reflects the reinvestment of dividends after the deduction of withholding taxes, using a tax rate applicable to non-resident institutional investors who do not benefit from double taxation treaties.
Russell 3000 Index is an unmanaged index of the 3,000 largest U.S. companies.
S&P 500 Index is an unmanaged index of common stock performance.ICE Data Indices, LLC (“ICE BofAML”), used with permis-sion. ICE BofAML permits use of the ICE BofAML indices and related data on an “as is” basis; makes no warran-ties regarding same; does not guarantee the suitability, quality, accuracy, timeliness, and/or completeness of the ICE BofAML indices or any data included in, related to, or derived therefrom; assumes no liability in connec-tion with the use of the foregoing; and does not sponsor, endorse, or recommend Putnam Investments, or any of its products or services.
Indexes assume reinvestment of all distributions and do not account for fees. Securities and performance of a fund and an index will differ. You cannot invest directly in an index.
Frank Russell Company is the source and owner of the trademarks, service marks, and copyrights related to the Russell Indexes. Russell® is a trademark of Frank Russell Company.
Dynamic Asset Allocation Conservative Fund 15
Lipper is a third-party industry-ranking entity that ranks mutual funds. Its rankings do not reflect sales charges. Lipper rankings are based on total return at net asset value relative to other funds that have similar current
investment styles or objectives as determined by Lipper. Lipper may change a fund’s category assignment at its discretion. Lipper category averages reflect performance trends for funds within a category.
Other information for shareholders
Proxy votingPutnam is committed to managing our mutual funds in the best interests of our shareholders. The Putnam funds’ proxy voting guidelines and procedures, as well as information regarding how your fund voted proxies relating to portfolio securities during the 12-month period ended June 30, 2018, are available in the Individual Investors section of putnam.com and on the Securities and Exchange Commis-sion (SEC) website, www.sec.gov. If you have questions about finding forms on the SEC’s website, you may call the SEC at 1-800-SEC-0330. You may also obtain the Putnam funds’ proxy voting guidelines and procedures at no charge by calling Putnam’s Shareholder Services at 1-800-225-1581.
Fund portfolio holdingsThe fund will file a complete schedule of its portfolio holdings with the SEC for the first and
third quarters of each fiscal year on Form N-Q. Shareholders may obtain the fund’s Form N-Q on the SEC’s website at www.sec.gov. In addition, the fund’s Form N-Q may be reviewed and copied at the SEC’s Public Reference Room in Washington, D.C. You may call the SEC at 1-800-SEC-0330 for information about the SEC’s website or the operation of the Public Reference Room.
Trustee and employee fund ownershipPutnam employees and members of the Board of Trustees place their faith, confidence, and, most importantly, investment dollars in Putnam mutual funds. As of September 30, 2018, Putnam employees had approximately $508,000,000 and the Trustees had approxi-mately $69,000,000 invested in Putnam mutual funds. These amounts include investments by the Trustees’ and employees’ immediate family members as well as investments through retirement and deferred compensation plans.
16 Dynamic Asset Allocation Conservative Fund
Important notice regarding Putnam’s privacy policy
In order to conduct business with our shareholders, we must obtain certain personal information such as account holders’ names, addresses, Social Security numbers, and dates of birth. Using this information, we are able to maintain accurate records of accounts and transactions.
It is our policy to protect the confidentiality of our shareholder information, whether or not a shareholder currently owns shares of our funds. In particular, it is our policy not to sell information about you or your accounts to outside marketing firms. We have safeguards in place designed to prevent unauthorized access
to our computer systems and procedures to protect personal information from unauthorized use.
Under certain circumstances, we must share account information with outside vendors who provide services to us, such as mailings and proxy solicitations. In these cases, the service providers enter into confidentiality agreements with us, and we provide only the information necessary to process transactions and perform other services related to your account. Finally, it is our policy to share account information with your financial representative, if you’ve listed one on your Putnam account.
Dynamic Asset Allocation Conservative Fund 17
Trustee approval of management contract
Trustee approval of management contract
General conclusionsThe Board of Trustees of The Putnam Funds oversees the management of each fund and, as required by law, determines annually whether to approve the continuance of your fund’s management contract with Putnam Investment Management, LLC (“Putnam Management”), the sub-management contract with respect to your fund between Putnam Management and its affiliate, Putnam Investments Limited (“PIL”), and the sub-advisory contract among Putnam Management, PIL, and another affiliate, The Putnam Advisory Company (“PAC”). The Board, with the assistance of its Contract Committee, requests and evaluates all information it deems reasonably necessary under the circumstances in connection with its annual contract review. The Contract Committee consists solely of Trustees who are not “interested persons” (as this term is defined in the Investment Company Act of 1940, as amended (the “1940 Act”)) of The Putnam Funds (“Independent Trustees”).
At the outset of the review process, members of the Board’s independent staff and independent legal counsel discussed with representatives of Putnam Management the annual contract review materials furnished to the Contract Committee during the course of the previous year’s review, identifying possible changes in these materi-als that might be necessary or desirable for the coming year. Following these discussions and in consultation with the Contract Committee, the Independent Trustees’ independent legal counsel requested that Putnam Management and its affiliates furnish specified information, together with any additional information that Putnam Management considered relevant, to the Contract Committee. Over the course of several months ending in June 2018, the Contract Committee met on a number of occasions with representatives of Putnam Management, and separately in executive session, to consider the information that Putnam Management provided. Throughout this process, the Contract Committee was assisted by the members of the Board’s independent staff and by independent legal counsel for The Putnam Funds and the Independent Trustees.
In May 2018, the Contract Committee met in executive session to discuss and consider its recommendations with respect to the continuance of the contracts. At the Trustees’ June 2018
meeting, the Contract Committee met in execu-tive session with the other Independent Trustees to review a summary of the key financial, perfor-mance and other data that the Contract Committee considered in the course of its review. The Contract Committee then presented its written report, which summarized the key factors that the Committee had considered and set forth its recommendations. The Contract Committee recommended, and the Independent Trustees approved, the continuance of your fund’s management, sub-management and sub-advisory contracts, effective July 1, 2018. (Because PIL and PAC are affiliates of Putnam Management and Putnam Management remains fully responsible for all services provided by PIL and PAC, the Trustees have not attempted to evaluate PIL or PAC as separate entities, and all subsequent references to Putnam Management below should be deemed to include reference to PIL and PAC as necessary or appropriate in the context.)
The Independent Trustees’ approval was based on the following conclusions:
• That the fee schedule in effect for your fund repre-sented reasonable compensation in light of the nature and quality of the services being provided to the fund, the fees paid by competitive funds, the costs incurred by Putnam Management in providing services to the fund, and the appli-cation of certain reductions and waivers noted below; and
• That the fee schedule in effect for your fund represented an appropriate sharing between fund shareholders and Putnam Management of such economies of scale as may exist in the management of the fund at current asset levels.
These conclusions were based on a comprehen-sive consideration of all information provided to the Trustees and were not the result of any single factor. Some of the factors that figured particularly in the Trustees’ deliberations and how the Trust-ees considered these factors are described below, although individual Trustees may have evaluated the information presented differently, giving differ-ent weights to various factors. It is also important to recognize that the management arrangements for your fund and the other Putnam funds are the result of many years of review and discussion between the Independent Trustees and Putnam Manage-ment, that some aspects of the arrangements may receive greater scrutiny in some years than others, and that the Trustees’ conclusions may be based,
18 Dynamic Asset Allocation Conservative Fund
in part, on their consideration of fee arrangements in previous years. For example, with some minor exceptions, the funds’ current fee arrangements under the management contracts were first imple-mented at the beginning of 2010 following extensive review by the Contract Committee and discussions with representatives of Putnam Management, as well as approval by shareholders.
Management fee schedules and total expensesThe Trustees reviewed the management fee schedules in effect for all Putnam funds, includ-ing fee levels and breakpoints. The Trustees also reviewed the total expenses of each Putnam fund, recognizing that in most cases management fees represented the major, but not the sole, deter-minant of total costs to fund shareholders. (In a few instances, funds have implemented so-called “all-in” management fees covering substantially all routine fund operating costs.)
In reviewing fees and expenses, the Trustees generally focus their attention on material changes in circumstances — for example, changes in assets under management, changes in a fund’s investment strategy, changes in Putnam Management’s operating costs or profitability, or changes in competitive practices in the mutual fund industry — that suggest that consideration of fee changes might be warranted. The Trustees concluded that the circumstances did not indicate that changes to the management fee structure for your fund would be appropriate at this time.
Under its management contract, your fund has the benefit of breakpoints in its management fee schedule that provide shareholders with econo-mies of scale in the form of reduced fee rates as assets under management in the Putnam family of funds increase. The Trustees concluded that the fee schedule in effect for your fund represented an appropriate sharing of econo-mies of scale between fund shareholders and Putnam Management.
As in the past, the Trustees also focused on the competitiveness of each fund’s total expense ratio. In order to support the effort to have fund expenses meet competitive standards, the Trust-ees and Putnam Management have implemented expense limitations that were in effect during your fund’s fiscal year ending in 2017. These expense limitations were: (i) a contractual expense limitation applicable to all open-end funds of 25 basis points on investor servicing fees and expenses and (ii) a contractual expense limitation
applicable to specified open-end funds, including your fund, of 20 basis points on so-called “other expenses” (i.e., all expenses exclusive of manage-ment fees, distribution fees, investor servicing fees, investment-related expenses, interest, taxes, brokerage commissions, acquired fund fees and expenses and extraordinary expenses). These expense limitations attempt to maintain competitive expense levels for the funds. Most funds, including your fund, had sufficiently low expenses that these expense limitations were not operative during their fiscal years ending in 2017. Putnam Management has agreed to maintain these expense limitations until at least January 30, 2020. Putnam Management’s support for these expense limitation arrangements was an import-ant factor in the Trustees’ decision to approve the continuance of your fund’s management, sub-management and sub-advisory contracts.
The Trustees reviewed comparative fee and expense information for a custom group of competitive funds selected by Broadridge Financial Solutions, Inc. (“Broadridge”). This comparative information included your fund’s percentile ranking for effective management fees and total expenses (excluding any applicable 12b-1 fee), which provides a general indication of your fund’s relative standing. In the custom peer group, your fund ranked in the second quintile in effective management fees (determined for your fund and the other funds in the custom peer group based on fund asset size and the applicable contractual management fee schedule) and in the third quintile in total expenses (excluding any applicable 12b-1 fees) as of December 31, 2017. The first quintile represents the least expensive funds and the fifth quintile the most expensive funds. The fee and expense data reported by Broadridge as of December 31, 2017 reflected the most recent fiscal year-end data available in Broadridge’s database at that time.
In connection with their review of fund manage-ment fees and total expenses, the Trustees also reviewed the costs of the services provided and the profits realized by Putnam Management and its affiliates from their contractual relationships with the funds. This information included trends in revenues, expenses and profitability of Putnam Management and its affiliates relating to the investment management, investor servicing and distribution services provided to the funds. In this regard, the Trustees also reviewed an analysis of Putnam Management’s revenues, expenses and profitability, allocated on a fund-by-fund basis,
Dynamic Asset Allocation Conservative Fund 19
with respect to the funds’ management, distribu-tion, and investor servicing contracts. For each fund, the analysis presented information about revenues, expenses and profitability for each of the agreements separately and for the agree-ments taken together on a combined basis. The Trustees concluded that, at current asset levels, the fee schedules in place represented reasonable compensation for the services being provided and represented an appropriate sharing between fund shareholders and Putnam Management of such economies of scale as may exist in the management of the Putnam funds at that time.
The information examined by the Trustees in connection with their annual contract review for the Putnam funds included information regard-ing fees charged by Putnam Management and its affiliates to institutional clients, including defined benefit pension and profit-sharing plans and sub-advised mutual funds. This information included, in cases where an institutional product’s investment strategy corresponds with a fund’s strategy, comparisons of those fees with fees charged to the Putnam funds, as well as an assess-ment of the differences in the services provided to these different types of clients as compared to the services provided to the Putnam funds. The Trustees observed that the differences in fee rates between these clients and the Putnam funds are by no means uniform when examined by individ-ual asset sectors, suggesting that differences in the pricing of investment management services to these types of clients may reflect, among other things, historical competitive forces operating in separate markets. The Trustees considered the fact that in many cases fee rates across different asset classes are higher on average for mutual funds than for institutional clients, as well as the differences between the services that Putnam Management provides to the Putnam funds and those that it provides to its other clients. The Trustees did not rely on these comparisons to any significant extent in concluding that the management fees paid by your fund are reasonable.
Investment performanceThe quality of the investment process provided by Putnam Management represented a major factor in the Trustees’ evaluation of the quality of services provided by Putnam Management under your fund’s management contract. The Trustees were assisted in their review of the Putnam funds’ investment process and performance by the work of the investment oversight committees of the
Trustees and the full Board of Trustees, which meet on a regular basis with the funds’ portfolio teams and with the Chief Investment Officers and other senior members of Putnam Management’s Investment Division throughout the year. The Trustees concluded that Putnam Management generally provides a high-quality investment process — based on the experience and skills of the individuals assigned to the management of fund portfolios, the resources made available to them, and in general Putnam Manage-ment’s ability to attract and retain high-quality personnel — but also recognized that this does not guarantee favorable investment results for every fund in every time period.
The Trustees considered that 2017 was a strong year for the performance of the Putnam funds, with generally favorable results for most asset classes, including U.S. equity, international and global equity, taxable and tax exempt fixed income, and global asset allocation Funds. In this regard, the Trustees considered that, for the one-year period ended December 31, 2017, the Putnam open-end Funds’ performance, on an asset-weighted basis, ranked in the 32nd percentile of their Lipper peers (excluding those Putnam funds that are evaluated based on their total returns and/or comparisons of those returns versus selected investment benchmarks or targeted annual returns). The Trustees observed that this strong performance has continued a positive trend that began in mid-year 2016 across most Putnam funds. They noted that the longer-term performance of the Putnam funds continued to be strong, exemplified by the fact that the Putnam funds were ranked by the Barron’s/Lipper Fund Families survey as the 7th-best performing mutual fund complex out of 55 complexes for the five-year period ended December 31, 2017 and the 9th-best performing mutual fund complex out of 50 complexes for the ten-year period ended 2017. In addition, the survey ranked the Putnam funds 7th out of 59 mutual fund complexes for the one-year period ended 2017; the Putnam funds have ranked 1st or 2nd in the survey for the one-year period three times since 2009 (most recently in 2013). They also noted, however, the disappointing investment performance of some funds for periods ended December 31, 2017 and considered information provided by Putnam Management regarding the factors contributing to the underperformance and actions being taken to improve the performance of these particular funds. The Trustees indicated
20 Dynamic Asset Allocation Conservative Fund
their intention to continue to monitor closely the performance of those funds, including the effec-tiveness of any efforts Putnam Management has undertaken to address underperformance and whether additional actions to address areas of underperformance are warranted.
For purposes of the Trustees’ evaluation of the Putnam Funds’ investment performance, the Trustees generally focus on a competitive indus-try ranking of each fund’s total net return over a one-year, three-year and five-year period. For a number of Putnam funds with relatively unique investment mandates for which Putnam Manage-ment informed the Trustees that meaningful competitive performance rankings are not considered to be available, the Trustees evalu-ated performance based on their total gross and net returns and, in most cases, comparisons of those returns with the returns of selected invest-ment benchmarks. In the case of your fund, the Trustees considered that its class A share cumulative total return performance at net asset value was in the following quartiles of its Lipper Inc. (“Lipper”) peer group (Lipper Mixed-Asset Target Allocation Conservative Funds) for the one-year, three-year and five-year periods ended December 31, 2017 (the first quartile representing the best-performing funds and the fourth quartile the worst-performing funds):
One-year period 2ndThree-year period 1stFive-year period 1st
For the five-year period ended December 31, 2017, your fund’s performance was in the top decile of its Lipper peer group. Over the one-year, three-year and five-year periods ended December 31, 2017, there were 351, 315 and 287 funds, respec-tively, in your fund’s Lipper peer group. (When considering performance information, sharehold-ers should be mindful that past performance is not a guarantee of future results.)
The Trustees considered Putnam Management’s continued efforts to support fund performance through initiatives including structuring compen-sation for portfolio managers and research analysts to enhance accountability for fund performance, emphasizing accountability in the portfolio management process, and affirming its commitment to a fundamental-driven approach to investing. The Trustees noted further that Putnam Management continued to strengthen its fundamental research capabilities by adding new investment personnel.
Brokerage and soft-dollar allocations; investor servicingThe Trustees considered various potential benefits that Putnam Management may receive in connection with the services it provides under the management contract with your fund. These include benefits related to brokerage allocation and the use of soft dollars, whereby a portion of the commissions paid by a fund for brokerage may be used to acquire research services that are expected to be useful to Putnam Management in managing the assets of the fund and of other clients. Subject to policies established by the Trustees, soft dollars generated by these means are used predominantly to acquire brokerage and research services (including third-party research and market data) that enhance Putnam Manage-ment’s investment capabilities and supplement Putnam Management’s internal research efforts. However, the Trustees noted that a portion of available soft dollars continues to be used to pay fund expenses. The Trustees indicated their continued intent to monitor regulatory and indus-try developments in this area with the assistance of their Brokerage Committee. The Trustees also indicated their continued intent to monitor the allocation of the Putnam funds’ brokerage in order to ensure that the principle of seeking best price and execution remains paramount in the portfolio trading process.
Putnam Management may also receive benefits from payments that the funds make to Putnam Management’s affiliates for investor or distribution services. In conjunction with the annual review of your fund’s management, sub-management and sub-advisory contracts, the Trustees reviewed your fund’s investor servicing agreement with Putnam Investor Services, Inc. (“PSERV”) and its distributor’s contracts and distribution plans with Putnam Retail Management Limited Partnership (“PRM”), both of which are affiliates of Putnam Management. The Trustees concluded that the fees payable by the funds to PSERV and PRM, as applicable, for such services are fair and reason-able in relation to the nature and quality of such services, the fees paid by competitive funds, and the costs incurred by PSERV and PRM, as applicable, in providing such services. Further-more, the Trustees were of the view that the services provided were required for the operation of the funds, and that they were of a quality at least equal to those provided by other providers.
Dynamic Asset Allocation Conservative Fund 21
Financial statements
22 Dynamic Asset Allocation Conservative Fund
Financial statements
These sections of the report, as well as the accompanying Notes, preceded by the Report of Independent Registered Public Accounting Firm, constitute the fund’s financial statements.
The fund’s portfolio lists all the fund’s invest-ments and their values as of the last day of the reporting period. Holdings are organized by asset type and industry sector, country, or state to show areas of concentration and diversification.
Statement of assets and liabilities shows how the fund’s net assets and share price are determined. All investment and non-investment assets are added together. Any unpaid expenses and other liabilities are subtracted from this total. The result is divided by the number of shares to determine the net asset value per share, which is calculated separately for each class of shares. (For funds with preferred shares, the amount subtracted from total assets includes the liquidation preference of preferred shares.)
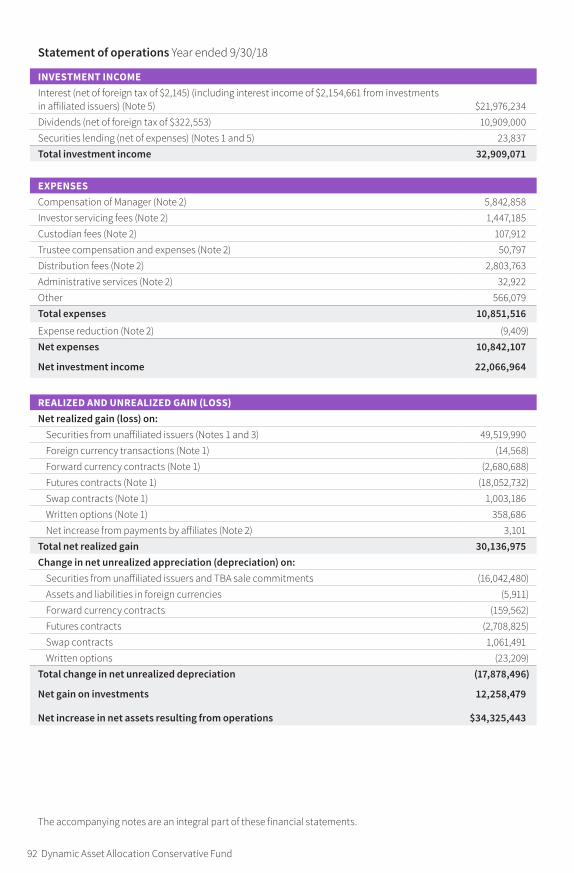
Statement of operations shows the fund’s net investment gain or loss. This is done by first adding up all the fund’s earnings — from dividends and interest income — and subtracting its operating expenses to determine net investment income (or
loss). Then, any net gain or loss the fund realized on the sales of its holdings — as well as any unreal-ized gains or losses over the period — is added to or subtracted from the net investment result to determine the fund’s net gain or loss for the fiscal year.
Statement of changes in net assets shows how the fund’s net assets were affected by the fund’s net investment gain or loss, by distributions to shareholders, and by changes in the number of the fund’s shares. It lists distributions and their sources (net investment income or realized capital gains) over the current reporting period and the most recent fiscal year-end. The distributions listed here may not match the sources listed in the Statement of operations because the distributions are deter-mined on a tax basis and may be paid in a different period from the one in which they were earned.
Financial highlights provide an overview of the fund’s investment results, per-share distributions, expense ratios, net investment income ratios, and portfolio turnover in one summary table, reflecting the five most recent reporting periods. In a semiannual report, the highlights table also includes the current reporting period.
Report of Independent Registered Public Accounting Firm
To the Trustees of Putnam Asset Allocation Funds and Shareholders of Putnam Dynamic Asset Allocation Conservative Fund:
Opinion on the Financial Statements
We have audited the accompanying statement of assets and liabilities, including the fund’s portfolio, of Putnam Dynamic Asset Allocation Conservative Fund (one of the funds constituting Putnam Asset Allocation Funds, referred to hereafter as the “Fund”) as of September 30, 2018, the related statement of operations for the year ended September 30, 2018, the statement of changes in net assets for each of the two years in the period ended September 30, 2018, including the related notes, and the financial highlights for each of the periods indicated therein (collectively referred to as the “financial statements”). In our opinion, the financial statements present fairly, in all material respects, the financial position of the Fund as of September 30, 2018, the results of its operations for the year then ended, the changes in its net assets for each of the two years in the period ended September 30, 2018, and the financial highlights for each of the periods indicated therein in conformity with accounting principles generally accepted in the United States of America.
Basis for Opinion
These financial statements are the responsibility of the Fund’s management. Our responsibility is to express an opinion on the Fund’s financial statements based on our audits. We are a public accounting firm registered with the Public Company Accounting Oversight Board (United States) (“PCAOB”) and are required to be independent with respect to the Fund in accordance with the U.S. federal securities laws and the applicable rules and regulations of the Securities and Exchange Commission and the PCAOB.
We conducted our audits of these financial statements in accordance with the standards of the PCAOB. Those standards require that we plan and perform the audit to obtain reasonable assurance about whether the financial statements are free of material misstatement, whether due to error or fraud.
Our audits included performing procedures to assess the risks of material misstatement of the financial statements, whether due to error or fraud, and performing procedures that respond to those risks. Such procedures included examining, on a test basis, evidence regarding the amounts and disclosures in the financial statements. Our audits also included evaluating the accounting principles used and significant estimates made by management, as well as evaluating the overall presentation of the financial statements. Our procedures included confirmation of securities owned as of September 30, 2018, by correspondence with the custodian, transfer agent and brokers; when replies were not received from brokers, we performed other auditing procedures. We believe that our audits provide a reasonable basis for our opinion.
PricewaterhouseCoopers LLP Boston, Massachusetts November 15, 2018
We have served as the auditor of one or more investment companies in the Putnam Investments family of mutual funds since at least 1957. We have not been able to determine the specific year we began serving as auditor.
Dynamic Asset Allocation Conservative Fund 23
24 Dynamic Asset Allocation Conservative Fund
COMMON STOCKS (44.9%)* Shares ValueBasic materials (1.7%)Air Products & Chemicals, Inc. 7,700 $1,286,285Anglo American PLC (United Kingdom) 38,953 874,790ArcelorMittal SA (France) 34,585 1,076,152Arkema SA (France) 4,676 579,282BASF SE (Germany) 11,449 1,017,569BHP Billiton, Ltd. (Australia) 13,984 350,052BlueScope Steel, Ltd. (Australia) 64,479 791,415Boliden AB (Sweden) 7,123 198,685Cabot Corp. 4,800 301,056Celanese Corp. 7,800 889,200CIMIC Group, Ltd. (Australia) 5,944 220,674Covestro AG (Germany) 12,260 994,420Domtar Corp. 7,000 365,190Evonik Industries AG (Germany) 15,617 559,376HOCHTIEF AG (Germany) 970 160,824Huntsman Corp. 38,300 1,042,909Mitsubishi Chemical Holdings Corp. (Japan) 52,700 504,412Mitsubishi Gas Chemical Co., Inc. (Japan) 10,100 215,032Newmont Mining Corp. 33,900 1,023,780Packaging Corp. of America 10,300 1,129,807Rio Tinto PLC (United Kingdom) 26,630 1,346,731Royal Gold, Inc. 3,400 262,004Sealed Air Corp. 6,100 244,915Sherwin-Williams Co. (The) 91 41,424South32, Ltd. (Australia) 30,120 85,347Taisei Corp. (Japan) 12,900 588,118Univar, Inc. † 6,900 211,554UPM-Kymmene OYJ (Finland) 13,485 529,199W.R. Grace & Co. 8,800 628,848Weyerhaeuser Co. R 32,100 1,035,867
18,554,917Capital goods (3.4%)ACS Actividades de Construccion y Servicios SA (Spain) 17,512 745,789AECOM † 8,800 287,408Allison Transmission Holdings, Inc. 23,600 1,227,436Avery Dennison Corp. 8,783 951,638BAE Systems PLC (United Kingdom) 8,758 71,893Berry Plastics Group, Inc. † 15,671 758,320Boeing Co. (The) 23,300 8,665,270BWX Technologies, Inc. 8,178 511,452CAE, Inc. (Canada) 584 11,855Crown Holdings, Inc. † 1,066 51,168Cummins, Inc. 14,400 2,103,408Dassault Aviation SA (France) 41 75,879Faurecia SA (France) 13,285 799,609Gardner Denver Holdings, Inc. † 9,600 272,064General Dynamics Corp. 304 62,235HD Supply Holdings, Inc. † 9,800 419,342
The fund’s portfolio 9/30/18
Dynamic Asset Allocation Conservative Fund 25
COMMON STOCKS (44.9%)* cont. Shares ValueCapital goods cont.Hitachi, Ltd. (Japan) 32,800 $1,114,311Honeywell International, Inc. 20,000 3,328,000Huntington Ingalls Industries, Inc. 45 11,524Ingersoll-Rand PLC 19,400 1,984,620L3 Technologies, Inc. 1,117 237,497Lockheed Martin Corp. 7,000 2,421,720MAN SE (Germany) 580 63,065Northrop Grumman Corp. 10,646 3,378,721Pentair PLC 14,400 624,240Raytheon Co. 10,356 2,140,171Republic Services, Inc. 10,100 733,866Safran SA (France) 302 42,322Sandvik AB (Sweden) 59,628 1,058,388Singapore Technologies Engineering, Ltd. (Singapore) 26,200 68,229SKF AB Class B (Sweden) 22,914 452,097Teledyne Technologies, Inc. † 1,100 271,348Tervita Corp. (Canada) † 59 407Vinci SA (France) 9,099 866,492WABCO Holdings, Inc. † 3,400 400,996Waste Management, Inc. 17,488 1,580,216
37,792,996Communication services (1.1%)ARRIS International PLC † 10,272 266,969AT&T, Inc. 1,744 58,564BT Group PLC (United Kingdom) 32,291 94,824KDDI Corp. (Japan) 44,500 1,229,409Millicom International Cellular SA SDR (Sweden) 342 19,645Nippon Telegraph & Telephone Corp. (Japan) 23,300 1,052,416NTT DoCoMo, Inc. (Japan) 25,000 672,197Swisscom AG (Switzerland) 629 285,467Verizon Communications, Inc. 161,402 8,617,252Zayo Group Holdings, Inc. † 579 20,103
2,890,290Consumer cyclicals (6.5%)ABC-Mart, Inc. (Japan) 4,900 272,558Amazon.com, Inc. † 3,521 7,052,563Aramark 169 7,270Aristocrat Leisure, Ltd. (Australia) 7,387 151,861Automatic Data Processing, Inc. 15,500 2,335,230Berkeley Group Holdings PLC (The) (United Kingdom) 3,864 185,287Booking Holdings, Inc. † 15 29,760Booz Allen Hamilton Holding Corp. 13,700 679,931Caesars Entertainment Corp. † 2,538 26,015
26 Dynamic Asset Allocation Conservative Fund
COMMON STOCKS (44.9%)* cont. Shares ValueConsumer cyclicals cont.Carnival Corp. 30,100 $1,919,477Crown, Ltd. (Australia) 31,310 309,838Dai Nippon Printing Co., Ltd. (Japan) 5,300 123,241Daimler AG (Registered Shares) (Germany) 545 34,391Dollar General Corp. 8,900 972,770Dollar Tree, Inc. † 6,900 562,695Ecolab, Inc. 154 24,144Extended Stay America, Inc. (Units) 23,100 467,313Fiat Chrysler Automobiles NV (Italy) † 35,524 624,617FleetCor Technologies, Inc. † 5,900 1,344,256Ford Motor Co. 245,532 2,271,171Galaxy Entertainment Group, Ltd. (Hong Kong) 123,000 780,107Hermes International (France) 1,711 1,133,530Hilton Worldwide Holdings, Inc. 19,100 1,542,898Home Depot, Inc. (The) 38,601 7,996,197Hyatt Hotels Corp. Class A 6,281 499,905InterContinental Hotels Group PLC (United Kingdom) 269 16,759ISS A/S (Denmark) 411 14,462John Wiley & Sons, Inc. Class A 82 4,969KAR Auction Services, Inc. 11,800 704,342Kering SA (France) 571 306,089Kimberly-Clark Corp. 740 84,094Kingfisher PLC (United Kingdom) 13,640 45,868Las Vegas Sands Corp. 23,000 1,364,590Liberty SiriusXM Group Class A † 7,500 325,800Lowe’s Cos., Inc. 1,019 117,002lululemon athletica, Inc. (Canada) † 15,700 2,551,093Madison Square Garden Co. (The) Class A † 1,500 472,980Marriott International, Inc./MD Class A 40 5,281Mastercard, Inc. Class A 6,300 1,402,443Mazda Motor Corp. (Japan) 4,800 57,624Michael Kors Holdings, Ltd. † 25,187 1,726,821Moncler SpA (Italy) 12,539 540,117Namco Bandai Holdings, Inc. (Japan) 2,000 77,715News Corp. Class A 25,146 331,676Next PLC (United Kingdom) 1,401 100,324Nissan Motor Co., Ltd. (Japan) 7,000 65,521Owens Corning 15,200 824,904Pearson PLC (United Kingdom) 42,081 488,151Peugeot SA (France) 35,406 954,942ProSiebenSat.1 Media SE (Germany) 21,477 557,816PVH Corp. 13,257 1,914,311Ralph Lauren Corp. 3,200 440,160Randstad Holding NV (Netherlands) 4,459 238,044Ross Stores, Inc. 28,262 2,800,764Royal Caribbean Cruises, Ltd. 16,600 2,157,004RTL Group SA (Belgium) 2,545 181,577Scotts Miracle-Gro Co. (The) Class A 109 8,582Secom Co., Ltd. (Japan) 200 16,303
Dynamic Asset Allocation Conservative Fund 27
COMMON STOCKS (44.9%)* cont. Shares ValueConsumer cyclicals cont.ServiceMaster Global Holdings, Inc. † 7,800 $483,834Signet Jewelers, Ltd. S 11,000 725,230Sony Corp. (Japan) 16,100 987,085Suzuki Motor Corp. (Japan) 2,440 139,760Tapestry, Inc. 4,100 206,107Taylor Wimpey PLC (United Kingdom) 379,660 850,151Tiffany & Co. 15,600 2,011,932TJX Cos., Inc. (The) 1,129 126,471Toll Brothers, Inc. 22,600 746,478Total System Services, Inc. 11,000 1,086,140Toyota Motor Corp. (Japan) 28,400 1,773,438TUI AG (Germany) 36,772 705,988Twenty-First Century Fox, Inc. 20,300 930,146VF Corp. 16,900 1,579,305Visteon Corp. † 5,000 464,500Volvo AB (Sweden) 58,534 1,034,689Walt Disney Co. (The) 33,052 3,865,101Wolters Kluwer NV (Netherlands) 2,659 165,723Worldpay, Inc. Class A † 508 51,445Wyndham Destinations, Inc. 27,700 1,201,072Yamada Denki Co., Ltd. (Japan) 1,400 7,085
71,386,833Consumer staples (3.5%)Altria Group, Inc. 454 27,381Ashtead Group PLC (United Kingdom) 13,202 419,347Associated British Foods PLC (United Kingdom) 16,868 503,474Bright Horizons Family Solutions, Inc. † 33 3,889Carlsberg A/S Class B (Denmark) 579 69,449Coca-Cola Amatil, Ltd. (Australia) 51,973 366,670Coca-Cola Co. (The) 94,800 4,378,812Coca-Cola European Partners PLC (United Kingdom) 1,276 58,020ConAgra Foods, Inc. 31,400 1,066,658Constellation Brands, Inc. Class A 481 103,713Estee Lauder Cos., Inc. (The) Class A 14,500 2,107,140Henkel AG & Co. KGaA (Preference) (Germany) 582 68,283Hershey Co. (The) 13,684 1,395,768Imperial Brands PLC (United Kingdom) 33,193 1,155,575Ingredion, Inc. 5,241 550,095ITOCHU Corp. (Japan) 55,100 1,008,695J Sainsbury PLC (United Kingdom) 192,760 808,501Japan Tobacco, Inc. (Japan) 2,600 67,872Kao Corp. (Japan) 5,200 419,863Keurig Dr Pepper, Inc. 7,300 169,141Kirin Holdings Co., Ltd. (Japan) 8,100 207,526Koninklijke Ahold Delhaize NV (Netherlands) 43,572 999,139L’Oreal SA (France) 2,797 674,497Liberty Expedia Holdings, Inc. Class A † 111 5,221LKQ Corp. † 18,800 595,396ManpowerGroup, Inc. 7,500 644,700
28 Dynamic Asset Allocation Conservative Fund
COMMON STOCKS (44.9%)* cont. Shares ValueConsumer staples cont.Marine Harvest ASA (Norway) 17,929 $415,360McDonald’s Corp. 740 123,795Molson Coors Brewing Co. Class B 17,400 1,070,100Mondelez International, Inc. Class A 69,200 2,972,832Monster Beverage Corp. † 784 45,692Nestle SA (Switzerland) 8,807 734,246PepsiCo, Inc. 48,173 5,385,741Pinnacle Foods, Inc. 10,594 686,597Pola Orbis Holdings, Inc. (Japan) 8,900 325,075Procter & Gamble Co. (The) 14,436 1,201,508Swedish Match AB (Sweden) 12,569 643,484Sysco Corp. 35,639 2,610,557Unicharm Corp. (Japan) 500 16,538US Foods Holding Corp. † 1,017 31,344Walgreens Boots Alliance, Inc. 39,800 2,901,420WH Group, Ltd. (Hong Kong) 312,000 219,602WM Morrison Supermarkets PLC (United Kingdom) 40,286 136,208Woolworths Group, Ltd. (Australia) 40,736 826,844
38,221,768Energy (2.4%)ConocoPhillips 55,600 4,303,440Equinor ASA (Norway) 40,581 1,144,321Exxon Mobil Corp. 1,259 107,040Halcon Resources Corp. † 2,658 11,881Halliburton Co. 69,200 2,804,676Marathon Petroleum Corp. 956 76,451MWO Holdings, LLC (Units) F 42 3,402Nine Point Energy F 540 7,798Occidental Petroleum Corp. 45,664 3,752,211OMV AG (Austria) 8,014 450,252ONEOK, Inc. 16,200 1,098,198PBF Energy, Inc. Class A 20,300 1,013,173Phillips 66 288 32,463Repsol SA (Spain) 56,211 1,120,253Royal Dutch Shell PLC Class A (United Kingdom) 1,399 48,075Royal Dutch Shell PLC Class B (United Kingdom) 25,267 885,569SandRidge Energy, Inc. † 1,404 15,261TOTAL SA (France) 30,704 1,990,635Valero Energy Corp. 44,882 5,105,328Williams Cos., Inc. (The) 79,000 2,148,010Woodside Petroleum, Ltd. (Australia) 3,142 87,623
26,206,060Financials (8.1%)3i Group PLC (United Kingdom) 45,017 552,251ABN AMRO Group NV GDR (Netherlands) 34,502 939,373Aegon NV (Netherlands) 14,757 95,743Ageas (Belgium) 1,294 69,576AGNC Investment Corp. R 12,050 224,492Allianz SE (Germany) 7,071 1,576,279
Dynamic Asset Allocation Conservative Fund 29
COMMON STOCKS (44.9%)* cont. Shares ValueFinancials cont.Allstate Corp. (The) 749 $73,926Ally Financial, Inc. 38,800 1,026,260American Express Co. 1,121 119,375American Financial Group, Inc. 3,400 377,298American Homes 4 Rent R 20,713 453,408Ameriprise Financial, Inc. 12,600 1,860,516Annaly Capital Management, Inc. R 3,501 35,815Apartment Investment & Management Co. Class A R 9,200 405,996Apple Hospitality REIT, Inc. R 14,779 258,485Assurant, Inc. 7,000 755,650Athene Holding, Ltd. Class A † 10,800 557,928Aviva PLC (United Kingdom) 163,716 1,044,532Axis Capital Holdings, Ltd. 4,000 230,840Bank of Montreal (Canada) 1,034 85,288Bank of Nova Scotia (The) (Canada) 1,411 84,104BB&T Corp. 98 4,757Berkshire Hathaway, Inc. Class B † 16 3,426BGC Partners, Inc. Class A 26,600 314,412Brandywine Realty Trust R 16,882 265,385Brixmor Property Group, Inc. R 34,100 597,091Broadridge Financial Solutions, Inc. 7,115 938,824Camden Property Trust R 240 22,457Canadian Imperial Bank of Commerce (Canada) 853 79,928Capital One Financial Corp. 20,100 1,908,093CBRE Group, Inc. Class A † 16,500 727,650Cheung Kong Property Holdings, Ltd. (Hong Kong) 145,500 1,091,945Chimera Investment Corp. R 891 16,154CIT Group, Inc. 20,600 1,063,166Citigroup, Inc. 119,500 8,572,930CME Group, Inc. 282 47,999CoreLogic, Inc. † 4,490 221,851Corporate Office Properties Trust R 322 9,605Daiwa Securities Group, Inc. (Japan) 20,000 121,669Deutsche Boerse AG (Germany) 1,315 176,191Discover Financial Services 21,800 1,666,610DNB ASA (Norway) 41,318 869,385Douglas Emmett, Inc. R 6,900 260,268Duke Realty Corp. R 21,511 610,267E*Trade Financial Corp. † 39,700 2,079,883Empire State Realty Trust, Inc. Class A R 11,335 188,274EPR Properties R 304 20,797Equity Commonwealth † R 237 7,605Equity Lifestyle Properties, Inc. R 3,300 318,285Equity Residential Trust R 20,241 1,341,169Eurazeo SA (France) 722 56,877Fifth Third Bancorp 56,500 1,577,480First Hawaiian, Inc. 9,900 268,884Gaming and Leisure Properties, Inc. R 9,281 327,155Goldman Sachs Group, Inc. (The) 7,500 1,681,800
30 Dynamic Asset Allocation Conservative Fund
COMMON STOCKS (44.9%)* cont. Shares ValueFinancials cont.Hang Seng Bank, Ltd. (Hong Kong) 30,900 $839,173Hartford Financial Services Group, Inc. (The) 28,000 1,398,880HCP, Inc. R 33,000 868,560Henderson Land Development Co., Ltd. (Hong Kong) 53,000 266,410Highwoods Properties, Inc. R 8,035 379,734Hong Kong Exchanges and Clearing, Ltd. (Hong Kong) 6,700 191,713HSBC Holdings PLC (United Kingdom) 21,396 186,791Hudson Pacific Properties, Inc. R 8,915 291,699Intercontinental Exchange, Inc. 116 8,687Japan Post Bank Co., Ltd. (Japan) 4,900 57,919Jones Lang LaSalle, Inc. 3,100 447,392JPMorgan Chase & Co. 101,078 11,405,642Kerry Properties, Ltd. (Hong Kong) 44,500 150,923Legal & General Group PLC (United Kingdom) 302,744 1,034,632Liberty Property Trust R 8,779 370,913Life Storage, Inc. R 2,800 266,448Lincoln National Corp. 14,400 974,304Lloyds Banking Group PLC (United Kingdom) 285,473 220,535Loews Corp. 21,367 1,073,264London Stock Exchange Group PLC (United Kingdom) 4,058 242,563Macquarie Group, Ltd. (Australia) 11,674 1,063,595Mediobanca Banca di Credito Finanziario SpA (Italy) 5,577 55,712MetLife, Inc. 39,500 1,845,440MFA Financial, Inc. R 1,142 8,394Mizuho Financial Group, Inc. (Japan) 640,225 1,116,816Morgan Stanley 63,300 2,947,881Muenchener Rueckversicherungs-Gesellschaft AG in Muenchen (Germany) 2,047 453,350National Bank of Canada (Canada) 1,450 72,419New Residential Investment Corp. R 20,509 365,470New World Development Co., Ltd. (Hong Kong) 12,000 16,371Nomura Real Estate Holdings, Inc. (Japan) 8,500 171,616Northern Trust Corp. 6,800 694,484Old Republic International Corp. 1,091 24,417ORIX Corp. (Japan) 63,000 1,021,352Outfront Media, Inc. R 9,600 191,520Paramount Group, Inc. R 15,100 227,859Park Hotels & Resorts, Inc. R 18,393 603,658Partners Group Holding AG (Switzerland) 1,078 855,129Persimmon PLC (United Kingdom) 30,211 931,267Piedmont Office Realty Trust, Inc. Class A R 411 7,780PNC Financial Services Group, Inc. (The) 736 100,236Popular, Inc. (Puerto Rico) 4,800 246,000Principal Financial Group, Inc. 12,100 708,939Prudential Financial, Inc. 21,700 2,198,644Rayonier, Inc. R 6,800 229,908Regions Financial Corp. 118,000 2,165,300Reinsurance Group of America, Inc. 115 16,624RenaissanceRe Holdings, Ltd. 2,400 320,592
Dynamic Asset Allocation Conservative Fund 31
COMMON STOCKS (44.9%)* cont. Shares ValueFinancials cont.Resona Holdings, Inc. (Japan) 170,700 $958,967Santander Consumer USA Holdings, Inc. 20,300 406,812Scentre Group (Australia) R 64,401 184,812Schroders PLC (United Kingdom) 3,548 143,127Senior Housing Properties Trust R 13,000 228,280SL Green Realty Corp. R 8,500 829,005Spirit MTA REIT † R 168 1,935Spirit Realty Capital, Inc. R 70,087 564,901Starwood Property Trust, Inc. R 18,141 390,394Stockland (Units) (Australia) R 20,247 60,738Sumitomo Mitsui Financial Group, Inc. (Japan) 30,593 1,234,813Sumitomo Mitsui Trust Holdings, Inc. (Japan) 7,500 308,660Sun Communities, Inc. R 3,600 365,544Sun Hung Kai Properties, Ltd. (Hong Kong) 23,000 334,936SunTrust Banks, Inc. 598 39,940Swedbank AB Class A (Sweden) 38,639 957,780Swire Properties, Ltd. (Hong Kong) 23,000 87,113Swiss Prime Site AG (Switzerland) 296 25,230Swiss Re AG (Switzerland) 731 67,484Synovus Financial Corp. 6,700 306,793Toronto-Dominion Bank (Canada) 976 59,309Travelers Cos., Inc. (The) 344 44,620Two Harbors Investment Corp. R 872 13,019U.S. Bancorp 41,158 2,173,554UDR, Inc. R 567 22,924United Overseas Bank, Ltd. (Singapore) 26,600 526,921Vornado Realty Trust R 10,700 781,100WP Carey, Inc. R 2,900 186,499Zurich Insurance Group AG (Switzerland) 139 43,935
88,971,507Government (—%)Poste Italiane SpA (Italy) 1,289 10,300
10,300Health care (5.9%)AbbVie, Inc. 19,665 1,859,916ABIOMED, Inc. † 5,100 2,293,725Akorn, Inc. † 614 7,970Alfresa Holdings Corp. (Japan) 12,600 337,124Allergan PLC 3,160 601,917Amgen, Inc. 16,382 3,395,825Anthem, Inc. 15,288 4,189,676Astellas Pharma, Inc. (Japan) 67,400 1,175,733Baxter International, Inc. 27,674 2,133,389Biogen, Inc. † 3,422 1,209,027Boston Scientific Corp. † 56,561 2,177,599Bristol-Myers Squibb Co. 54,988 3,413,655Celgene Corp. † 9,941 889,620Centene Corp. † 11,500 1,664,970Charles River Laboratories International, Inc. † 4,776 642,563
32 Dynamic Asset Allocation Conservative Fund
COMMON STOCKS (44.9%)* cont. Shares ValueHealth care cont.Cigna Corp. 13,800 $2,873,850Coloplast A/S Class B (Denmark) 576 58,901Concordia International Corp. (Canada) † 214 4,309Dentsply Sirona, Inc. 25,800 973,692Eli Lilly & Co. 34,850 3,739,754Fresenius Medical Care AG & Co., KGaA (Germany) 9,904 1,018,585Gilead Sciences, Inc. 24,766 1,912,183GlaxoSmithKline PLC (United Kingdom) 79,413 1,590,694Hill-Rom Holdings, Inc. 2,800 264,320Humana, Inc. 8,178 2,768,417Intuitive Surgical, Inc. † 12 6,888Ipsen SA (France) 1,740 292,529Johnson & Johnson 35,431 4,895,501Koninklijke Philips NV (Netherlands) 1,750 79,719McKesson Corp. 15,500 2,056,075Medipal Holdings Corp. (Japan) 14,100 294,236Merck & Co., Inc. 54,599 3,873,253Mettler-Toledo International, Inc. † 8 4,872Mitsubishi Tanabe Pharma Corp. (Japan) 3,200 53,512Novartis AG (Switzerland) 23,742 2,041,802PerkinElmer, Inc. 113 10,992Pfizer, Inc. 49,462 2,179,790Roche Holding AG (Switzerland) 8,425 2,041,007Shionogi & Co., Ltd. (Japan) 15,000 980,109Siemens Healthineers AG (Germany) † 4,638 203,955Sonic Healthcare, Ltd. (Australia) 623 11,218Taisho Pharmaceutical Holdings Co., Ltd. (Japan) 400 48,900Thermo Fisher Scientific, Inc. 41 10,007UCB SA (Belgium) 7,523 676,057UnitedHealth Group, Inc. 197 52,410Vertex Pharmaceuticals, Inc. † 5,366 1,034,243Waters Corp. † 1,500 292,020WellCare Health Plans, Inc. † 4,200 1,346,058Zoetis, Inc. 13,757 1,259,591
64,942,158Technology (9.6%)Agilent Technologies, Inc. 29,100 2,052,714Alphabet, Inc. Class A † 13,705 16,542,968Amadeus IT Holding SA Class A (Spain) 12,086 1,122,877Amdocs, Ltd. 11,804 778,828Apple, Inc. 41,622 9,395,750Applied Materials, Inc. 24,945 964,124Avaya Holdings Corp. † 4,677 103,549Black Knight, Inc. † 8,100 420,795Brother Industries, Ltd. (Japan) 6,400 126,400CA, Inc. 21,100 931,565Cadence Design Systems, Inc. † 19,100 865,612Capgemini SE (France) 5,008 630,296CDK Global, Inc. 411 25,712
Dynamic Asset Allocation Conservative Fund 33
COMMON STOCKS (44.9%)* cont. Shares ValueTechnology cont.CGI Group, Inc. Class A (Canada) † 128 $8,253Check Point Software Technologies, Ltd. (Israel) † 2,715 319,474Cisco Systems, Inc. 185,573 9,028,126Cognizant Technology Solutions Corp. Class A 29,136 2,247,842Computershare, Ltd. (Australia) 4,800 69,220Corning, Inc. 411 14,508Dell Technologies, Inc. Class V † 14,608 1,418,729Dun & Bradstreet Corp. (The) 5,200 741,052eBay, Inc. † 2,673 88,262F5 Networks, Inc. † 8,410 1,677,122Facebook, Inc. Class A † 27,061 4,450,452Fidelity National Information Services, Inc. 12,545 1,368,283Fiserv, Inc. † 642 52,888Fortinet, Inc. † 25,100 2,315,977Fujitsu, Ltd. (Japan) 500 35,628Genpact, Ltd. 341 10,438Harris Corp. 343 58,039Hoya Corp. (Japan) 17,800 1,057,472HP, Inc. 85,074 2,192,357IBM Corp. 21,200 3,205,652Intuit, Inc. 16,228 3,690,247Jabil, Inc. 10,500 284,340Keysight Technologies, Inc. † 10,700 709,196KLA-Tencor Corp. 15,100 1,535,821Leidos Holdings, Inc. 6,200 428,792Maxim Integrated Products, Inc. 625 35,244Microsoft Corp. 54,576 6,241,857MSCI, Inc. 4,400 780,604NEC Corp. (Japan) 2,200 60,799NetApp, Inc. 31,156 2,675,989Nexon Co., Ltd. (Japan) † 9,800 128,085NTT Data Corp. (Japan) 63,600 880,503Nuance Communications, Inc. † 33,200 575,024nVent Electric PLC (United Kingdom) 12,500 339,500NVIDIA Corp. 30,000 8,430,600NXP Semiconductors NV † 31 2,651Oracle Corp. 109,500 5,645,820Otsuka Corp. (Japan) 1,400 52,244Palo Alto Networks, Inc. † 10,200 2,297,652Red Hat, Inc. † 13,988 1,906,285Rockwell Automation, Inc. 8,400 1,575,168Synopsys, Inc. † 10,065 992,510Texas Instruments, Inc. 15,941 1,710,310Zebra Technologies Corp. Class A † 3,300 583,539
105,883,744Transportation (0.8%)Aena SME SA (Spain) 4,515 783,700Central Japan Railway Co. (Japan) 5,200 1,082,838Copa Holdings SA Class A (Panama) 3,000 239,520
34 Dynamic Asset Allocation Conservative Fund
COMMON STOCKS (44.9%)* cont. Shares ValueTransportation cont.Delta Air Lines, Inc. 53,000 $3,064,990easyJet PLC (United Kingdom) 34,722 594,673Expeditors International of Washington, Inc. 11,000 808,830International Consolidated Airlines Group SA (Spain) 106,723 917,187Japan Airlines Co., Ltd. (Japan) 12,100 434,927Kansas City Southern 9,751 1,104,593Kyushu Railway Co. (Japan) 6,600 200,986Norfolk Southern Corp. 491 88,626
9,320,870Utilities and power (1.6%)AES Corp. 53,900 754,600Ameren Corp. 14,800 935,656American Electric Power Co., Inc. 12,052 854,246Atmos Energy Corp. 4,000 375,640CenterPoint Energy, Inc. 34,700 959,455CLP Holdings, Ltd. (Hong Kong) 74,000 866,351CMS Energy Corp. 22,000 1,078,000Duke Energy Corp. 897 71,778Endesa SA (Spain) 13,762 297,358Enel SpA (Italy) 196,315 1,005,634ENGIE SA (France) 24,491 360,133Eni SpA (Italy) 63,434 1,199,171Entergy Corp. 23,400 1,898,442Evergy, Inc. 8,900 488,788Exelon Corp. 1,116 48,725HK Electric Investments & HK Electric Investments, Ltd. (Units) (Hong Kong) 72,000 72,659Kinder Morgan, Inc. 123,404 2,187,953NRG Energy, Inc. 42,700 1,596,980OGE Energy Corp. 15,900 577,488Pinnacle West Capital Corp. 7,200 570,096SSE PLC (United Kingdom) 253 3,779Texas Competitive Electric Holdings Co., LLC/TCEH Finance, Inc. (Rights) 2,297 1,585UGI Corp. 16,450 912,646
17,117,163Total common stocks (cost $416,648,567) $493,615,452
amount ValueTransportation (0.1%)CSX Corp. sr. unsec. unsub. notes 4.10%, 3/15/44 $370,000 $349,300Delta Air Lines, Inc. sr. notes Ser. A, 7.75%, 12/17/19 45,109 47,120FedEx Corp. company guaranty sr. unsec. unsub. notes 2.625%, 8/1/22 75,000 72,640Penske Truck Leasing Co. LP/PTL Finance Corp. 144A sr. unsec. bonds 3.40%, 11/15/26 210,000 195,476Penske Truck Leasing Co. LP/PTL Finance Corp. 144A sr. unsec. notes 3.90%, 2/1/24 315,000 309,931United Airlines, Inc. Pass-Through Trust pass-through certificates Ser. 07-1, Class A, 6.636%, 7/2/22 63,837 66,733United Airlines, Inc. Pass-Through Trust pass-through certificates Ser. 14-2, Class A, 3.75%, 9/3/26 215,629 213,347Watco Cos., LLC/Watco Finance Corp. 144A company guaranty sr. unsec. notes 6.375%, 4/1/23 153,000 156,060
1,410,607Utilities and power (1.3%)AES Corp./Virginia (The) sr. unsec. notes 5.50%, 4/15/25 440,000 451,000AES Corp./Virginia (The) sr. unsec. notes 4.875%, 5/15/23 20,000 20,125AES Corp./Virginia (The) sr. unsec. notes 4.50%, 3/15/23 45,000 45,113AES Corp./Virginia (The) sr. unsec. unsub. bonds 5.125%, 9/1/27 45,000 45,450American Transmission Systems, Inc. 144A sr. unsec. unsub. bonds 5.00%, 9/1/44 55,000 58,603Appalachian Power Co. sr. unsec. unsub. notes 4.60%, 3/30/21 245,000 251,312Arizona Public Services Co. sr. unsec. notes 4.50%, 4/1/42 60,000 61,715Berkshire Hathaway Energy Co. sr. unsec. bonds 3.80%, 7/15/48 575,000 519,406Calpine Corp. sr. unsec. sub. notes 5.75%, 1/15/25 70,000 61,950Calpine Corp. 144A company guaranty sr. notes 5.25%, 6/1/26 60,000 55,575Calpine Corp. 144A company guaranty sr. sub. notes 5.875%, 1/15/24 10,000 10,050Colorado Interstate Gas Co., LLC company guaranty sr. unsec. notes 6.85%, 6/15/37 25,000 26,939Commonwealth Edison Co. 1st mtge. bonds 5.90%, 3/15/36 208,000 247,722Consolidated Edison Co. of New York, Inc. sr. unsec. notes 7.125%, 12/1/18 402,000 404,996Consolidated Edison Co. of New York, Inc. sr. unsec. unsub. notes 4.20%, 3/15/42 205,000 200,774Consolidated Edison, Inc. sr. unsec. unsub. notes Ser. A, 2.00%, 3/15/20 465,000 456,795Duke Energy Corp. sr. unsec. notes 3.15%, 8/15/27 775,000 720,766Dynegy, Inc. company guaranty sr. unsec. unsub. notes 7.625%, 11/1/24 20,000 21,525Dynegy, Inc. 144A company guaranty sr. unsec. notes 8.125%, 1/30/26 60,000 66,075El Paso Natural Gas Co., LLC company guaranty sr. unsec. unsub. notes 8.375%, 6/15/32 50,000 62,949Electricite de France (EDF) 144A sr. unsec. notes 6.50%, 1/26/19 (France) 245,000 247,860Emera US Finance LP company guaranty sr. unsec. notes 3.55%, 6/15/26 235,000 221,334Enbridge, Inc. sr. unsec. unsub. bonds 4.25%, 12/1/26 (Canada) 640,000 644,062Energy Transfer Equity LP sr. sub. notes 5.875%, 1/15/24 915,000 963,038
Dynamic Asset Allocation Conservative Fund 61
CORPORATE BONDS AND NOTES (24.0%)* cont.Principal
amount ValueUtilities and power cont.Energy Transfer Equity LP sr. sub. notes 5.50%, 6/1/27 $45,000 $46,701Enterprise Products Operating, LLC company guaranty sr. unsec. unsub. bonds 4.25%, 2/15/48 1,175,000 1,106,096FirstEnergy Corp. sr. unsec. unsub. bonds Ser. B, 3.90%, 7/15/27 276,000 268,482FirstEnergy Corp. sr. unsec. unsub. bonds Ser. C, 4.85%, 7/15/47 459,000 466,922FirstEnergy Transmission, LLC 144A sr. unsec. unsub. notes 5.45%, 7/15/44 785,000 856,903GenOn Energy, Inc. sr. unsec. sub. notes 9.875%, 10/15/20 (In default) † 42,000 28,350IPALCO Enterprises, Inc. sr. sub. notes 3.70%, 9/1/24 205,000 198,837Kinder Morgan Energy Partners LP company guaranty sr. unsec. notes 5.40%, 9/1/44 115,000 118,054Kinder Morgan Energy Partners LP company guaranty sr. unsec. notes 3.50%, 3/1/21 505,000 504,260Kinder Morgan Energy Partners LP company guaranty sr. unsec. unsub. notes 3.45%, 2/15/23 210,000 205,944Kinder Morgan, Inc. company guaranty sr. unsec. unsub. notes 3.15%, 1/15/23 1,080,000 1,050,647Kinder Morgan, Inc./DE company guaranty sr. unsec. notes Ser. GMTN, 7.75%, 1/15/32 17,000 21,481MidAmerican Funding, LLC sr. bonds 6.927%, 3/1/29 430,000 525,313Nevada Power Co. mtge. notes 7.125%, 3/15/19 310,000 315,921NextEra Energy Capital Holdings, Inc. company guaranty jr. unsec. sub. FRB 4.80%, 12/1/77 315,000 295,313NRG Energy, Inc. company guaranty sr. unsec. notes 7.25%, 5/15/26 75,000 81,375NRG Energy, Inc. company guaranty sr. unsec. notes 6.625%, 1/15/27 115,000 120,750NRG Energy, Inc. 144A company guaranty sr. unsec. bonds 5.75%, 1/15/28 40,000 40,400NSTAR Electric Co. sr. unsec. unsub. notes 2.375%, 10/15/22 (Canada) 350,000 335,941Oncor Electric Delivery Co., LLC sr. notes 5.30%, 6/1/42 110,000 126,859Oncor Electric Delivery Co., LLC sr. notes 4.10%, 6/1/22 135,000 137,934Oncor Electric Delivery Co., LLC sr. notes 3.75%, 4/1/45 560,000 529,506PPL Capital Funding, Inc. company guaranty sr. unsec. unsub. notes 4.20%, 6/15/22 295,000 299,361PPL Capital Funding, Inc. company guaranty sr. unsec. unsub. notes 3.40%, 6/1/23 15,000 14,735Public Service Electric & Gas Co. sr. notes Ser. MTN, 5.50%, 3/1/40 215,000 252,351Texas Competitive Electric Holdings Co., LLC/TCEH Finance, Inc. escrow company guaranty sr. notes 11.50%, 10/1/20 54,000 405Vistra Operations Co., LLC 144A sr. unsec. notes 5.50%, 9/1/26 125,000 126,406
13,940,381Total corporate bonds and notes (cost $267,787,440) $263,822,761
62 Dynamic Asset Allocation Conservative Fund
U.S. GOVERNMENT AND AGENCY MORTGAGE OBLIGATIONS (18.7%)*
Principal amount Value
U.S. Government Guaranteed Mortgage Obligations (5.4%)Government National Mortgage Association Pass-Through Certificates
4.70%, with due dates from 5/20/67 to 8/20/67 $210,800 $223,0544.629%, 6/20/67 99,440 104,7854.507%, 3/20/67 95,403 99,8154.00%, with due dates from 3/15/46 to 3/20/46 857,695 876,0803.50%, with due dates from 7/20/47 to 11/20/47 58,090,883 57,836,334
59,140,068U.S. Government Agency Mortgage Obligations (13.3%)Federal Home Loan Mortgage Corporation Pass-Through Certificates
4.00%, with due dates from 9/1/45 to 5/1/48 17,672,304 17,856,9983.00%, 2/1/47 1,785,317 1,710,209
Federal National Mortgage Association Pass-Through Certificates6.00%, TBA, 10/1/48 8,000,000 8,648,1254.50%, TBA, 10/1/48 1,000,000 1,031,5634.00%, 1/1/57 951,849 964,1564.00%, TBA, 11/1/48 6,000,000 6,050,1564.00%, TBA, 10/1/48 6,000,000 6,058,1254.00%, 8/1/47 7,392,385 7,474,1063.50%, with due dates from 12/1/47 to 6/1/56 47,469,650 46,751,2573.00%, TBA, 10/1/48 1,000,000 956,7973.00%, with due dates from 12/1/31 to 3/1/47 42,278,201 41,069,5623.00%, TBA, 10/1/33 8,000,000 7,901,875
146,472,929Total U.S. government and agency mortgage obligations (cost $212,042,045) $205,612,997
MORTGAGE-BACKED SECURITIES (3.8%)*Principal
amount ValueAgency collateralized mortgage obligations (0.6%)Bellemeade Re, Ltd. 144A
FRB Ser. 17-1, Class M1, (1 Month US LIBOR + 1.70%), 3.916%, 10/25/27 (Bermuda) $450,909 $451,716FRB Ser. 18-2A, Class M1B, (1 Month US LIBOR + 1.35%), 3.566%, 8/25/28 (Bermuda) 382,000 384,149
Federal Home Loan Mortgage CorporationIFB Ser. 3408, Class EK, ((-4.024 x 1 Month US LIBOR) + 25.79%), 17.108%, 4/15/37 73,952 100,707IFB Ser. 3249, Class PS, ((-3.3 x 1 Month US LIBOR) + 22.28%), 15.152%, 12/15/36 97,401 119,024IFB Ser. 3065, Class DC, ((-3 x 1 Month US LIBOR) + 19.86%), 13.385%, 3/15/35 138,554 167,761IFB Ser. 2990, Class LB, ((-2.556 x 1 Month US LIBOR) + 16.95%), 11.429%, 6/15/34 90,196 100,307Structured Agency Credit Risk Debt FRN Ser. 14-HQ3, Class M3, (1 Month US LIBOR + 4.75%), 6.966%, 10/25/24 278,971 309,359Structured Agency Credit Risk Debt FRN Ser. 15-DNA2, Class M2, (1 Month US LIBOR + 2.60%), 4.816%, 12/25/27 422,742 431,366IFB Ser. 3829, Class AS, IO, ((-1 x 1 Month US LIBOR) + 6.95%), 4.792%, 3/15/41 1,169,902 188,928Structured Agency Credit Risk Debt FRN Ser. 15-HQ1, Class M2, (1 Month US LIBOR + 2.20%), 4.416%, 3/25/25 31,361 31,443
Dynamic Asset Allocation Conservative Fund 63
MORTGAGE-BACKED SECURITIES (3.8%)* cont.Principal
amount ValueAgency collateralized mortgage obligations cont.Federal Home Loan Mortgage Corporation
Ser. 3391, PO, zero %, 4/15/37 $6,351 $5,207Ser. 3300, PO, zero %, 2/15/37 35,728 29,308Ser. 3206, Class EO, PO, zero %, 8/15/36 3,484 2,894Ser. 3326, Class WF, zero %, 10/15/35 W 3,152 2,128
Federal National Mortgage AssociationIFB Ser. 06-62, Class PS, ((-6 x 1 Month US LIBOR) + 39.90%), 26.605%, 7/25/36 23,743 37,747IFB Ser. 06-8, Class HP, ((-3.667 x 1 Month US LIBOR) + 24.57%), 16.442%, 3/25/36 90,680 126,927IFB Ser. 05-75, Class GS, ((-3 x 1 Month US LIBOR) + 20.25%), 13.603%, 8/25/35 37,225 44,789IFB Ser. 05-106, Class JC, ((-3.101 x 1 Month US LIBOR) + 20.12%), 13.253%, 12/25/35 33,636 40,023IFB Ser. 05-83, Class QP, ((-2.6 x 1 Month US LIBOR) + 17.39%), 11.633%, 11/25/34 16,689 18,489Connecticut Avenue Securities FRB Ser. 16-C02, Class 1M2, (1 Month US LIBOR + 6.00%), 8.216%, 9/25/28 320,000 375,870Connecticut Avenue Securities FRB Ser. 14-C04, Class 1M2, (1 Month US LIBOR + 4.90%), 7.116%, 11/25/24 642,625 735,454Connecticut Avenue Securities FRB Ser. 14-C03, Class 2M2, (1 Month US LIBOR + 2.90%), 5.116%, 7/25/24 288,052 306,906Connecticut Avenue Securities FRB Ser. 16-C05, Class 2M1, (1 Month US LIBOR + 1.35%), 3.566%, 1/25/29 56,281 56,432Ser. 07-64, Class LO, PO, zero %, 7/25/37 12,226 10,700Ser. 07-14, Class KO, PO, zero %, 3/25/37 17,741 14,179Ser. 06-125, Class OX, PO, zero %, 1/25/37 2,035 1,642Ser. 06-84, Class OT, PO, zero %, 9/25/36 2,440 1,971
Government National Mortgage AssociationSer. 17-162, Class QI, IO, 5.00%, 10/20/47 1,540,172 338,838Ser. 10-9, Class UI, IO, 5.00%, 1/20/40 277,890 62,887Ser. 10-9, Class QI, IO, 4.50%, 1/20/40 59,866 12,344Ser. 14-116, Class IL, IO, 4.00%, 8/20/44 2,935,766 517,282IFB Ser. 13-99, Class AS, IO, ((-1 x 1 Month US LIBOR) + 6.05%), 3.885%, 6/20/43 1,193,593 210,107Ser. 16-123, Class LI, IO, 3.50%, 3/20/44 2,617,824 328,668Ser. 13-14, IO, 3.50%, 12/20/42 762,984 111,258Ser. 12-141, Class WI, IO, 3.50%, 11/20/41 1,152,388 141,974Ser. 15-124, Class NI, IO, 3.50%, 6/20/39 1,302,849 106,312Ser. 15-124, Class DI, IO, 3.50%, 1/20/38 1,030,375 113,135Ser. 16-H16, Class EI, IO, 2.206%, 6/20/66 W 3,285,344 367,630Ser. 15-H26, Class EI, IO, 1.72%, 10/20/65 W 1,754,304 151,572Ser. 15-H25, Class BI, IO, 1.539%, 10/20/65 W 3,023,376 273,011Ser. 06-36, Class OD, PO, zero %, 7/16/36 2,223 1,784
6,832,228Commercial mortgage-backed securities (2.1%)Banc of America Commercial Mortgage Trust 144A
FRB Ser. 04-4, Class XC, IO, 0.086%, 7/10/42 W 18,136 —FRB Ser. 07-5, Class XW, IO, zero %, 2/10/51 W 2,111,685 21
64 Dynamic Asset Allocation Conservative Fund
MORTGAGE-BACKED SECURITIES (3.8%)* cont.Principal
amount ValueCommercial mortgage-backed securities cont.Banc of America Merrill Lynch Commercial Mortgage, Inc. 144A
FRB Ser. 04-5, Class XC, IO, 0.583%, 11/10/41 W $245,397 $892FRB Ser. 05-1, Class XW, IO, zero %, 11/10/42 W 1,118,686 11
Bear Stearns Commercial Mortgage Securities Trust FRB Ser. 04-PR3I, Class X1, IO, zero %, 2/11/41 W 50,142 1Bear Stearns Commercial Mortgage Securities Trust 144A
FRB Ser. 06-PW11, Class B, 5.283%, 3/11/39 W 157,789 102,563FRB Ser. 06-PW11, Class C, 5.283%, 3/11/39 (In default) † W 191,000 19,100FRB Ser. 06-PW14, Class X1, IO, 0.506%, 12/11/38 W 230,695 3,391
CFCRE Commercial Mortgage Trust 144AFRB Ser. 11-C2, Class D, 5.947%, 12/15/47 W 129,000 132,225FRB Ser. 11-C2, Class E, 5.947%, 12/15/47 W 411,000 399,078
FRB Ser. 13-GC11, Class D, 4.567%, 4/10/46 W 374,000 367,163FRB Ser. 06-C5, Class XC, IO, zero %, 10/15/49 W 5,914,009 59
COBALT CMBS Commercial Mortgage Trust FRB Ser. 07-C3, Class AJ, 6.015%, 5/15/46 W 176,274 178,345COMM Mortgage Pass-Through Certificates FRB Ser. 14-CR14, Class XA, IO, 0.874%, 2/10/47 W 14,834,255 364,478COMM Mortgage Trust
FRB Ser. 14-CR18, Class C, 4.889%, 7/15/47 W 246,000 245,756Ser. 13-CR11, Class AM, 4.715%, 8/10/50 W 233,000 240,927Ser. 13-CR13, Class AM, 4.449%, 11/10/46 W 275,000 283,793FRB Ser. 12-CR1, Class XA, IO, 2.048%, 5/15/45 W 3,383,187 187,125FRB Ser. 13-LC13, Class XA, IO, 1.384%, 8/10/46 W 5,976,383 242,044FRB Ser. 14-UBS4, Class XA, IO, 1.337%, 8/10/47 W 4,418,678 209,906FRB Ser. 14-CR18, Class XA, IO, 1.308%, 7/15/47 W 3,521,943 135,736FRB Ser. 14-CR17, Class XA, IO, 1.241%, 5/10/47 W 4,743,550 186,782FRB Ser. 14-UBS6, Class XA, IO, 1.111%, 12/10/47 W 4,714,019 191,007
COMM Mortgage Trust 144AFRB Ser. 10-C1, Class D, 6.308%, 7/10/46 W 476,000 484,925FRB Ser. 13-CR9, Class D, 4.399%, 7/10/45 W 337,000 288,473FRB Ser. 06-C8, Class XS, IO, 0.641%, 12/10/46 W 2,195,090 80
Credit Suisse First Boston Mortgage Securities Corp. 144A FRB Ser. 03-C3, Class AX, IO, 2.221%, 5/15/38 W 116,654 236CSAIL Commercial Mortgage Trust FRB Ser. 15-C1, Class C, 4.44%, 4/15/50 W 678,000 672,943DBUBS Mortgage Trust 144A FRB Ser. 11-LC3A, Class D, 5.516%, 8/10/44 W 1,128,000 1,161,904GMAC Commercial Mortgage Securities, Inc. Trust 144A FRB Ser. 05-C1, Class X1, IO, 1.175%, 5/10/43 W 71,814 6GS Mortgage Securities Trust
FRB Ser. 14-GC22, Class C, 4.846%, 6/10/47 W 895,000 890,146FRB Ser. 13-GC10, Class XA, IO, 1.667%, 2/10/46 W 6,491,253 399,861
GS Mortgage Securities Trust 144AFRB Ser. 10-C1, Class D, 6.197%, 8/10/43 W 682,000 687,430FRB Ser. 12-GC6, Class D, 5.84%, 1/10/45 W 97,000 95,788
Ser. 11-GC5, Class AS, 5.209%, 8/10/44 W $301,000 $313,571FRB Ser. 12-GC6, Class E, 5.00%, 1/10/45 W 478,000 387,231
JPMBB Commercial Mortgage Securities TrustFRB Ser. 14-C22, Class C, 4.71%, 9/15/47 W 281,000 272,201FRB Ser. 14-C19, Class XA, IO, 1.278%, 4/15/47 W 6,840,339 127,654FRB Ser. 14-C25, Class XA, IO, 1.097%, 11/15/47 W 4,136,607 161,220
JPMorgan Chase Commercial Mortgage Securities TrustFRB Ser. 05-LDP5, Class F, 5.896%, 12/15/44 W 269,887 266,747FRB Ser. 13-LC11, Class C, 3.958%, 4/15/46 W 296,000 289,511FRB Ser. 13-LC11, Class XA, IO, 1.413%, 4/15/46 W 3,103,563 164,799FRB Ser. 06-LDP8, Class X, IO, 0.286%, 5/15/45 W 2,521,641 3,411
JPMorgan Chase Commercial Mortgage Securities Trust 144AFRB Ser. 12-C6, Class E, 5.312%, 5/15/45 W 553,000 488,697FRB Ser. 13-C16, Class D, 5.177%, 12/15/46 W 206,000 205,968FRB Ser. 12-LC9, Class D, 4.518%, 12/15/47 W 119,000 117,497FRB Ser. 05-CB12, Class X1, IO, 0.404%, 9/12/37 W 621,967 832FRB Ser. 06-LDP6, Class X1, IO, zero %, 4/15/43 W 188,411 2
LB-UBS Commercial Mortgage Trust 144A FRB Ser. 05-C7, Class XCL, IO, 0.537%, 11/15/40 W 466,521 1,282LSTAR Commercial Mortgage Trust 144A FRB Ser. 15-3, Class B, 3.217%, 4/20/48 W 672,000 616,271Merrill Lynch Mortgage Trust 144A
FRB Ser. 04-KEY2, Class XC, IO, 1.081%, 8/12/39 W 188,458 132FRB Ser. 05-MCP1, Class XC, IO, 0.001%, 6/12/43 W 247,311 7
Mezz Cap Commercial Mortgage Trust 144AFRB Ser. 05-C3, Class X, IO, 7.137%, 5/15/44 W 2,832 407FRB Ser. 06-C4, Class X, IO, 6.641%, 7/15/45 W 62,396 1,875FRB Ser. 07-C5, Class X, IO, 6.194%, 12/15/49 W 252,736 158
Morgan Stanley Bank of America Merrill Lynch TrustFRB Ser. 14-C17, Class C, 4.614%, 8/15/47 W 322,000 312,016FRB Ser. 13-C7, Class C, 4.255%, 2/15/46 W 300,000 295,333Ser. 12-C6, Class AS, 3.476%, 11/15/45 647,000 643,123FRB Ser. 14-C17, Class XA, IO, 1.349%, 8/15/47 W 4,457,785 174,001
Morgan Stanley Bank of America Merrill Lynch Trust 144A FRB Ser. 12-C6, Class D, 4.726%, 11/15/45 W 265,000 265,745Morgan Stanley Capital I Trust Ser. 07-HQ11, Class C, 5.558%, 2/12/44 W 83,202 20,800Morgan Stanley Capital I Trust 144A FRB Ser. 11-C3, Class D, 5.326%, 7/15/49 W 206,000 207,447TIAA Real Estate CDO, Ltd. 144A Ser. 03-1A, Class E, 8.00%, 12/28/38 357,873 29,882UBS Commercial Mortgage Trust FRB Ser. 17-C7, Class XA, IO, 1.226%, 12/15/50 W 3,360,708 239,155UBS-Barclays Commercial Mortgage Trust 144A
FRB Ser. 12-C2, Class D, 5.05%, 5/10/63 W 319,000 297,524FRB Ser. 12-C4, Class XA, IO, 1.792%, 12/10/45 W 952,306 50,310FRB Ser. 12-C2, Class XA, IO, 1.488%, 5/10/63 W 13,002,353 523,845
Wachovia Bank Commercial Mortgage Trust FRB Ser. 05-C21, Class D, 5.417%, 10/15/44 W 269,867 267,279
66 Dynamic Asset Allocation Conservative Fund
MORTGAGE-BACKED SECURITIES (3.8%)* cont.Principal
amount ValueCommercial mortgage-backed securities cont.Wachovia Bank Commercial Mortgage Trust 144A
FRB Ser. 06-C26, Class XC, IO, 0.045%, 6/15/45 W $356,391 $71FRB Ser. 05-C18, Class XC, IO, zero %, 4/15/42 W 147,841 1
Wells Fargo Commercial Mortgage TrustFRB Ser. 13-LC12, Class AS, 4.423%, 7/15/46 W 251,000 255,782FRB Ser. 13-LC12, Class C, 4.423%, 7/15/46 W 409,000 388,745Ser. 12-LC5, Class AS, 3.539%, 10/15/45 369,000 368,437FRB Ser. 14-LC16, Class XA, IO, 1.498%, 8/15/50 W 4,940,227 251,458FRB Ser. 16-LC25, Class XA, IO, 1.221%, 12/15/59 W 3,418,186 190,903
Wells Fargo Commercial Mortgage Trust 144A FRB Ser. 13-LC12, Class D, 4.423%, 7/15/46 W 507,000 443,003WF-RBS Commercial Mortgage Trust
Ser. 13-C18, Class AS, 4.387%, 12/15/46 W 629,000 642,951Ser. 13-UBS1, Class AS, 4.306%, 3/15/46 W 218,000 220,472Ser. 12-C8, Class AS, 3.66%, 8/15/45 358,000 359,640Ser. 13-C12, Class AS, 3.56%, 3/15/48 275,000 273,251Ser. 13-C11, Class AS, 3.311%, 3/15/45 164,000 163,616
WF-RBS Commercial Mortgage Trust 144AFRB Ser. 11-C3, Class D, 5.865%, 3/15/44 W 682,000 603,884FRB Ser. 11-C5, Class C, 5.862%, 11/15/44 W 241,000 251,468FRB Ser. 11-C5, Class E, 5.862%, 11/15/44 W 911,000 901,932FRB Ser. 11-C2, Class D, 5.839%, 2/15/44 W 755,000 746,331Ser. 11-C4, Class E, 5.397%, 6/15/44 W 208,000 195,727FRB Ser. 12-C9, Class D, 4.94%, 11/15/45 W 291,000 275,732FRB Ser. 13-C15, Class D, 4.621%, 8/15/46 W 153,000 131,522FRB Ser. 12-C10, Class XA, IO, 1.716%, 12/15/45 W 2,238,829 117,444FRB Ser. 12-C9, Class XB, IO, 0.844%, 11/15/45 W 6,676,000 172,908
22,168,405Residential mortgage-backed securities (non-agency) (1.1%)BankUnited Trust FRB Ser. 05-1, Class 1A1, (1 Month US LIBOR + 0.30%), 2.516%, 9/25/45 161,187 154,901Citigroup Mortgage Loan Trust, Inc. FRB Ser. 05-2, Class 1A2A, 4.011%, 5/25/35 W 486,031 498,111Countrywide Alternative Loan Trust
FRB Ser. 06-OA10, Class 1A1, (1 Month US LIBOR + 0.96%), 2.805%, 8/25/46 186,138 165,502FRB Ser. 06-OA7, Class 1A2, (1 Month US LIBOR + 0.94%), 2.785%, 6/25/46 606,692 563,918FRB Ser. 05-59, Class 1A1, (1 Month US LIBOR + 0.33%), 2.495%, 11/20/35 515,256 504,250FRB Ser. 06-OA10, Class 4A1, (1 Month US LIBOR + 0.19%), 2.406%, 8/25/46 763,593 645,236FRB Ser. 05-27, Class 1A1, 2.217%, 8/25/35 W 124,667 106,092
Federal Home Loan Mortgage Corporation Structured Agency Credit Risk Debt FRN Ser. 16-HQA2, Class M3, (1 Month US LIBOR + 5.15%), 7.366%, 11/25/28 280,000 332,003Federal National Mortgage Association
Connecticut Avenue Securities FRB Ser. 16-C03, Class 2M2, (1 Month US LIBOR + 5.90%), 8.116%, 10/25/28 931,750 1,078,569Connecticut Avenue Securities FRB Ser. 15-C04, Class 1M2, (1 Month US LIBOR + 5.70%), 7.916%, 4/25/28 1,091,407 1,268,106
Dynamic Asset Allocation Conservative Fund 67
MORTGAGE-BACKED SECURITIES (3.8%)* cont.Principal
amount ValueResidential mortgage-backed securities (non-agency) cont.Federal National Mortgage Association
Connecticut Avenue Securities FRB Ser. 15-C04, Class 2M2, (1 Month US LIBOR + 5.55%), 7.766%, 4/25/28 $1,489,548 $1,690,261Connecticut Avenue Securities FRB Ser. 15-C03, Class 2M2, (1 Month US LIBOR + 5.00%), 7.216%, 7/25/25 233,618 259,944Connecticut Avenue Securities FRB Ser. 15-C01, Class 1M2, (1 Month US LIBOR + 4.30%), 6.516%, 2/25/25 125,283 138,036Connecticut Avenue Securities FRB Ser. 16-C06, Class 1M2, (1 Month US LIBOR + 4.25%), 6.466%, 4/25/29 50,000 56,877Connecticut Avenue Securities FRB Ser. 15-C02, Class 1M2, (1 Month US LIBOR + 4.00%), 6.216%, 5/25/25 247,456 271,760
Long Beach Mortgage Loan Trust FRB Ser. 04-1, Class A2, (1 Month US LIBOR + 0.80%), 3.016%, 2/25/34 455,593 443,168Merrill Lynch Mortgage Investors Trust FRB Ser. 05-A2, Class A2, 3.539%, 2/25/35 W 178,266 181,678Morgan Stanley ABS Capital I, Inc. Trust FRB Ser. 04-HE6, Class M1, (1 Month US LIBOR + 0.83%), 3.041%, 8/25/34 300,028 300,028Morgan Stanley Resecuritization Trust 144A Ser. 15-R4, Class CB1, 2.89%, 8/26/47 W 100,000 97,382Park Place Securities, Inc. Asset-Backed Pass-Through Certificates FRB Ser. 04-WCW2, Class M3, (1 Month US LIBOR + 1.05%), 3.266%, 10/25/34 290,000 294,614Structured Asset Mortgage Investments II Trust
FRB Ser. 07-AR7, Class 1A1, (1 Month US LIBOR + 0.85%), 3.066%, 5/25/47 592,909 510,624FRB Ser. 07-AR1, Class 2A1, (1 Month US LIBOR + 0.18%), 2.396%, 1/25/37 220,682 207,732
amount ValueloanDepot Station Place Agency Securitization Trust 144A FRB Ser. 17-LD1, Class A, (1 Month US LIBOR + 0.80%), 3.016%, 11/25/50 $1,099,000 $1,099,000Station Place Securitization Trust 144A
FRB Ser. 18-1, Class A, (1 Month US LIBOR + 0.90%), 3.112%, 4/24/19 2,311,000 2,311,000FRB Ser. 18-5, Class A, (1 Month US LIBOR + 0.70%), 2.912%, 9/24/19 1,610,000 1,610,000
68 Dynamic Asset Allocation Conservative Fund
ASSET-BACKED SECURITIES (0.9%)* cont.Principal
amount ValueStation Place Securitization Trust 144A
FRB Ser. 18-3, Class A, (1 Month US LIBOR + 0.70%), 2.912%, 7/24/19 $1,819,000 $1,819,000FRB Ser. 17-6, Class A, (1 Month US LIBOR + 0.70%), 2.912%, 11/24/18 1,898,000 1,898,000
Towd Point Asset Trust 144A FRB Ser. 18-SL1, Class A, (1 Month US LIBOR + 0.60%), 2.816%, 1/25/46 1,026,961 1,021,723Total asset-backed securities (cost $9,759,830) $9,758,723
FOREIGN GOVERNMENT AND AGENCY BONDS AND NOTES (0.8%)*
FOREIGN GOVERNMENT AND AGENCY BONDS AND NOTES (0.8%)* cont.
Principal amount Value
Turkey (Republic of) unsec. bonds Ser. REGS, 6.25%, 5/23/33 (Senegal) $235,000 $218,844United Mexican States sr. unsec. unsub. notes 4.15%, 3/28/27 (Mexico) 795,000 781,839Total foreign government and agency bonds and notes (cost $9,772,895) $9,222,316
COMMODITY LINKED NOTES (0.4%)* ††† Principal
amount ValueGoldman Sachs International 144A notes zero %, 2019 (Indexed to the S&P GSCI Excess Return Index multiplied by 3) $3,410,000 $4,509,466Total commodity Linked Notes (cost $3,410,000) $4,509,466
SENIOR LOANS (0.2%)*cPrincipal
amount ValueAvaya, Inc. bank term loan FRN Ser. B, (BBA LIBOR USD 3 Month + 4.25%), 6.408%, 12/15/24 $143,064 $144,162Brand Industrial Services, Inc. bank term loan FRN (BBA LIBOR USD 3 Month + 4.25%), 6.596%, 6/21/24 182,688 183,746California Resources Corp. bank term loan FRN (BBA LIBOR USD 3 Month + 4.75%), 6.962%, 11/17/22 140,000 142,800CPG International, Inc. bank term loan FRN (BBA LIBOR USD 3 Month + 3.75%), 6.251%, 5/5/24 42,655 42,904Eagleclaw Midstream Ventures, LLC bank term loan FRN (BBA LIBOR USD 3 Month + 4.25%), 6.492%, 6/30/24 99,244 97,714Forterra Finance, LLC bank term loan FRN (BBA LIBOR USD 3 Month + 3.00%), 5.076%, 10/25/23 59,080 56,466FTS International, Inc. bank term loan FRN Ser. B, (BBA LIBOR USD 3 Month + 4.75%), 6.826%, 4/16/21 58,301 58,374Gates Global, LLC bank term loan FRN Ser. B, (BBA LIBOR USD 3 Month + 2.75%), 4.992%, 3/31/24 48,311 48,583Jo-Ann Stores, LLC bank term loan FRN (BBA LIBOR USD 3 Month + 9.25%), 11.604%, 5/21/24 110,000 108,625Jo-Ann Stores, LLC bank term loan FRN (BBA LIBOR USD 3 Month + 5.00%), 7.509%, 10/16/23 59,691 60,026KCA Deutag Alpha, Ltd. bank term loan FRN Ser. B, (BBA LIBOR USD 3 Month + 6.75%), 9.021%, 3/21/23 113,354 110,236Keane Group Holdings, LLC bank term loan FRN Ser. B, (BBA LIBOR USD 3 Month + 3.75%), 6.079%, 5/25/25 44,700 44,030Navistar, Inc. bank term loan FRN Ser. B, (BBA LIBOR USD 3 Month + 3.50%), 5.64%, 11/6/24 253,725 254,518Neiman Marcus Group, Ltd., Inc. bank term loan FRN (BBA LIBOR USD 3 Month + 3.25%), 5.37%, 10/25/20 65,884 61,066Rackspace Hosting, Inc. bank term loan FRN (BBA LIBOR USD 3 Month + 3.00%), 5.348%, 11/3/23 59,849 59,037Revlon Consumer Products Corp. bank term loan FRN Ser. B, (BBA LIBOR USD 3 Month + 3.50%), 5.81%, 9/7/23 141,984 108,056Robertshaw Holdings Corp. bank term loan FRN (BBA LIBOR USD 3 Month + 8.00%), 9.873%, 2/28/26 75,000 72,000Robertshaw Holdings Corp. bank term loan FRN (BBA LIBOR USD 3 Month + 3.50%), 5.373%, 2/28/25 79,400 78,705Titan Acquisition, Ltd. (United Kingdom) bank term loan FRN Ser. B, (BBA LIBOR USD 3 Month + 3.00%), 5.202%, 3/28/25 168,575 163,649Total senior loans (cost $1,920,349) $1,894,697
shares ValuePutnam Cash Collateral Pool, LLC 2.25% d Shares 659,050 $659,050Putnam Short Term Investment Fund 2.24% L Shares 98,088,027 98,088,027State Street Institutional U.S. Government Money Market Fund, Premier Class 1.97% P Shares 140,000 140,000U.S. Treasury Bills 1.965%, 10/11/18 # ∆ § $1,963,002 1,961,885U.S. Treasury Bills 1.976%, 10/4/18 # ∆ § 4,371,000 4,370,263U.S. Treasury Bills 1.997%, 10/25/18 2,001 1,997U.S. Treasury Bills 2.017%, 11/1/18 # § 617,001 615,903U.S. Treasury Bills 2.028%, 10/18/18 # 981,000 980,043U.S. Treasury Bills 2.064%, 11/15/18 # ∆ § 2,527,000 2,520,425U.S. Treasury Bills 2.073%, 11/8/18 # ∆ § 1,075,002 1,072,652U.S. Treasury Bills 2.122%, 11/23/18 # § 101,000 100,686U.S. Treasury Bills 2.127%, 12/6/18 # 12,001 11,954U.S. Treasury Bills 2.150%, 12/13/18 # Ф 557,000 554,598Total short-term investments (cost $111,077,894) $111,077,483
TOTAL INVESTMENTSTotal investments (cost $1,074,142,887) $1,141,191,328
Dynamic Asset Allocation Conservative Fund 71
Key to holding’s currency abbreviations
CAD Canadian DollarEUR Euro
Key to holding’s abbreviations
ARP Adjustable Rate Preferred Stock: the rate shown is the current interest rate at the close of the reporting period
BKNT Bank Notebp Basis PointsDAC Designated Activity CompanyETF Exchange Traded FundFRB Floating Rate Bonds: the rate shown is the current interest rate at the close of the reporting period. Rates may
be subject to a cap or floor. For certain securities, the rate may represent a fixed rate currently in place at the close of the reporting period.
FRN Floating Rate Notes: the rate shown is the current interest rate or yield at the close of the reporting period. Rates may be subject to a cap or floor. For certain securities, the rate may represent a fixed rate currently in place at the close of the reporting period.
GDR Global Depository Receipts: represents ownership of foreign securities on deposit with a custodian bankGMTN Global Medium Term NotesIFB Inverse Floating Rate Bonds, which are securities that pay interest rates that vary inversely to changes in the
market interest rates. As interest rates rise, inverse floaters produce less current income. The rate shown is the current interest rate at the close of the reporting period. Rates may be subject to a cap or floor.
IO Interest OnlyMTN Medium Term NotesOTC Over-the-counterPO Principal OnlyREGS Securities sold under Regulation S may not be offered, sold or delivered within the United States except
pursuant to an exemption from, or in a transaction not subject to, the registration requirements of the Securities Act of 1933.
SDR Swedish Depository Receipts: represents ownership of foreign securities on deposit with a custodian bankSPDR S&P Depository ReceiptsTBA To Be Announced Commitments
Notes to the fund’s portfolio
Unless noted otherwise, the notes to the fund’s portfolio are for the close of the fund’s reporting period, which ran from October 1, 2017 through September 30, 2018 (the reporting period). Within the following notes to the portfolio, references to “Putnam Management” represent Putnam Investment Management, LLC, the fund’s manager, an indirect wholly-owned subsidiary of Putnam Investments, LLC and references to “ASC 820” represent Accounting Standards Codification 820 Fair Value Measurements and Disclosures.
* Percentages indicated are based on net assets of $1,099,736,026.
††† The value of the commodity linked notes, which are marked to market daily, may be based on a multiple of the performance of the index. The multiple (or leverage) will increase the volatility of the note’s value relative to the change in the underlying index.
† This security is non-income-producing.
‡‡ Income may be received in cash or additional securities at the discretion of the issuer. The rate shown in parenthesis is the rate paid in kind, if applicable.
# This security, in part or in entirety, was pledged and segregated with the broker to cover margin requirements for futures contracts at the close of the reporting period. Collateral at period end totaled $10,182,017 and is included in Investments in securities on the Statement of assets and liabilities (Notes 1 and 9).
∆ This security, in part or in entirety, was pledged and segregated with the custodian for collateral on certain derivative contracts at the close of the reporting period. Collateral at period end totaled $232,538 and is included in Investments in securities on the Statement of assets and liabilities (Notes 1 and 9).
72 Dynamic Asset Allocation Conservative Fund
Ф This security, in part or in entirety, was pledged and segregated with the custodian for collateral on certain TBA commitments at the close of the reporting period. Collateral at period end totaled $116,474 and is included in Investments in securities on the Statement of assets and liabilities (Notes 1 and 9).
§ This security, in part or in entirety, was pledged and segregated with the custodian for collateral on the initial margin on certain centrally cleared derivative contracts at the close of the reporting period. Collateral at period end totaled $1,436,496 and is included in Investments in securities on the Statement of assets and liabilities (Notes 1 and 9).
c Senior loans are exempt from registration under the Securities Act of 1933, as amended, but contain certain restrictions on resale and cannot be sold publicly. These loans pay interest at rates which adjust periodically. The interest rates shown for senior loans are the current interest rates at the close of the reporting period. Senior loans are also subject to mandatory and/or optional prepayment which cannot be predicted. As a result, the remaining maturity may be substantially less than the stated maturity shown (Notes 1 and 7).
d Affiliated company. See Notes 1 and 5 to the financial statements regarding securities lending. The rate quoted in the security description is the annualized 7-day yield of the fund at the close of the reporting period.
F This security is valued by Putnam Management at fair value following procedures approved by the Trustees. Securities are classified as Level 3 for ASC 820 based on the securities’ valuation inputs (Note 1).
L Affiliated company (Note 5). The rate quoted in the security description is the annualized 7-day yield of the fund at the close of the reporting period.
P This security was pledged, or purchased with cash that was pledged, to the fund for collateral on certain derivative contracts. The rate quoted in the security description is the annualized 7-day yield of the fund at the close of the reporting period (Note 1).
R Real Estate Investment Trust.
S Security on loan, in part or in entirety, at the close of the reporting period (Note 1).
W The rate shown represents the weighted average coupon associated with the underlying mortgage pools. Rates may be subject to a cap or floor.
At the close of the reporting period, the fund maintained liquid assets totaling $31,828,734 to cover certain derivative contracts and delayed delivery securities.
Unless otherwise noted, the rates quoted in Short-term investments security descriptions represent the weighted average yield to maturity.
Debt obligations are considered secured unless otherwise indicated.
144A after the name of an issuer represents securities exempt from registration under Rule 144A of the Securities Act of 1933, as amended. These securities may be resold in transactions exempt from registration, normally to qualified institutional buyers.
See Note 1 to the financial statements regarding TBA commitments.
The dates shown on debt obligations are the original maturity dates.
FORWARD CURRENCY CONTRACTS at 9/30/18 (aggregate face value $120,041,812 )
Counterparty CurrencyContract
type*Delivery
date ValueAggregate face value
Unrealized appreciation/ (depreciation)
Bank of America N.A.Australian Dollar Buy 10/17/18 $681,985 $678,734 $3,251
British Pound Buy 12/19/18 3,027,127 3,013,586 13,541Canadian Dollar Buy 10/17/18 3,330 3,203 127
Euro Buy 12/19/18 2,299,222 2,349,570 (50,348 )Hong Kong Dollar Buy 11/19/18 265,265 264,998 267
Japanese Yen Sell 11/19/18 757,043 772,950 15,907New Zealand Dollar Buy 10/17/18 787,404 790,262 (2,858 )New Zealand Dollar Sell 10/17/18 787,404 800,518 13,114
New Zealand Dollar Sell 10/17/18 667,948 664,468 (3,480 )Norwegian Krone Buy 12/19/18 5,208,711 5,035,381 173,330
Swedish Krona Buy 12/19/18 2,569,777 2,536,528 33,249HSBC Bank USA, National Association
Australian Dollar Buy 10/17/18 836,107 864,806 (28,699 )British Pound Sell 12/19/18 827,757 832,782 5,025
Canadian Dollar Buy 10/17/18 288,106 290,372 (2,266 )Euro Sell 12/19/18 1,663,354 1,680,704 17,350
74 Dynamic Asset Allocation Conservative Fund
FORWARD CURRENCY CONTRACTS at 9/30/18 (aggregate face value $120,041,812 ) cont.
Counterparty CurrencyContract
type*Delivery
date ValueAggregate face value
Unrealized appreciation/ (depreciation)
HSBC Bank USA, National Association cont.Indonesian Rupiah Buy 12/19/18 $823,097 $824,344 $(1,247 )Indonesian Rupiah Sell 12/19/18 826,079 821,427 (4,652 )
Japanese Yen Sell 11/19/18 792,095 808,743 16,648New Zealand Dollar Buy 10/17/18 1,581,040 1,578,406 2,634New Zealand Dollar Sell 10/17/18 1,581,040 1,608,454 27,414
Swedish Krona Buy 12/19/18 776,346 787,350 (11,004 )JPMorgan Chase Bank N.A.
Australian Dollar Buy 10/17/18 175,303 186,509 (11,206 )British Pound Buy 12/19/18 567,537 568,174 (637 )
Canadian Dollar Sell 10/17/18 2,765,826 2,735,032 (30,794 )Euro Sell 12/19/18 2,197,198 2,203,280 6,082
Japanese Yen Sell 11/19/18 830,644 839,047 8,403New Zealand Dollar Buy 10/17/18 1,649,850 1,674,279 (24,429 )New Zealand Dollar Sell 10/17/18 1,649,850 1,663,788 13,938
Synthetic TRS Index 4.00% 30 year Fannie Mae pools — Monthly
$(231 )
Upfront premium received — Unrealized appreciation 272,907Upfront premium (paid) — Unrealized (depreciation) (149,666 )Total $— Total $123,241
* The 50 largest components, and any individual component greater than 1% of basket value, are shown below.
A BASKET (CGPUTQL2 ) OF COMMON STOCKS
Common stocks Sector Shares ValuePercentage
value
JPMorgan Chase & Co. Financials 11,752 $1,326,149 2.76%Alphabet, Inc. Class A Communication Services 995 1,200,982 2.50%Apple, Inc. Information Technology 5,173 1,167,744 2.43%Intuit, Inc. Information Technology 4,595 1,044,828 2.17%Humana, Inc. Health Care 2,759 933,907 1.94%TJX Cos., Inc. (The) Consumer Discretionary 8,027 899,198 1.87%American Express Co. Financials 8,438 898,511 1.87%McDonald’s Corp. Consumer Discretionary 5,371 898,452 1.87%Danaher Corp. Health Care 8,035 873,076 1.82%Pfizer, Inc. Health Care 19,127 842,927 1.75%Raytheon Co. Industrials 4,071 841,297 1.75%Texas Instruments, Inc. Information Technology 7,747 831,131 1.73%Occidental Petroleum Corp. Energy 10,048 825,651 1.72%Lowe’s Cos., Inc. Consumer Discretionary 7,150 820,968 1.71%Northrop Grumman Corp. Industrials 2,496 792,103 1.65%Exxon Mobil Corp. Energy 9,130 776,221 1.62%Cognizant Technology Solutions Corp. Class A
Information Technology 9,875 761,880 1.59%
Constellation Brands, Inc. Class A Consumer Staples 3,492 752,924 1.57%Honeywell International, Inc. Industrials 4,413 734,308 1.53%PNC Financial Services Group, Inc. (The)
Financials 5,355 729,276 1.52%
American Electric Power Co., Inc. Utilities 9,744 690,668 1.44%eBay, Inc. Consumer Discretionary 19,958 659,013 1.37%Norfolk Southern Corp. Industrials 3,577 645,650 1.34%Johnson & Johnson Health Care 4,537 626,932 1.30%Microsoft Corp. Information Technology 5,454 623,774 1.30%Baxter International, Inc. Health Care 7,984 615,501 1.28%Kimberly-Clark Corp. Consumer Staples 5,405 614,188 1.28%F5 Networks, Inc. Information Technology 2,911 580,505 1.21%NetApp, Inc. Information Technology 6,530 560,892 1.17%Walt Disney Co. (The) Communication Services 4,777 558,670 1.16%
80 Dynamic Asset Allocation Conservative Fund
A BASKET (CGPUTQL2 ) OF COMMON STOCKS cont.
Common stocks Sector Shares ValuePercentage
value
Marathon Petroleum Corp. Energy 6,870 $549,388 1.14%Allstate Corp. (The) Financials 5,443 537,199 1.12%HP, Inc. Information Technology 20,655 532,288 1.11%Duke Energy Corp. Utilities 6,586 526,977 1.10%Fidelity National Information Services, Inc.
Information Technology 4,677 510,081 1.06%
Verizon Communications, Inc. Communication Services 9,086 485,104 1.01%Sysco Corp. Consumer Staples 6,604 483,764 1.01%Ross Stores, Inc. Consumer Discretionary 4,670 462,796 0.96%General Dynamics Corp. Industrials 2,206 451,543 0.94%Facebook, Inc. Class A Communication Services 2,636 433,495 0.90%Harris Corp. Industrials 2,511 424,901 0.88%Merck & Co., Inc. Health Care 5,785 410,408 0.85%Kinder Morgan, Inc. Energy 22,342 396,132 0.82%Valero Energy Corp. Energy 3,432 390,364 0.81%Red Hat, Inc. Information Technology 2,859 389,598 0.81%Waste Management, Inc. Industrials 4,306 389,132 0.81%Fiserv, Inc. Information Technology 4,705 387,614 0.81%UnitedHealth Group, Inc. Health Care 1,437 382,221 0.80%Worldpay, Inc. Class A Information Technology 3,716 376,273 0.78%Zoetis, Inc. Health Care 4,020 368,095 0.77%
OTC CREDIT DEFAULT CONTRACTS OUTSTANDING — PROTECTION SOLD at 9/30/18
Swap counterparty/ Referenced debt* Rating***
Upfront premium received
(paid)**Notional amount Value
Termi- nation
date
Payments received by fund
Unrealized appreciation/ (depreciation)
Bank of America N.A.CMBX NA BBB–.6 Index
BBB–/P $957 $14,000 $1,651 5/11/63 300 bp — Monthly
$(687 )
CMBX NA BBB–.6 Index
BBB–/P 1,868 31,000 3,655 5/11/63 300 bp — Monthly
(1,771 )
CMBX NA BBB–.6 Index
BBB–/P 3,828 62,000 7,310 5/11/63 300 bp — Monthly
(3,451 )
Citigroup Global Markets, Inc.CMBX NA A.6 Index
A/P 4 3,000 37 5/11/63 200 bp — Monthly
(32 )
CMBX NA A.6 Index
A/P — 3,000 37 5/11/63 200 bp — Monthly
(37 )
CMBX NA A.6 Index
A/P 429 44,000 541 5/11/63 200 bp — Monthly
(97 )
CMBX NA A.6 Index
A/P 725 56,000 689 5/11/63 200 bp — Monthly
55
CMBX NA A.6 Index
A/P 2,129 154,000 1,894 5/11/63 200 bp — Monthly
287
CMBX NA BB.6 Index
BB/P 54,887 223,000 46,562 5/11/63 500 bp — Monthly
8,511
CMBX NA BB.7 Index
BB/P 12,725 99,000 12,514 1/17/47 500 bp — Monthly
294
Dynamic Asset Allocation Conservative Fund 81
OTC CREDIT DEFAULT CONTRACTS OUTSTANDING — PROTECTION SOLD at 9/30/18 cont.
Swap counterparty/ Referenced debt* Rating***
Upfront premium received
(paid)**Notional amount Value
Termi- nation
date
Payments received by fund
Unrealized appreciation/ (depreciation)
Credit Suisse InternationalCMBX NA A.6 Index
A/P $4,736 $95,000 $1,169 5/11/63 200 bp — Monthly
$3,599
CMBX NA A.6 Index
A/P 92,208 1,817,000 22,349 5/11/63 200 bp — Monthly
70,467
CMBX NA BBB–.6 Index
BBB–/P 253 2,000 236 5/11/63 300 bp — Monthly
18
CMBX NA BBB–.6 Index
BBB–/P 11,094 102,000 12,026 5/11/63 300 bp — Monthly
(881 )
CMBX NA BBB–.7 Index
BBB–/P 43,632 552,000 31,133 1/17/47 300 bp — Monthly
12,776
Goldman Sachs InternationalCMBX NA A.6 Index
A/P 192 3,000 37 5/11/63 200 bp — Monthly
157
CMBX NA A.6 Index
A/P 1,584 52,000 640 5/11/63 200 bp — Monthly
962
CMBX NA A.6 Index
A/P 444 59,000 726 5/11/63 200 bp — Monthly
(262 )
CMBX NA A.6 Index
A/P 7,315 142,000 1,747 5/11/63 200 bp — Monthly
5,615
CMBX NA A.6 Index
A/P 9,523 145,000 1,784 5/11/63 200 bp — Monthly
7,788
CMBX NA A.6 Index
A/P 10,374 210,000 2,583 5/11/63 200 bp — Monthly
7,861
CMBX NA A.6 Index
A/P 8,351 270,000 3,321 5/11/63 200 bp — Monthly
5,120
CMBX NA A.6 Index
A/P 12,141 387,000 4,760 5/11/63 200 bp — Monthly
7,510
CMBX NA A.6 Index
A/P 20,305 399,000 4,908 5/11/63 200 bp — Monthly
15,530
CMBX NA A.6 Index
A/P 28,986 481,000 5,916 5/11/63 200 bp — Monthly
23,230
CMBX NA A.7 Index
A-/P 4,437 88,000 114 1/17/47 200 bp — Monthly
4,580
CMBX NA BBB–.6 Index
BBB–/P 317 4,000 472 5/11/63 300 bp — Monthly
(153 )
CMBX NA BBB–.6 Index
BBB–/P 545 8,000 943 5/11/63 300 bp — Monthly
(394 )
CMBX NA BBB–.6 Index
BBB–/P 4,655 43,000 5,070 5/11/63 300 bp — Monthly
(393 )
CMBX NA BBB–.6 Index
BBB–/P 2,226 46,000 5,423 5/11/63 300 bp — Monthly
(3,175 )
CMBX NA BBB–.6 Index
BBB–/P 3,077 59,000 6,956 5/11/63 300 bp — Monthly
(3,849 )
CMBX NA BBB–.6 Index
BBB–/P 5,992 71,000 8,371 5/11/63 300 bp — Monthly
(2,344 )
CMBX NA BBB–.6 Index
BBB–/P 9,260 84,000 9,904 5/11/63 300 bp — Monthly
(601 )
82 Dynamic Asset Allocation Conservative Fund
OTC CREDIT DEFAULT CONTRACTS OUTSTANDING — PROTECTION SOLD at 9/30/18 cont.
Swap counterparty/ Referenced debt* Rating***
Upfront premium received
(paid)**Notional amount Value
Termi- nation
date
Payments received by fund
Unrealized appreciation/ (depreciation)
Goldman Sachs International cont.CMBX NA BBB–.6 Index
BBB–/P $8,861 $105,000 $12,380 5/11/63 300 bp — Monthly
$(3,466 )
CMBX NA BBB–.6 Index
BBB–/P 9,758 113,000 13,323 5/11/63 300 bp — Monthly
(3,509 )
CMBX NA BBB–.6 Index
BBB–/P 23,742 195,000 22,991 5/11/63 300 bp — Monthly
849
CMBX NA BBB–.6 Index
BBB–/P 55,992 597,000 70,386 5/11/63 300 bp — Monthly
(14,095 )
CMBX NA BBB–.6 Index
BBB–/P 57,205 761,000 89,722 5/11/63 300 bp — Monthly
(32,136 )
CMBX NA BBB–.7 Index
BBB–/P 5,300 62,000 3,497 1/17/47 300 bp — Monthly
1,834
CMBX NA BBB–.7 Index
BBB–/P 5,793 68,000 3,835 1/17/47 300 bp — Monthly
1,991
CMBX NA BBB–.7 Index
BBB–/P 22,289 283,000 15,961 1/17/47 300 bp — Monthly
6,469
JPMorgan Securities LLCCMBX NA BB.6 Index
BB/P 12,922 61,000 12,737 5/11/63 500 bp — Monthly
236
CMBX NA A.6 Index
A/P 241 4,000 49 5/11/63 200 bp — Monthly
193
CMBX NA A.6 Index
A/P 1,020 31,000 381 5/11/63 200 bp — Monthly
649
CMBX NA A.6 Index
A/P 3,176 62,000 763 5/11/63 200 bp — Monthly
2,434
CMBX NA A.6 Index
A/P 530 64,000 787 5/11/63 200 bp — Monthly
(236 )
CMBX NA A.6 Index
A/P 3,764 85,000 1,046 5/11/63 200 bp — Monthly
2,747
CMBX NA A.6 Index
A/P 7,140 141,000 1,734 5/11/63 200 bp — Monthly
5,453
CMBX NA A.6 Index
A/P 11,264 182,000 2,239 5/11/63 200 bp — Monthly
9,086
CMBX NA A.6 Index
A/P 3,515 204,000 2,509 5/11/63 200 bp — Monthly
1,073
CMBX NA A.6 Index
A/P 9,475 208,000 2,558 5/11/63 200 bp — Monthly
6,986
CMBX NA A.6 Index
A/P 16,418 279,000 3,432 5/11/63 200 bp — Monthly
13,079
CMBX NA A.6 Index
A/P 12,675 387,000 4,760 5/11/63 200 bp — Monthly
8,044
CMBX NA A.6 Index
A/P 12,158 402,000 4,945 5/11/63 200 bp — Monthly
7,347
CMBX NA A.6 Index
A/P 11,875 414,000 5,092 5/11/63 200 bp — Monthly
6,921
CMBX NA A.6 Index
A/P 14,522 440,000 5,412 5/11/63 200 bp — Monthly
9,257
Dynamic Asset Allocation Conservative Fund 83
OTC CREDIT DEFAULT CONTRACTS OUTSTANDING — PROTECTION SOLD at 9/30/18 cont.
Swap counterparty/ Referenced debt* Rating***
Upfront premium received
(paid)**Notional amount Value
Termi- nation
date
Payments received by fund
Unrealized appreciation/ (depreciation)
JPMorgan Securities LLC cont.CMBX NA A.6 Index
A/P $13,594 $483,000 $5,941 5/11/63 200 bp — Monthly
$7,814
CMBX NA A.6 Index
A/P 24,160 531,000 6,531 5/11/63 200 bp — Monthly
17,805
CMBX NA A.6 Index
A/P 35,837 741,000 9,114 5/11/63 200 bp — Monthly
26,970
CMBX NA A.7 Index
A-/P 11,139 254,000 330 1/17/47 200 bp — Monthly
11,553
CMBX NA BBB–.6 Index
BBB–/P 3,574 23,000 2,712 5/11/63 300 bp — Monthly
874
CMBX NA BBB–.6 Index
BBB–/P 4,748 42,000 4,952 5/11/63 300 bp — Monthly
(183 )
CMBX NA BBB–.6 Index
BBB–/P 4,823 43,000 5,070 5/11/63 300 bp — Monthly
(225 )
CMBX NA BBB–.6 Index
BBB–/P 6,203 44,000 5,188 5/11/63 300 bp — Monthly
1,037
CMBX NA BBB–.6 Index
BBB–/P 6,250 50,000 5,895 5/11/63 300 bp — Monthly
380
CMBX NA BBB–.6 Index
BBB–/P 6,809 60,000 7,074 5/11/63 300 bp — Monthly
(235 )
CMBX NA BBB–.6 Index
BBB–/P 6,843 62,000 7,310 5/11/63 300 bp — Monthly
(436 )
CMBX NA BBB–.6 Index
BBB–/P 7,044 64,000 7,546 5/11/63 300 bp — Monthly
(470 )
CMBX NA BBB–.6 Index
BBB–/P 8,154 86,000 10,139 5/11/63 300 bp — Monthly
(1,943 )
CMBX NA BBB–.6 Index
BBB–/P 30,788 175,000 20,633 5/11/63 300 bp — Monthly
10,243
CMBX NA BBB–.6 Index
BBB–/P 75,088 627,000 73,923 5/11/63 300 bp — Monthly
1,478
Merrill Lynch InternationalCMBX NA A.6 Index
A/P 847 65,000 800 5/11/63 200 bp — Monthly
69
CMBX NA BBB–.6 Index
BBB–/P 5,826 52,000 6,131 5/11/63 300 bp — Monthly
(279 )
Morgan Stanley & Co. International PLCCMBX NA BBB–.6 Index
BBB–/P 12,034 87,000 10,257 5/11/63 300 bp — Monthly
1,821
CMBX NA A.6 Index
A/P 122 13,000 160 5/11/63 200 bp — Monthly
(34 )
CMBX NA A.6 Index
A/P 982 19,000 234 5/11/63 200 bp — Monthly
754
CMBX NA A.6 Index
A/P 447 40,000 492 5/11/63 200 bp — Monthly
(32 )
CMBX NA A.6 Index
A/P 608 44,000 541 5/11/63 200 bp — Monthly
82
84 Dynamic Asset Allocation Conservative Fund
OTC CREDIT DEFAULT CONTRACTS OUTSTANDING — PROTECTION SOLD at 9/30/18 cont.
Swap counterparty/ Referenced debt* Rating***
Upfront premium received
(paid)**Notional amount Value
Termi- nation
date
Payments received by fund
Unrealized appreciation/ (depreciation)
Morgan Stanley & Co. International PLC cont.CMBX NA BB.6 Index
BB/P $17,681 $72,000 $15,034 5/11/63 500 bp — Monthly
$2,708
CMBX NA BB.6 Index
BB/P 35,237 143,000 29,858 5/11/63 500 bp — Monthly
5,498
CMBX NA BBB–.6 Index
BBB–/P 15,874 131,000 15,445 5/11/63 300 bp — Monthly
495
Upfront premium received 1,003,546 Unrealized appreciation 348,589Upfront premium (paid) — Unrealized (depreciation) (75,406 )Total $1,003,546 Total $273,183
* Payments related to the referenced debt are made upon a credit default event. ** Upfront premium is based on the difference between the original spread on issue and the market spread on day
of execution. *** Ratings for an underlying index represent the average of the ratings of all the securities included in that index. The
Moody’s, Standard & Poor’s or Fitch ratings are believed to be the most recent ratings available at September 30, 2018. Securities rated by Fitch are indicated by “/F.” Securities rated by Putnam are indicated by “/P.” The Putnam rating categories are comparable to the Standard & Poor’s classifications.
OTC CREDIT DEFAULT CONTRACTS OUTSTANDING — PROTECTION PURCHASED at 9/30/18
Swap counterparty/ Referenced debt*
Upfront premium received
(paid)**Notional amount Value
Termi- nation
date
Payments (paid) by fund
Unrealized appreciation/ (depreciation)
Citigroup Global Markets, Inc.CMBX NA A.7 Index $(1,357 ) $183,000 $238 1/17/47 (200 bp) —
Monthly$(1,656 )
CMBX NA BB.7 Index (14,531 ) 72,000 9,101 1/17/47 (500 bp) — Monthly
(5,490 )
CMBX NA BB.7 Index (5,552 ) 34,000 4,298 1/17/47 (500 bp) — Monthly
(1,283 )
CMBX NA BB.7 Index (5,340 ) 34,000 4,298 1/17/47 (500 bp) — Monthly
(1,071 )
CMBX NA BB.9 Index (15,558 ) 101,000 13,978 9/17/58 (500 bp) — Monthly
(1,664 )
CMBX NA BB.9 Index (15,629 ) 101,000 13,978 9/17/58 (500 bp) — Monthly
(1,734 )
CMBX NA BB.9 Index (15,243 ) 99,000 13,702 9/17/58 (500 bp) — Monthly
(1,624 )
CMBX NA BB.9 Index (7,828 ) 50,000 6,920 9/17/58 (500 bp) — Monthly
(949 )
Credit Suisse InternationalCMBX NA BB.7 Index (91,784 ) 558,000 70,531 1/17/47 (500 bp) —
Monthly(21,717 )
CMBX NA BB.7 Index (38,184 ) 207,000 26,165 1/17/47 (500 bp) — Monthly
(12,192 )
CMBX NA BB.7 Index (2,136 ) 121,000 25,265 5/11/63 (500 bp) — Monthly
JPMorgan Securities LLC cont.CMBX NA BBB–.7 Index $(2,259 ) $25,000 $1,410 1/17/47 (300 bp) —
Monthly$(862 )
CMBX NA BBB–.7 Index (2,409 ) 23,000 1,297 1/17/47 (300 bp) — Monthly
(1,124 )
Merrill Lynch InternationalCMBX NA BB.7 Index (37,992 ) 219,000 27,682 1/17/47 (500 bp) —
Monthly(10,493 )
CMBX NA BB.9 Index (15,641 ) 100,000 13,840 9/17/58 (500 bp) — Monthly
(1,884 )
CMBX NA BBB–.7 Index (2,376 ) 29,000 1,636 1/17/47 (300 bp) — Monthly
(755 )
Morgan Stanley & Co. International PLCCMBX NA BBB–.7 Index (7,030 ) 69,000 3,892 1/17/47 (300 bp) —
Monthly(3,173 )
CMBX NA BB.7 Index (28,758 ) 143,000 18,075 1/17/47 (500 bp) — Monthly
(10,802 )
CMBX NA BB.7 Index (23,139 ) 120,000 15,168 1/17/47 (500 bp) — Monthly
(8,071 )
CMBX NA BB.7 Index (14,531 ) 72,000 9,101 1/17/47 (500 bp) — Monthly
(5,490 )
Upfront premium received — Unrealized appreciation 46,520Upfront premium (paid) (657,498 ) Unrealized (depreciation) (162,810 )Total $(657,498 ) Total $(116,290 )
* Payments related to the referenced debt are made upon a credit default event. ** Upfront premium is based on the difference between the original spread on issue and the market spread on day
of execution.
CENTRALLY CLEARED CREDIT DEFAULT CONTRACTS OUTSTANDING — PROTECTION SOLD at 9/30/18
Referenced debt* Rating***
Upfront premium received
(paid)**Notional amount Value
Termi- nation
date
Payments received by fund
Unrealized appreciation/ (depreciation)
NA HY Series 31 Index
B+/P $(1,182,534 ) $16,457,000 $1,203,583 12/20/23 500 bp — Quarterly
$27,906
NA IG Series 31 Index
BBB+/P (1,253,585 ) 71,280,000 1,377,557 12/20/23 100 bp — Quarterly
133,871
Total $(2,436,119 ) $161,777
* Payments related to the referenced debt are made upon a credit default event. ** Upfront premium is based on the difference between the original spread on issue and the market spread on day
of execution. *** Ratings are presented for credit default contracts in which the fund has sold protection on the underlying referenced
debt. Ratings for an underlying index represent the average of the ratings of all the securities included in that index. The Moody’s, Standard & Poor’s or Fitch ratings are believed to be the most recent ratings available at September 30, 2018. Securities rated by Fitch are indicated by “/F.” Securities rated by Putnam are indicated by “/P.” The Putnam rating categories are comparable to the Standard & Poor’s classifications.
* Payments related to the referenced debt are made upon a credit default event. ** Upfront premium is based on the difference between the original spread on issue and the market spread on day
of execution.
88 Dynamic Asset Allocation Conservative Fund
ASC 820 establishes a three-level hierarchy for disclosure of fair value measurements. The valuation hierarchy is based upon the transparency of inputs to the valuation of the fund’s investments. The three levels are defined as follows:
Level 1: Valuations based on quoted prices for identical securities in active markets.Level 2: Valuations based on quoted prices in markets that are not active or for which all significant inputs are observable, either directly or indirectly.Level 3: Valuations based on inputs that are unobservable and significant to the fair value measurement.
The following is a summary of the inputs used to value the fund’s net assets as of the close of the reporting period:
Valuation inputsInvestments in securities: Level 1 Level 2 Level 3
Common stocks*:Basic materials $18,554,917 $— $— Capital goods 37,792,996 — — Communication services 12,316,846 — — Conglomerates 2,890,290 — — Consumer cyclicals 71,386,833 — — Consumer staples 38,221,768 — — Energy 26,194,860 — 11,200Financials 88,971,507 — — Government 10,300 — — Health care 64,942,158 — — Technology 105,883,744 — — Transportation 9,320,870 — — Utilities and power 17,115,578 1,585 —
Total common stocks 493,602,667 1,585 11,200
Asset-backed securities — 9,758,723 —
Commodity linked notes — 4,509,466 —
Convertible bonds and notes — 61,995 —
Convertible preferred stocks — 108,594 —
Corporate bonds and notes — 263,822,754 7
Foreign government and agency bonds and notes — 9,222,316 —
Investment companies 123,265 — —
Mortgage-backed securities — 41,259,422 —
Preferred stocks 53,521 — —
Purchased options outstanding — 70,564 —
Senior loans — 1,894,697 —
U.S. government and agency mortgage obligations — 205,612,997 —
* Common stock classifications are presented at the sector level, which may differ from the fund’s portfolio presentation.
During the reporting period, transfers within the fair value hierarchy, if any (other than certain transfers involving non-U.S. equity securities as described in Note 1 ), did not represent, in the aggregate, more than 1% of the fund’s net assets measured as of the end of the period. Transfers are accounted for using the end of period pricing valuation method.
At the start and close of the reporting period, Level 3 investments in securities represented less than 1% of the fund’s net assets and were not considered a significant portion of the fund’s portfolio.
Statement of assets and liabilities 9/30/18
ASSETSInvestment in securities, at value, including $646,114 of securities on loan (Notes 1 and 9):
Cash 19,266 Foreign currency (cost $90,954) (Note 1) 89,917 Dividends, interest and other receivables 5,279,668 Receivable for shares of the fund sold 11,588,955 Receivable for investments sold 1,027,313 Receivable for sales of delayed delivery securities (Note 1) 10,942,076 Receivable for variation margin on futures contracts (Note 1) 464,923 Receivable for variation margin on centrally cleared swap contracts (Note 1) 7,319 Unrealized appreciation on forward currency contracts (Note 1) 844,235 Unrealized appreciation on OTC swap contracts (Note 1) 668,016 Premium paid on OTC swap contracts (Note 1) 657,498 Prepaid assets 43,219 Total assets 1,172,823,733
LIABILITIESPayable for investments purchased 722,178 Payable for purchases of delayed delivery securities (Note 1) 28,794,697 Payable for shares of the fund repurchased 25,892,761 Payable for compensation of Manager (Note 2) 475,137 Payable for custodian fees (Note 2) 57,946 Payable for investor servicing fees (Note 2) 234,047 Payable for Trustee compensation and expenses (Note 2) 223,951 Payable for administrative services (Note 2) 4,398 Payable for distribution fees (Note 2) 436,359 Payable for variation margin on futures contracts (Note 1) 31,538 Payable for variation margin on centrally cleared swap contracts (Note 1) 17,472 Unrealized depreciation on OTC swap contracts (Note 1) 387,882 Premium received on OTC swap contracts (Note 1) 1,003,546 Unrealized depreciation on forward currency contracts (Note 1) 794,841 Written options outstanding, at value (premiums $33,679) (Note 1) 31,669 TBA sale commitments, at value (proceeds receivable $12,961,758) (Note 1) 12,920,391 Collateral on securities loaned, at value (Note 1) 659,050 Collateral on certain derivative contracts, at value (Notes 1 and 9) 140,000 Other accrued expenses 259,844 Total liabilities 73,087,707
Net assets $1,099,736,026
(Continued on next page)
90 Dynamic Asset Allocation Conservative Fund
The accompanying notes are an integral part of these financial statements.
Statement of assets and liabilities cont.
REPRESENTED BYPaid-in capital (Unlimited shares authorized) (Notes 1 and 4) $994,965,832 Total distributable earnings (Note 1) 104,770,194 Total — Representing net assets applicable to capital shares outstanding $1,099,736,026
COMPUTATION OF NET ASSET VALUE AND OFFERING PRICENet asset value and redemption price per class A share ($485,386,676 divided by 44,713,096 shares) $10.86 Offering price per class A share (100/94.25 of $10.86)* $11.52 Net asset value and offering price per class B share ($15,589,256 divided by 1,447,981 shares)** $10.77 Net asset value and offering price per class C share ($117,638,656 divided by 10,980,679 shares)** $10.71 Net asset value and redemption price per class M share ($7,940,332 divided by 740,034 shares) $10.73 Offering price per class M share (100/96.50 of $10.73)* $11.12 Net asset value, offering price and redemption price per class P share ($120,496,269 divided by 11,061,431 shares) $10.89 Net asset value, offering price and redemption price per class R share ($10,407,114 divided by 932,046 shares) $11.17 Net asset value, offering price and redemption price per class R5 share ($5,650,989 divided by 518,621 shares) $10.90 Net asset value, offering price and redemption price per class R6 share ($106,430,308 divided by 9,762,700 shares) $10.90 Net asset value, offering price and redemption price per class Y share ($230,196,426 divided by 21,123,706 shares) $10.90
*On single retail sales of less than $50,000. On sales of $50,000 or more the offering price is reduced.**Redemption price per share is equal to net asset value less any applicable contingent deferred sales charge.
Dynamic Asset Allocation Conservative Fund 91
The accompanying notes are an integral part of these financial statements.
Statement of operations Year ended 9/30/18
INVESTMENT INCOMEInterest (net of foreign tax of $2,145) (including interest income of $2,154,661 from investments in affiliated issuers) (Note 5) $21,976,234 Dividends (net of foreign tax of $322,553) 10,909,000 Securities lending (net of expenses) (Notes 1 and 5) 23,837 Total investment income 32,909,071
EXPENSESCompensation of Manager (Note 2) 5,842,858 Investor servicing fees (Note 2) 1,447,185 Custodian fees (Note 2) 107,912 Trustee compensation and expenses (Note 2) 50,797 Distribution fees (Note 2) 2,803,763 Administrative services (Note 2) 32,922 Other 566,079 Total expenses 10,851,516
REALIZED AND UNREALIZED GAIN (LOSS)Net realized gain (loss) on:
Securities from unaffiliated issuers (Notes 1 and 3) 49,519,990 Foreign currency transactions (Note 1) (14,568)Forward currency contracts (Note 1) (2,680,688)Futures contracts (Note 1) (18,052,732)Swap contracts (Note 1) 1,003,186 Written options (Note 1) 358,686 Net increase from payments by affiliates (Note 2) 3,101
Total net realized gain 30,136,975 Change in net unrealized appreciation (depreciation) on:
Securities from unaffiliated issuers and TBA sale commitments (16,042,480)Assets and liabilities in foreign currencies (5,911)Forward currency contracts (159,562)Futures contracts (2,708,825)Swap contracts 1,061,491 Written options (23,209)
Total change in net unrealized depreciation (17,878,496)
Net gain on investments 12,258,479
Net increase in net assets resulting from operations $34,325,443
92 Dynamic Asset Allocation Conservative Fund
The accompanying notes are an integral part of these financial statements.
Statement of changes in net assets
INCREASE (DECREASE) IN NET ASSETS Year ended 9/30/18 Year ended 9/30/17OperationsNet investment income $22,066,964 $18,550,947 Net realized gain on investments and foreign currency transactions 30,136,975 15,137,351 Net unrealized appreciation (depreciation) of investments and assets and liabilities in foreign currencies (17,878,496) 37,271,064 Net increase in net assets resulting from operations 34,325,443 70,959,362 Distributions to shareholders (Note 1):
From ordinary incomeNet investment income
Class A (8,785,799) (7,776,401)Class B (183,747) (170,422)Class C (1,367,213) (1,130,620)Class M (106,944) (130,718)Class P (2,309,946) (1,658,733)Class R (162,475) (156,156)Class R5 (123,481) (8,702)Class R6 (2,546,846) (1,880,808)Class Y (4,659,815) (3,773,039)
Net realized short-term gain on investmentsClass A (676,001) — Class B (26,062) — Class C (192,699) — Class M (11,116) — Class P (144,272) — Class R (15,918) — Class R5 (8,492) — Class R6 (158,258) — Class Y (323,178) —
From net realized long-term gain on investmentsClass A (2,704,005) (2,688,295)Class B (104,249) (114,269)Class C (770,796) (704,891)Class M (44,464) (94,080)Class P (577,088) (412,004)Class R (63,671) (61,311)Class R5 (33,966) (3,296)Class R6 (633,034) (502,358)Class Y (1,292,710) (951,385)
Increase (decrease) from capital share transactions (Note 4) (31,540,551) 57,054,205 Total increase (decrease) in net assets (25,241,353) 105,796,079
NET ASSETSBeginning of year 1,124,977,379 1,019,181,300
End of year (Note 1) $1,099,736,026 $1,124,977,379
Dynamic Asset Allocation Conservative Fund 93
Fund _FundCode, — NumbCols Columns — This section modified: 10/22/18 5:03:45 PM Fund _FundCode, — NumbCols Columns — This section modified: 10/22/18 5:03:45 PM
Dynamic Asset Allocation Conservative Fund 95 94 Dynamic Asset Allocation Conservative Fund
The accompanying notes are an integral part of these financial statements.
See notes to financial highlights at the end of this section.
Financial highlights (For a common share outstanding throughout the period)
INVESTMENT OPERATIONS LESS DISTRIBUTIONS RATIOS AND SUPPLEMENTAL DATA
Fund _FundCode, — NumbCols Columns — This section modified: 10/22/18 5:03:45 PM Fund _FundCode, — NumbCols Columns — This section modified: 10/22/18 5:03:45 PM
Dynamic Asset Allocation Conservative Fund 97 96 Dynamic Asset Allocation Conservative Fund
Financial highlights cont.
The accompanying notes are an integral part of these financial statements.
* Not annualized.
† For the period August 31, 2016 (commencement of operations) to September 30, 2016. a Per share net investment income (loss) has been determined on the basis of the weighted average number of shares
outstanding during the period. b Total return assumes dividend reinvestment and does not reflect the effect of sales charges. c Includes amounts paid through expense offset and/or brokerage service arrangements, if any (Note 2). Also excludes
acquired fund fees and expenses, if any. d Portfolio turnover includes TBA purchase and sale commitments. e The net investment income ratio and per share amount shown for the period ending September 30, 2014 may
not correspond with the expected class specific differences for the period due to the timing of subscriptions into the class.
f Reflects a voluntary waiver of certain fund expenses in effect during the period. As a result of such waiver, the expenses of each class reflect a reduction of less than 0.01% as a percentage of average net assets.
INVESTMENT OPERATIONS LESS DISTRIBUTIONS RATIOS AND SUPPLEMENTAL DATA
Within the following Notes to financial statements, references to “State Street” represent State Street Bank and Trust Company, references to “the SEC” represent the Securities and Exchange Commission, references to “Putnam Management” represent Putnam Investment Management, LLC, the fund’s manager, an indirect wholly-owned subsidiary of Putnam Investments, LLC and references to “OTC”, if any, represent over-the-counter. Unless otherwise noted, the “reporting period” represents the period from October 1, 2017 through September 30, 2018.
Putnam Dynamic Asset Allocation Conservative Fund (the fund) is a diversified series of Putnam Asset Alloca-tion Funds (the Trust), a Massachusetts business trust registered under the Investment Company Act of 1940, as amended, as an open-end management investment company. The goal of the fund is to seek total return consistent with preservation of capital. Total return is composed of capital appreciation and income. The fund is one of three Putnam Dynamic Asset Allocation Funds, each of which has a unique strategic, or typical, alloca-tion between equity and fixed-income investments. Using qualitative analysis and quantitative techniques, Putnam Management adjusts portfolio allocations from time to time within a certain range for the fund to try to optimize the fund’s performance consistent with its goal. The fund invests mainly in fixed-income investments, including U.S. and foreign government obligations, corporate obligations and securitized debt instruments (such as mortgage-backed investments). Putnam Management may consider, among other factors, credit, interest rate and prepayment risks, as well as general market conditions, when deciding whether to buy or sell fixed-income investments. The fund also invests, to a lesser extent, in equity securities (growth or value stocks or both) of U.S. and foreign companies of any size. Putnam Management may consider, among other factors, a company’s valu-ation, financial strength, growth potential, competitive position in its industry, projected future earnings, cash flows and dividends when deciding whether to buy or sell equity investments. Putnam Management may also select other investments that do not fall within these asset classes. The fund typically uses to a significant extent derivatives, such as futures, options, certain foreign currency transactions, warrants and swap contracts, for both hedging and non-hedging purposes.
The fund offers class A, class B, class C, class M, class P, class R, class R5, class R6 and class Y shares. The fund registered class T shares in February 2017, however, as of the date of this report, class T shares had not commenced operations and are not available for purchase. Purchases of class B shares are closed to new and existing investors except by exchange from class B shares of another Putnam fund or through dividend and/or capital gains reinvestment. Class A and class M shares are sold with a maximum front-end sales charge of 5.75% and 3.50%, respectively. Class A shares generally are not subject to a contingent deferred sales charge, and class M, class P, class R, class R5, class R6 and class Y shares are not subject to a contingent deferred sales charge. Class B shares, which convert to class A shares after approximately eight years, are not subject to a front-end sales charge and are subject to a contingent deferred sales charge if those shares are redeemed within six years of purchase. Class C shares are subject to a one-year 1.00% contingent deferred sales charge and generally convert to class A shares after approximately ten years. Prior to April 1, 2018, class C shares did not convert to class A shares. Class R shares, which are not available to all investors, are sold at net asset value. The expenses for class A, class B, class C, class M and class R shares may differ based on the distribution fee of each class, which is identi-fied in Note 2. Class P, class R5, class R6 and class Y shares, which are sold at net asset value, are generally subject to the same expenses as class A, class B, class C, class M and class R shares, but do not bear a distribution fee, and in the case of class P, class R5 and class R6 shares, bear a lower investor servicing fee, which is identified in Note 2. Class P shares are only available to other Putnam funds and other accounts managed by Putnam Management or its affiliates. Class R5, class R6 and class Y shares are not available to all investors.
In the normal course of business, the fund enters into contracts that may include agreements to indemnify another party under given circumstances. The fund’s maximum exposure under these arrangements is unknown as this would involve future claims that may be, but have not yet been, made against the fund. However, the fund’s management team expects the risk of material loss to be remote.
The fund has entered into contractual arrangements with an investment adviser, administrator, distributor, share-holder servicing agent and custodian, who each provide services to the fund. Unless expressly stated otherwise, shareholders are not parties to, or intended beneficiaries of these contractual arrangements, and these contrac-tual arrangements are not intended to create any shareholder right to enforce them against the service providers or to seek any remedy under them against the service providers, either directly or on behalf of the fund.
Under the fund’s Amended and Restated Agreement and Declaration of Trust, any claims asserted against or on behalf of the Putnam Funds, including claims against Trustees and Officers, must be brought in state and federal courts located within the Commonwealth of Massachusetts.
Dynamic Asset Allocation Conservative Fund 99
Note 1: Significant accounting policiesThe following is a summary of significant accounting policies consistently followed by the fund in the preparation of its financial statements. The preparation of financial statements is in conformity with accounting principles generally accepted in the United States of America and requires management to make estimates and assump-tions that affect the reported amounts of assets and liabilities in the financial statements and the reported amounts of increases and decreases in net assets from operations. Actual results could differ from those esti-mates. Subsequent events after the Statement of assets and liabilities date through the date that the financial statements were issued have been evaluated in the preparation of the financial statements.
Investment income, realized and unrealized gains and losses and expenses of the fund are borne pro-rata based on the relative net assets of each class to the total net assets of the fund, except that each class bears expenses unique to that class (including the distribution fees applicable to such classes). Each class votes as a class only with respect to its own distribution plan or other matters on which a class vote is required by law or determined by the Trustees. If the fund were liquidated, shares of each class would receive their pro-rata share of the net assets of the fund. In addition, the Trustees declare separate dividends on each class of shares.
Security valuation Portfolio securities and other investments are valued using policies and procedures adopted by the Board of Trustees. The Trustees have formed a Pricing Committee to oversee the implementation of these procedures and have delegated responsibility for valuing the fund’s assets in accordance with these procedures to Putnam Management. Putnam Management has established an internal Valuation Committee that is respon-sible for making fair value determinations, evaluating the effectiveness of the pricing policies of the fund and reporting to the Pricing Committee.
Investments for which market quotations are readily available are valued at the last reported sales price on their principal exchange, or official closing price for certain markets, and are classified as Level 1 securities under Accounting Standards Codification 820 Fair Value Measurements and Disclosures (ASC 820). If no sales are reported, as in the case of some securities that are traded OTC, a security is valued at its last reported bid price and is generally categorized as a Level 2 security.
Investments in open-end investment companies (excluding exchange-traded funds), if any, which can be classi-fied as Level 1 or Level 2 securities, are valued based on their net asset value. The net asset value of such invest-ment companies equals the total value of their assets less their liabilities and divided by the number of their outstanding shares.
Market quotations are not considered to be readily available for certain debt obligations (including short-term investments with remaining maturities of 60 days or less) and other investments; such investments are valued on the basis of valuations furnished by an independent pricing service approved by the Trustees or dealers selected by Putnam Management. Such services or dealers determine valuations for normal institutional-size trading units of such securities using methods based on market transactions for comparable securities and various relation-ships, generally recognized by institutional traders, between securities (which consider such factors as security prices, yields, maturities and ratings). These securities will generally be categorized as Level 2.
Many securities markets and exchanges outside the U.S. close prior to the scheduled close of the New York Stock Exchange and therefore the closing prices for securities in such markets or on such exchanges may not fully reflect events that occur after such close but before the scheduled close of the New York Stock Exchange. Accord-ingly, on certain days, the fund will fair value certain foreign equity securities taking into account multiple factors including movements in the U.S. securities markets, currency valuations and comparisons to the valuation of American Depository Receipts, exchange-traded funds and futures contracts. The foreign equity securities, which would generally be classified as Level 1 securities, will be transferred to Level 2 of the fair value hierarchy when they are valued at fair value. The number of days on which fair value prices will be used will depend on market activity and it is possible that fair value prices will be used by the fund to a significant extent. Securities quoted in foreign currencies, if any, are translated into U.S. dollars at the current exchange rate.
To the extent a pricing service or dealer is unable to value a security or provides a valuation that Putnam Manage-ment does not believe accurately reflects the security’s fair value, the security will be valued at fair value by Putnam Management in accordance with policies and procedures approved by the Trustees. Certain invest-ments, including certain restricted and illiquid securities and derivatives, are also valued at fair value following procedures approved by the Trustees. These valuations consider such factors as significant market or specific security events such as interest rate or credit quality changes, various relationships with other securities, discount rates, U.S. Treasury, U.S. swap and credit yields, index levels, convexity exposures, recovery rates, sales and other multiples and resale restrictions. These securities are classified as Level 2 or as Level 3 depending on the priority of the significant inputs.
100 Dynamic Asset Allocation Conservative Fund
To assess the continuing appropriateness of fair valuations, the Valuation Committee reviews and affirms the reasonableness of such valuations on a regular basis after considering all relevant information that is reasonably available. Such valuations and procedures are reviewed periodically by the Trustees. Certain securities may be valued on the basis of a price provided by a single source. The fair value of securities is generally determined as the amount that the fund could reasonably expect to realize from an orderly disposition of such securities over a reasonable period of time. By its nature, a fair value price is a good faith estimate of the value of a security in a current sale and does not reflect an actual market price, which may be different by a material amount.
Security transactions and related investment income Security transactions are recorded on the trade date (the date the order to buy or sell is executed). Gains or losses on securities sold are determined on the identified cost basis.
Interest income, net of any applicable withholding taxes, is recorded on the accrual basis. Dividend income, net of any applicable withholding taxes, is recognized on the ex-dividend date except that certain dividends from foreign securities, if any, are recognized as soon as the fund is informed of the ex-dividend date. Non-cash divi-dends, if any, are recorded at the fair value of the securities received. Dividends representing a return of capital or capital gains, if any, are reflected as a reduction of cost and/or as a realized gain. All premiums/discounts are amortized/accreted on a yield-to-maturity basis.
The fund earned certain fees in connection with its senior loan purchasing activities. These fees are treated as market discount and are amortized into income in the Statement of operations.
Securities purchased or sold on a delayed delivery basis may be settled at a future date beyond customary settle-ment time; interest income is accrued based on the terms of the securities. Losses may arise due to changes in the fair value of the underlying securities or if the counterparty does not perform under the contract.
Stripped securities The fund may invest in stripped securities which represent a participation in securities that may be structured in classes with rights to receive different portions of the interest and principal. Interest-only securities receive all of the interest and principal-only securities receive all of the principal. If the interest-only securities experience greater than anticipated prepayments of principal, the fund may fail to recoup fully its initial investment in these securities. Conversely, principal-only securities increase in value if prepayments are greater than anticipated and decline if prepayments are slower than anticipated. The fair value of these securities is highly sensitive to changes in interest rates.
Foreign currency translation The accounting records of the fund are maintained in U.S. dollars. The fair value of foreign securities, currency holdings, and other assets and liabilities is recorded in the books and records of the fund after translation to U.S. dollars based on the exchange rates on that day. The cost of each security is deter-mined using historical exchange rates. Income and withholding taxes are translated at prevailing exchange rates when earned or incurred. The fund does not isolate that portion of realized or unrealized gains or losses resulting from changes in the foreign exchange rate on investments from fluctuations arising from changes in the market prices of the securities. Such gains and losses are included with the net realized and unrealized gain or loss on investments. Net realized gains and losses on foreign currency transactions represent net realized exchange gains or losses on disposition of foreign currencies, currency gains and losses realized between the trade and settlement dates on securities transactions and the difference between the amount of investment income and foreign withholding taxes recorded on the fund’s books and the U.S. dollar equivalent amounts actually received or paid. Net unrealized appreciation and depreciation of assets and liabilities in foreign currencies arise from changes in the value of assets and liabilities other than investments at the period end, resulting from changes in the exchange rate.
Options contracts The fund uses options contracts to hedge against changes in values of securities it owns, owned or expects to own.
The potential risk to the fund is that the change in value of options contracts may not correspond to the change in value of the hedged instruments. In addition, losses may arise from changes in the value of the underlying instru-ments if there is an illiquid secondary market for the contracts, if interest or exchange rates move unexpectedly or if the counterparty to the contract is unable to perform. Realized gains and losses on purchased options are included in realized gains and losses on investment securities. If a written call option is exercised, the premium originally received is recorded as an addition to sales proceeds. If a written put option is exercised, the premium originally received is recorded as a reduction to the cost of investments.
Exchange-traded options are valued at the last sale price or, if no sales are reported, the last bid price for purchased options and the last ask price for written options. OTC traded options are valued using prices supplied by dealers.
Dynamic Asset Allocation Conservative Fund 101
Options on swaps are similar to options on securities except that the premium paid or received is to buy or grant the right to enter into a previously agreed upon interest rate or credit default contract. Forward premium swap option contracts include premiums that have extended settlement dates. The delayed settlement of the premiums is factored into the daily valuation of the option contracts. In the case of interest rate cap and floor contracts, in return for a premium, ongoing payments between two parties are based on interest rates exceeding a specified rate, in the case of a cap contract, or falling below a specified rate in the case of a floor contract.
Written option contracts outstanding at period end, if any, are listed after the fund’s portfolio.
Futures contracts The fund uses futures contracts to manage exposure to market risk, to hedge prepayment risk, to hedge interest rate risk, to gain exposure to interest rates and to equitize cash.
The potential risk to the fund is that the change in value of futures contracts may not correspond to the change in value of the hedged instruments. In addition, losses may arise from changes in the value of the underlying instru-ments, if there is an illiquid secondary market for the contracts, if interest or exchange rates move unexpectedly or if the counterparty to the contract is unable to perform. With futures, there is minimal counterparty credit risk to the fund since futures are exchange traded and the exchange’s clearinghouse, as counterparty to all exchange traded futures, guarantees the futures against default. Risks may exceed amounts recognized on the State-ment of assets and liabilities. When the contract is closed, the fund records a realized gain or loss equal to the difference between the value of the contract at the time it was opened and the value at the time it was closed.
Futures contracts are valued at the quoted daily settlement prices established by the exchange on which they trade. The fund and the broker agree to exchange an amount of cash equal to the daily fluctuation in the value of the futures contract. Such receipts or payments are known as “variation margin.”
Futures contracts outstanding at period end, if any, are listed after the fund’s portfolio.
Forward currency contracts The fund buys and sells forward currency contracts, which are agreements between two parties to buy and sell currencies at a set price on a future date. These contracts are used to hedge foreign exchange risk and to gain exposure to currencies.
The U.S. dollar value of forward currency contracts is determined using current forward currency exchange rates supplied by a quotation service. The fair value of the contract will fluctuate with changes in currency exchange rates. The contract is marked to market daily and the change in fair value is recorded as an unrealized gain or loss. The fund records a realized gain or loss equal to the difference between the value of the contract at the time it was opened and the value at the time it was closed when the contract matures or by delivery of the currency. The fund could be exposed to risk if the value of the currency changes unfavorably, if the counterparties to the contracts are unable to meet the terms of their contracts or if the fund is unable to enter into a closing position. Risks may exceed amounts recognized on the Statement of assets and liabilities.
Forward currency contracts outstanding at period end, if any, are listed after the fund’s portfolio.
Interest rate swap contracts The fund entered into OTC and/or centrally cleared interest rate swap contracts, which are arrangements between two parties to exchange cash flows based on a notional principal amount, to hedge interest rate risk, to gain exposure on interest rates and to hedge prepayment risk.
An OTC and centrally cleared interest rate swap can be purchased or sold with an upfront premium. For OTC interest rate swap contracts, an upfront payment received by the fund is recorded as a liability on the fund’s books. An upfront payment made by the fund is recorded as an asset on the fund’s books. OTC and centrally cleared interest rate swap contracts are marked to market daily based upon quotations from an independent pricing service or market makers. Any change is recorded as an unrealized gain or loss on OTC interest rate swaps. Daily fluctuations in the value of centrally cleared interest rate swaps are settled through a central clearing agent and are recorded in variation margin on the Statement of assets and liabilities and recorded as unrealized gain or loss. Payments, including upfront premiums, received or made are recorded as realized gains or losses at the reset date or the closing of the contract. Certain OTC and centrally cleared interest rate swap contracts may include extended effective dates. Payments related to these swap contracts are accrued based on the terms of the contract.
The fund could be exposed to credit or market risk due to unfavorable changes in the fluctuation of interest rates or if the counterparty defaults, in the case of OTC interest rate contracts, or the central clearing agency or a clearing member defaults, in the case of centrally cleared interest rate swap contracts, on its respective obliga-tion to perform under the contract. The fund’s maximum risk of loss from counterparty risk or central clearing risk is the fair value of the contract. This risk may be mitigated for OTC interest rate swap contracts by having a master netting arrangement between the fund and the counterparty and for centrally cleared interest rate
102 Dynamic Asset Allocation Conservative Fund
swap contracts through the daily exchange of variation margin. There is minimal counterparty risk with respect to centrally cleared interest rate swap contracts due to the clearinghouse guarantee fund and other resources that are available in the event of a clearing member default. Risk of loss may exceed amounts recognized on the Statement of assets and liabilities.
OTC and centrally cleared interest rate swap contracts outstanding, including their respective notional amounts at period end, if any, are listed after the fund’s portfolio.
Total return swap contracts The fund entered into OTC and/or centrally cleared total return swap contracts, which are arrangements to exchange a market-linked return for a periodic payment, both based on a notional principal amount, to hedge sector exposure, to manage exposure to specific sectors or industries, to manage exposure to specific securities, to gain exposure to a basket of securities, to gain exposure to specific markets or countries and to gain exposure to specific sectors or industries.
To the extent that the total return of the security, index or other financial measure underlying the transaction exceeds or falls short of the offsetting interest rate obligation, the fund will receive a payment from or make a payment to the counterparty. OTC and/or centrally cleared total return swap contracts are marked to market daily based upon quotations from an independent pricing service or market maker. Any change is recorded as an unrealized gain or loss on OTC total return swaps. Daily fluctuations in the value of centrally cleared total return swaps are settled through a central clearing agent and are recorded in variation margin on the Statement of assets and liabilities and recorded as unrealized gain or loss. Payments received or made are recorded as realized gains or losses. Certain OTC and/or centrally cleared total return swap contracts may include extended effec-tive dates. Payments related to these swap contracts are accrued based on the terms of the contract. The fund could be exposed to credit or market risk due to unfavorable changes in the fluctuation of interest rates or in the price of the underlying security or index, the possibility that there is no liquid market for these agreements or that the counterparty may default on its obligation to perform. The fund’s maximum risk of loss from counterparty risk or central clearing risk is the fair value of the contract. This risk may be mitigated for OTC total return swap contracts by having a master netting arrangement between the fund and the counterparty and for centrally cleared total return swap contracts through the daily exchange of variation margin. There is minimal counterparty risk with respect to centrally cleared total return swap contracts due to the clearinghouse guarantee fund and other resources that are available in the event of a clearing member default. Risk of loss may exceed amounts recognized on the Statement of assets and liabilities.
OTC and/or centrally cleared total return swap contracts outstanding, including their respective notional amounts at period end, if any, are listed after the fund’s portfolio.
Credit default contracts The fund entered into OTC and/or centrally cleared credit default contracts to hedge credit risk, to hedge market risk and to gain exposure on individual names and/or baskets of securities.
In OTC and centrally cleared credit default contracts, the protection buyer typically makes a periodic stream of payments to a counterparty, the protection seller, in exchange for the right to receive a contingent payment upon the occurrence of a credit event on the reference obligation or all other equally ranked obligations of the reference entity. Credit events are contract specific but may include bankruptcy, failure to pay, restructuring and obligation acceleration. For OTC credit default contracts, an upfront payment received by the fund is recorded as a liability on the fund’s books. An upfront payment made by the fund is recorded as an asset on the fund’s books. Centrally cleared credit default contracts provide the same rights to the protection buyer and seller except the payments between parties, including upfront premiums, are settled through a central clearing agent through variation margin payments. Upfront and periodic payments received or paid by the fund for OTC and centrally cleared credit default contracts are recorded as realized gains or losses at the reset date or close of the contract. The OTC and centrally cleared credit default contracts are marked to market daily based upon quotations from an independent pricing service or market makers. Any change in value of OTC credit default contracts is recorded as an unrealized gain or loss. Daily fluctuations in the value of centrally cleared credit default contracts are recorded in variation margin on the Statement of assets and liabilities and recorded as unrealized gain or loss. Upon the occurrence of a credit event, the difference between the par value and fair value of the reference obligation, net of any proportional amount of the upfront payment, is recorded as a realized gain or loss.
In addition to bearing the risk that the credit event will occur, the fund could be exposed to market risk due to unfavorable changes in interest rates or in the price of the underlying security or index or the possibility that the fund may be unable to close out its position at the same time or at the same price as if it had purchased the underlying reference obligations. In certain circumstances, the fund may enter into offsetting OTC and centrally cleared credit default contracts which would mitigate its risk of loss. Risks of loss may exceed amounts recognized on the Statement of assets and liabilities. The fund’s maximum risk of loss from counterparty
Dynamic Asset Allocation Conservative Fund 103
risk, either as the protection seller or as the protection buyer, is the fair value of the contract. This risk may be mitigated for OTC credit default contracts by having a master netting arrangement between the fund and the counterparty and for centrally cleared credit default contracts through the daily exchange of variation margin. Counterparty risk is further mitigated with respect to centrally cleared credit default swap contracts due to the clearinghouse guarantee fund and other resources that are available in the event of a clearing member default. Where the fund is a seller of protection, the maximum potential amount of future payments the fund may be required to make is equal to the notional amount.
OTC and centrally cleared credit default contracts outstanding, including their respective notional amounts at period end, if any, are listed after the fund’s portfolio.
TBA commitments The fund may enter into TBA (to be announced) commitments to purchase securities for a fixed unit price at a future date beyond customary settlement time. Although the unit price and par amount have been established, the actual securities have not been specified. However, it is anticipated that the amount of the commitments will not significantly differ from the principal amount. The fund holds, and maintains until settle-ment date, cash or high-grade debt obligations in an amount sufficient to meet the purchase price, or the fund may enter into offsetting contracts for the forward sale of other securities it owns. Income on the securities will not be earned until settlement date.
The fund may also enter into TBA sale commitments to hedge its portfolio positions, to sell mortgage-backed securities it owns under delayed delivery arrangements or to take a short position in mortgage-backed securi-ties. Proceeds of TBA sale commitments are not received until the contractual settlement date. During the time a TBA sale commitment is outstanding, either equivalent deliverable securities or an offsetting TBA purchase commitment deliverable on or before the sale commitment date are held as “cover” for the transaction, or other liquid assets in an amount equal to the notional value of the TBA sale commitment are segregated. If the TBA sale commitment is closed through the acquisition of an offsetting TBA purchase commitment, the fund realizes a gain or loss. If the fund delivers securities under the commitment, the fund realizes a gain or a loss from the sale of the securities based upon the unit price established at the date the commitment was entered into.
TBA commitments, which are accounted for as purchase and sale transactions, may be considered securities themselves, and involve a risk of loss due to changes in the value of the security prior to the settlement date as well as the risk that the counterparty to the transaction will not perform its obligations. Counterparty risk is mitigated by having a master agreement between the fund and the counterparty.
Unsettled TBA commitments are valued at their fair value according to the procedures described under “Security valuation” above. The contract is marked to market daily and the change in fair value is recorded by the fund as an unrealized gain or loss. Based on market circumstances, Putnam Management will determine whether to take delivery of the underlying securities or to dispose of the TBA commitments prior to settlement.
TBA purchase commitments outstanding at period end, if any, are listed within the fund’s portfolio and TBA sale commitments outstanding at period end, if any, are listed after the fund’s portfolio.
Master agreements The fund is a party to ISDA (International Swaps and Derivatives Association, Inc.) Master Agreements that govern OTC derivative and foreign exchange contracts and Master Securities Forward Transac-tion Agreements that govern transactions involving mortgage-backed and other asset-backed securities that may result in delayed delivery (Master Agreements) with certain counterparties entered into from time to time. The Master Agreements may contain provisions regarding, among other things, the parties’ general obligations, repre-sentations, agreements, collateral requirements, events of default and early termination. With respect to certain counterparties, in accordance with the terms of the Master Agreements, collateral posted to the fund is held in a segregated account by the fund’s custodian and, with respect to those amounts which can be sold or repledged, are presented in the fund’s portfolio.
Collateral pledged by the fund is segregated by the fund’s custodian and identified in the fund’s portfolio. Collat-eral can be in the form of cash or debt securities issued by the U.S. Government or related agencies or other secu-rities as agreed to by the fund and the applicable counterparty. Collateral requirements are determined based on the fund’s net position with each counterparty.
With respect to ISDA Master Agreements, termination events applicable to the fund may occur upon a decline in the fund’s net assets below a specified threshold over a certain period of time. Termination events applicable to counterparties may occur upon a decline in the counterparty’s long-term or short-term credit ratings below a specified level. In each case, upon occurrence, the other party may elect to terminate early and cause settlement of all derivative and foreign exchange contracts outstanding, including the payment of any losses and costs
104 Dynamic Asset Allocation Conservative Fund
resulting from such early termination, as reasonably determined by the terminating party. Any decision by one or more of the fund’s counterparties to elect early termination could impact the fund’s future derivative activity.
At the close of the reporting period, the fund had a net liability position of $344,074 on open derivative contracts subject to the Master Agreements. Collateral posted by the fund at period end for these agreements totaled $232,538 and may include amounts related to unsettled agreements.
Securities lending The fund may lend securities, through its agent, to qualified borrowers in order to earn addi-tional income. The loans are collateralized by cash in an amount at least equal to the fair value of the securities loaned. The fair value of securities loaned is determined daily and any additional required collateral is allocated to the fund on the next business day. The remaining maturities of the securities lending transactions are consid-ered overnight and continuous. The risk of borrower default will be borne by the fund’s agent; the fund will bear the risk of loss with respect to the investment of the cash collateral. Income from securities lending, net of expenses, is included in investment income on the Statement of operations. Cash collateral is invested in Putnam Cash Collateral Pool, LLC, a limited liability company managed by an affiliate of Putnam Management. Invest-ments in Putnam Cash Collateral Pool, LLC are valued at its closing net asset value each business day. There are no management fees charged to Putnam Cash Collateral Pool, LLC. At the close of the reporting period, the fund received cash collateral of $659,050 and the value of securities loaned amounted to $646,114.
Interfund lending The fund, along with other Putnam funds, may participate in an interfund lending program pursuant to an exemptive order issued by the SEC. This program allows the fund to borrow from or lend to other Putnam funds that permit such transactions. Interfund lending transactions are subject to each fund’s investment policies and borrowing and lending limits. Interest earned or paid on the interfund lending transac-tion will be based on the average of certain current market rates. During the reporting period, the fund did not utilize the program.
Lines of credit The fund participates, along with other Putnam funds, in a $317.5 million unsecured committed line of credit and a $235.5 million unsecured uncommitted line of credit, both provided by State Street. Borrow-ings may be made for temporary or emergency purposes, including the funding of shareholder redemption requests and trade settlements. Interest is charged to the fund based on the fund’s borrowing at a rate equal to 1.25% plus the higher of (1) the Federal Funds rate and (2) the overnight LIBOR for the committed line of credit and the Federal Funds rate plus 1.30% for the uncommitted line of credit. A closing fee equal to 0.04% of the committed line of credit and 0.04% of the uncommitted line of credit has been paid by the participating funds. In addition, a commitment fee of 0.21% per annum on any unutilized portion of the committed line of credit is allo-cated to the participating funds based on their relative net assets and paid quarterly. During the reporting period, the fund had no borrowings against these arrangements.
Federal taxes It is the policy of the fund to distribute all of its taxable income within the prescribed time period and otherwise comply with the provisions of the Internal Revenue Code of 1986, as amended (the Code), appli-cable to regulated investment companies. It is also the intention of the fund to distribute an amount sufficient to avoid imposition of any excise tax under Section 4982 of the Code.
The fund is subject to the provisions of Accounting Standards Codification 740 Income Taxes (ASC 740). ASC 740 sets forth a minimum threshold for financial statement recognition of the benefit of a tax position taken or expected to be taken in a tax return. The fund did not have a liability to record for any unrecognized tax benefits in the accompanying financial statements. No provision has been made for federal taxes on income, capital gains or unrealized appreciation on securities held nor for excise tax on income and capital gains. Each of the fund’s federal tax returns for the prior three fiscal years remains subject to examination by the Internal Revenue Service.
The fund may also be subject to taxes imposed by governments of countries in which it invests. Such taxes are generally based on either income or gains earned or repatriated. The fund accrues and applies such taxes to net investment income, net realized gains and net unrealized gains as income and/or capital gains are earned. In some cases, the fund may be entitled to reclaim all or a portion of such taxes, and such reclaim amounts, if any, are reflected as an asset on the fund’s books. In many cases, however, the fund may not receive such amounts for an extended period of time, depending on the country of investment.
Distributions to shareholders Distributions to shareholders from net investment income are recorded by the fund on the ex-dividend date. Distributions from capital gains, if any, are recorded on the ex-dividend date and paid at least annually. The amount and character of income and gains to be distributed are determined in accordance with income tax regulations, which may differ from generally accepted accounting principles. These differences include temporary and/or permanent differences from losses on wash sale transactions, foreign currency gains and losses, unrealized gains and losses on certain futures contracts, income on swap contracts
Dynamic Asset Allocation Conservative Fund 105
and interest-only securities. Reclassifications are made to the fund’s capital accounts to reflect income and gains available for distribution (or available capital loss carryovers) under income tax regulations. At the close of the reporting period, the fund reclassified $728,218 to decrease undistributed net investment income, $220 to increase paid-in capital and $727,998 to increase accumulated net realized gain.
Tax cost of investments includes adjustments to net unrealized appreciation (depreciation) which may not neces-sarily be final tax cost basis adjustments, but closely approximate the tax basis unrealized gains and losses that may be realized and distributed to shareholders. The tax basis components of distributable earnings and the federal tax cost as of the close of the reporting period were as follows:
Unrealized appreciation $97,929,847
Unrealized depreciation (34,155,821 )
Net unrealized appreciation 63,774,026
Undistributed ordinary income 13,968,498
Undistributed long-term gain 27,087,474
Cost for federal income tax purposes $1,061,491,066
For the fiscal year ended September 30, 2017, the fund had undistributed net investment income of $12,362,651.
Expenses of the Trust Expenses directly charged or attributable to any fund will be paid from the assets of that fund. Generally, expenses of the Trust will be allocated among and charged to the assets of each fund on a basis that the Trustees deem fair and equitable, which may be based on the relative assets of each fund or the nature of the services performed and relative applicability to each fund.
Note 2: Management fee, administrative services and other transactionsThe fund pays Putnam Management a management fee (based on the fund’s average net assets and computed and paid monthly) at annual rates that may vary based on the average of the aggregate net assets of all open-end mutual funds sponsored by Putnam Management (excluding net assets of funds that are invested in, or that are invested in by, other Putnam funds to the extent necessary to avoid “double counting” of those assets). Such annual rates may vary as follows:
0.680 % of the first $5 billion,
0.630 % of the next $5 billion,
0.580 % of the next $10 billion,
0.530 % of the next $10 billion,
0.480 % of the next $50 billion,
0.460 % of the next $50 billion,
0.450 % of the next $100 billion and
0.445 % of any excess thereafter.
For the reporting period, the management fee represented an effective rate (excluding the impact from any expense waivers in effect) of 0.522% of the fund’s average net assets.
Putnam Management has contractually agreed, through January 30, 2020, to waive fees and/or reimburse the fund’s expenses to the extent necessary to limit the cumulative expenses of the fund, exclusive of brokerage, interest, taxes, investment-related expenses, extraordinary expenses, acquired fund fees and expenses and payments under the fund’s investor servicing contract, investment management contract and distribution plans, on a fiscal year-to-date basis to an annual rate of 0.20% of the fund’s average net assets over such fiscal year-to-date period. During the reporting period, the fund’s expenses were not reduced as a result of this limit.
Putnam Investments Limited (PIL), an affiliate of Putnam Management, is authorized by the Trustees to manage a separate portion of the assets of the fund as determined by Putnam Management from time to time. PIL did not manage any portion of the assets of the fund during the reporting period. If Putnam Management were to engage the services of PIL, Putnam Management would pay a quarterly sub-management fee to PIL for its services at an annual rate of 0.35% of the average net assets of the portion of the fund managed by PIL.
The Putnam Advisory Company, LLC (PAC), an affiliate of Putnam Management, is authorized by the Trustees to manage a separate portion of the assets of the fund, as designated from time to time by Putnam Management or PIL. PAC did not manage any portion of the assets of the fund during the reporting period. If Putnam Management or PIL were to engage the services of PAC, Putnam Management or PIL, as applicable, would pay a quarterly sub-advisory fee to PAC for its services at the annual rate of 0.35% of the average net assets of the portion of the fund’s assets for which PAC is engaged as sub-adviser.
106 Dynamic Asset Allocation Conservative Fund
During the reporting period, Putnam Management reimbursed the fund $3,101 for certain trades in connection with a settlement with the SEC. The effect of the reimbursement by Putnam Management of such amount had no material impact on total return.
The fund reimburses Putnam Management an allocated amount for the compensation and related expenses of certain officers of the fund and their staff who provide administrative services to the fund. The aggregate amount of all such reimbursements is determined annually by the Trustees.
Custodial functions for the fund’s assets are provided by State Street. Custody fees are based on the fund’s asset level, the number of its security holdings and transaction volumes.
Putnam Investor Services, Inc., an affiliate of Putnam Management, provides investor servicing agent functions to the fund. Putnam Investor Services, Inc. received fees for investor servicing for class A, class B, class C, class M, class R and class Y shares that included (1) a per account fee for each direct and underlying non-defined contribu-tion account (retail account) of the fund; (2) a specified rate of the fund’s assets attributable to defined contribu-tion plan accounts; and (3) a specified rate based on the average net assets in retail accounts. Putnam Investor Services, Inc. has agreed that the aggregate investor servicing fees for each fund’s retail and defined contribution accounts for these share classes will not exceed an annual rate of 0.25% of the fund’s average assets attributable to such accounts.
Class P shares paid a monthly fee based on the average net assets of class P shares at an annual rate of 0.01%.
Class R5 shares paid a monthly fee based on the average net assets of class R5 shares at an annual rate of 0.12%.
Class R6 shares paid a monthly fee based on the average net assets of class R6 shares at an annual rate of 0.05%.
During the reporting period, the expenses for each class of shares related to investor servicing fees were as follows:
Class A $755,445
Class B 27,103
Class C 198,908
Class M 12,605
Class P 10,591
Class R 16,896
Class R5 7,113
Class R6 60,183
Class Y 358,341
Total $1,447,185
The fund has entered into expense offset arrangements with Putnam Investor Services, Inc. and State Street whereby Putnam Investor Services, Inc.’s and State Street’s fees are reduced by credits allowed on cash balances. The fund also reduced expenses through brokerage/service arrangements. For the reporting period, the fund’s expenses were reduced by $5,772 under the expense offset arrangements and by $3,637 under the brokerage/service arrangements.
Each Independent Trustee of the fund receives an annual Trustee fee, of which $811, as a quarterly retainer, has been allocated to the fund, and an additional fee for each Trustees meeting attended. Trustees also are reimbursed for expenses they incur relating to their services as Trustees.
The fund has adopted a Trustee Fee Deferral Plan (the Deferral Plan) which allows the Trustees to defer the receipt of all or a portion of Trustees fees payable on or after July 1, 1995. The deferred fees remain invested in certain Putnam funds until distribution in accordance with the Deferral Plan.
The fund has adopted an unfunded noncontributory defined benefit pension plan (the Pension Plan) covering all Trustees of the fund who have served as a Trustee for at least five years and were first elected prior to 2004. Benefits under the Pension Plan are equal to 50% of the Trustee’s average annual attendance and retainer fees for the three years ended December 31, 2005. The retirement benefit is payable during a Trustee’s lifetime, beginning the year following retirement, for the number of years of service through December 31, 2006. Pension expense for the fund is included in Trustee compensation and expenses in the Statement of operations. Accrued pension liability is included in Payable for Trustee compensation and expenses in the Statement of assets and liabilities. The Trustees have terminated the Pension Plan with respect to any Trustee first elected after 2003.
The fund has adopted distribution plans (the Plans) with respect to the following share classes pursuant to Rule 12b–1 under the Investment Company Act of 1940. The purpose of the Plans is to compensate Putnam Retail Management Limited Partnership, an indirect wholly-owned subsidiary of Putnam Investments, LLC, for services provided and expenses incurred in distributing shares of the fund. The Plans provide payments by the fund to Putnam Retail Management Limited Partnership at an annual rate of up to the following amounts (Maximum %)
Dynamic Asset Allocation Conservative Fund 107
of the average net assets attributable to each class. The Trustees have approved payment by the fund at the following annual rate (Approved %) of the average net assets attributable to each class. During the reporting period, the class-specific expenses related to distribution fees were as follows:
Maximum % Approved % Amount
Class A 0.35 % 0.25 % $1,223,625
Class B 1.00 % 1.00 % 175,607
Class C 1.00 % 1.00 % 1,288,516
Class M 1.00 % 0.75 % 61,253
Class R 1.00 % 0.50 % 54,762
Total $2,803,763
For the reporting period, Putnam Retail Management Limited Partnership, acting as underwriter, received net commissions of $96,783 and $2,341 from the sale of class A and class M shares, respectively, and received $6,418 and $5,904 in contingent deferred sales charges from redemptions of class B and class C shares, respectively.
A deferred sales charge of up to 1.00% is assessed on certain redemptions of class A shares. For the reporting period, Putnam Retail Management Limited Partnership, acting as underwriter, received $153 on class A redemptions.
Note 3: Purchases and sales of securitiesDuring the reporting period, the cost of purchases and the proceeds from sales, excluding short-term investments, were as follows:
Cost of purchases Proceeds from sales
Investments in securities, including TBA commitments (Long-term ) $1,692,389,490 $1,710,230,230
U.S. government securities (Long-term ) — —
Total $1,692,389,490 $1,710,230,230
The fund may purchase or sell investments from or to other Putnam funds in the ordinary course of business, which can reduce the fund’s transaction costs, at prices determined in accordance with SEC requirements and policies approved by the Trustees. During the reporting period, purchases or sales of long-term securities from or to other Putnam funds, if any, did not represent more than 5% of the fund’s total cost of purchases and/or total proceeds from sales.
Note 4: Capital sharesAt the close of the reporting period, there were an unlimited number of shares of beneficial interest autho-rized. Transactions, including, if applicable, direct exchanges pursuant to share conversions, in capital shares were as follows:
YEAR ENDED 9/30/18 YEAR ENDED 9/30/17
Class A Shares Amount Shares Amount
Shares sold 8,381,885 $90,360,389 8,586,465 $89,488,138
Shares issued in connection with reinvestment of distributions 1,071,567 11,622,526 954,798 9,880,273
Putnam Short Term Investment Fund * * 135,891,108 266,183,390 303,986,471 2,154,661 98,088,027
Total Short-term investments $143,903,433 $342,860,782 $388,017,138 $2,260,338 $98,747,077
* No management fees are charged to Putnam Cash Collateral Pool, LLC (Note 1). Investment income shown is included in securities lending income on the Statement of operations. There were no realized or unrealized gains or losses during the period.
** Management fees charged to Putnam Short Term Investment Fund have been waived by Putnam Management. There were no realized or unrealized gains or losses during the period.
110 Dynamic Asset Allocation Conservative Fund
Note 6: Market, credit and other risksIn the normal course of business, the fund trades financial instruments and enters into financial transactions where risk of potential loss exists due to changes in the market (market risk) or failure of the contracting party to the transaction to perform (credit risk). The fund may be exposed to additional credit risk that an institution or other entity with which the fund has unsettled or open transactions will default. Investments in foreign securi-ties involve certain risks, including those related to economic instability, unfavorable political developments, and currency fluctuations. The fund may invest in higher-yielding, lower-rated bonds that may have a higher rate of default. The fund may invest a significant portion of its assets in securitized debt instruments, including mortgage-backed and asset-backed investments. The yields and values of these investments are sensitive to changes in interest rates, the rate of principal payments on the underlying assets and the market’s perception of the issuers. The market for these investments may be volatile and limited, which may make them difficult to buy or sell.
Note 7: Senior loan commitmentsSenior loans are purchased or sold on a when-issued or delayed delivery basis and may be settled a month or more after the trade date, which from time to time can delay the actual investment of available cash balances; interest income is accrued based on the terms of the securities. Senior loans can be acquired through an agent, by assignment from another holder of the loan, or as a participation interest in another holder’s portion of the loan. When the fund invests in a loan or participation, the fund is subject to the risk that an intermediate partici-pant between the fund and the borrower will fail to meet its obligations to the fund, in addition to the risk that the borrower under the loan may default on its obligations.
Note 8: Summary of derivative activityThe volume of activity for the reporting period for any derivative type that was held during the period is listed below and was based on an average of the holdings at the end of each fiscal quarter:
Payables, Net assets — Unrealized depreciation 2,226,930 *
Interest rate contracts
Receivables, Net assets — Unrealized
appreciation 282,052 *Payables, Net assets —
Unrealized depreciation 3,088,477 *
Total $5,633,292 $8,568,501
* Includes cumulative appreciation/depreciation of futures contracts and/or centrally cleared swaps as reported in the fund’s portfolio. Only current day’s variation margin is reported within the Statement of assets and liabilities.
The following is a summary of realized and change in unrealized gains or losses of derivative instruments in the Statement of operations for the reporting period (Note 1):
Amount of realized gain or (loss ) on derivatives recognized in net gain or (loss ) on investmentsDerivatives not accounted for as hedging instruments under ASC 815 Options Futures
Total $(243,275 ) $(18,052,732 ) $(2,680,688 ) $1,003,186 $(19,973,509 )
Change in unrealized appreciation or (depreciation ) on derivatives recognized in net gain or (loss ) on investmentsDerivatives not accounted for as hedging instruments under ASC 815 Warrants Options Futures
Dynamic Asset Allocation Conservative Fund 113 112 Dynamic Asset Allocation Conservative Fund
Note 9: Offsetting of financial and derivative assets and liabilitiesThe following table summarizes any derivatives, repurchase agreements and reverse repurchase agreements, at the end of the reporting period, that are subject to an enforceable master netting agreement or similar agree-ment. For securities lending transactions or borrowing transactions associated with securities sold short, if any, see Note 1. For financial reporting purposes, the fund does not offset financial assets and financial liabilities that are subject to the master netting agreements in the Statement of assets and liabilities.
* Excludes premiums, if any. Included in unrealized appreciation and depreciation on OTC swap contracts on the Statement of assets and liabilities.
** Included with Investments in securities on the Statement of assets and liabilities.
† Additional collateral may be required from certain brokers based on individual agreements.
# Covered by master netting agreement (Note 1).
## Any over-collateralization of total financial and derivative net assets is not shown. Collateral may include amounts related to unsettled agreements.
§ Includes current day’s variation margin only as reported on the Statement of assets and liabilities, which is not collateralized. Cumulative appreciation/(depreciation) for futures contracts and centrally cleared swap contracts is represented in the tables listed after the fund’s portfolio. Collateral pledged for initial margin on futures contracts and centrally cleared swap contracts, which is not included in the table above, amounted to $10,182,017 and $1,436,496, respectively.
Note 10: New accounting pronouncementsIn March 2017, the Financial Accounting Standards Board issued Accounting Standards Update (ASU) No. 2017–08, Receivables — Nonrefundable Fees and Other Costs (Subtopic 310–20): Premium Amortization on Purchased Callable Debt Securities. The amendments in the ASU shorten the amortization period for certain callable debt securities held at a premium, to be amortized to the earliest call date. The ASU is effective for fiscal years and interim periods within those fiscal years beginning after December 15, 2018. Management is currently evaluating the impact, if any, of applying this provision.
116 Dynamic Asset Allocation Conservative Fund
Federal tax information (Unaudited)
Pursuant to §852 of the Internal Revenue Code, as amended, the fund hereby designates $29,873,764 as a capital gain dividend with respect to the taxable year ended September 30, 2018, or, if subsequently determined to be different, the net capital gain of such year.
The fund designated 30.69% of ordinary income distributions as qualifying for the dividends received deduction for corporations.
For the reporting period, the fund hereby designates 44.68%, or the maximum amount allow-able, of its taxable ordinary income distributions as qualified dividends taxed at the individual net capital gain rates.
For the reporting period, pursuant to §871(k) of the Internal Revenue Code, the fund hereby desig-nates $15,316,345 of distributions paid as qualifying to be taxed as interest-related dividends, and $1,521,552 to be taxed as short-term capital gain dividends for nonresident alien shareholders.
The Form 1099 that will be mailed to you in January 2019 will show the tax status of all distributions paid to your account in calendar 2018.
About the TrusteesINDEPENDENT TRUSTEES
Liaquat Ahamed Born 1952, Trustee since 2012Principal occupations during past five years: Pulitzer Prize-winning author of Lords of Finance: The Bankers Who
Broke the World, whose articles on economics have appeared in such publications as the New York Times, Foreign Affairs, and the Financial Times. Trustee of the Brookings Institution.
Other directorships: The Rohatyn Group, an emerging-market fund complex that manages money for institutions
Ravi AkhouryBorn 1947, Trustee since 2009Principal occupations during past five years: Trustee of the Rubin Museum. From 1992 to 2007, was Chairman and
CEO of MacKay Shields, a multi-product investment management firm.
Other directorships: English Helper, Inc., a private software company
Barbara M. Baumann Born 1955, Trustee since 2010Principal occupations during past five years: President and Owner of Cross Creek Energy Corporation, a strategic
consultant to domestic energy firms and direct investor in energy projects. Current Board member of The Denver Foundation. Former Chair and current Board member of Girls Incorporated of Metro Denver. Member of the Finance Committee, the Children’s Hospital of Colorado.
Other directorships: Buckeye Partners, L.P., a publicly traded master limited partnership focused on pipeline transport, storage, and distribution of petroleum products; Devon Energy Corporation, a leading independent natural gas and oil exploration and production company
Katinka DomotorffyBorn 1975, Trustee since 2012Principal occupations during past five years: Voting member of the Investment Committees of the Anne Ray Charitable
Trust and Margaret A. Cargill Foundation, part of the Margaret A. Cargill Philanthropies. Until 2011, Partner, Chief Investment Officer, and Global Head of Quantitative Investment Strategies at Goldman Sachs Asset Management.
Other directorships: Great Lakes Science Center; College Now Greater Cleveland
Catharine Bond HillBorn 1954, Trustee since 2017Principal occupations during past five years: Managing Director of Ithaka S+R, a not-for-profit service that helps
the academic community navigate economic and technological change. From 2006 to 2016, served as the 10th President of Vassar College. Prior to 2006, was Provost of Williams College.
Other directorships: Director of Yale-NUS College; Alumni Fellow to the Yale Corporation
Dr. Paul L. JoskowBorn 1947, Trustee since 1997Principal occupations during past five years: Elizabeth and James Killian Professor of Economics, Emeritus at the
Massachusetts Institute of Technology (MIT). Until 2017, President of the Alfred P. Sloan Foundation, a philanthropic institution focused primarily on research and education issues related to science, technology, and economic performance. Prior to 2007, served as the Director of the Center for Energy and Environmental Policy Research at MIT. Prior to 1998, served as Head of the Department of Economics at MIT.
Other directorships: Yale University; Exelon Corporation, an energy company focused on power services; Boston Symphony Orchestra; Prior to April 2013, served as Director of TransCanada Corporation and TransCanada Pipelines Ltd., energy companies focused on natural gas transmission, oil pipelines and power services
Dynamic Asset Allocation Conservative Fund 117
Kenneth R. LeiblerBorn 1949, Trustee since 2006 Vice Chair from 2016 to 2018, and Chair since 2018Principal occupations during past
five years: Founder and former Chairman of Boston Options Exchange, an electronic marketplace for the trading of derivative securities. Vice Chair Emeritus of the Board of Trustees of Beth Israel Deaconess Hospital in Boston, Massachusetts, and former Director of Beth Israel Deaconess Care Organization. Until November 2010, Director of Ruder Finn Group, a global communications and advertising firm.
Other directorships: Eversource Corporation, which operates New England’s largest energy delivery system
Robert E. PattersonBorn 1945, Trustee since 1984Principal occupations during past five years: Co-Chairman of Cabot Properties, Inc., a private equity firm
investing in commercial real estate, and Chairman or Co-Chairman of the Investment Committees for various Cabot Funds. Past Chairman and Trustee of the Joslin Diabetes Center.
George Putnam, IIIBorn 1951, Trustee since 1984Principal occupations during past five years: Chairman of New Generation Research, Inc., a publisher of financial
advisory and other research services. Founder and President of New Generation Advisors, LLC, a registered investment advisor to private funds. Director of The Boston Family Office, LLC, a registered investment advisor.
Manoj P. SinghBorn 1952, Trustee since 2017Principal occupations during past five years: Until 2015, Chief Operating Officer and Global Managing Director at
Deloitte Touche Tohmatsu, Ltd., a global professional services organization. Served on the Deloitte U.S. Board of Directors and the boards of Deloitte member firms in China, Mexico, and Southeast Asia.
Other directorships: Director of Abt Associates, a global research firm focused on health, social and environmental policy, and international development. Trustee of Carnegie Mellon University. Trustee of Rubin Museum of Art. Director of Pratham USA, an organization dedicated to children’s education in India. Member of the Advisory Board of Altimetrik, a business transformation and technology solutions firm. Director of DXC Technology, a global IT services and consulting company
INTERESTED TRUSTEE
Robert L. Reynolds*
Born 1952, Trustee since 2008 and President of the Putnam Funds since 2009
Principal occupations during past five years: President and Chief Executive
Officer of Putnam Investments since 2008 and, since 2014, President and Chief Executive Officer of Great-West Financial, a financial services company that provides retirement savings plans, life insurance, and annuity and executive benefits products, and of Great-West Lifeco U.S. Inc., a holding company that owns Putnam Investments and Great-West Financial. Prior to joining Putnam Investments, served as Vice Chairman and Chief Operating Officer of Fidelity Investments from 2000 to 2007.
* Mr. Reynolds is an “interested person” (as defined in the Investment Company Act of 1940) of the fund and Putnam Investments. He is President and Chief Executive Officer of Putnam Investments, as well as the President of your fund and each of the other Putnam funds.
The address of each Trustee is 100 Federal Street, Boston, MA 02110.
As of September 30, 2018, there were 100 Putnam funds. All Trustees serve as Trustees of all Putnam funds.
Each Trustee serves for an indefinite term, until his or her resignation, retirement at age 75, removal, or death.
118 Dynamic Asset Allocation Conservative Fund
The principal occupations of the officers for the past five years have been with the employers as shown above, although in some cases they have held different positions with such employers. The address of each officer is 100 Federal Street, Boston, MA 02110.
OfficersIn addition to Robert L. Reynolds, the other officers of the fund are shown below:
Jonathan S. Horwitz (Born 1955)Executive Vice President, Principal Executive Officer, and Compliance LiaisonSince 2004
Robert T. Burns (Born 1961)Vice President and Chief Legal OfficerSince 2011General Counsel, Putnam Investments, Putnam Management, and Putnam Retail Management
James F. Clark (Born 1974)Vice President and Chief Compliance OfficerSince 2016Chief Compliance Officer, Putnam Investmentsand Putnam Management
Michael J. Higgins (Born 1976)Vice President, Treasurer, and ClerkSince 2010
Janet C. Smith (Born 1965)Vice President, Principal Financial Officer, Principal Accounting Officer, and Assistant TreasurerSince 2007Head of Fund Administration Services, Putnam Investments and Putnam Management
Susan G. Malloy (Born 1957)Vice President and Assistant TreasurerSince 2007Head of Accounting, Middle Office, & Control Services, Putnam Investments and Putnam Management
Mark C. Trenchard (Born 1962)Vice President and BSA Compliance OfficerSince 2002Director of Operational Compliance, Putnam Investments and Putnam Retail Management
Nancy E. Florek (Born 1957)Vice President, Director of Proxy Voting and Corporate Governance, Assistant Clerk, and Assistant TreasurerSince 2000
Denere P. Poulack (Born 1968)Assistant Vice President, Assistant Clerk, and Assistant TreasurerSince 2004
Dynamic Asset Allocation Conservative Fund 119
120 Dynamic Asset Allocation Conservative Fund
Putnam family of fundsThe following is a list of Putnam’s open-end mutual funds offered to the public. Investors should carefully consider the investment objective, risks, charges, and expenses of a fund before investing. For a prospectus, or a summary prospectus if available, containing this and other information for any Putnam fund or product, contact your financial advisor or call Putnam Investor Services at 1-800-225-1581. Please read the prospectus carefully before investing.
BlendCapital Spectrum FundEmerging Markets Equity FundEquity Spectrum FundEurope Equity FundGlobal Equity FundInternational Capital Opportunities FundInternational Equity FundMulti-Cap Core FundResearch Fund
Global SectorGlobal Consumer FundGlobal Financials FundGlobal Health Care FundGlobal Industrials FundGlobal Natural Resources FundGlobal Sector FundGlobal Technology FundGlobal Telecommunications FundGlobal Utilities Fund
GrowthGrowth Opportunities FundInternational Growth FundSmall Cap Growth FundSustainable Future FundSustainable Leaders Fund
ValueConvertible Securities FundEquity Income FundInternational Value Fund Small Cap Value Fund
IncomeDiversified Income TrustEmerging Markets Income FundFloating Rate Income FundGlobal Income TrustGovernment Money Market Fund*
High Yield FundIncome FundMoney Market Fund†
Mortgage Securities FundShort Duration Bond FundShort Duration Income Fund
Tax-free IncomeAMT-Free Municipal FundIntermediate-Term Municipal Income FundShort-Term Municipal Income FundTax Exempt Income FundTax-Free High Yield Fund
State tax-free income funds‡: California, Massachusetts, Minnesota, New Jersey, New York, Ohio, and Pennsylvania.
Dynamic Asset Allocation Conservative Fund 121
Absolute ReturnFixed Income Absolute Return FundMulti-Asset Absolute Return Fund
RetirementReady® 2060 Fund RetirementReady® 2055 FundRetirementReady® 2050 FundRetirementReady® 2045 FundRetirementReady® 2040 FundRetirementReady® 2035 FundRetirementReady® 2030 FundRetirementReady® 2025 FundRetirementReady® 2020 Fund
* You could lose money by investing in the fund. Although the fund seeks to preserve the value of your investment at $1.00 per share, it cannot guarantee it will do so. An investment in the fund is not insured or guaranteed by the Federal Deposit Insurance Corporation or any other government agency. The fund’s sponsor has no legal obligation to provide financial support to the fund, and you should not expect that the sponsor will provide financial support to the fund at any time.
† You could lose money by investing in the fund. Although the fund seeks to preserve the value of your investment at $1.00 per share, it cannot guarantee it will do so. The fund may impose a fee upon sale of your shares or may temporarily suspend your ability to sell shares if the fund’s liquidity falls below required minimums because of market conditions or other factors. An investment in the fund is not insured or guaranteed by the Federal Deposit Insurance Corporation or any other government agency. The fund’s sponsor has no legal obligation to provide financial support to the fund, and you should not expect that the sponsor will provide financial support to the fund at any time.
‡ Not available in all states.
** Sub-advised by PanAgora Asset Management.Check your account balances and the most recent month-end performance in the Individual Investors section at putnam.com.
122 Dynamic Asset Allocation Conservative Fund
Services for shareholders
Investor services
Systematic investment plan Tell us how much you wish to invest regularly — weekly, semimonthly, or monthly — and the amount you choose will be transferred automatically from your checking or savings account. There’s no additional fee for this service, and you can suspend it at any time. This plan may be a great way to save for college expenses or to plan for your retirement.
Please note that regular investing does not guarantee a profit or protect against loss in a declining market. Before arranging a system-atic investment plan, consider your financial ability to continue making purchases in periods when prices are low.
Systematic exchange You can make regular transfers from one Putnam fund to another Putnam fund. There are no additional fees for this service, and you can cancel or change your options at any time.
Dividends PLUS You can choose to have the dividend distributions from one of your Putnam funds automatically reinvested in another Putnam fund at no additional charge.
Free exchange privilege You can exchange money between Putnam funds free of charge, as long as they are the same class of shares. A signature guarantee is required if you are exchanging more than $500,000. The fund reserves the right to revise or terminate the exchange privilege.
Reinstatement privilege If you’ve sold Putnam shares or received a check for a divi-dend or capital gain, you may reinvest the proceeds with Putnam within 90 days of the
transaction and they will be reinvested at the fund’s current net asset value — with no sales charge. However, reinstatement of class B shares may have special tax consequences. Ask your financial or tax representative for details.
Check-writing service You have ready access to many Putnam accounts. It’s as simple as writing a check, and there are no special fees or service charges. For more information about the check-writing service, call Putnam or visit our website.
Dollar cost averaging When you’re investing for long-term goals, it’s time, not timing, that counts. Investing on a systematic basis is a better strategy than trying to figure out when the markets will go up or down. This means investing the same amount of money regularly over a long period. This method of investing is called dollar cost averaging. When a fund’s share price declines, your investment dollars buy more shares at lower prices. When it increases, they buy fewer shares. Over time, you will pay a lower average price per share.
For more information
Visit the Individual Investors section at putnam.com A secure section of our website contains complete information on your account, including balances and transac-tions, updated daily. You may also conduct transactions, such as exchanges, additional investments, and address changes. Log on today to get your password.
Call us toll free at 1-800-225-1581 Ask a helpful Putnam representative or your financial advisor for details about any of these or other services, or see your prospectus.
Fund informationFounded over 80 years ago, Putnam Investments was built around the concept that a balance between risk and reward is the hallmark of a well-rounded financial program. We manage funds across income, value, blend, growth, sustainable, asset allocation, absolute return, and global sector categories.
Investment ManagerPutnam Investment Management, LLC 100 Federal Street Boston, MA 02110
Investment Sub-AdvisorsPutnam Investments Limited 16 St James’s Street London, England SW1A 1ER
The Putnam Advisory Company, LLC 100 Federal Street Boston, MA 02110
Marketing ServicesPutnam Retail Management 100 Federal Street Boston, MA 02110
CustodianState Street Bank and Trust Company
Legal CounselRopes & Gray LLP
Independent Registered Public Accounting FirmPricewaterhouseCoopers LLP
TrusteesKenneth R. Leibler, Chair Liaquat Ahamed Ravi Akhoury Barbara M. Baumann Katinka Domotorffy Catharine Bond Hill Paul L. Joskow Robert E. Patterson George Putnam, III Robert L. Reynolds Manoj P. Singh
OfficersRobert L. Reynolds President
Jonathan S. Horwitz Executive Vice President, Principal Executive Officer, and Compliance Liaison
Robert T. Burns Vice President and Chief Legal Officer
James F. Clark Vice President and Chief Compliance Officer
Michael J. Higgins Vice President, Treasurer, and Clerk
Janet C. Smith Vice President, Principal Financial Officer, Principal Accounting Officer, and Assistant Treasurer
Susan G. Malloy Vice President and Assistant Treasurer
Mark C. Trenchard Vice President and BSA Compliance Officer
Nancy E. Florek Vice President, Director of Proxy Voting and Corporate Governance, Assistant Clerk, and Assistant Treasurer
Denere P. Poulack Assistant Vice President, Assistant Clerk, and Assistant Treasurer
Dynamic Asset Allocation Conservative Fund 123
This report is for the information of shareholders of Putnam Dynamic Asset Allocation Conservative Fund. It may also be used as sales literature when preceded or accompanied by the current prospectus, the most recent copy of Putnam’s Quarterly Performance Summary, and Putnam’s Quarterly Ranking Summary. For more recent performance, please visit putnam.com. Investors should carefully consider the investment objectives, risks, charges, and expenses of a fund, which are described in its prospectus. For this and other information or to request a prospectus or summary prospectus, call 1-800-225-1581 toll free. Please read the prospectus carefully before investing. The fund’s Statement of Additional Information contains additional information about the fund’s Trustees and is available without charge upon request by calling 1-800-225-1581.