Page 1
1
Dynamic behaviour of unstiffened stainless steel profiled barrier blast walls
Mohammad H. Hedayati1, Srinivas Sriramula2 and Richard D. Neilson3
1PhD Student, School of Engineering, University of Aberdeen, UK; e-mail:
[email protected]
2Lloyd’s Register Foundation (LRF) Centre for Safety and Reliability Engineering, School of
Engineering, University of Aberdeen, UK; e-mail: [email protected]
3School of Engineering, University of Aberdeen, UK; e-mail: [email protected]
Abstract:
Performing optimum design, reliable assessment or suitable verification for stainless steel
profiled barrier blast wall structures requires dealing with various challenges, stemming from
the associated uncertainties in material properties, fabrication, installation, and more
importantly variations in the blast load characteristics. In the analysis, assessment, and design
of these blast walls, one of the key areas to be appreciated and understood is the dynamic
response of these structures. This paper presents a methodology developed for identifying the
predominant structural behaviour and characteristics of profiled barrier blast wall structures,
using a probabilistic approach. Twenty parametric base models are developed using Ansys
and by implementing a Latin Hypercube Sampling (LHS) approach, the section properties of
the models are represented in terms of probability distributions. A number of models are
generated stochastically and modal analyses performed to identify the dynamic sensitivity of
these models. The corresponding response classification of these structures is evaluated from
the load duration and natural periods of the structures. The results of the study confirm that
structural response, for the wide range of profiled blast walls analysed, is mainly quasi-static
or static, as opposed to dynamic. In fact, dynamic effects are negligible for unstiffened
Page 2
2
profiled barrier blast walls and structural responses in most cases can be estimated on a static
or quasi-static basis. This conclusion would help a competent design engineer to consider a
proper dynamic load factor at an early stage of the design, without involving complex
advanced nonlinear dynamic analyses.
Keywords: Stainless steel blast walls; Unstiffened profiled barriers; Modal analysis;
Probabilistic analysis; Ansys; Latin Hypercube Sampling. Abbreviations
ABS: American Bureau of Shipping
APDL: ANSYS Parametric Design Language
API: American Petroleum Institute
ASD: Allowable Stress Design
CDF: Cumulative Density Function
DAF: Dynamic Amplification Factor
DLF: Dynamic Load Factor
DNV: Det Norske Veritas
FABIG: Fire and Blast Information Group
FEA: Finite Element Analysis
LHS: Latin Hypercube Sampling
LRFD: Load and Resistance Factor Design
MCS: Monte Carlo Simulation
MDOF: Multi Degree of Freedom
NLFEA: Nonlinear Finite Element Analysis
SDOF: Single Degree of Freedom
TN: Technical Note
Page 3
3
Nomenclature
n × k : matrix of input variables
L1, L2, L3, S, L and H: the section geometry of blast wall
P0 : peak dynamic pressure
: time
T : Natural period of structure
: duration of applied load
Tw: thickness of blast wall
Θ: section angle
1 Introduction and Background
Compared to other possible ways of protection against explosions, blast walls have
lower cost/strength ratio and can be installed very quickly (Haifu and Xueguang 2009). Blast
wall structures can be formed of stiffened or unstiffened panels; however, stainless steel
profiled walls have increasingly been used in the offshore industry because of their excellent
energy absorption and temperature dependent properties (Brewerton and FABIG TN5. 1999;
Louca and Boh 2004).
In general, when considering the deterministic response of profiled barrier structures,
two approaches are usually recommended for the design: the traditional Single Degree of
Freedom (SDOF) approach or the more sophisticated Multi Degree of Freedom (MDOF)
approach. The simplified SDOF approach is widely used in the offshore industry for
predicting the dynamic structural response by implementing the Biggs method (Biggs 1964).
This is a simple approach which idealizes the actual structure as a spring/mass model and is
thus very useful in routine design procedures to obtain accurate results for relatively simple
Page 4
4
structures with limited ductility (Louca and Boh 2004). The SDOF approach is a useful
technique for conceptual or basic design of the profiled barrier structures under explosion
loadings, whereas, the MDOF method, which is typically based on a Finite Element Analysis
(FEA) approach, provides a detailed analysis of the blast wall and is more accurate when
compared to the SDOF approach, but is computationally very intensive and, as a result, more
expensive. However, with recent developments in computing technology, performing FEA is
easier and faster than it was in the past. There have also been some preliminary studies to
verify SDOF results against MDOF results (Liang et al. 2007). Nonlinear FEA (NLFEA) can
be used to overcome the limitations of normally implemented analytical methods which have
mostly been developed to study elastic response or some specific plastic response and do not
allow for large deformations and unstable responses. In addition, the use of NLFEA can
prepare the way for a more rigorous performance-based blast resistant design or assessment,
since the current principles as set out in the design guides cannot be fully adequate.(Boh et al.
2007). One of the main benefits of using the NLFEA approach is to capture local effects and
to take into account buckling failure modes in the analyses and assessments. A study was
carried out by Sun and Spencer (2005) on the buckling strength assessment of corrugated
panels. They noticed that the most efficient way to enhance the buckling strength of
corrugated panels is to increase the trough depth. The results also confirm that the
recommended approach and formulas developed within the ABS guidelines (ABS. 2005;
ABS. 2004) have suitable conservatisms for the buckling strength assessment and the FEA
method with the correct boundary conditions gives more realistic results than the guidelines.
Another study was performed by Czujko and Paik (2015), on the structural damage and
robustness of blast walls designed for topside platforms. They highlighted that the use of
precise analysis methods, such as NLFEA should allow optimisation of the design and to
have proper required strengthening for the blast walls. They supported their study by
Page 5
5
implementing detailed non-linear finite element (FE) analysis, including static and dynamic
assessments.
As another example, a further study was conducted by Sohn et al. (2016),
investigating the effects of stiffeners to reduce the probability of having local failures. They
concluded that a flat stiffener can be located in the buckling regions to improve the buckling
strength of blast walls. There have been various studies performed to investigate the local
failures, including buckling, of stainless steel profiled sections. Many of these studies have
also confirmed that using the developed equations in guidelines can lead to conservative or
unrealistic strength and stability predictions (e.g., (Hancock et al. 1990)) and therefore, a
realistic finite element analysis would be advantageous and is recommended.
Although it is found that using a finite element approach has various benefits to
perform probabilistic and reliability analyses, care should be taken while using this approach.
One useful approach would be to advance the developments step by step, in such a way that
each stage can be checked properly or compared with other stages if it is required. Therefore,
with regard to this, a preliminary static finite element probabilistic approach on profiled
barrier blast walls was undertaken by two of the authors (Hedyati and Sriramula 2012). The
study was then extended by considering the dynamic effects and nonlinearities in geometric
and material properties (Hedayati et al. 2013). It was noticed that considering the dynamic
and non-linearity effects, the correlation sensitivity results are not similar at different time
steps in the blast simulation. This study resulted in further investigations on using linear
dynamic analysis, without implementing any non-linearity effects, to review and understand
the linear dynamic behaviour of these structures under explosion loading (Hedayati et al.
2014). The sensitivity results of this study confirmed that the maximum response is not
sensitive to duration of loading, indicating that the response of the structure is less dynamic.
In the previous studies associated with this research, it was found that performing linear, non-
Page 6
6
linear, static, and dynamic analyses are crucial to assess the relative importance of the
dynamic and non-linearity effects while implementing reliability approach. Accordingly, it
was observed that the effects of nonlinearities are crucial to be considered in the assessments
(Hedayati et al. 2015). It was also noticed that there is no profound difference between
probabilistic responses for static and dynamic analyses, suggesting that a better realisation of
employing an appropriate dynamic load factor (DLF) is very significant. This paper therefore
presents the investigations carried out using the proposed framework, on the dynamic
behaviour sensitivity of typical profiled barrier structures, implementing a probabilistic
approach.
Initially, a parametric finite element (FE) model was developed using the ANSYS
Parametric Design Language (APDL). Twenty FE base models were developed based on
previous research by the authors. Then, by employing the verified base models, 40000 FE
representations were generated after introducing random input and output variables. As the
dynamic characteristic (i.e. natural period) of the structure is associated with the mass and
stiffness, by defining the uncertainties in different section properties as random variables, it is
possible to implement efficiently simulation strategies for assessing the dynamic structural
performance. The response parameters can be obtained by linking the simulated values with
the finite element models. In the present study, a Latin Hypercube Sampling (LHS) approach
was used to study the statistically significant results to identify the dynamic characteristics
and performance of the blast walls.
2 Design Approach for Profiled Blast Wall Structures
The Design Guide for stainless steel blast walls, known as the Technical Note 5
(TN5) (Brewerton and FABIG TN5. 1999) prepared by the Fire and Blast Information Group
(FABIG) and API Recommended Practice 2FB (API 2FB April 2006) are the two most
Page 7
7
Blast Load
L
L1 L1 L2 L3
sH
L2
θ
Tw
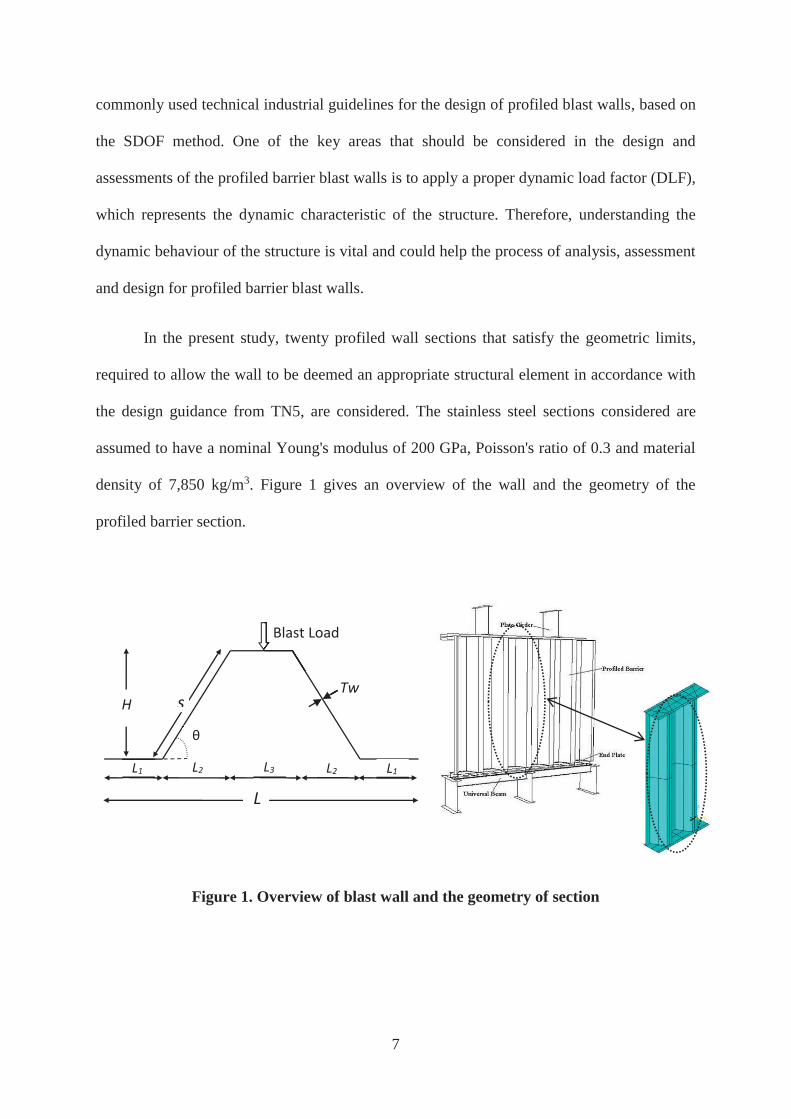
commonly used technical industrial guidelines for the design of profiled blast walls, based on
the SDOF method. One of the key areas that should be considered in the design and
assessments of the profiled barrier blast walls is to apply a proper dynamic load factor (DLF),
which represents the dynamic characteristic of the structure. Therefore, understanding the
dynamic behaviour of the structure is vital and could help the process of analysis, assessment
and design for profiled barrier blast walls.
In the present study, twenty profiled wall sections that satisfy the geometric limits,
required to allow the wall to be deemed an appropriate structural element in accordance with
the design guidance from TN5, are considered. The stainless steel sections considered are
assumed to have a nominal Young's modulus of 200 GPa, Poisson's ratio of 0.3 and material
density of 7,850 kg/m3. Figure 1 gives an overview of the wall and the geometry of the
profiled barrier section.
Figure 1. Overview of blast wall and the geometry of section
Page 8
8
3 Probabilistic Approach
Model Uncertainties and Latin Hypercube Sampling
One dominant aspect in the probabilistic assessment of profiled barrier blast walls is
to identify uncertainties, stemming from various sources, and then implement them
accurately in the associated analyses. In this study, to have a wide range of random modal
analysis models, geometric properties are introduced as the uncertainties and are considered
in the probabilistic analyses by modelling the properties as random variables represented by
probability distributions. Probabilistic analysis results can be sensitive to the tail of the
probability distribution and therefore, an appropriate approach/method to select the proper
distribution type is necessary (Det Norske Veritas 1992). In this study, for all of the random
variables, except for the profiled barrier thickness, Tw, which uses the normal or Gaussian
distribution is assumed, for demonstrative purposes.
Probabilistic analysis based on the Monte Carlo Simulation (MCS) is widely used
because of the ease of implementation, and the ability to handle complex engineering
problems. However, when probabilities of occurrence are very small, the computational effort
increases significantly. In such cases, it is possible to reduce the required number of
simulations by using an appropriate variation reduction scheme such as importance sampling,
Latin Hypercube Sampling (LHS) or directional simulation (Choi et al. 2006).
In the present study, an LHS scheme is used. A major advantage of LHS is that it
avoids repeated sample reliability evaluations (ANSYS 2012; Reh et al. 2006), thus
drastically reducing the number of simulations. LHS also considers the tails of the
distributions more accurately. This is very important for most structural engineering
applications where extreme values are important.
Page 9
9
The LHS technique was first introduced by McKay et al. (1979). Later on, further
developments were explained by other researchers, for example by Iman et al. (1981). A
typical Latin hypercube sampling selects n different values from each of the k variables X1…
Xk as per the following routine (Wyss and Jorgensen 1998):
The range of each variable is divided into n non-overlapping intervals on the basis of
equal probability.
One value from each interval is selected at random with respect to the probability
density in the interval.
The n values thus obtained for X1 are paired in a random manner (equally likely
combinations) with the n values of X2. These n pairs are combined in a random
manner with the n values of X3 to form n triplets, and so on, until n k-tuplets are
formed; these n k-tuplets are the same as the n k-dimensional input vectors.
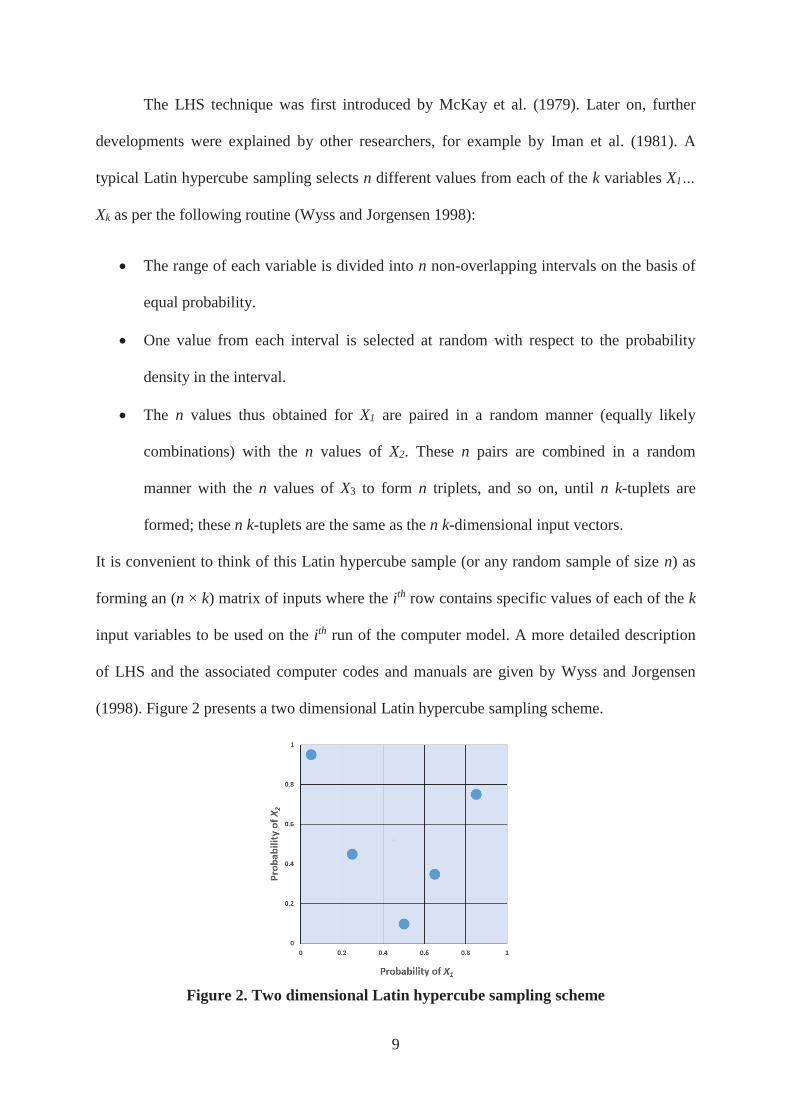
It is convenient to think of this Latin hypercube sample (or any random sample of size n) as
forming an (n × k) matrix of inputs where the ith row contains specific values of each of the k
input variables to be used on the ith run of the computer model. A more detailed description
of LHS and the associated computer codes and manuals are given by Wyss and Jorgensen
(1998). Figure 2 presents a two dimensional Latin hypercube sampling scheme.
Figure 2. Two dimensional Latin hypercube sampling scheme
Page 10
10
This scheme has been further developed for different purposes by several researchers,
e.g., Helton and Davis (2003) and Olsson et al. (2003).
Analysis Models
To investigate the dynamic behaviour of a structure, modal analysis is one of the key
analysis types to be carried out to identify the sensitivity of stiffness and mass properties of
the structure to dynamic loading properties, including duration of the loading. To expedite the
probabilistic assessment, a beam model, as oppose to a shell model or SDOF system, was
selected. The finite element beam modelling approach has sufficient accuracy for this study
as well as limiting the number of elements which results in speeding up the process for the
probabilistic analyses. Twenty finite element beam base-models of blast walls were employed
in this study: ten base models were selected from the previous studies carried out by other
researchers and another ten base models were developed by authors considering the FABIG
guidelines (i.e. the appropriate dimensions and section properties which satisfy the guideline).
It should be noted that this part of study deals purely with modal analyses, using the verified
beam models and performing probabilistic analyses to investigate dynamic performance of
unstiffened profiled barrier blast walls.
Based on FABIG TN5 (Brewerton and FABIG TN5. 1999), the section angle (θ),
shown in Figure 1, should be limited to between 45 and 90 degrees to ensure good
performance of the section and to prevent local failure. However, this limitation can be
reviewed and implemented case by case by competent engineers, as considered differently by
Schleyer et al. (2003) and Langdon and Schleyer (2006). Table 1 presents the section
properties such as thickness and dimensions, span, angle (θ) and the natural period of the
structure associated with the presented properties. Figure 3 gives an overview of the relative
section sizes for the three first models (i.e. “Model1”, “Model2”, and “Model3”) shown in the
Table 1.
Page 11
11
The twenty deterministic base-line models have six parameters that are regarded as
random input variables. These variables along with their assumed distribution models and
parameters are given in Table 2. The random input variables are assumed to be statistically
independent. Typical probability density and cumulative distribution functions of the span
and section height are shown in Figure 4. For each model, 2000 runs were randomly
generated by introducing the random input variables with the associated parametric variables
for probabilistic analyses.
The details of the upper and lower connections of the blast walls have not been
considered in the assessments, for two main reasons. Firstly, for the model verification,
developing connections using springs for the SDOF modelling or using beam elements for
the beam modelling was not practical. In fact, there would be some other uncertainties added
to the models, which are hard, or in some cases, impossible to justify. Furthermore, for the
second main part of the study, which is associated with probabilistic analyses, 40000
connections would need to be developed probabilistically resulting in more complexity as
each individual connection would need to be validated.
In this study, according to the recommendation from the Technical Note 5 (Brewerton
and FABIG TN5. 1999) and on consideration of the effective span with no upper and lower
connection details, pinned-end fixity for the two ends of structure was implemented for the
upper and lower boundary conditions. In addition, apart from the horizontal displacement
along the wall, all out-of-plane and in-plane rotations and displacement along the supporting
edge were constrained.
Page 12
12
Table 1. Mean values of geometry properties for selected and developed models
Model
Name
Tw
(mm)
L1
(mm)
L2
(mm)
L3
(mm)
H
(mm)
Span
(mm)
(Deg.)
Natural
Period Reference
Model1 11 200 320 240 554 6000 60 0.025
(Louca and Boh
2004)
Model2 9 160 160 160 200 4000 51 0.029
(Louca and Boh
2004)
Model3 2.5 62.5 40 45 45 2322 48 0.053
(Louca and Boh
2004)
Model4 2 17.5 50 85 40.5 915 39 0.010
(Schleyer and
Langdon 2003)
Model5 8 70 200 340 162 3640 39 0.031
(RW.ERROR -
Unable to find
reference:58)
Model6 9 70 128 120 160 4000 51.3 0.037 (Faruqi et al. 2010)
Model7 10 80 126 140 180 4000 55 0.032 (Faruqi et al. 2010)
Model8 11 160 46 160 260 4000 80 0.022 (Faruqi et al. 2010)
Model9 5 200 200 400 300 4850 56.3 0.030
(Brewerton and
FABIG TN5. 1999)
Model10 2.5 90 119 180 150 3000 51.6 0.027
(Wijaya and Kim
2011)
Model11 11 100 90 300 520 5500 80.2 0.023 Authors
Model12 10 100 120 260 360 5000 71.6 0.026 Authors
Model13 9 80 140 240 330 4800 67.0 0.027 Authors
Model14 8 80 135 200 280 4600 64.3 0.029 Authors
Model15 7 70 120 180 220 4000 61.4 0.028 Authors
Model16 6 70 110 170 180 3600 58.6 0.028 Authors
Model17 5 70 100 180 170 3200 59.5 0.024 Authors
Model18 4 60 90 150 145 2800 58.2 0.022 Authors
Model19 3 50 80 120 110 2500 54.0 0.025 Authors
Model20 2 20 50 70 60 2200 50.2 0.040 Authors Note: Effective mass and stiffness for these models have automatically calculated by software (ANSYS), based on finite element theories and concepts, accordingly they have not been presented.
Page 13
13
TYPE = GAUSPARM1 0.60000E+04PARM2 0.90000E+03
MEAN 0.60000E+04STDEV 0.90000E+03
0
.00005
.0001
.00015
.0002
.00025
.0003
.00035
.0004
.00045
.0005
25003750
50006250
7500
Prob. Density
X
0
.1
.2
.3
.4
.5
.6
.7
.8
.9
1
25003750
50006250
7500
Probability
X
XDistribution of Input Variable
TYPE = GAUSPARM1 0.52000E+03PARM2 0.78000E+02
MEAN 0.52000E+03STDEV 0.78000E+02
0
.0008
.0016
.0024
.0032
.004
.0048
.0056
.0064
.0072
.008
300400
500600
700
Prob. Density
H
0
.1
.2
.3
.4
.5
.6
.7
.8
.9
1
300400
500600
700
Probability
H
HDistribution of Input Variable
Model1 Model2 Model3
Figure 3. An overview of scaled-section sizes of the model 1, 2&3
Table 2. Parametric Variables for Probabilistic Analysis
Random variable
Height,
H(mm)
Thickness, Tw (mm) L1
L2
L3
Span
Coefficient of variation
0.1 ~0.1
(+/-1mm) 0.15 0.15 0.15 0.15
Probability distribution
Gaussian Uniform Gaussian Gaussian Gaussian Gaussian
Figure 4. Distribution of Span (mm) (Left) and H (mm) (Right)
Page 14
14
Modal validation
Before performing modal analyses and implementing a reliability or probabilistic
approach, the models should be verified to ensure model accuracy. There are various types of
verification methods including analytical approaches, numerical methods and physical tests.
For this study, the numerical finite element method was selected to validate the developed
finite element models. To verify each of the twenty base-models, three analysis modelling
systems comprising SDOF, Beam and Shell models were developed initially for each using
the geometry and section properties presented by Table 1. For the dynamic transient analyses,
a triangular load pulse with a peak dynamic pressure (P0) of 2.0 bar is used. The total time
duration (td) for this load pulse is 0.15 seconds. Figure 5 gives a view of the displacement
results for the three models and confirms good agreement between the results. As can be seen
from Figure 5, although there is a small shift between the results after the time of loading (i.e.
td > 0.15sec), the trend and overall behaviour of the structure is very similar with little
difference in the maximum response. The response is elastic-plastic (i.e., not fully plastic),
and as the boundary conditions for the end connections are pinned, a full plastic condition
would cause collapse and consequently a full response would not be achievable. Comparing
the results of these three modelling approach, it can be concluded that the developed
numerical finite element models presented in this study have enough accuracy for the
analysis and assessment and the SDOF or beam models can be used with little loss of
accuracy compared to the full shell model. The same approach was implemented to validate
all the twenty base models presented by Table 1.
Page 15
15
Figure 5. Comparing nonlinear dynamic responses (displacements, mm, for load duration of 2td) SDOF, Beam & Shell models – Model1
Modal Analysis and Dynamic Characteristics
It is crucial to perform modal analysis for understanding the dynamic behaviour or
characteristics of profiled barrier blast walls. In the real engineering world, engineers should
carry out a model analysis before performing dynamic analyses, to find out the dynamic
sensitivity of the structure. In this study, modal analyses were carried out for all randomly
developed finite element models, to identify natural period of structure (T). The ratio of td to
T (i.e. td/T) is a parameter to identify dynamic behaviour of profiled barrier blast wall
structure and so this ratio was then investigated as the main parameter to classify whether the
response of the wall was classified as impulse, dynamic, quasi static, or static.
The fundamental natural period of a blast wall is the longest natural period at which
the structure will respond to any impulse load including explosion. As the overpressure
interaction with any object is usually represented as a uniform load, this is the predominant
mode of response in most explosion situations. Depending on the value of the load ratio,
three or four response regimes are typically defined, denoted respectively as impulse,
-10.0
-5.0
0.0
5.0
10.0
15.0
20.0
25.0
30.0
0.00
10.
014
0.02
40.
028
0.03
30.
037
0.04
30.
047
0.05
10.
056
0.06
10.
066
0.07
10.
077
0.09
00.
103
0.11
60.
129
0.14
20.
148
0.15
90.
172
0.18
50.
198
0.21
10.
224
0.23
70.
250
0.26
30.
276
0.28
9
Dis
plac
emen
t (m
m)
Time (Sec)
Comparing responses, SDOF, Beam and Shell modeling
SDOF Model Beam Model Shell Model
Page 16
16
dynamic and quasi-static (or static). Conventionally, the range for fully dynamic response is
defined in the IGN guideline (Bowerman et al. 1992) as:
< 0.4 0.4 ≤ ~2.0
> 2.0 −
This classification seems to be sharp. Czujko (Czujko 2001) also proposed the
following classification for the loading regime:
≪ 1.0 ~1.0
> 2.0 −
> 5.0
As can be seen from the given classifications, for the regime in which td/T is greater
than 2.0, the response of structure is not really dynamic. Norsok (NORSOK 2013) also
suggested a classification for the loading regime, but as static loading was not categorized in
their classification, it has not been presented here for comparison. Nevertheless, using the
Norsok guidelines (NORSOK 2013) and (Det Norske Veritas 2001) for selecting the related
regime and recommended td values, respectively, would result in a similar conclusion for this
study.
Page 17
17
Usually, identifying a precise td is very complicated and challenging as various blast
scenarios should be assessed with consideration to all the load uncertainties including
magnitude, direction, distance of blast source, type of facilities, congestion and type of
ignition. Therefore, using recommended td values given by the international standards and
guidelines is vital and can reduce the risk of considering unsafe values. API and DNV (API
2FB April 2006; Det Norske Veritas. 2001) codes have been chosen to provide the td values
in the assessment for this study. Durations for the positive phase blast loads are expected to
vary from 0.2s for fairly open compartments to 1s for quite closed compartments (API 2FB
April 2006; Det Norske Veritas. 2001). It can be seen from these guidelines that the lower
bound for td is limited to 0.1sec and for most cases 0.2sec is recommended, unless a more
detailed assessment is carried out. It should be noted that the range of values of td,
investigated and discussed in this study, has been found suitable for most cases, not only by
international codes and standards, but also by industry expertise in blast analyses.
Analysis Results
Before performing any probabilistic analyses, sensitivity studies were carried out to
make sure that the model inputs were correctly defined and to have a better understanding of
the structural behaviour under general loads and boundary conditions. For each model, 2000
simulation loops were generated for the analyses. The ratio of duration of the loading (td) to
natural period of structure (T) of the profiled barrier is considered as the characteristic
property and investigated.
After performing the probabilistic analyses, it is crucial to review the statistical results
to check that the simulation loops are adequate. If the number of simulations is sufficient, the
mean value plots for the random output variables converge to a fixed value (i.e., the curve
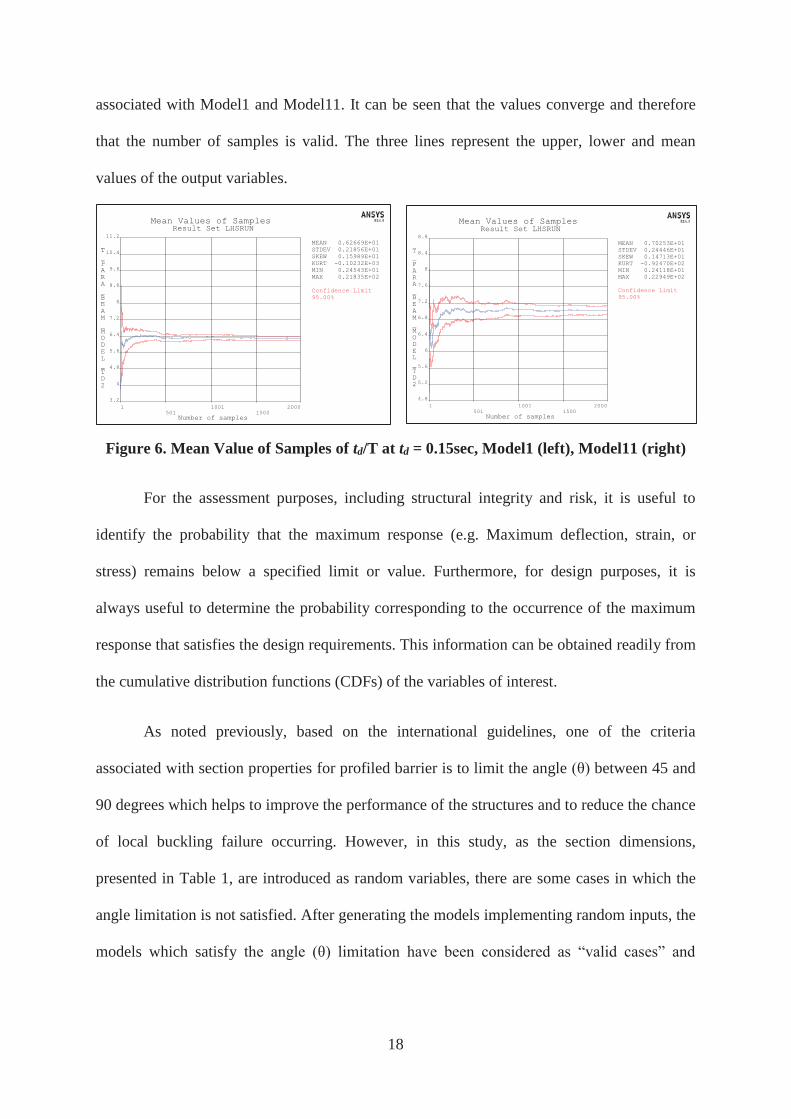
flattens out). As an example, Figure 6 presents the level of satisfaction for the number of
loops considered with regards to mean values of td/T, td = 0.15sec, for the modal analyses
Page 18
18
MEAN 0.62669E+01STDEV 0.21856E+01SKEW 0.15989E+01KURT -0.10232E+03MIN 0.24543E+01MAX 0.21835E+02
Confidence Limit95.00%
3.2
4
4.8
5.6
6.4
7.2
8
8.8
9.6
10.4
11.2
1501
10011500
2000
T_PARA_BEAM_MODEL_TD2
Number of samples
Result Set LHSRUNMean Values of Samples
MEAN 0.70253E+01STDEV 0.24446E+01SKEW 0.14713E+01KURT -0.92470E+02MIN 0.24118E+01MAX 0.22949E+02
Confidence Limit95.00%
4.8
5.2
5.6
6
6.4
6.8
7.2
7.6
8
8.4
8.8
1501
10011500
2000
T_PARA_BEAM_MODEL_TD2
Number of samples
Result Set LHSRUNMean Values of Samples
associated with Model1 and Model11. It can be seen that the values converge and therefore
that the number of samples is valid. The three lines represent the upper, lower and mean
values of the output variables.
Figure 6. Mean Value of Samples of td/T at td = 0.15sec, Model1 (left), Model11 (right)
For the assessment purposes, including structural integrity and risk, it is useful to
identify the probability that the maximum response (e.g. Maximum deflection, strain, or
stress) remains below a specified limit or value. Furthermore, for design purposes, it is
always useful to determine the probability corresponding to the occurrence of the maximum
response that satisfies the design requirements. This information can be obtained readily from
the cumulative distribution functions (CDFs) of the variables of interest.
As noted previously, based on the international guidelines, one of the criteria
associated with section properties for profiled barrier is to limit the angle (θ) between 45 and
90 degrees which helps to improve the performance of the structures and to reduce the chance
of local buckling failure occurring. However, in this study, as the section dimensions,
presented in Table 1, are introduced as random variables, there are some cases in which the
angle limitation is not satisfied. After generating the models implementing random inputs, the
models which satisfy the angle (θ) limitation have been considered as “valid cases” and
Page 19
19
MEAN 0.62669E+01STDEV 0.21856E+01SKEW 0.15989E+01KURT -0.10232E+03MIN 0.24543E+01MAX 0.21835E+02
Confidence Limit95.00%
0
10
20
30
40
50
60
70
80
90
100
24
68
1012
1416
1820
2224
2628
Probability in %
T_PARA_BEAM_MODEL_TD2
Result Set LHSRUNCumulative Distribution Function
therefore, the so called “non-valid cases” have generally been removed from the discussions
and conclusions of this study.
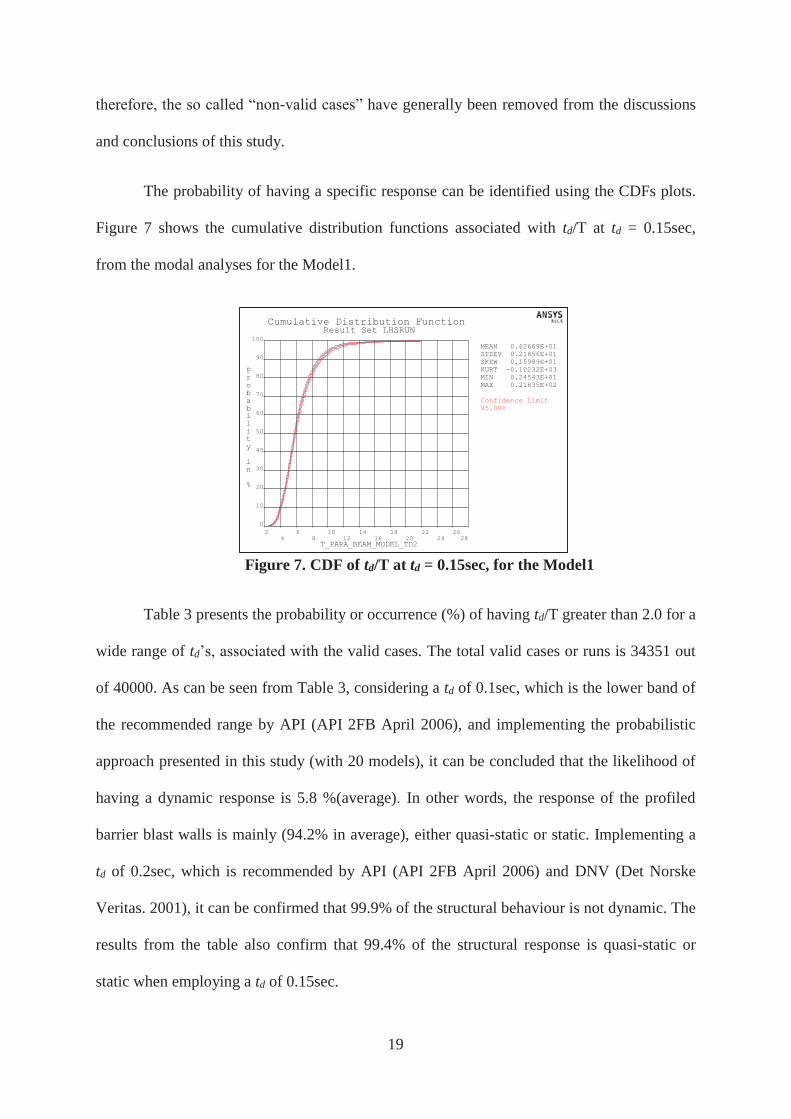
The probability of having a specific response can be identified using the CDFs plots.
Figure 7 shows the cumulative distribution functions associated with td/T at td = 0.15sec,
from the modal analyses for the Model1.
Figure 7. CDF of td/T at td = 0.15sec, for the Model1
Table 3 presents the probability or occurrence (%) of having td/T greater than 2.0 for a
wide range of td’s, associated with the valid cases. The total valid cases or runs is 34351 out
of 40000. As can be seen from Table 3, considering a td of 0.1sec, which is the lower band of
the recommended range by API (API 2FB April 2006), and implementing the probabilistic
approach presented in this study (with 20 models), it can be concluded that the likelihood of
having a dynamic response is 5.8 %(average). In other words, the response of the profiled
barrier blast walls is mainly (94.2% in average), either quasi-static or static. Implementing a
td of 0.2sec, which is recommended by API (API 2FB April 2006) and DNV (Det Norske
Veritas. 2001), it can be confirmed that 99.9% of the structural behaviour is not dynamic. The
results from the table also confirm that 99.4% of the structural response is quasi-static or
static when employing a td of 0.15sec.
Page 20
20
It should also be noted that these modal analyses are based on the pinned-pinned end
condition, with consideration of the weight of Liner and Isolation. Considering a more
realistic end or support condition, which is partially fixed (i.e. neither fully pinned nor fully
fixed), leads to a smaller value for the natural period (T) of the structure and consequently
results in a greater value for td/T which indicates that the structural responses would move
further towards the static or quasi-static domains.
The analysis results also confirm that, because of having a minor probability (e.g.,
less than 10% chance) to obtain a dynamic response from an unstiffened profiled barrier
under blast loadings, consideration of a dynamic load factor (DLF) of equal 1.1 would be
ideal. If not, a proper conservatism should be implemented in the conceptual or preliminary
stages of the design and assessment.
The developed probabilistic approach can also be utilised for optimising the design of
these structures as well as investigating the local failure modes for profiled barrier blast
walls. As part of this research study, further research is being carried out to develop a
stochastic finite element framework for profiled barrier stainless steel blast walls.
Page 21
21
Table 3. Occurrence (%) for td /T> 2.0 associated with valid cases (Angle 45< θ <90)
td=0.1 td =0.15 td =0.2 td =0.25 td =0.3 td =0.4
Valid cases (45< θ <90)
out of 2000
Model1 99 100 100 100 100 100 1984
Model2 97 100 100 100 100 100 1697
Model3 47 89 99 99 100 100 1419
Model4 100 100 100 100 100 100 326
Model5 99 100 100 100 100 100 316
Model6 86 99 100 100 100 100 1696
Model7 93 100 100 100 100 100 1889
Model8 100 100 100 100 100 100 2000
Model9 95 100 100 100 100 100 1937
Model10 98 100 100 100 100 100 1709
Model11 100 100 100 100 100 100 2000
Model12 98 100 100 100 100 100 2000
Model13 98 100 100 100 100 100 1998
Model14 96 100 100 100 100 100 1999
Model15 97 100 100 100 100 100 1990
Model16 97 100 100 100 100 100 1971
Model17 99 100 100 100 100 100 1984
Model18 100 100 100 100 100 100 1968
Model19 99 100 100 100 100 100 1864
Model20 78 99 100 100 100 100 1604
Average with
consideration
of valid cases
94.2 99.4 99.9 99.9 100.0 100.0 Total valid runs =
34351
4 Conclusions
Initially, an extensive range of programming modules were developed to create a
parametric finite element model to analyse and assess profiled barrier blast walls, with
consideration of material nonlinearity, and realistic boundary conditions. The option to
Page 22
22
perform various types of analyses including linear, nonlinear, static, dynamic and modal as
well as probabilistic assessments were also included. Utilising the programming, validity of
the finite element modelling was confirmed. Twenty base-models were then selected or
developed from which 34351 valid models were generated probabilistically. For the valid
cases, the ratio of load duration to natural period of structure (i.e. td/T) was used to identify
associated structural response classifications including, impulse, dynamic, quasi-static, and
static. The values of td/T were examined for a range of td values, including the ones
recommended by international standards and guidelines. The results indicate that when td is
equal to or greater than 0.1s (the lower bound and considered to be the worst case scenario),
the ratio of td/T is mostly greater than 2.0 which implies that the structural response is either
static or quasi-static. In fact, it can be concluded that the effects of dynamics are negligible
for unstiffened profiled barrier blast walls and structural responses in most cases can be
estimated on a quasi-static or static basis. In addition, considering a partially fixed boundary
condition, which is more realistic, would decrease the natural period of the structure (T) and
consequently increase the ratio of td/T and the structural behaviour would be less dynamic-
sensitive. Using a proper DLF would greatly help design engineers, without involving in
complicated advanced nonlinear dynamic analyses at early stage of the assessments. One
main direct practical application of the conclusion is to suggest an appropriate DLF of 1.1 to
be considered in the early stages of design and assessment. Further study is being carried out
to enhance a stochastic numerical approach for profiled barrier stainless steel blast walls.
Page 23
23
Acknowledgments
This PhD research is funded by Advanced Structural Analysis and Management
Group (ASAMG) Ltd., Aberdeen.
Sriramula’s work within the Lloyd’s Register Foundation Centre for Safety and
Reliability Engineering at the University of Aberdeen is supported by Lloyd’s Register
Foundation (LRF). LRF, a UK registered charity and sole shareholder of Lloyd’s Register
Group Ltd, invests in science, engineering and technology for public benefit, worldwide.
References:
ABS. (2005). "Rules for building and classing steel vessels." .
ABS. (2004). "Guide for buckling and ultimate strength assessment for offshore structures." .
ANSYS. (2012). ANSYS Inc., Documentation. Release 14.0., .
API 2FB. (April 2006). "Recommended Practice for the Design of Offshore Facilities Against Fire and Blast Loading." .
Biggs, J. M. (1964). "Introduction to Structural Dynamics." McGraw-Hill, .
Boh, J. W., Louca, L. A., and Choo, Y. S. (2007). "Finite Element Analysis of Blast Resistant Structures in the Oil and Gas Industry ." ABAQUS Users’ Conference, .
Bowerman, H., Graham, W. O., Rumley, J. H., and Tolloczko, J. J. A. (1992). "Interim guidance notes for the design and protection of topside structures against explosion and fire." Steel Construction Institute(Great Britain), .
Brewerton, R., and FABIG TN5. (1999). "Design Guide for Stainless Steel Blast Wall: Technical Note 5, Fire and Blast Information Group (FABIG)." Fire and Blast Information Group (FABIG), .
Choi, S., Grandhi, R. V., and Canfield, R. A. (2006). "Reliability-based Structural Design." Springer, .
Czujko, J., and Paik, J. K. (2015). "A new method for accidental limit states design of thin-walled structures subjected to hydrocarbon explosion loads. " Ships and Offshore Structures " 10(5), 460-469.
Page 24
24
Czujko, Z. (2001). "Design of Offshore Facilities to Resist Gas Explosion Hazard, Engineering Handbook ." CorrOcean ASA, Oslo, Norway, .
Det Norske Veritas. (1992). "Structural Reliability Analysis of Marine Structures: Classification Note No. 30.6." .
Det Norske Veritas. (2001). "Offshore Standard DNV-OS-A101 – Safety Principles and Arrangements." Norway, .
Faruqi, M. A., Grisel, J., Salem, A., and Sai, J. (2010). "A Parametric Study for the Efficient Design of Corrugated Blast Wall Panels Used In Petrochemical Facilities." ARPN Journal of Engineering and Applied Sciences, 5(11), 89 96.
Haifu, Q., and Xueguang, L. (2009). "Approach to Blast Wall Structure Computing in Ocean Engineering." Proceedings of the International Conference on Industrial and Information Systems, IIS '09, .
Hancock, G. J., Davids, A. J., Key, P. W., Lau, S. C. W., and Rasmussen, K. J. R. (1990). "Recent developments in the buckling and nonlinear analysis of thin-walled structural members." Thin-Walled Structures, 9(1-4), 309 338.
Hedayati, M. H., Sriramula, S., and Neilson, R. D. (2014). "Linear Dynamic Reliability Analysis of Profiled Blast Walls." ASCE-ICVRAM-ISUMA Conference, Liverpool, UK, .
Hedayati, M., Sriramula, S., and Neilson, R. D. (2013). "Non-Linear Dynamic Reliability Analysis of Profiled Blast Walls ." 11th International Conference on Structural Safety and Reliability (ICOSSAR), New York, USA, .
Hedayati, M., Sriramula, S., and Neilson, R. (2015). "Reliability of profiled blast wall structures." In S Kadry & A El Hami (Eds), Numerical Methods for Reliability and Safety Assessment: Multiscale and Multiphysics Systems. Springer, Switzerland, 387 405.
Hedyati, M. H., and Sriramula, S. (2012). "Finite Element Reliability Analysis of Blast Wall." 6th International, ASRANet (Advanced Structural Reliability Analysis Network) Conference, Croydon, London, UK, .
Helton, J. C., and Davis, F. J. (2003). "Latin hypercube sampling and the propagation of uncertainty in analyses of complex systems." Reliab.Eng.Syst.Saf., 81(1), 23 69.
Iman, R. L., Helton, J. C., and Campbell, J. E. (1981). "An approach to sensitivity analysis of computer models, Part 1. Introduction, input variable selection and preliminary variable assessment." Journal of Quality Technology, 13(3), 174-183.
Langdon, G. S., and Schleyer, G. K. (2006). "Deformation and failure of profiled stainless steel blast wall panels. Part III: finite element simulations and overall summary." Int.J.Impact Eng., 32(6), 988 1012.
Liang, Y. H., Louca, L. A., and Hobbs, R. E. (2007). "Corrugated panels under dynamic loads." Int.J.Impact Eng., 34(7), 1185 1201.
Page 25
25
Louca, L. A., and Boh, J. W. (2004). "Analysis and Design of Profiled Blast Walls. Research Report 146." Hse, .
McKay, M. D., Beckman, R. J., and Conover, W. J. (1979). "A comparison of three methods for selecting values of input variables in the analysis of output from a computer code." Technometrics, 21(2), 239-245.
NORSOK. (2013). "Design of Steel Structures." N-004, Rev. 3, .
Olsson, A., Sandberg, G., and Dahlblom, O. (2003). "On Latin hypercube sampling for structural reliability analysis." Struct.Saf., 25(1), 47-68.
Reh, S., Beley, J., Mukherjee, S., and Khor, E. H. (2006). "Probabilistic finite element analysis using ANSYS." Struct.Saf., 28(1-2), 17-43.
Schleyer, G. K., Langdon, G. S., and Jones, N. (2003). "Research Proposal – pulse pressure testing of ¼ scale blast walls with connections – phase II." HSE Proposal., .
Schleyer, G. K., and Langdon, G. S. (2003). "Pulse pressure testing of 1/4 scale blast wall panels with connections." Prepared by Liverpool University for the Health and Safety Executive, rr124., .
Sohn, J. M., Kim, S. J., Seo, J. K., Kim, B. J., and Paik, J. K. (2016). "Strength assessment of stiffened blast walls in offshore installations under explosions." Ships and Offshore Structures, 11(5), 551-560.
Wijaya, C., and Kim, B. (2011). "FE analysis of unstiffened and stiffened corrugated panels subjected to blast loading." Journal of Mechanical Science and Technology, 25(12), 3159 3164.
Wyss, G. D., and Jorgensen, K. H. (1998). "A user`s guide to LHS: Sandia`s Latin Hypercube Sampling Software, SAND98-0210." Sandia National Lab, .