DYNAMIC CHANGE PROCESS: HOW DO COGNITIVE READINESS DRIVERS INFORM CHANGE AGENTS ON EMPLOYEE BEHAVIOURAL CHANGE INTENTION. by Karl, Kilian, Konrad WIENER Bachelor of Science (Auckland University, New Zealand) Diploma in Applied Psychology (Flinders University, South Australia) Masters in Clinical Psychology (University of Queensland, Queensland) A thesis submitted in fulfilment of the requirements of the Doctor of Philosophy in Management at the University of Canberra. March 2008
Transcript
DYNAMIC CHANGE PROCESS: HOW DO COGNITIVE READINESS DRIVERS INFORM CHANGE AGENTS ON
EMPLOYEE BEHAVIOURAL CHANGE INTENTION.
by
Karl, Kilian, Konrad WIENER
Bachelor of Science (Auckland University, New Zealand)
Diploma in Applied Psychology (Flinders University, South Australia)
Masters in Clinical Psychology (University of Queensland, Queensland)
A thesis submitted in fulfilment of the requirements of the Doctor of Philosophy in Management at the University of Canberra.
March 2008
ii
Key words
Readiness for change, organisational change, readiness drivers, change efficacy,
appropriateness of the change, understanding of the change, personal valence, principal
support, need for change, behavioural change intention, supervisor, subordinate, dynamic
change models.
iv
Abstract
It is well accepted by now that most change initiatives are unsuccessful even though more
organisations are experiencing change as they fight to retain and improve their
competitiveness in the market place. It is against this background of change failure that
researchers have looked for new strategies to improve change outcomes. Theoretical
models conceptualising the dynamic change process advise on better change strategies, but
little empirical evidence has demonstrated that these models are effective in improving
change implementation outcomes. Theoretical models were also developed to counter
change resistance, but little emphasis has been placed on employee change readiness.
Some empirical research on employee change readiness explores employees’ perception of
organisational readiness, but no empirical research has explored employee readiness from a
psychological perspective. That is, how to create change readiness in employees.
This thesis has contributed to both the theoretical and empirical understanding of the
change readiness model. Firstly, the theoretical readiness for change model Armenakis et
al.’s (1993, 2002) was extended by the inclusion of the ‘understanding of the change’
driver. Secondly, this change readiness model was empirically tested on two distinct
organisational changes: organisational restructure and IT change. The extended model is
also examined for two change stages of the dynamic process to identify which readiness
drivers should be prioritised by change agents.
Two online questionnaires were administered eight months apart assessing the responses to
three change stages (planning, implementation and post-implementation) of employees –
supervisors and subordinates - of a flat structured organisation in the human resource
industry. At the two measurement points 189 and 141 employees returned completed
surveys. Six employee readiness drivers were operationalised and regressed against
behavioural change intention.
The quantitative findings using regression models across two change types and
longitudinally did not identify a specific change pattern. However, all six readiness drivers
including the ‘understanding of the change’ driver were influential on employees’
v
behavioural change intention. Furthermore, statistical differences between supervisors and
subordinates were identified in the organisational restructure change.
The quantitative findings using a triangulation approach with qualitative date including
data from two unstructured interviews and employee comments further validated the
quantitative findings. The thematic analysis of the employee comments enhanced the
findings and identified employee specific concerns including information dissemination of
the changes and a level of uncertainty.
The findings supported Armenakis et al.’s (1993, 2002) theoretical contribution that
change readiness drivers are an important part of the organisational change process
explaining why employee do and do not change. The empirical application of readiness
change driver evaluation during the dynamic change is supported as it permits change
agents to directly monitor employees’ readiness perception of a specific change target.
This valuable information finds practical utilisation for change agents in providing targeted
guidance and support for employees thus facilitating a greater likelihood of a positive
change outcome.
Implications of these findings and future research opportunities are discussed.
vi
Certificate of completion of thesis for higher degree by research
(Form A)
PART 1 (to be completed by the chair of the supervisory panel (primary supervisor))
I ________________________________________hereby certify that
(Name of chair of the supervisory panel)
________________________________________ has submitted the thesis
(Name of candidate)
for the course leading to the degree of __________________________________
In my opinion, the thesis is / is not in a form acceptable for examination.
4.4 Implementation stage for both organisational and IT restructure .............................. 88
4.4.1 Correlation results for the organisational changes at implementation ......... 88
4.4.2 Regression results for the organisational restructure ................................... 92
4.4.3 Correlation results for the IT changes ..........................................................94
4.4.4 Regression results for the IT changes at the implementation stage ............. 98
4.5 Post-implementation stage for organisational restructure........................................ 100
4.5.1 Correlation results for the organisational changes at post-implementation stage .................................................................................................................... 101
4.5.2 Regression results for the organisational changes at post-implementation 106
4.6 Cross sectional analysis for both organisational and IT restructures at the implementation stage......................................................................................................... 108
4.7 Longitudinal analysis for both organisational restructure and IT change................ 111
4.7.1 Longitudinal comparison for IT changes – planning stage to implementation stage. .................................................................................................................... 111
4.7.2 Longitudinal comparison for organisational changes – implementation to post-implementation stage. ...................................................................................... 113
5 Qualitative Findings and Analyses ............................................................................... 117
5.2 Overview of both organisational restructure and IT change as described by the Change Project Officer ...................................................................................................... 118
5.3 Triangulation of quantitative and qualitative data ................................................... 119
5.4 Theme analysis of the qualitative data..................................................................... 125
Table 1: Concepts in the organisational change literature .................................................... 10
Table 2: Theoretical implementation stages of the dynamic change process ....................... 13
Table 3: Definition of the six readiness drivers .................................................................... 28
Table 4: Change type and change stages for two sampling points T1 & T2......................... 47
Table 5: Items for the 'appropriateness of the change' scale ................................................. 57
Table 6: Factor loading of the ‘appropriateness of the change’ for the organisational restructure’ ............................................................................................................................ 57
Table 7: Factor loading of the ‘appropriateness of the change’ for the IT change ............... 58
Table 8: Items for the 'individual change efficacy' scale ...................................................... 58
Table 9: Factor loading of the ‘change efficacy’ for the organisational restructure ............. 59
Table 10: Factor loading of the ‘change efficacy’ for the IT change.................................... 59
Table 11: Items for the ‘principal support’ scale .................................................................. 60
Table 12: Factor loading of the ‘principal support’ for the organisational restructure ......... 61
Table 13: Factor loading of the ‘principal support’ for the IT change.................................. 61
Table 14: Items for the 'understanding of the change' scale.................................................. 62
Table 15: Factor loading for the ‘understanding of the change’ scale for the organisational restructure.............................................................................................................................. 62
Table 16: Factor loading for the ‘understanding of the change’ scale for IT change. .......... 62
Table 17: Items for the' personal valence' scale .................................................................... 63
Table 18: Factor loading for the ‘personal valence’ scale for organisational restructure ..... 63
Table 19: Factor loading for the ‘personal valence’ scale for IT change.............................. 64
Table 20: Items for the 'need for change' scale ..................................................................... 64
Table 21: Factor loading for the ‘need for change’ scale for the organisational restructure 65
xvi
Table 22: Factor loading for the ‘need for change’ scale for IT change............................... 65
Table 23: Items for the 'behavioural intention for change' scale........................................... 66
Table 24: Factor loading for the ‘behavioural change intention’ scale for organisational restructure.............................................................................................................................. 67
Table 25: Factor loading for the ‘behavioural change intention’ scale for IT change. ......... 67
Table 26: Summary of reliability coefficients for all six readiness driver variables and the dependent variable for both organisational restructure and IT change ................................. 68
Table 27: Surveyed change stages and change types............................................................ 79
Table 28: Gender of respondents from two sampling points T1 and T2............................... 82
Table 29: Correlations for IT change at the planning stage. ................................................. 84
Table 30: Correlations for IT change at the planning stage by supervisors .......................... 85
Table 31: Correlations for IT change at the planning stage by subordinates. ....................... 85
Table 32: Regression results for IT change at the planning stage......................................... 86
Table 33: Regression results for IT change for supervisors and subordinates at the planning stage....................................................................................................................................... 87
Table 34: Correlations for the organisational restructure during implementation at T1....... 90
Table 35: Correlations for the organisational restructure at implementation by supervisors91
Table 36: Correlations for the organisational restructure at implementation by subordinates............................................................................................................................................... 92
Table 37: Regression results for organisational restructure at implementation .................... 93
Table 38: Regression results for supervisors and subordinates at implementation of organisational restructure ...................................................................................................... 94
Table 39: Correlations at implementation of the IT change.................................................. 96
Table 40: Correlations at implementation of IT change by supervisor................................. 97
Table 41: Correlations at implementation of IT change by subordinates. ............................ 98
Table 42: Regression results at implementation of the IT change ........................................ 99
Table 43: Regression results at implementation of the IT change for supervisors and subordinates separately. ...................................................................................................... 100
xvii
Table 44: Correlations at the post-implementation stage of the organisational restructure 102
Table 45: Correlations at post-implementation of the organisational restructure by supervisors........................................................................................................................... 104
Table 46: Correlations at post-implementation of the organisational restructure by subordinates......................................................................................................................... 105
Table 47a: Regression results at post-implementation of the organisational restructure.... 107
Table 48b: Regression results (including indicator variables along with interaction terms) at post-implementation of the organisational restructure........................................................ 107
Table 49: Regression results at post-implementation of the organisational restructure for supervisors and subordinates............................................................................................... 108
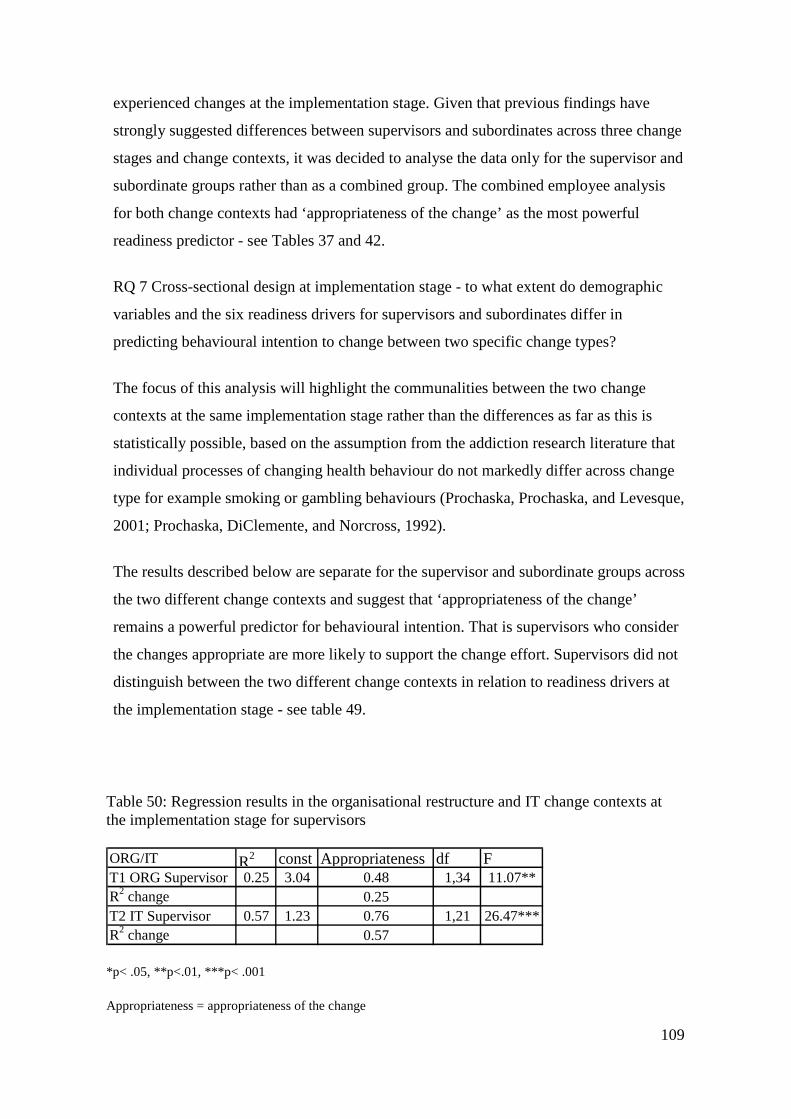
Table 50: Regression results in the organisational restructure and IT change contexts at the implementation stage for supervisors.................................................................................. 109
Table 51: Regression results in the organisational restructure and IT change contexts at the implementation stage for subordinates................................................................................ 110
Table 52: Regression results at the preparation and implementation stages of the IT change for supervisors. .................................................................................................................... 112
Table 53: Regression results at the preparation and implementation stages of the IT change for subordinates ................................................................................................................... 112
Table 54: Regression results at the implementation and post-implementation stages of the organisational restructure for supervisors ........................................................................... 114
Table 55: Regression results at the implementation and post-implementation stages of the organisational restructure for subordinates ......................................................................... 115
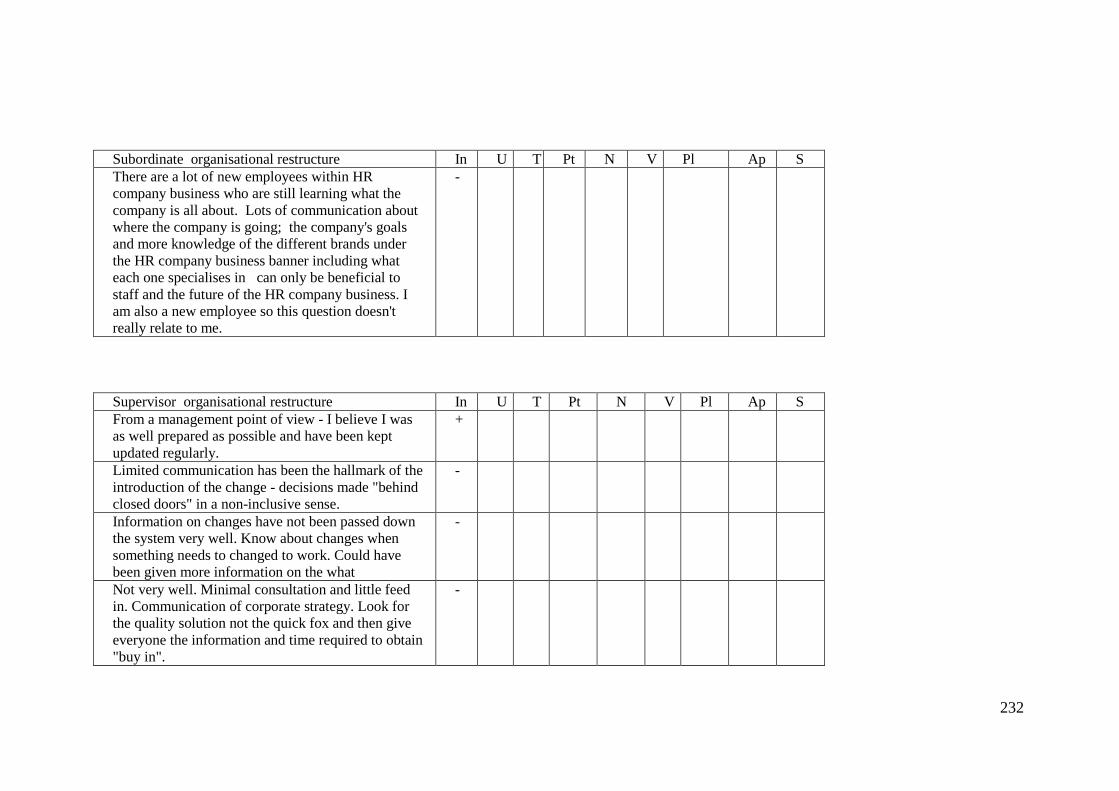
Table 56: Comparison of low mean quantitative scores and the respective employee comments for either change type ........................................................................................ 122
Table 57: Comparison of high mean quantitative scores and the respective employee comments for either change type ........................................................................................ 124
Table 58: Number of employee comments received........................................................... 125
Table 59: Summary of the percentages of endorsed themes from supervisor and subordinate comments for organisational restructure at the implementation stage................................ 129
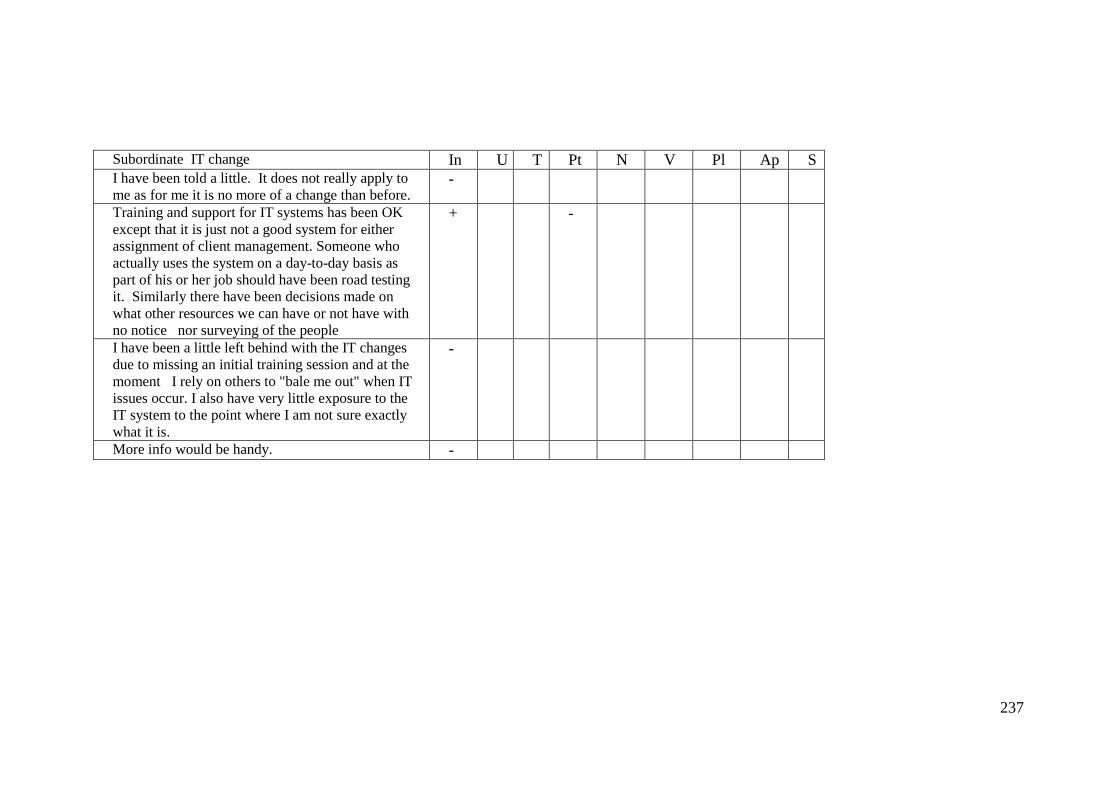
Table 60: Summary of the percentages of endorsed themes from supervisor and subordinate comments for IT change at the planning stage.................................................................... 131
Table 61: Predictor variables at implementation of the organisational restructure and IT change by supervisors ......................................................................................................... 144
xviii
Table 62: Predictor variables at implementation of the organisational restructure and IT change by subordinates ....................................................................................................... 145
Table 63: Predictor variables at implementation of the organisational restructure and IT change by supervisors and subordinates ............................................................................. 146
Table 64: Predictor variables at the preparation and implementation stages for the IT change by supervisors...................................................................................................................... 150
Table 65: Predictor variables at the preparation and implementation stages for the IT change by subordinates.................................................................................................................... 152
Table 66: Predictor variables at the implementation and post-implementation stages for the organisational restructure by supervisors and subordinates................................................ 155
Table 67: Predictor variables at the implementation and post-implementation stages for the organisational restructure by supervisors. ........................................................................... 156
Table 68: Predictor variables at the implementation and post-implementation stages for the organisational restructure by subordinates.......................................................................... 157
Table 69: Summary table listing the research findings for research questions 1 to 3......... 160
Table 70: Summary table listing the research findings for research questions 4 and 5 ...... 161
Table 71: Summary table listing the research findings for research questions 6 and 7 ...... 162
Table 72: Summary table listing the research findings for research question 8 ................. 163
Table 73: Summary table listing the research findings for research question 9 ................. 164
1
1 Introduction
Businesses leaders, managers and researchers in the area of organisational change are well
aware that the majority of change initiations fail despite great efforts in enhancing
organisational ability through the availability of resources, the provision of suitable
training, and communicating the changes to the target audiences (Smith, 2002; Waldersee
and Griffiths, 1997). In examining the failure of change programs, Waldersee and Griffith
(1997) conducted a longitudinal study of 500 large Australian organisations during 1993
and 1996 and found that half the organisations surveyed experienced employee resistance
which negatively impacted on the organisational performance. These poor change
implementation results are further supported by recent published findings that suggest that
only 37% of mergers and acquisitions, 26% of software development and installations, and
20% of business expansions succeed (Smith, 2002).
These high numbers of change implementation failures are against the background of
organisations experiencing more changes as a result of globalisation, adjustment to new
technology and procedures, industry challenges, and government regulations and policies.
In order to maintain and improve performance, organisations are forced to adapt and adjust
to the competitive pressures in the marketplace (Smith, 2002). These challenges of the
market place have forced organisations to develop new strategies and mechanism to remain
competitive by adapting and adjusting to the ever changing business environments. (Cole,
Harris, and Bernerth, 2005; Nadler and Tushman, 1989). This suggests that in many cases
the organisation is forced to initiate change due to external pressures rather than due to
internal pressures or a desire for change. Despite these challenges, modern organisations
must deal with change more effectively.
The high risk of change associated with the economic cost and time delays as the result of
unsuccessful change implementation forces organisations to adapt to the changing market
place in order to remain competitive. The high rate of unsuccessful change implementation
outcomes have forced researchers and executives to look at organisational change from a
much broader perspective. The need for new strategies influenced a shift away from
researching an organisation’s physical capability including structural and systemic change
2
interventions and a greater focus towards employee management models (Marks and
Mirvis, 2000). In the past, research in employee management has mainly focused on
overcoming employee change resistance (Bovey and Hede, 2001; Dent and Goldberg,
1999; Dent and Goldberg, 1999a; Lewin, 1958) rather than creating a sense of readiness in
employees (Armenakis, Harris, and Mossholder, 1993; Eby, Adams, Russell, and Gaby,
2000; Holt, Self, Thal, and Lo, 2003).
Lewin (1958) was one of the earlier researchers who developed a change model that
identified barriers to organisational change. He described how change can occur at three
levels: at the employee level, the organisational structure and systems level, and at the
organisational climate or interpersonal style level. Lewin (1958) also implied in his change
model that organisational change consists of three change stages - unfreezing, moving,
and refreezing - which impact on all three levels of the organisation. The ‘unfreezing’
stage is similar to developing a stage of readiness for the organisation to implement
change. He suggested that it is during the ‘unfreezing stage’ one must anticipate and
minimise resisting forces otherwise any implementation action would encounter significant
resistance. He indicated that once entrenched behaviours are broken and resisting forces
are minimised, the actual implementation of the required changes can begin. Lewin was
one of the earlier researchers who not only considered the importance of the organisational
structure and systems, but also the importance of employees in the change process.
Unfortunately subsequent researchers ignored the human element in the change process,
and the important roles employees play in the change process (Lawrence and Lorsch, 1967;
Pfeffer and Salancik, 1978).
The resistance to change literature was the first considering employees as an important
factor in the change process with interventions being reactive rather than pro-active. This
distinction is actually the major difference between the readiness for change and the
resistance to change mental models (Armenakis, Mossholder, and Harris, 1990). The
strategies employed to overcome resistance and to create employee readiness may be
similar, including education, communication, participation and involvement, facilitation
and support, negotiation and agreement, but the timing of application is different
(Armenakis, Harris, and Feild, 1999a; Coch and French, 1948; Eby, Adams, Russell, and
Gaby, 2000; Kotter and Schlesinger, 1979). When managing resistance to change these
3
strategies are seen as reactive, whereas proactive change agents employ these strategies to
create readiness.
In order to better understand organisational change it is important to briefly review
readiness for change and change processes separately. Both the readiness factors and the
change process are integral parts of the organisational change.
Although there has been little empirical research into how readiness for change could
produce a more successful change outcome, the theoretical understanding in why
employees do and do not concur with the change implementation is important to improve
future change outcomes. In the research, there is an increasing focus not on how employees
deal with resistance, but understanding the processes needed to create readiness for change.
Armenakis et al.’s (1999a) model consist of two interlinked parts: 1) activities prescribed
for the change agent, and 2) the influence of five ‘change messages’ on employee change
readiness. Here the focus will be on the second part of the model with emphasis on
employee change readiness. Armenakis et al.’s (1993, p. 681) theoretical model defines
employee readiness for change as ‘the cognitive precursor to the behaviours of either
resistance to, or support for, a change effort’. That is, readiness for change occurs when
employees have definite attitudes, beliefs, and intentions towards the organisational
change. Armenakis et al. (1999a, p.170) also emphasised that these five ‘change messages’
as cognitive precursors ‘apply to all transformation efforts, regardless of the intervention
model being followed by a change agent’. That is, these cognitive precursors are active
throughout the entire change process.
Process models are important to understand the organisational change as a process. For a
better understanding of the process all models discussed here have divided the change
process into phases or stages. A number of process models have been developed exploring
different stages or phases during the change (Armenakis and Stanley, 2002; Galpin, 1996;
Isabella, 1992; Judson, 1991; Kotter, 1995; Lewin, 1951; Lewin, 1958). This thesis has
focused on Armenakis et al.’s (2002) readiness for change model for its comprehensive
approach towards readiness and the change process.
In order to understand readiness for change it is important to integrate readiness with the
change process that identifies different change stages. This understanding has eluded
researchers due to a lack of both empirical data and longitudinal research designs. It is
4
expected that at different stages of the change process employee change readiness may
vary. Knowledge of this readiness variability across the change process would assist in
influencing employee readiness through targeted interventions. Mossholder et al. (2000)
support the monitoring of readiness during different change stages as it provides direction
for change agents in actively facilitating the change process. They found, in their study
assessing emotion in connection with organisational change, that monitoring the change
process is good practice as it allows senior management to employ ‘appropriate readiness
creating strategies… to move individuals to a level of higher readiness’ (Mossholder,
Settoon, Armenakis, and Harris, 2000 p.239).
This dissertation will expand on Armenakis et al.’s (1993) readiness model, operationalise
the readiness model, and empirically test this theoretical change readiness model for two
separate change types in a flat structured human resource firm that experienced major
changes as part of conglomerate merger activities. Conglomerate mergers are strategies
that ‘add to the firm’s diversification and broaden the firm’s business portfolio in order to
enhance the economical robustness against market fluctuations related to product and
service demands’ (Gaughan, 1996, p.112). In the past this firm was filling the product and
service needs of a specific niche market in the human resource industry, and the firm
expects greater competitive advantage by developing and broadening its business portfolio
within the same industry.
Apart from change readiness, the organisational change literature suggests that
demographic variables (Calhoun, Staley, Hughes, and McLean, 1989; Decker, Wheeler,
Johnson, and Parsons, 2001; Hanpachern, Morgan, and Griego, 1998; Hogarty, 1996;
McEvoy and Cascio, 1989) and understanding of the change (Fiorelli and Margolis, 1993;
Washington and Hacker, 2005) may impact on an employee’s behavioural change
intention.
Research into organisational change has identified differences between supervisors and
subordinates. That is, employees in different roles of responsibility like supervisors and
subordinates respond differently to organisational change (Bowers and Seashore, 1966;
Fenton-O'Creevy, 1998; Gleeson, McPhee, and Spatz, 1988; Verespej, 1990). Given the
role difference and the extra responsibility for supervisors, it would be reasonable to expect
that supervisors and subordinates differ in their perception of change readiness.
5
The aim of this thesis is to improve the current knowledge of the dynamic change process
and to identify the influence of different change stages on employee readiness. It is
surprising that researchers have not examined the underlying factors of employee change
readiness; even so, the majority of change initiatives have been unsuccessful. Given the
reported poor change outcomes in the literature (Smith, 2002; Waldersee and Griffiths,
1997), one of the important areas for investigation is employee change readiness from a
psychological perspective. Improved understanding of these dynamics and knowledge of
change patterns may improve future change outcomes.
Achieving those objectives requires:
1. the operationalisation and empirical application of the expanded change readiness
model by Armenakis et al. (1999a) through the identification of the six readiness
drivers: individual change efficacy, personal valence, appropriateness of the
change, principal support, need for change, understanding of the change;
2. the application of the process model by identifying change stages to the
investigated organisational change;
3. the separate examination of employee change readiness patterns for supervisors and
subordinates.
The following research questions are pursued:
RQ 1 At the planning stage – to what extent do demographic variables and the six
readiness drivers predict employees’ behavioural intention to change for the IT change?
RQ 2 At the planning stage - to what extent do demographic variables and the six readiness
drivers for supervisors and subordinates predict behavioural intention to change for the IT
change?
RQ 3 At the implementation stage - to what extent do demographic variables and the six
readiness drivers predict behavioural intention to change for the two specific change types?
6
RQ 4 At the implementation stage - to what extent do demographic variables and the six
readiness drivers for supervisors and subordinates differ in predicting behavioural intention
to change for two specific change types?
RQ 5 At the post-implementation stage - to what extent do demographic variables and the
six readiness drivers predict employees’ behavioural intention to change for the
organisational restructure?
RQ 6 At the post-implementation stage - to what extent do demographic variables and the
six readiness drivers for supervisors and subordinates predict behavioural intention to
change for the organisational restructure?
RQ 7 Cross-sectional design at implementation stage - to what extent do demographic
variables and the six readiness drivers for supervisors and subordinates differ in predicting
behavioural intention to change between two specific change types?
RQ 8 Longitudinal design for IT change - to what extent do demographic variables and the
six readiness drivers for supervisor and subordinates differ in predicting behavioural
intention to change for both the preparation and the implementation stages?
RQ 9 Longitudinal design for organisational restructure - to what extent do demographic
variables and the six readiness drivers for supervisors and subordinates differ in predicting
behavioural intention to change for both the implementation and the post-implementation
stages?
The next section provides an outline of the following six chapters.
7
1.1 Organisation of chapters
This thesis comprises seven chapters with several sections within the chapters. Chapter two
provides a comprehensive literature review of what is known about organisational change
and how employee readiness for change influences the outcome of the dynamic change
process.
As already indicated above employee readiness for change is supported by a theoretical
model, but empirical validation of this model has been lacking. This thesis sets out to test
the employee readiness model empirically. Chapter three describes the process of
empirically testing the employee readiness for change model. Here employee readiness
variables are identified and measures developed to empirically test the theoretical
employee readiness model.
The fourth chapter reports on the findings of the quantitative data using correlation and
regression analysis as basic tools. The cross-sectional and longitudinal designs of this
research also permit improved understanding and insight into the processes of the
organisational change dynamics and how these dynamics impact on the employee
readiness model. These findings are augmented in chapter five by triangulating quantitative
results with qualitative data. Here the qualitative data include information from two
unstructured interviews with the Change Project Officer, and separate employee comments
relating to two different change types and for two employee groups (supervisor &
subordinate).
The discussion section in chapter six integrates the quantitative and qualitative findings
together with the triangulations expanding the knowledge base in the existing literature on
change dynamics and employee readiness. Chapter seven explores the usefulness of these
findings to the investigated organisation and other organisations and industries. Finally, the
limitations of this research are discussed and future research opportunities in this area are
identified.
8
2 Literature Review
This literature review provides an overview of different organisational change models and
how these models relate to an employee readiness for change model. Organisational
change is further explored in terms of the dynamic change process explaining organisation
centred and employee focused process models. The last part of this chapter provides an
extensive review of readiness drivers that are considered cognitive precursors to facilitate
organisational change within the employee. This chapter’s objective is to present the
current state of the literature as it relates to organisational change and, in particular, the
change dynamics experienced by organisations during change implementation.
Furthermore, this chapter highlights the importance of an employee focused
implementation strategy compared to an implementation strategy purely based on
organisational readiness. The employee focus is justified given that employees are a vital
part in influencing the success or failure of the change implementation outcome (Burke
and Trahant, 2000). Once it is accepted that employees are an important part of the
dynamic change process, it follows that change agents may want to assess and monitor the
change readiness of their employees to provided strategic change interventions (Holt,
Armenakis, Feild, and Harris, 2007; Holt, Self, Thal, and Lo, 2003; Isabella, 1992).
Employee change readiness sentiments can be assessed and monitored during change
implementation to identify change issues that affect employees. Examination of change
readiness will provide information on how to and where to focus on change (Burke and
Trahant, 2000). Furthermore, this data can assist change agents in selectively addressing
and managing the identified factors through to positively influencing the change
implementation.
2.1 Models of organisational change
This section explores the different models of organisational change which in the main tend
to differentiate organisational change along two dimensions, namely incremental change or
9
transformative change (Dunphy and Stace, 1988; Levy, 1986; Tushman, Newman, and
Romanelli, 1986); and whether the change is perceived as collaborative or coercive by the
stakeholders (employee/employer) (Kanter, 1982; Kotter and Schlesinger, 1979; Nadler,
1981; Saskin, 1984b, , 1986). These models are dependent on the organisational life cycle
and on the relative stability/turbulence of the industrial environment (Dunphy and Stace,
1988; Levy, 1986; Tushman, Newman, and Romanelli, 1986).
Firstly, the differences between incremental and transformational change relating to
required changes are outlined below. Levy (1986) describe organisational changes in terms
of first-order and second-order changes, with first-order changes consistent with
incremental changes that do not impact on the overall structure of the organisation, but
make adjustments in mission, strategy, structure and internal processes. In contrast,
second-order changes are seen as a multi-dimensional, multi-component, and multi-level
change of the organisation that irreversibly changes the organisational system.
Dunphy and Stace (1988) differentiate between incremental and transformative change
with focus on the learning characteristic of the organization producing change on a
‘continuous’ vs. ‘discontinuous’ basis. Fiol and Lyles (1985) described ‘continuous’
change as ‘constant learning’ requiring learning at all levels of the organisation whereas
‘discontinuous’ change requires only ‘periodic learning’ involving mainly senior
management of the organisation.
Tushman et al. (1986) described a similar change model – see Table 1. They applied their
model to different stages of the organisational life-cycle. That is, an industry shifts from a
stable to a turbulent environment as part of external environmental changes (government
change) or technological advances. Transformational or second-order change might also be
necessary when a substantial realignment of the organisational functioning (strategy,
structure or processes) is required to be consistent with industry changes. Both Tushman et
al. (1986) and Dunphy et al. (1988) apply their change model to the organisational life-
cycle although they use different terminology for the two types of changes. Dunphy et al.
(1988) referred to the two types of change as ‘incremental’ and ‘transformative’, whereas
Tushman et al. (1986) name ‘incremental change’ as ‘convergence’, or ‘evolutionary’
changes, and ‘transformative change’ as ‘frame breaking’. The different perceptions of
organisational change as reported in the literature are depicted in the table below.
10
Table 1: Concepts in the organisational change literature
(Table modified from Dunphy and Stace (1988) page 322.)
It has been shown from the described organisational literature that researchers developed a
number of change models. These multiple models demonstrate a lack of consensus
regarding a conceptual framework for understanding change. This lack of a comprehensive
change model has limited the development of systematic change preparation and
implementation processes to assist with the dynamic change processes. This lack of a
comprehensive change model is testimony to the complexity of organisational change as
argued by Worren et al. (1999). Worren et al. (1999) attempted to integrate existing models
into a holistic model of change to address all aspects of these complex change phenomena.
Unfortunately they found the complexities of organisational changes are too vast to be
encompassed into a holistic model. This view is supported by Pundziene (2004, p.163)
who wrote that ‘there is no systematic theory or model that would provide a reliable
explanation of the organisational change phenomenon and the processes determined by
such changes’.
Secondly, the models distinguish between collaborative and coercive changes (Kanter,
(1999) found that respondents using the email survey were more likely to fill in the
survey compared with the paper copy group, and the survey content did not differ
significantly between the two survey methods. Furthermore, these findings also showed
that paper survey response rates were higher when compared to email surveys. However,
Wu & Newfield (2007) findings revealed that the electronic method resulted in less
incomplete response sets. Overall, the described findings support the use of electronic
data collection using an online survey.
The electronic survey method was considered appropriate for this HR company as all
staff had ready access and were trained in the use of this technology. Additionally,
McCalla (2002) provides a number of key points for consideration to make an online
survey successful. Those key points also included measures for survey design, practical
measures for ease of use, obtaining the support of the organisation, and providing an
incentive for respondents to complete the survey. The support of senior management was
demonstrated by permitting staff to fill in the survey in work time. Furthermore, the
researchers encouraged employees to complete the online survey through email
correspondence and promised in the initial introduction letter to provide feedback
through their supervisors.
The initial procedure of contact to all staff was via email through an in-house coordinator
who distributed all the initial correspondence. In this email, employees were provided
with a letter of introduction, the URL to access the website, and a website password. The
website was designed so that participants could access their own data and make
modifications if so desired, using a self-selected password. The same procedure was
repeated at a second measurement point.
51
Confidentiality was assured and also demonstrated to participants by using an off site
server: the online survey and data collection information were housed on a separate
server located at the Queensland University of Technology (QUT).
3.3.2.2 Data collection
Data collection through the online survey included demographic information, readiness
for change perception measures and the ‘behavioural intention for change’ measures.
The participants’ response rate at T1 was relatively high with two thirds of all staff
responding to the online survey. That is 189 respondents returned completed surveys.
Seventy five percent (75%) of the respondents’ sample was female. Further analysis of
the gender imbalance revealed that 37% of the male respondents worked as supervisors
compared to only 18% of female employees. In terms of education more than 51% of the
respondents had completed at a minimum a Bachelor degree. Due to technical problems,
age was not stored in the data set at T1. However, this problem was corrected for the
second measurement point. At the second measurement point (T2) 141 respondents filled
in a completed survey. The age variable will not be used for T1 statistical analysis, but
the age data in T2 provides a valid age profile for the organisation given that the overall
staffing profile did not markedly differ between the two measurement points.
Apart from the usual demographic information e.g. age, gender, and education level,
three additional variables were collected namely ‘time in the job role’, ‘time in the
organisation’, and ‘level of job responsibility’. As mentioned in the literature review
these variables are considered important when researching organisational change
(Calhoun, Staley, Hughes, and McLean, 1989; Madsen, Miller, and John, 2005; McEvoy
and Cascio, 1989; Schwoerer and May, 1996; Waldman and Avolio, 1986).
52
3.3.2.3 Measurement Scale
The Likert type measurement tool was used to collect the required information given the
easy adaptation of this type of scale for the study in question. Likert scales also allow for
easy detection and reduction of item outliers as well as the computation of aggregated
scores measuring particular social attitudes or attitudes towards objects of interest
(Emmert, 1989). Apart from the easy adaptation to suit specific research designs, this
scale has also been shown to have validity and reliability (Clark and Watson, 1995;
Cummins and Gullone, 2000; Likert, 1932). However, recent research has explored the
scale’s discriminative value and sensitivity by increasing the number of intervals. Likert
(1932) initially developed five-interval scales. Such scales are under review as
researchers examine the effects on reliability, validity and sensitivity if the number of
intervals were increased. To-date, the outcome of these investigations has been mixed.
Clark (1995) wrote ‘providing more response alternatives (e.g. a 9-point rather than a 5-
point scale) does not necessarily enhance reliability or validity. In fact, increasing the
number of alternatives actually may reduce validity if respondents are unable to make the
more subtle distinctions that are required. That is, having too many alternatives can
introduce an element of random responding that renders scores less valid’. In contrast
Cummins & Gullone (2000, p.80) concluded that ‘increasing the response options
beyond 7-points does not systematically detract from scale reliability, but enhances the
discriminative sensitivity of the scale’. The enhanced discriminative sensitivity for
increasing the number of the scale points was further demonstrated by Diefenbach et al.
(1993) who found that a 7-point scale was more sensitive then a 5-point scale. Given the
above findings we adopted a 7-point scale for this survey consistent with most original
item scales, except for an arbitrary decision to measure the ‘understanding of the change’
items on a 5-point scale. As reported above this arbitrary decision for a 5-point scale does
not negatively impact on the reliability and validity of the scale.
The individual items making up the scale for the six readiness drivers and the dependent
variable of ‘behavioural intention for change’ are described in section 3.3.4. The next
53
section describes important statistical considerations for scales applied in quantitative
research including scale development, validity and reliability.
3.3.3 Scale Validity and reliability
Statistical validity and reliability are important considerations when employing survey
research using Likert type aggregated items scales.
3.3.3.1 Validity
Validity refers to the truthfulness of the findings (Adams and Schvaneveldt, 1991).
Researchers distinguish between internal and external validity. Both types of validity
measures are described in detail below.
Researchers identify four main internal validity types that relate to the validity of the
applied research instruments including surveys (Adams and Schvaneveldt, 1991).
1) Face validity relates to the common-sense content of the assessment device (scale).
Here the individual measurement items are assessed and the wording of the items of this
survey (see Appendix B) is consistent with the expected face validity.
2) Content validity relates to the completeness of the content of the subject matter to be
assessed. Examination of content validity ensures that all aspects of the measured
concept are included in the item sample. There are no statistical tests to assess either the
face validity or the content validity of an item other then inspecting the items for
consistency and inclusiveness with the measured theoretical concept or behaviour.
3) Predictive validity relates to the theoretical predictiveness between the measurement
device and some important behaviour. Predictive validity ensures that the items are
predictive of the dependent variable: that is, the items measure what they are supposed to
54
measure. This type of validity type is particularly important when interpreting the
relationships between independent and dependent variables as the findings must ensure
that the results make sense with the measurement and the underlying theoretical concept.
Concurrent validity relates to comparing the measurement scale with a second scale that
measures the same construct or behaviour thought to be an appropriate measure for the
criterion variable. Due to the lack of an appropriate parallel scale or a scale measuring a
similar construct, concurrent validity of the applied scales was not assessed in this thesis.
4) Construct validity relates to the accuracy of assessment of the theoretical construct
through correlating individual items. Construct validity is established by correlating
individual items and items measuring the same construct are expected to correlate highly
whereas unrelated items have correlations closer to zero. Another statistical method to
assess construct validity is through factor analysis.
This thesis assessed the measurement tools’ construct validity using factor analyses as
the statistical method as it not only analyses the selected items for relatedness (e.g.
eigenvalue greater than 1.0), but informs of the variance an underlying concept
contributes to the respective factor. All readiness driver scales and the dependent variable
(behavioural intention) were examined for their factor structure given that modified
scales were employed in this research study. The results of this analysis are depicted in
section 3.3.4. The factor analysis using Principal Component analysis with Varimax
rotation resulted in one factor for most selected items. Only items for the ‘individual
change efficacy’ items and ‘behavioural intention to change’ for the organisational
restructure change produced two factors. However, given that the eigenvalue for the
second factor was just above 1.0 it was decided to accept all the items for one factor.
In contrast, external validity relates to the generalisability of sample results to the
population of interest, across different measures, persons, settings, or times. In that sense
external validity provides confidence in demonstrating that research results are applicable
in natural settings, as contrasted with classroom, laboratory, or survey-response settings.
In statistical analysis and interpretation, external validity is accounted for by:
1. selecting a randomised survey sample from a relevant real-world population;
55
2. considering a representative research setting that matches the environmental
variation in the real-world;
3. selecting a research design that preserves the linkage between the random sample
population and the real-world setting (Calder, Phillips, and Tybout, 1981).
3.3.3.2 Reliability
Statistical reliability refers to the independent replication of research findings. Adams
and Schvaneveldt (1991) describe three different reliability measures including test-retest
reliability, split-half reliability, and equivalent form. The most common reliability test
found in the literature used for Likert type scales is the split-half reliability test using
Cronbach alpha. Cronbach alpha is the mathematical equivalent of the average of all
possible split-half estimates, that is, here all possible split-half estimates are computed
from the item measurement of one sample group of people (Trochim, 2006). An
acceptable alpha coefficient indicating good reliability for the measurement should be
greater than ‘.70’. The reliability results for each measurement scale in this thesis will be
reported using the Cronbach alpha coefficients. The following section describes the
statistical qualities including reliability scores and factor analysis results for all
measurement variables of both the organisational restructure and the IT change.
3.3.4 Measures of readiness drivers
The readiness for change perceptions were measured through six readiness driver scales
(independent variables) and ‘behavioural change intention’ (dependent variable). The
survey included scales for ‘appropriateness of the change’, ‘individual change efficacy’,
‘principal support’, ‘understanding of the change’, ‘personal valence’, ‘need for change’,
and ‘behavioural intention for change’.
56
All items in this survey were modified depending on the assessment of the change type
by replacing “structural change” with “IT change” as appropriate. The individual
readiness driver scales and the dependent variable are described below. The factor
analysis used both the commonly applied Principal Component Analysis and Principal
Axis Factor Analysis to confirm a common factor model. Comparison of the results from
the two different analyses showed the same factor structure. Given that the Principal
Component Analysis (PCA) is the commonly used method to confirm factor models,
only the factor loadings form the PCA are reported below.
Omnibus factor analysis is not reported since the research questions were developed and
taken from specific literature previously published in this area of research. The purpose
of the factor analysis in this study was confirmatory and not exploratory. Furthermore,
omnibus factor analysis was not undertaken as the selected questions were already
identified by previous research as valid measures, and this study only confirmed the
factors identified in the literature.
3.3.4.1 Appropriateness of the changes
Items for this readiness driver were derived from readings of the organisational change
literature exploring employee attitudinal changes towards change (Armenakis, Harris,
and Feild, 1999a; Armenakis, Harris, and Mossholder, 1993; Armenakis and Stanley,
2002; Holt, 2000; Holt, 2002). More recently, Cole et al. (2005) identified that change
appropriateness amongst other variables had a predictive impact on the behavioural
outcomes measures in managers. In their study Cole et al.(2005) applied one similar item
in assessing ‘appropriateness’ as part of a change sentiment measure for each of four
change activities. The appropriateness scale in this study is made out of five items and
the scale’s construct validity was rigorously tested using factor analysis. Participants
responded on a 7-point scale, ranging from 1 (strongly disagree) to 7 (strongly agree).
The coefficient alpha reliability for the 5 items was .87 for the organisational restructure
measure and .91 for the IT change. The items for this scale are listed below.
57
Table 5: Items for the 'appropriateness of the change' scale
The desired structural change will benefit the organization.
Developed from literature (Cole, Harris, and Bernerth, 2005)
It is the right time for the organization to implement this structural change.
Developed from literature (Cole, Harris, and Bernerth, 2005)
This structural change will improve the organisation. Developed from literature (Cole, Harris, and Bernerth, 2005)
This structural change is in the best interest for the organisation.
Developed from literature (Cole, Harris, and Bernerth, 2005)
This structural change poses a great risk for the organisation.
Developed from literature (Cole, Harris, and Bernerth, 2005)
The items for the ‘appropriateness of the change’ were factor analysed to determine the
validity of the ‘appropriateness of the change’ scale. The results from the factor analysis
support the aggregation of the five items into one scale for both the organisational
restructure and IT change items- see tables 6 and 7.
Table 6: Factor loading of the ‘appropriateness of the change’ for the organisational restructure’
Items Factor 1 The desired structural change will benefit the organization. .93 It is the right time for the organization to implement this structural change.
.85
This structural change will improve the organisation. .94 This structural change is in the best interest for the organisation. .94 This structural change poses a great risk for the organisation. .43
Eigenvalue: 3.54
Percent of variance: 70.8 %
58
Table 7: Factor loading of the ‘appropriateness of the change’ for the IT change
Items Factor 1 The desired IT change will benefit the organization. .95 It is the right time for the organization to implement this IT change. .88 This IT change will improve the organisation. .93 This IT change is in the best interest for the organisation. .91 This IT change poses a great risk for the organisation. .66
Eigenvalue: 3.79; Percent of variance: 75.70%
3.3.4.2 Individual change efficacy
Levels of change-related self-efficacy were measured with 5 items asking employees to
make generalized judgments of self-mastery about the impending organizational changes
(Ashford, 1988; Schwoerer and Rosen, 1992). Participants responded on a 7-point scale,
ranging from 1 (strongly disagree) to 7 (strongly agree). The coefficient alpha reliability
for the 5 items was .85 for the organisational restructure measure and .87 for the IT
change. Two of the items were reverse-scored because they were negatively worded. The
items for this scale are listed in table 8.
Table 8: Items for the 'individual change efficacy' scale
I am confident in my ability to deal with the structural change.
(Schwoerer and Rosen, 1992)
However this structural change affects me, I am sure that I can handle them.
(Schwoerer and Rosen, 1992)
I am sure that I will be able to cope with this structural change.
(Schwoerer and Rosen, 1992)
I have reason to believe that I may not perform well in my job, following the implementation of this structural change. (R)
(Schwoerer and Rosen, 1992)
I feel insecure about my ability to work effectively once this structural change is implemented. (R)
(Schwoerer and Rosen, 1992)
59
The items for the ‘change efficacy’ were factor analysed to determine the validity of the
‘change efficacy’ scale. All items of the organisational restructure were accepted for one
factor since the second factor had only an Eigenvalue just above 1.0. The Eigenvalue for
each factor must be above 1 for a factor to be significantly differentiated from another
factor.
The results from the factor analysis support the aggregation of the five items into one
scale for both the organisational restructure and IT change items- see tables 9 and 10.
Table 9: Factor loading of the ‘change efficacy’ for the organisational restructure
Items Factor 1 Factor 2 I am confident in my ability to deal with the structural change.
.93
However this structural change affects me, I am sure that I can handle them.
.91
I am sure that I will be able to cope with this structural change.
.93
I have reason to believe that I may not perform well in my job, following the implementation of this structural change.
.88
I feel insecure about my ability to work effectively once this structural change is implemented.
.89
Eigenvalues: 3.37 and 1.10
Percent of variance: Factor one after VARIMAX rotation accounts for 52.8%of the item variance, and factor two accounts for 34.4% of the item variance.
Table 10: Factor loading of the ‘change efficacy’ for the IT change
Items Factor 1 I am confident in my ability to deal with the IT change. .89 However this IT change affects me, I am sure that I can handle them. .89 I am sure that I will be able to cope with this IT change. .94 I have reason to believe that I may not perform well in my job, following the implementation of this IT change.
.69
I feel insecure about my ability to work effectively once this IT change is implemented.
.69
Eigenvalue: 3.43; Percent of variance: 68.57%
60
3.3.4.3 Principal support
A measure of management, supervisor, and peer support for the changes was developed
for use in the present study by adapting items from the previously established social
support scale (Kim, 1996). Kim’s (1996) measure for the four scales had a Cronbach
alpha ranging from 0.64 to 0.95. Participants responded on a 7-point scale, ranging from
1 (strongly disagree) to 7 (strongly agree). The coefficient alpha reliability for the 5 item
scale listed in Table 11 was .81 for the organisational restructure measure and .87 for the
IT change.
Table 11: Items for the ‘principal support’ scale
I believe top management are strongly behind this structural change and support its implementation.
(Kim, 1996)
Most of my work colleagues are supportive of this structural change.
(Kim, 1996)
My immediate superior is supportive of this structural change.
(Kim, 1996)
There is support from the managers in this work unit for this structural change.
(Kim, 1996)
The managers in this work unit can be relied on when things get tough.
(Kim, 1996)
The items for the ‘principal support’ were factor analysed to determine the validity of the
‘principal support‘ scale. The results from the factor analysis support the aggregation of
the five items into one scale for both the organisational restructure and IT change items:
see tables 12 and 13.
61
Table 12: Factor loading of the ‘principal support’ for the organisational restructure
Items Factor 1 I believe top management are strongly behind this structural change and support its implementation.
.74
Most of my work colleagues are supportive of this structural change. .70 My immediate superior is supportive of this structural change. .83 There is support from the managers in this work unit for this structural change.
.83
The managers in this work unit can be relied on when things get tough. .68
Eigenvalue: 2.88; Percent of variance: 57.68%
Table 13: Factor loading of the ‘principal support’ for the IT change.
Items Factor 1 I believe top management are strongly behind this IT change and support its implementation.
.70
Most of my work colleagues are supportive of this IT change. .82 My immediate superior is supportive of this IT change. .91 There is support from the managers in this work unit for this IT change.
.92
The managers in this work unit can be relied on when things get tough. .71
Eigenvalue: 3.34; Percent of variance: 66.81%
3.3.4.4 Understanding of the change
A 5-item scale measuring the understanding of the changes was developed by adapting
Evanski’s (1996) previously established understanding items. Participants responded on a
5-point scale, ranging from 1 (not at all) to 5 (a great deal). The coefficient alpha
reliability for the 5 items was .88 for the organisational restructure measure and .92 for
the IT change. The five items selected for this scale are listed in Table 14.
62
Table 14: Items for the 'understanding of the change' scale
Do you understand what is involved in the structural change?
(Evanski, 1996)
Do you understand the rationale underlying the structural change?
(Evanski, 1996)
Do you understand why the structural change is made? (Evanski, 1996) Do you see why the structural change is necessary? (Evanski, 1996) Do you understand what is expected of you to implement the structural change?
(Evanski, 1996)
The items for the ‘understanding of the change’ were factor analysed to determine the
validity of the ‘understanding of the change’ scale. The results from the factor analysis
support the aggregation of the five items into one scale for both the organisational
restructure and IT change items- see tables 15 and 16.
Table 15: Factor loading for the ‘understanding of the change’ scale for the organisational restructure.
Items Factor 1 Do you understand what is involved in the structural change? .84 Do you understand the rationale underlying the structural change? .90 Do you understand why the structural change is made? .93 Do you see why the structural change is necessary? .79 Do you understand what is expected of you to implement the structural change?
.70
Eigenvalue: 3.50; Percent of variance: 69.90%
Table 16: Factor loading for the ‘understanding of the change’ scale for IT change.
Items Factor 1 Do you understand what is involved in the IT change? .84 Do you understand the rationale underlying the IT change? .94 Do you understand why the IT change is made? .95 Do you see why the IT change is necessary? .85 Do you understand what is expected of you to implement the IT change?
.79
Eigenvalue: 3.82; Percent of variance: 76.48%
63
3.3.4.5 Personal valence
A 5-item scale measuring personal valence was originally developed by Evanski (1996)
and modified for use in the present study. Personal valence in this research context is
defined as a perception of personal improvement as a result of change implementation.
Participants responded on a 7-point scale, ranging from 1 (strongly disagree) to 7
(strongly agree). The coefficient alpha reliability for the 5 items was .81 for the
organisational restructure measure and .84 for the IT change. The five items for this scale
are listed in table 17, and two items required reverse scoring for the statistical analysis as
they were negatively worded.
Table 17: Items for the' personal valence' scale
I am convinced that I will have a lot to gain from this structural change.
(Evanski, 1996)
I can’t see how this structural change will help me. (R) (Evanski, 1996) This structural change is personally meaningful for me. (Evanski, 1996) I can’t see how this structural change will enhance my career prospects. (R)
(Evanski, 1996)
This structural change will benefit me personally. (Evanski, 1996)
The items for the ‘personal valence’ were factor analysed to determine the validity of the
‘personal valence’ scale. The results from the factor analysis support the aggregation of
the five items into one scale for both the organisational restructure and IT change items-
see tables 18 and 19.
Table 18: Factor loading for the ‘personal valence’ scale for organisational restructure
Items Factor 1 I am convinced that I will have a lot to gain from this structural change. .77 I can’t see how this structural change will help me. .77 This structural change is personally meaningful for me. .73 I can’t see how this structural change will enhance my career prospects.
.72
This structural change will benefit me personally. .82
Eigenvalue: 2.90; Percent of variance: 58 %
64
Table 19: Factor loading for the ‘personal valence’ scale for IT change
Items Factor 1 I am convinced that I will have a lot to gain from this IT change. .83 I can’t see how this IT change will help me. .79 This IT change is personally meaningful for me. .81 I can’t see how this IT change will enhance my career prospects. .73 This IT change will benefit me personally. .77
Eigenvalue: 3.06; Percent of variance: 61.24%
3.3.4.6 Need for change
Need for change was measured by adapting items from the “Attitude towards
organisational change scale” by Evanski (1996). The adapted five item scale contained
items like “I feel the structural change is needed at this time” or “The need for structural
change is vague” (this item was recoded). Participants responded on a 7-point scale,
ranging from 1 (strongly disagree) to 7 (strongly agree). The coefficient alpha reliability
for the 5 items was .84 for the organisational restructure measure and .91 for the IT
change – see table 20. Two items were negatively worded and required reverse scoring
for the statistical analysis.
Table 20: Items for the 'need for change' scale
I do understand why this structural change is needed for this organisation.
(Evanski, 1996)
I do feel the structural change is needed at this time. (Evanski, 1996) The need for the structural change is not urgent. (R) (Evanski, 1996) The need for structural change is vague. (R) (Evanski, 1996) It is important that this structural change happens. (Evanski, 1996)
The items for ‘need for change’ were factor analysed to determine the validity of the
developed ‘need for change’ scale. The results from the factor analysis support the
65
aggregation of the five items into one scale for both the organisational restructure and IT
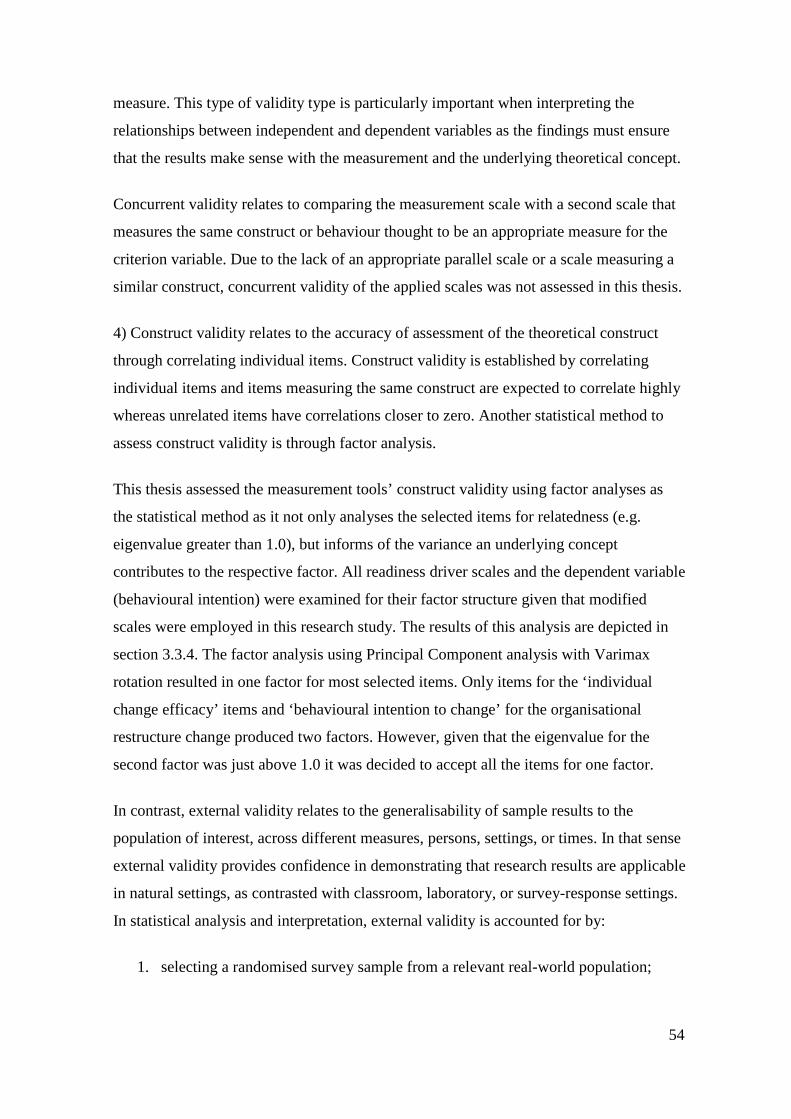
change items- see tables 21 and 22.
Table 21: Factor loading for the ‘need for change’ scale for the organisational restructure
Items Factor 1 I do understand why this structural change is needed for this organisation.
.88
I do feel the structural change is needed at this time. .91 The need for the structural change is not urgent. .67 The need for structural change is vague. .63 It is important that this structural change happens. .86
Eigenvalue: 3.19; Percent of variance: 63.88%
Table 22: Factor loading for the ‘need for change’ scale for IT change
Items Factor 1 I do understand why this IT change is needed for this organisation. .83 I do feel the IT change is needed at this time. .93 The need for the IT change is not urgent. .87 The need for IT change is vague. .80 It is important that this IT change happens. .90
Eigenvalue: 3.77; Percent of variance: 75.45%
3.3.4.7 Behavioural Intention for change
The dependent variable or outcome measure is the ‘behavioural intention for change’
measure. This measure provides an indication of the employee’s change behaviour
following exposure to the organisational restructure experience. From the 18 items 5
were selected and adapted from the ‘inventory of change in organisational culture
instrument’ by Dunham et al. (1989). The selected items are representative of the three
attitude dimensions including emotional, cognitive and behavioural intention towards
change developed in this instrument. These three dimensions of the scale are reported to
have a Cronbach’s coefficient alpha reliability ranging from 0.82 to 0.92.
66
This measurement instrument has an additional two modified items from Evanski’s
(1996) attitude assessment survey: ‘In future I actively defend the structural change as I
believe that it will work’ and ‘In future I will put in time to support the structural
change’. These items were added to measure the employee’s behavioural support towards
the change.
Respondents were asked to answer the items on a 7-point Likert scale, ranging from
(strongly disagree) to 7 (strongly agree). The coefficient alpha reliability for the 7 items
was .88 for the organisational restructure measure and .90 for the IT change measure.
The individual items for this scale are listed in Table 23.
Table 23: Items for the 'behavioural intention for change' scale
In the future I will resist the structural change. (Dunham, Grube, Gardner, and Cummings, 1989)
In the future I will be inclined to try the structural change.
(Dunham, Grube, Gardner, and Cummings, 1989)
In the future I will support the structural change. (Dunham, Grube, Gardner, and Cummings, 1989)
In the future I will do whatever possible to support the structural change.
(Dunham, Grube, Gardner, and Cummings, 1989)
In the future I will hesitate to press for such structural change.
(Dunham, Grube, Gardner, and Cummings, 1989)
In the future I will actively defend the structural change as I believe that they will work.
(Evanski, 1996)
In the future I will put in time to support the structural change.
(Evanski, 1996)
The seven items for ‘behavioural change intention’ were factor analysed to determine the
validity of the ‘behavioural change intention’ scale. All seven items measuring
‘behavioural change intention’ for the organisational restructure were accepted to form
one ‘behavioural change intention’ scale even though the items loaded on two factors.
However, the second factor loading had an eigenvalue just above 1.0 which indicates a
67
small amount of variation explained. In order to show a significant amount of variation
explained eigenvalues must be greater than 1.
The results from the factor analysis support the aggregation of the seven items into one
scale for both the organisational restructure and IT change items- see tables 24 and 25.
Table 24: Factor loading for the ‘behavioural change intention’ scale for organisational restructure
Items Factor 1
Factor 2
In the future I will resist the structural change. .87 In the future I will be inclined to try the structural change. .76 In the future I will support the structural change. .67 .65 In the future I will do whatever possible to support the structural change.
.62 .66
In the future I will hesitate to press for such structural change. .61 .33 In the future I actively defend the structural change as I believe that they will work.
.86
In the future I will put in time to support the structural change. .87
Eigenvalues: 4.13 and 1.00
Percent of variance: Factor one after VARIMAX rotation accounts for 37.3%of the item variance, and factor two account: for 36.0% of the item variance.
Table 25: Factor loading for the ‘behavioural change intention’ scale for IT change.
Items Factor 1 In the future I will resist the IT change. .76 In the future I will be inclined to try the IT change. .68 In the future I will support the IT change. .93 In the future I will do whatever possible to support the IT change. .91 In the future I will hesitate to press for such IT change. .65 In the future I will actively defend the IT change as I believe that they will work.
.77
In the future I will put in time to support the IT change. .84
Eigenvalue: 4.46; Percent of variance: 63.66%
68
In summary the factor analysis permits the aggregation of items to form measurement
scales and the depicted data above clearly indicate that the developed scales show good
construct validity. Furthermore, the reliability data for each of the scales – summarised in
table 26 - also give further statistical confidence for the developed scales. All the
reliability coefficients for the measurement variables are greater than .80, indicating that
these measures have sufficient reliability. The reliability range was .81 to .88 for the
organisational restructure change and .84 to .91 for the IT change. The close reliability
ranges for the measurement tools for the two change types suggests that the employed
measurement tools have good reliability across the two different change types.
Table 26: Summary of reliability coefficients for all six readiness driver variables and the dependent variable for both organisational restructure and IT change
Cronbach alpha-
org change
Cronbach alpha- IT
change
Appropriateness of the changes .87 .91
Individual change efficacy .85 .87
Principal support .81 .87
Understanding the changes .88 .92
Personal valence .81 .84
Need for change .84 .91
Behavioural change intention .88 .90
3.3.5 Quantitative analysis
The quantitative analysis was performed using the Statistical Package for Social Science
(SPSS 14). This package includes factor analysis, descriptive statistics, correlation, and
regression analysis.
69
3.3.5.1 Demographics
The demographic information revealed that about 75% of the respondents were female
employees. This appeared to be consistent with the staffing profile of the organization,
namely that a majority of employed staff was female. Furthermore, about 50% of staff
had tertiary qualifications indicating that staff might not experience major problems in
learning new tasks, software applications or procedures. However, the ability to learn
new information is different from the motivation and willingness to see value in learning
new tasks. The focus of this study was not to determine their learning ability but to
explore employees’ readiness to embrace two types of changes and their intentions to act
on their readiness.
Age was another variable of importance when considering change processes and success
of change implementation. Age was considered as anecdotally older employees are seen
as “set in their ways” and therefore considered less receptive to change. Unfortunately
age related data was not stored at the first survey, but given that the company profile of
the investigated organisation did not change markedly over the data collection period
from T1 to T2 it is expected that the age profile of the organisation also remained stable.
3.3.5.2 Correlation and regression analysis
Prior to the application of the following statistical procedures the data set was corrected
for missing values and that all negatively worded questions were reverse scored i.e. an
item score on Likert scales of 5, 4, 3, 2, 1 were scored as 1, 2, 3, 4, 5 respectively.
Correlation coefficients reveal the relationship between examined variables, in particular,
the directional strength of the linear relationship between two variables. The correlation
coefficients further provide information in relation to the construct validity of the
measurement tools employed. In social science research, scale reliability of less than
70
r =.80 is considered acceptable when comparing differences between measurement
scales. Comparisons of measurement scales with greater correlation coefficients are
considered to measure the same construct (Cohen and Cohen, 1983).
Regression analysis is able to examine the quantitative data revealing the predictive
nature of both demographic variables and the readiness drivers on behavioural change
intentions. In this thesis the regression analysis will answer a number of research
questions relating to the influence of demographic variables and readiness drivers for
different change types and change stages as well as for the supervisor and subordinate
groups.
The different measurement points permit analysis of the data from both a cross sectional
and longitudinal perspective. Cross sectional analysis provides a snapshot of the dynamic
changes whereas the longitudinal analysis of the data provides temporal insight and
understanding of the dynamic change process. Both the correlation analysis and stepwise
multiple regression models were employed to answer nine research questions.
3.3.5.3 Research questions
The first eight research questions providing a snapshot of the dynamic change process as
they examine the predictive strength of both the demographic and the six readiness
drivers on ‘behavioural intention to change’. The focus of this investigation is to explore
which predictors for ‘behavioural intention to change’ are active for employees
experiencing IT changes and organisational restructure as well as differentiating between
supervisor and subordinates’ change readiness. Six research questions of this type are
listed below.
RQ 1 At the planning stage – to what extent do demographic variables and the six
readiness drivers predict employees’ behavioural intention to change for the IT change?
RQ 2 At the planning stage - to what extent do demographic variables and the six
readiness drivers for supervisors and subordinates predict behavioural intention to change
for the IT change?
71
RQ 3 At the implementation stage - to what extent do demographic variables and the six
readiness drivers predict behavioural intention to change for the two specific change
types?
RQ 4 At the implementation stage - to what extent do demographic variables and the six
readiness drivers for supervisors and subordinates differ in predicting behavioural
intention to change for two specific change types?
RQ 5 At the post-implementation stage - to what extent do demographic variables and
the six readiness drivers predict employees’ behavioural intention to change for the
organisational restructure?
RQ 6 At the post-implementation stage - to what extent do demographic variables and
the six readiness drivers for supervisors and subordinates predict behavioural intention to
change for the organisational restructure?
As already indicated above, the two measurement points permit for a longitudinal
assessment of the predictive strength of the demographic variables and the readiness
drivers for different change types over time. However the insights gained from this
analysis into the dynamic change across time are limited as we do not have a matched
population group. That is, attitudinal changes of individual employees between the two
measurement points cannot be identified as the two sample groups can not be matched
up. Instead the analysis will provide a sample population focused understanding of
possible differences in predictors for two time points. Answers to the following research
questions will provide new understanding of the impact the dynamic change process may
have on readiness predictors. Below are the three (3) research questions relating to the
cross-sectional and longitudinal investigations of the readiness for change impact on
employees behavioural intentions to change.
RQ 7 Cross-sectional design at implementation stage - to what extent do demographic
variables and the six readiness drivers for supervisors and subordinates differ in
predicting behavioural intention to change between two specific change types?
RQ 8 Longitudinal design for IT change - to what extent do demographic variables and
the six readiness drivers for supervisor and subordinates differ in predicting behavioural
intention to change for both the preparation and the implementation stages?
72
RQ 9 Longitudinal design for organisational restructure - to what extent do demographic
variables and the six readiness drivers for supervisors and subordinates differ in
predicting behavioural intention to change for both the implementation and the post-
implementation stages?
Answers to the above research questions are reported in the next chapter. The following
section shifts our attention to the methodology for the qualitative aspect of this thesis.
3.4 Qualitative data collection and analysis
This section describes the processes of qualitative data collection and the analysis
employed to interpret the findings. Qualitative data was obtained from two unstructured
interviews with the Change Project Officer of the HR company and from invited
comments from all respondents as part of the quantitative online survey.
3.4.1 Interview with project coordinator
Over the data gathering period the Change Project Officer for the organizational and IT
changes participated in two unstructured interviews. These two interviews lasted for
about one hour each were not taped and detailed notes were not kept. The objectives
from these interviews were to obtain some qualitative insights into the change process
and to explore the focus of anticipated problems from a senior management perspective.
3.4.2 Open questions asking for employee comments
At T1 employees were asked to make unguided comments about the two changes without
asking specific questions. Here employees were provided with space to add their
73
comments asking them for additional comments regarding both the organisational
restructure and the IT change. Unfortunately employee comments at T2 were not stored
due to a fault in the online survey program. The objectives for asking open questions was
for the employee to freely express their personal emotions and thoughts about the actual
change and the change implementation process for both the organisational restructure and
the IT change.
3.4.3 Qualitative analysis
This section starts with a brief review of different triangulation methods and
demonstrates the application of an appropriate triangulation method for this study. The
triangulation method employed in this study uses the qualitative findings as a way of
validating the quantitative results.
3.4.3.1 Review of triangulation strategies
Historically there has been a deep divide relating to the epistemology and ontology in
research paradigms between positivists and phenomenological researchers (Datta, 1994;
Guba and Lincoln, 1994, Burrell, 1979; Lincoln and Guba, 1985). Burrell and Morgan
(1979) were of the strong opinion that the different paradigms, quantitative and
qualitative methodologies are incompatible research approaches. The differences are
further highlighted by the opposing beliefs of the two sets of research. The positivist
paradigm accepts only observable facts as knowledge and rejects findings through
induction, whereas the phenomenological approach relies on subjective interpretations
and tries to understand the meaning of the observed phenomena.
As a consequence of this divide, researchers tend to prefer one collection design to the
other regarding their chosen data collection design as more superior for their respective
research questions (Creswell, 1994; Lincoln and Guba, 1985; Schendel and Hatten,
74
1972). Creswell (1994, p.2) defined the quantitative research design as ‘an inquiry into a
social or human problem, based on testing a theory, measured by numbers, and analysed
with statistical procedures, in order to determine whether the predictive generalizations
of the theory hold true’. In contrast he viewed the qualitative data collection as ‘an
inquiry process of understanding a social or human problem, based on building a
complex, holistic picture, formed with words, reporting detailed views of informants, and
conducted in a natural setting’ (p 1). This distinction considers both methods as
complementary approaches in answering research questions, a view not held by Lincoln
(1985) who considered both approaches as incompatible. Schendel and Hatten
(1972,p.102) advocated that research in strategic management needed ‘reliable data
specifically collected to allow the development of testable answers to strategic
questions’.
The friction in the research community caused by this artificial divide encouraged
researchers to explore new and more informative paradigms (Brewer and Hunter, 1989;
Easterby-Smith, Thorpe, and Lowe, 1991). The emergence of the new paradigm is
referred to by researchers as a mixed methodology containing elements of both
quantitative and qualitative methods (Brewer and Hunter, 1989). Easterby-Smith et
al.(1991) in their book refined the developed methods and approaches and listed four
different type of triangulations.
1. Data triangulation – data is collected at different times from different sources.
2. Investigator triangulation – here different researchers collect data independently.
3. Methodological triangulation – here both qualitative and quantitative methods are
used to study the same phenomena within the same study.
4. Theory of triangulation – here a theoretical concept from one discipline is applied
to explain a phenomenon in another discipline.
For this thesis the methodological triangulation was chosen as the most appropriate
strategy to link the findings of quantitative data with qualitative narratives/comments.
Both qualitative and quantitative methods were employed to study the same
phenomenon, namely readiness for change, in the same study.
75
The application of methodological triangulation enhances our understanding of the
change process as it permits inferences between two different data sets from the same
change event. This approach has also been supported in the organizational literature as it
provides distinct advantages in answering research questions (Armenakis, Mossholder,
and Harris, 1990; Hitt, Gimeno, and Hosskisson, 1998; Judge and Zeithami, 1992;
Karami, Rowley, and Analoui, 2006; Leedy, 1997). Pofi (2002) contended that using
only one method of measurement may ignore valuable information and risks making
erroneous conclusions. She asserted that both the use of quantitative and qualitative
methods for data collection indicate a well-planned organizational assessment for
understanding organizational behaviour. Furthermore, Karami et al. (2006) found in their
examination of research methodologies published in some of the leading business and
management journals that researchers used a wide range of different methodological
approaches. This finding indicates that peer reviewed researchers acknowledged the
value of both inductive and deductive research methodologies.
Even so, the ground has shifted in support of triangulation methodologies over the years;
it is of interest to note Morse’s (1991, p.121) assertion when she writes ‘blending or
merging of the data does not occur in the process of analysis but in fitting of the results
from each study into a cohesive and coherent outcome or theory, or confirming or
revising existing theory’. She further states that ‘methodological triangulation is a
method of obtaining complementary findings that strengthen research results and
contribute to theory and knowledge development’ (p 122). Morse’s (1991) assertions
further diminish the philosophical divide between inductive and deductive research
designs and promote methodological triangulation as a tool that adds to and assists with
the interpretations of the findings obtained from two complementary research paradigms
rather than interferes with the data analysis process.
3.4.3.2 Methodological triangulation approach of qualitative and quantitative findings
This thesis applied methodological triangulation approach to explain the findings from
both qualitative and quantitative data analysis to add insight into the prevailing attitudes
76
of respondents but also to enhance the interpretation and understanding of the change
process and to strengthen our confidence in interpreting the data meaningfully.
The methodological triangulation approach involved the comparison of employee
aggregated ‘behavioural intention for change’ scores for both organisational restructure
and IT change with the qualitative data consisting of the same employees’
comments/narratives. This comparison between quantitative and qualitative data is
consistent with the methodological triangulation described by Morse (1991). In
methodological triangulation qualitative and quantitative data are collected at the same
time to answer the research questions, but only the results are interpreted through this
triangulation method. Thus this triangulation method has no impact on the research
design as only the findings are interpreted. The triangulation approach involved the
detection of consistencies between employee comments and the quantitative findings
from the aggregated items of the ‘behavioural intention to change’ measure as an overall
change readiness indicator.
In comparing the quantitative findings with the employee comments we expect that
respondents with a greater sense of change readiness also demonstrate a more positive
attitude towards the changes in their comments/narratives.
3.4.4 Qualitative analysis of employee comments
Thematic analysis of narratives is one of several qualitative analysis methods applied in
inductive research (Creswell, 1994; Denzin and Lincoln, 2000; Meier, Boivin, and Meier,
2006; Meier and Boivin, 2000; Rothe, 1994; Silverman, 2000).
Meier et al. (2006) demonstrated the application of theme analysis on transcripts of 18
counselling sessions to identify themes of depression. Theme-analysis follows four major
operational procedures as explained by Meier and Boivin (2000). Theme-analysis
involves: 1) segmenting the narrative into meaningful units; 2) developing themes for the
identified units; 3) identifying the object of the themes (animate or inanimate); and 4)
determining change on themes. Given that our collected comment data are from one
77
measurement point only, this thesis is unable to apply the fourth step namely identifying
changes in the themes. The findings of this analysis are reported in the next chapter.
Thematic analysis is a convenient technique to analyse small quantitative data sets for
common themes (Meier, Boivin, and Meier, 2006; Meier and Boivin, 2000; Silverman,
2000). A common theme is defined as a recurring factor or element identifiable in the
narratives of respondents. Such an analysis provides a structure and better understanding
of respondents’ narratives. In this study thematic analysis was applied to employee
comments to identify themes that enhance the understanding of the dynamic change and
to identify potential barriers for change implementation.
The data was ordered according to the two change types and level of responsibility
Education =education levels; Responsibility= supervisor/subordinate (Coding- supervisor 0; subordinate 1); Time in position = time in position in months; Time in organisation (Likert scale <6 months=1; 6-12 months=2; 1-2 years=3, 3-5 years=5; >5 years =5); Sex = coding- males =0; females=1); Efficacy = change efficacy, Understanding = understanding of the change, Appropriateness = appropriateness of the change; Need = need for change, Support = principal support, Valence = personal valence, Intention = intention to change
85
Table 30: Correlations for IT change at the planning stage by supervisors
T1-IT Supervisor Mean SD N 1 2 3 4 5 6 7 8 9 10 11
Education =education levels; Time in position = time in position in months; Time in organisation (Likert scale <6 months=1; 6-12 months=2; 1-2 years=3, 3-5 years=5; >5 years =5); Sex = coding- males =0; females=1); Efficacy = change efficacy, Understanding = understanding of the change, Appropriateness = appropriateness of the change; Need = need for change, Support = principal support, Valence = personal valence, Intention = intention to change
Correlation results in the subordinate group (table 31) indicate that staff with higher
levels of education have fewer expectations to obtain personal rewards and career
enhancements as demonstrated by the inverse significant correlation r (115)= -0.29; p <
0.004.
Table 31: Correlations for IT change at the planning stage by subordinates.
T1-IT Subordinate Mean SD N 1 2 3 4 5 6 7 8 9 10 11
Education =education levels; Time in position = time in position in months; Time in organisation (Likert scale <6 months=1; 6-12 months=2; 1-2 years=3, 3-5 years=5; >5 years =5); Sex = coding- males =0; females=1); Efficacy = change efficacy, Understanding = understanding of the change, Appropriateness =
86
appropriateness of the change; Need = need for change, Support = principal support, Valence = personal valence, Intention = intention to change
4.3.2 Regression results
This regression analysis examines the predictive value of demographic variables and the
six readiness drivers for the IT planning stage consistent with research question one.
RQ 1 At the planning stage – to what extent do demographic variables and the six
readiness drivers predict employees’ behavioural intention to change for the IT change?
The results in table 32 clearly show that for IT change at the planning stage only two
readiness drivers are significant predictors for ‘behavioural intention for change’
accounting for 54 % of the predicted variance. ‘Appropriateness of the change’ and
‘change efficacy’ account for all the explained variance which suggests that these two
drivers are important readiness indicators at the IT planning stage. It is also worth noting
that the demographic variables were not predictive in explaining respondents’
behavioural intention at this early change stage.
Table 32: Regression results for IT change at the planning stage
Education =education levels; Responsibility= supervisor/subordinate (Coding- supervisor 0; subordinate 1); Time in position = time in position in months; Time in organisation (Likert scale <6 months=1; 6-12 months=2; 1-2 years=3, 3-5 years=5; >5 years =5); Sex = coding- males =0; females=1); Efficacy = change efficacy, Understanding = understanding of the change, Appropriateness = appropriateness of the change; Need = need for change, Support = principal support, Valence = personal valence, Intention = intention to change
91
Table 35: Correlations for the organisational restructure at implementation by supervisors
T1 Org SUP Mean SD N 1 2 3 4 5 6 7 8 9 10 11
Education 5.78 1.72 45 1.00Time in position 20.82 22.3 44 -0.25 1.00Time in organisation 3.33 1.43 45 0.08 .48** 1.00
Education =education levels; Time in position = time in position in months; Time in organisation (Likert scale <6 months=1; 6-12 months=2; 1-2 years=3, 3-5 years=5; >5 years =5); Sex = coding- males =0; females=1); Efficacy = change efficacy, Understanding = understanding of the change, Appropriateness = appropriateness of the change; Need = need for change, Support = principal support, Valence = personal valence, Intention = intention to change
Table 36 depicts the correlations for the subordinate group. It suggests that the results
mirror those of the combined group analysis where male employees tend to have a
greater ‘understanding of the changes’ and a consideration for the organisation’s ‘need
for change’. Both readiness drivers have a weak but significant correlation with gender,
namely males have a greater ‘understanding of the changes’ r (122) =- 0.28, p < 0.004;
and perceive a greater ‘need for change’ r (131) = - 0.3, p < 0.004. Given the weak
although significant correlations, one must be cautious in interpreting results that include
the gender variable.
As expected, all readiness drivers depicted in table 36 were significantly correlated
although only moderately in strength.
92
Table 36: Correlations for the organisational restructure at implementation by subordinates
Education =education levels; Time in position = time in position in months; Time in organisation (Likert scale <6 months=1; 6-12 months=2; 1-2 years=3, 3-5 years=5; >5 years =5); Sex = coding- males =0; females=1); Efficacy = change efficacy, Understanding = understanding of the change, Appropriateness = appropriateness of the change; Need = need for change, Support = principal support, Valence = personal valence, Intention = intention to change
In summary, the correlations suggest that the demographic variables have only a small
influence on readiness drivers in the subordinate group, but do not impact on the
dependent variable for either supervisor or subordinate groups at the implementation
stage for organisational restructure. The readiness variables however, correlated
significantly with each other, but the overall moderate correlations were acceptable and
all readiness scales were retained in further analysis.
4.4.2 Regression results for the organisational restructure
The influence of demographic variables and the readiness drivers on behavioural
intention for organisational restructure at the implementation stage was examined for the
combined group and separately for the supervisor and subordinate groups.
93
RQ 3 At the implementation stage - to what extent do demographic variables and the six
readiness drivers predict behavioural intention to change for the two specific change
types?
RQ 4 At the implementation stage - to what extent do demographic variables and the six
readiness drivers for supervisors and subordinates differ in predicting behavioural
intention to change for two specific change types?
The results as depicted in table 37 indicate that the organisational restructure for the
combined employee group was concerned with the appropriateness of this change for the
organisation. ‘Appropriateness of the change’ accounted for 31% of the variance as
compared to ‘change efficacy’ and ‘understanding the change’ which accounted for only
2% and 5% respectively.
Table 37: Regression results for organisational restructure at implementation
Education =education levels; Responsibility= supervisor/subordinate (Coding- supervisor 0; subordinate 1); Time in position = time in position in months; Time in organisation (Likert scale <6 months=1; 6-12 months=2; 1-2 years=3, 3-5 years=5; >5 years =5); Sex = coding- males =0; females=1); Efficacy = change efficacy, Understanding = understanding of the change, Appropriateness = appropriateness of the change; Need = need for change, Support = principal support, Valence = personal valence, Intention = intention to change
97
The correlation matrices in tables 40 and 41 display the coefficients for the supervisor
and subordinate subgroups respectively.
Table 40: Correlations at implementation of IT change by supervisor
T2 IT Supervisor Mean SD N 1 2 3 4 5 6 7 8 9 10 11 12
Education =education levels; Time in position = time in position in months; Time in organisation (Likert scale <6 months=1; 6-12 months=2; 1-2 years=3, 3-5 years=5; >5 years =5); Sex = coding- males =0; females=1); Efficacy = change efficacy, Understanding = understanding of the change, Appropriateness = appropriateness of the change; Need = need for change, Support = principal support, Valence = personal valence, Intention = intention to change
In the supervisor subgroup the age coefficient suggests that male supervisors were older
than their female counterparts R (37) = - 0.46; p < 0.004. The significant correlation
between education with the ‘need for change’ driver in Table 25 indicates that higher
educated supervisors are less sure about the need for IT change R (24) = 0.44; p < 0.004.
The correlation results for the readiness drivers in table 40 show that ‘change efficacy is
one of the driver variables that did not significantly correlate with the other readiness
drivers except for ‘need for change’. This suggests that the ‘change efficacy’ measure has
less in common with the other readiness drivers for supervisors at the IT implementation
stage.
98
Table 41: Correlations at implementation of IT change by subordinates.
T2 IT Subordinate Mean SD N 1 2 3 4 5 6 7 8 9 10 11 12
Age 32.22 9.54 103 1.00Education 4.88 1.81 103 -0.18 1.00Time in position 22.56 30.1 103 .33** -0.04 1.00Time in organisation 2.94 1.24 103 .22* -0.06 .53** 1.00
Education =education levels; Time in position = time in position in months; Time in organisation (Likert scale <6 months=1; 6-12 months=2; 1-2 years=3, 3-5 years=5; >5 years =5); Sex = coding- males =0; females=1); Efficacy = change efficacy, Understanding = understanding of the change, Appropriateness = appropriateness of the change; Need = need for change, Support = principal support, Valence = personal valence, Intention = intention to change
Table 41 shows that in subordinates the ‘age’ variable correlates with the ‘intention to
change’ R (63) = 0.41; p < 0.004. This result suggests that older subordinate staff were
more willing to concur with the IT changes compared with their younger peers. This
result was unexpected following the findings by Calhoun et al.(1989), purporting that
younger employees are more willing to accept change. They found statistically
significant results between age and use of computers at the workplace.
4.4.4 Regression results for the IT changes at the implementation stage
This section explores the predictive value of both demographic variables and readiness
drivers on ‘intention to change’ for the IT changes at the implementation stage. The
stepwise regression results indicate that the strongest predictor accounting for 43% of the
variance was the readiness driver ‘appropriateness of the change’. ‘Age’ and ‘time in
position’ although significant at p < 0.001 level accounted only minimally for the
99
employee’s intention to accept the IT changes – see table 42. This result suggests that the
individual’s perception of ‘appropriateness for change’ is a powerful predictor when an
organisation is implementing IT changes.
Table 42: Regression results at implementation of the IT change
R2 const Age Time in Appropriateness df FT2-IT 0.51 2.04 0.03 -0.006 0.5 3,83 27.55***R2 change 0.04 0.03 0.43
*p< .05, **p<.01, ***p< .001
Time in position = time in position in months, Appropriateness = appropriateness of the change
In table 43 the results are displayed for both supervisor and subordinate groups
employing the same stepwise regression method. Here the results confirm the previous
finding for IT change; namely that perception of ‘appropriateness of change’ is not only
statistically significant, but also a powerful predictor for behavioural change intention for
both supervisors and subordinates alike. The results show that ‘appropriateness of
change’ accounts for 57% of the variance for the supervisor group and 36% for the
subordinate group. These strong predictive values of ‘appropriateness of change’ on
‘change intention’ should be a concern for senior management, as both supervisors and
subordinates are not yet convinced at this late change stage that the IT changes are
appropriate for the organisation.
Apart from the ‘appropriateness of change’ predictor the regression analysis results in
table 43 show that ‘age’ and ‘change efficacy’ are also significant but weak predictors for
‘change intention’ for the IT implementation stage. This suggests that most supervisors
and subordinates are confident in their ability to cope with these changes, although some
subordinate staff might benefit from some further targeted learning.
100
Table 43: Regression results at implementation of the IT change for supervisors and subordinates separately.
Education =education levels; Responsibility= supervisor/subordinate (Coding- supervisor 0; subordinate 1); Time in position = time in position in months; Time in organisation (Likert scale <6 months=1; 6-12 months=2; 1-2 years=3, 3-5 years=5; >5 years =5); Sex = coding- males =0; females=1); Efficacy = change efficacy, Understanding = understanding of the change, Appropriateness = appropriateness of the change; Need = need for change, Support = principal support, Valence = personal valence, Intention = intention to change
103
The data set below was split for supervisors and subordinates and the correlation results
are displayed for supervisors in table 45 and for subordinates in table 46.
The correlation results depicted in table 45 for supervisors show that male employees are
older than female employees and that older staff members have been in their positions for
longer. Again most of the readiness driver scales correlated significantly, but at moderate
levels with each other. This moderate correlation strength confirms the scales unique
contributions in subsequent analysis.
The findings in table 46 show the correlations for the subordinate group. ‘Age’ showed
significant correlations with ‘time in position’ r (104)= 0.33; p < 0.001, suggesting that
older employees have been in their positions for longer when compared to younger staff,
and that subordinates who were working for a long time for the organisation have stayed
in their positions for a long time r (104)= 0.53; p <0.001. These results were not
unexpected given the reported lower turn over rate by the HR Company.
Finally, most readiness scales correlated moderately and significantly with each other
giving confidence that they contribute uniquely to subsequent statistical analysis.
In summary the correlation results for the organisational restructure in the post-
implementation stage indicate that ‘age’ is an important demographic variable informing
on the gender relationship and confirms that the HR Company enjoys a stable workforce.
Furthermore, the correlation results indicate that supervisors and subordinates have
different active readiness drivers at the post-implementation stage.
104
Table 45: Correlations at post-implementation of the organisational restructure by supervisors
T2 ORG Supervisor Mean SD N 1 2 3 4 5 6 7 8 9 10 11 12
Education =education levels; Time in position = time in position in months; Time in organisation (Likert scale <6 months=1; 6-12 months=2; 1-2 years=3, 3-5 years=5; >5 years =5); Sex = coding- males =0; females=1); Efficacy = change efficacy, Understanding = understanding of the change, Appropriateness = appropriateness of the change; Need = need for change, Support = principal support, Valence = personal valence, Intention = intention to change
105
Table 46: Correlations at post-implementation of the organisational restructure by subordinates
T2 ORG Subordinate Mean SD N 1 2 3 4 5 6 7 8 9 10 11 12
Education =education levels; Time in position = time in position in months; Time in organisation (Likert scale <6 months=1; 6-12 months=2; 1-2 years=3, 3-5 years=5; >5 years =5); Sex = coding- males =0; females=1); Efficacy = change efficacy, Understanding = understanding of the change, Appropriateness = appropriateness of the change; Need = need for change, Support = principal support, Valence = personal valence, Intention = intention to change
106
4.5.2 Regression results for the organisational changes at post-implementation
At the post-implementation, data was only available for the organisational restructure and
the following two research questions were explored in this section:
RQ 5 At the post-implementation stage - to what extent do demographic variables and
the six readiness drivers predict employees’ behavioural intention to change for the
organisational restructure?
RQ 6 At the post-implementation stage - to what extent do demographic variables and
the six readiness drivers for supervisors and subordinates predict behavioural intention to
change for the organisational restructure?
The regression predictors for ‘intention to change’ of the combined employee group at
post-implementation of the organisational restructure are shown in table 47. The
regression results show that both ‘gender’ and ‘role of responsibility’ within the
organisation are significant predictors for change intention. The results suggest that male
employees and supervisors are more likely to accept and work with the organisational
changes. The results also show that the perception of ‘need for change’ accounted for
30% of the variance whereas ‘personal valence’ and ‘management support’ although
significant accounted for only 11% and 5% towards the explained variance. This result
suggests that employees with a greater ‘need for change’ are more inclined to comply
with the organisational change. However, this result also indicates that employees are
concerned with their perceived ‘need for change’. That is at this late stage of the change
implementation process the ‘need for change’ driver suggests that employees started to
doubt whether the organisational changes were actually needed to ensure the HR
Company’s competitive advantage. It would be interesting to explore whether the doubt
is a supervisor or a subordinate matter. The impact of these doubts in consolidating the
organisational change would be more serious for the HR Company if supervisors
harboured those perceptions of doubts, given their powerful influence in working with
107
these changes and acting as a role model for subordinates (Armenakis, Harris, and Feild,
1999a; Fiorelli and Margolis, 1993; Isabella, 1990, , 1992).
Table 47a: Regression results at post-implementation of the organisational restructure
Responsibility= supervisor/subordinate (Coding- supervisor 0, subordinate 1); Sex = coding- males =0; females=1);Need = need for change, Support = principal support, Valence = personal valence
Subsequent inclusions of interaction variables i.e. formation of product variables between
‘responsibility’ and the six drivers into the regression model provided further
clarification in the way supervisors and subordinates perceive the six readiness drivers.
The findings produced a statistically significant result for ‘understanding of the change’
(Table 47 b). The inverse relationship suggests that supervisors have a more positive
relationship between understanding and intention since they are to guide their
subordinates and facilitate the change process.
Table 48b: Regression results (including indicator variables along with interaction terms) at post-implementation of the organisational restructure
Responsibility-Understanding = Interaction term (Coding- supervisor 0, subordinate 1); Sex = coding- males =0; females=1);Need = need for change, Support = principal support, Valence = personal valence
Separate analysis of the data for the supervisor and subordinate groups shows that
supervisors are more concerned with ‘appropriateness of the change’ accounting for 50%
of the variance, whereas several readiness drivers influenced the subordinates’ decision
108
to concur with the changes at this late stage of change implementation. For subordinates
the main predictor was ‘need for change’ accounting for 23% of the variance with the
other predictors accounting individually for less than 9% each of the variance.
Finally, it is interesting to note that males tend to be more willing to concur with changes
than their female counterparts at the subordinate level. However these results must be
interpreted with some caution since there was an imbalance in numbers for gender with
females outweighing males three to one compared with the population at large.
Table 49: Regression results at post-implementation of the organisational restructure for supervisors and subordinates
Sex = coding- males =0; females=1); Appropriateness = appropriateness of the change; Need = need for change, Support = principal support, Valence = personal valence
In summary both supervisors and subordinates are influenced by different readiness
drivers in predicting behavioural intention for the same change context. At the near
completion of the change implementation process, supervisors continued to be concerned
with the ‘appropriateness of the change’, and subsequent down turns, whereas
subordinates who believe strongly in the ‘need for change’ seem more change compliant.
4.6 Cross sectional analysis for both organisational and IT restructures at the implementation stage.
This cross sectional analysis examines the active readiness drivers during the
implementation stage for both IT change and organisational restructure. Although IT
change and organisational restructure are specific and different change contexts, both
109
experienced changes at the implementation stage. Given that previous findings have
strongly suggested differences between supervisors and subordinates across three change
stages and change contexts, it was decided to analyse the data only for the supervisor and
subordinate groups rather than as a combined group. The combined employee analysis
for both change contexts had ‘appropriateness of the change’ as the most powerful
readiness predictor - see Tables 37 and 42.
RQ 7 Cross-sectional design at implementation stage - to what extent do demographic
variables and the six readiness drivers for supervisors and subordinates differ in
predicting behavioural intention to change between two specific change types?
The focus of this analysis will highlight the communalities between the two change
contexts at the same implementation stage rather than the differences as far as this is
statistically possible, based on the assumption from the addiction research literature that
individual processes of changing health behaviour do not markedly differ across change
type for example smoking or gambling behaviours (Prochaska, Prochaska, and Levesque,
2001; Prochaska, DiClemente, and Norcross, 1992).
The results described below are separate for the supervisor and subordinate groups across
the two different change contexts and suggest that ‘appropriateness of the change’
remains a powerful predictor for behavioural intention. That is supervisors who consider
the changes appropriate are more likely to support the change effort. Supervisors did not
distinguish between the two different change contexts in relation to readiness drivers at
the implementation stage - see table 49.
Table 50: Regression results in the organisational restructure and IT change contexts at the implementation stage for supervisors
Sex = coding- males =0; females=1; Efficacy = change efficacy, Understanding = understanding of the change, Appropriateness = appropriateness of the change; need = need for change, Support = principal support, Valence = personal valence.
116
In summary the regression results for organisational restructure across the
implementation and the post-implementation stage suggest that supervisors’ decisions to
accept and work with the changes are influenced by their perception of ‘appropriateness
of the change’, whereas a somewhat different picture emerged for the subordinate group.
Here the subordinates considered ‘appropriateness of the change’ as the major driver for
the implementation stage, but their decision to accept and work with the changes at the
post-implementation stage was mainly influenced by their perception of the ‘need for
change’. The analysis of the findings revealed that although supervisors and subordinates
employed different readiness drivers for the same change stage, it was impossible to
identify a readiness for change pattern that would fit a specific change stage. Despite the
lack of identifying a readiness change pattern, readiness drivers are useful in monitoring
the change process permitting senior management to make either directional changes or
address issues identified by their employees in an effort to work successfully through the
change stages.
Finally, it should be noted that all five change messages identified by Armenakis et
al.(1999b) and the ‘understanding of the change’ driver acted as predictors for
behavioural intention under certain change conditions. The predictive values of the
readiness predictors depended on the employee groups and both the change context and
the change stages.
117
5 Qualitative Findings and Analyses
5.1 Introduction.
The qualitative data is collected firstly from unstructured interviews with the Change
Project Officer and secondly from open ended questions inviting staff to comment on
both change types namely organisational restructure and IT change. Information gathered
from these qualitative data sets is intended to create new insights and further the
understanding of the dynamic change process across two change types.
The first section of this chapter provides an overview of the changes as perceived by the
Change Project Officer. The second section applies a simultaneous triangulation method
to both the quantitative and qualitative data sets. Qualitative data sets are only available
for the first measurement point during implementation of the organisational restructure
and the planing of the IT changes. Triangulation of the same subject group and change
environment employing different research methodologies adds to the interpretations of
the findings and either confirms or challenges the validity of the descriptive quantitative
data set. The qualitative data in the triangulation process provides specific details about
the change experience of individual respondents whereas the quantitative data provides a
group perspective towards preset constraints like a survey or questionnaire. The third
section uses a qualitative method of analysis named theme analysis to explore the
qualitative data set. Theme analysis categorises the quantitative data set by identifying
underlying major themes in the expressed comments by respondents.
The following section provides an overview of the overall changes as perceived by the
Change Project Officer of the HR company.
118
5.2 Overview of both organisational restructure and IT change as described by the Change Project Officer
The Change Project Officer expressed the view that the changes were driven by
expanding the service provision of the HR company in order to obtain a greater market
share. Prior to the mergers the organization was operating in a narrow HR niche market
with particular focus on the executive recruitment market. Broadening the business
required the organisation to either build new businesses, or acquire suitable businesses
through mergers. This HR company decided to adopt the second business strategy
expanding its recruitment and assessment services by selectively merging smaller
businesses into a new organizational model. Adding suitable business to the HR
company’s portfolio not only adds value to the existing business, but also increases
market share in the recruitment sector.
However, the HR company decided to keep the merged business identity by name only,
integrating the organizational structure and IT communications into a new integrated
company structure. The HR company was aware that this integration strategy would
require a significant change in policy and procedure as well as a culture shift from the
original HR company.
The Change Project Officer explained that the integration included:
1. preparing existing staff for the planned changes; and at the same time
2. maintaining sufficient confidentialities regarding the merger targets and merger
negotiations;
3. streamlining and improving electronic and personal communication of business
activities between relevant business units;
4. sharing physical and human resources across business units i.e. staff could easily
move between business units as required;
5. streamlining IT services across all business units - so that all business units utilize
the same IT structure.
119
In the early stage of the change implementation process it became clear to senior
management that the change in management and procedural structure impacted on the
existing performance measure and reward system. That is, managers’ actions in a given
business unit became more transparent to other business unit managers making it more
difficult for managers to reach targets as other business unit managers could benefit from
the initial contacts made.
Finally, the interview explored the personal attitude of the Change Project Officer, a
trained Organisational Psychologist with extensive experience. He seemed confident of
the change process, but was aware of the many challenges such major changes
(organisational restructure and IT change) through merger activities could bring to the
organisation. The Change Project Officer was a member of the executive of the HR
company demonstrating to the employees the importance of this change for the
organisation. The Change Project Officer was aware that the requirement of
confidentiality surrounding the planned mergers might negatively impact on the change
process given his change focus was on employee collaboration with the change process
and adjustment to the new practices. The Change Project Officer expressed his concerns
that extended confidentiality concerning the mergers limited information dissemination
and thus created uncertainty, challenging employees’ perception of trust and capability
towards the change process.
In the next section, triangulation is applied to compare the consistency of the quantitative
findings defined by behavioural intention for change with the qualitative expressions for
their perceived readiness.
5.3 Triangulation of quantitative and qualitative data
The triangulation of the qualitative and quantitative data as depicted in Appendix F
indicates that the quantitative results are consistent overall with the qualitative data. The
quantitative values used for triangulation are mean values of the aggregated ‘behavioural
intention for change’ scale with 1 indicating ‘strongly disagree’ with the changes and 7
indicating a ‘strongly agree’ response for each of the two change types. The mean
120
response for the least change ready subordinate for the organisational restructure was
3.71 and 3.43 for the IT change. The corresponding mean responses for the least change
ready supervisors were 4.0 for both change types. This suggests that a very few
subordinates disagreed with changes whereas fewer supervisors showed a degree of
neutrality towards the changes.
The first pattern to emerge from the qualitative data suggests a difference between part
time and full time staff with part time staff feeling less informed and engaged in the
change process. This is supported by comments like, ‘Keep peripheral/casual staff better
informed’ or ‘I have not been informed of the structural change though it may be because
I work part-time and have had time off for my uni exams’. Furthermore, differences are
also evident in perception of information dissemination between central offices like
Sydney and Brisbane and regional offices located in Auckland, Melbourne, Adelaide and
Perth despite the use of the electronic medium (email) to enhance communication to all
staff members. Regional office staff indicated that they believe that they are less well
informed compared to central office staff. This assertion is supported by comments like
‘I have a reasonable knowledge but not to any great extent- still feel a little separated as
we are based in NZ compared to the rest of the company being Australia based’, or ‘My
unit has been disbanded and I am to transition to HR company after 8 weeks this has not
happened….I am based in Perth’.
The identified differences for location and hours of employment per week were not
expected as the HR company made strong attempts to communicate change through a
number of media including emails and video presentations. These differences demand
consideration in future research designs.
Furthermore, comparisons between the mean values with the qualitative employee
comments show that respondents – both subordinates and supervisors – did not indicate
‘moderate disagree’ or strongly disagree’ response sets despite expressions of concern
about the change process. However, respondents indicated ‘disagree’ or ‘neutral’
response sets when the changes either did not impact on them directly or when they felt
that communication of the changes were non-existent, inadequate, or not targeted
towards their specific work area. The following comments of respondents are indicative:
‘enough information was given, it just was not relevant to my work unit as there was no
structural change’ or ‘I don’t use IT software in my job even though I was given training
121
in it’ . Several respondents complained of the overall poor communication of the change
process and indicated that communication could have been better. The indications for
improving communication within the HR company are underlined by comments like, ‘I
was reasonably well prepared though the organisation is generally poor at
communicating issues thoroughly. Typically details are brushed over and major issues
kept “hush hush”’. These comments in table 55 suggest that respondents understood the
changes, but expected more detailed information and clearer future direction.
122
Table 56: Comparison of low mean quantitative scores and the respective employee comments for either change type
ORG - INT IT -
INT
Organisational change IT change
164 4.00 4.00 Enough information was given. it just wasn't relevant to my work unit as there was no structural change
Don't use IT software in my job even though I was given training in it.
155 4.29 4.29 Reasonably well prepared; though the organisation is generally poor at communicating issues thoroughly. Typically details are brushed over and major issues kept "hush hush".
I don't think this impacts me greatly
INT- behavioural change intention
123
At the upper end of the spectrum as indicated by the quantitative scores where
respondents ‘strongly agreed’ with the changes, some respondents acted on trust of
management’s decision making rather than having factual information and guidance in
following the changes process: see table 56. This was particularly obvious from mainly
supervisor comments including, ‘I have not seen any plans for structural change but am
aware that they are going to occur. I am happy with management implementing change
that will benefits the business’ or ‘Don’t yet know much about the structural change
apart from addition of new companies- so don’t feel very prepared as far as info goes
however do feel prepared in that accept and welcome change and reorganization so
don’t feel change will adverse affect on me personally even though I may have to change
work practices etc.’.
However, respondents tend to show high mean quantitative scores when they express
personal confidence, flexibility and efficacy in qualitative comments. This positive
change perception is demonstrated by comments like, ‘I must have a flexible approach-
be educated about the big picture and what the strategists of the company are trying to
achieve’ or ‘I am very adaptable to change as long as good training is provided’. These
comments also show that respondents’ positive change perception is supported by their
expected trust and confidence in management’s decision making.
124
Table 57: Comparison of high mean quantitative scores and the respective employee comments for either change type
ORG - INT IT - INT Organisational restructure IT change
42 6.86 6.00 ‘I have not seen any plans for structural change but am aware that they are going to occur. I am happy with management implementing change that will benefits the business’
I am again not sure of IT changes but agree with any new implementation or procedures or systems that will benefit the company and make our jobs easier on the administration side.
67 7.00 5.14 Don’t yet know much about the structural change apart from addition of new companies- so don’t feel very prepared as far as info goes however do feel prepared in that accept and welcome change and reorganization so don’t feel change will adverse affect on me personally even though I may have to change work practices etc.’
Nil
58 6.71 5.14 ‘I must have a flexible approach- be educated about the big picture and what the strategists of the company are trying to achieve’
Prepared as best I could but there has been little support and training on new systems etc. Here it is deal with it! Training is always an afterthought. Little is asked of the people who use the system the most. It would receive greater support if system requirements were addressed prior to implementation with ground floor users. The question “why?’ always seems to be asked
176 6.14 6.14 The organisation is very organised in informing staff about structural change. Regular staffing updates on organisation progress would be good.
‘I am very adaptable to change as long as good training is provided’
INT- behavioural change intention
125
In summary the triangulation analysis suggested that respondents have different
motivations for their respective quantitative response sets compared to the qualitative
ones. Some respondents showed a quantitative response set of ‘agree’ or ‘strongly agree’
even though they have identified issues with the change process as identified by the
qualitative data set. The qualitative data included response themes ranging from poor
change communication, poor workplace specific targeted change communication, overall
not affected by the change, trusting management implicitly to feeling well prepared for
the changes. Quantitative information alone would not have informed of the specific
motivations that influenced respondents’ level of change readiness. The dept and range
of other issues become even more evident in the qualitative findings discussed in more
detail in the next section. Here the qualitative analysis utilizes theme analysis to
extrapolate common themes and identify commonalities across respondents’ expressions.
5.4 Theme analysis of the qualitative data
In this section the qualitative data is explored to isolate common underlying themes and
help develop a pattern from a list of 120 comments. The comments for this analysis are
divided for change type and supervisor and subordinate group – see table 57. Note that
the qualitative data is only available for one measurement point with organisational
restructure at the implementation stage and IT change at the planning stage – see
Appendices G & H.
Table 58: Number of employee comments received
Org restructure IT change Total
Subordinate 51 39 90
Supervisor 17 13 30
Total 68 52 120
126
In the theme analysis the comments were aligned with the six readiness drivers and extra
themes from the organisational change literature like employee participation in the
change process (Coyle-Shapiro, 1999; Weber and Weber, 2001), uncertainty (Bordia,
Hobman, Jones, Gallois, and Callan, 2004), training (Dato, Potter, and Fertman, 2001),
and information in relation to mergers (Bourantas and Nicandrou, 1998; Eisenberg and
Whitten, 1987; Schweiger and DeNisi, 1991).
Participation of employees in the change process is often cited in the literature as an
important determinant of change success (Coyle-Shapiro, 1999; Weber and Weber,
2001). Coyle-Shapiro (1999) investigated the relationship between change
implementation and employee participation. She found that employees with a greater
ability to participate in the change process judged the change intervention more
beneficial suggesting that ‘employees who do not see a change intervention as beneficial
in the early stages of implementation are unlikely to participate subsequently’ (Coyle-
Shapiro, 1999 p. 446). These findings are supported by Weber and Weber (2001) who
not only concluded that participation fosters employees’ familiarity with the changes. In
turn this familiarity with the change not only positively impacted on their personal
change expectations, but also developed and maintained positive employee attitudes for
the change.
Bordia et al. (2004) describe three types of uncertainty namely strategic uncertainty,
structural uncertainty, and job-related uncertainty. They found that management is
overall good in alleviating strategic uncertainties as they seem well able to communicate
the future direction of the organisation, but find it more problematic in alleviating
structural uncertainties. Bordia et al. (2004) assert that managers and supervisors tend to
be reluctant to communicate structural changes as managers themselves are uncertain of
these required changes. In order to overcome structural uncertainties Bordia et al. (2004
p. 526) recommend, ‘an open and participative communication process that keeps
employees informed of changes as they happen, but more importantly gives them a sense
of control over the impact of the change on their job’. This thesis focuses on the
structural uncertainty as the employee comments related mostly to reporting structures
and functions of different work units.
127
The effect of providing pre-merger information to staff is unclear from the organisational
literature. Schweiger and DeNisi (1991 ) conducted an experimental design that enabled
them to compare a two change organisation on employee uncertainty and attitudes. The
experimental organisation provided their employees with frequent, honest, and regular
information of the merger compared to the control organisation where employees were
told that they would receive information as soon as it becomes available. Schweiger and
DeNisi (1991 p. 130) found that ‘the mere process of communicating with employees
may have been sufficient to yield the changes noted’ asserting that communication is
essential for a positive merger as informed employees display reduced uncertainty and an
increase in the trust in management. In contrast Eisenberg and Witten (1987 p. 423)
suggests in their discussion that ‘a decision not to reveal company secrets or a decision
to hold back information from employees about a tentative plan may be justified because
it furthers or protects organizational interests’.
5.4.1 Organisational restructure
A thorough thematic analysis of all employee comments for supervisor and subordinate
subgroup identified nine common themes for subordinates during organisational
restructure and four themes for supervisors - see Table 58. It must be noted here that the
total number of supervisors and subordinates for organisational restructure had a ratio of
3 to 1. This stark ratio differential is reflected on the differential spread of the most
common themes given the higher number of subordinate comments, thus limiting the
representative strength of the supervisor group in the analysis.
In organisational restructure the thematic analysis shows that for both subgroups
(supervisors/subordinates) information dissemination about the dynamic changes was a
major issue for comment. Three quarters of the subordinate group and half of the
supervisor group believed that information of the dynamic organisational restructure was
poor. The second most common theme was a degree of change related structural
uncertainty experienced only by subordinates in terms of the final organisational
structure and organisational adaptation to cultural change.
128
However, supervisors did not comment at all on themes like ‘need for change’, ‘valence’,
and ‘organisational support’ as compared to a small number of subordinates who
identified with those themes. This result demonstrates that both supervisors and
subordinates found it difficult to obtain information about the organisational restructure.
This result is supported not only by the Change Project Officer’s expressed concerns to
maintain confidentiality of the merging target and the ongoing negotiation, but also in the
organisational literature investigating mergers. (Bourantas and Nicandrou, 1998;
Eisenberg and Whitten, 1987; Schweiger and DeNisi, 1991). The qualitative results in
this thesis demonstrate the importance of communication as supervisors and subordinates
considered the imposed confidentialities of the merger to be too tight, suggesting that the
limited information influenced decision making processes of supervisors and
subordinates at the implementation stage of the organisational restructure and merger
activities.
129
Table 59: Summary of the percentages of endorsed themes from supervisor and subordinate comments for organisational restructure at the implementation stage
Org Restructure Subordinate Supervisor THEMES positive negative Total positive negative Total Information 24%
(n=11)
76%
(n=36)
100%
(n=47)
50%
(n=8)
50%
(n=8)
100%
(n=16) Uncertainty 0%
(n=0)
100%
(n=6)
100%
(n=6)
0 0 0
Training 25%
(n=1)
75%
(n=3)
100%
(n=4)
0 0 0
Participation 0%
(n=0)
100%
(n=3)
100%
(n=3)
50%
(n=1)
50%
(n=1)
100%
(n=2) Need for change
100%
(n=2)
0%
(n=0)
100%
(n=2)
0 0 0
Personal Valence
0%
(n=0)
100%
(n=2)
100%
(n=2)
100%
(n=1)
0%
(n=0)
100%
(n=1) Preparation 0%
(n=0)
100%
(n=1)
100%
(n=1)
0 0 0
Appropriateness 0%
(n=0)
100%
(n=2)
100%
(n=2)
0 0 0
Principal support
0%
(n=0)
50%
(n=1)
50%
(n=1)
100%
(n=1)
0%
(n=0)
100%
(n=1)
Total number of subordinate comments 51
Total number of supervisor comments 17
In summary the results show that location and hours of employment per week limited
information dissemination, contributing to possible barriers for accepting and working to
implement the organisational restructure. In addition subordinates experienced
uncertainty in the direction of the changes which could have also been influenced by
limited information dissemination.
130
5.4.2 IT change
In terms of IT change it is important that the qualitative data was obtained at the planning
stage. Two limitations are expected in information dissemination and availability of
training opportunities for the new software applications. As expected, given the role of
supervisors as guide and support, most supervisors believed that they were well informed
about the IT change requirements compared to half of the subordinate group who
indicated poor information dissemination. Once again caution must be exercised when
reviewing the raw numbers in table 59 given the rate differential of 3:1 between
subordinates and supervisors.
Furthermore, table 59 indicates that most subordinates expressed a positive attitude about
the available IT training as they either already received training or expected training for
the new IT software application in the near future. In contrast the very small number of
supervisor comments (n=3) does not permit comment on their perception of the IT
training.
The most common themes for IT change at the planning stage were information
dissemination and training. The difference between supervisors and subordinates for
information dissemination was expected whereas the high number of subordinates having
received training or expecting training was surprising for the pre-implementation stage.
131
Table 60: Summary of the percentages of endorsed themes from supervisor and subordinate comments for IT change at the planning stage
IT change Subordinate Supervisor THEMES positive negative Total positive negative Total Information 36%
(n=8)
64% (n=14)
100%
(n=22)
82%
(n=9)
18%
(n=2)
100%
(n=11) Training 63%
(n=12)
37%
(n=7)
100%
(n=19)
66%
(n=2)
34%
(n=1)
100%
(n=3) Participation 50%
(n=2)
50%
(n=2)
100%
(n=4)
0 0 0
Need for change 100%
(n=1)
0%
(n=0)
100%
(n=1)
100%
(n=1)
0%
(n=0)
100%
(n=0) Appropriateness 0 0 0 100%
(n=1)
0%
(n=0)
100%
(n=1) Principal support 50%
(n=1)
50%
(n=1)
100%
(n=2)
50%
(n=1)
50%
(n=1)
100%
(n=2)
Total number of subordinate comments 39
Total number of supervisor comments 13
5.5 Summary
In summary the thematic analysis of the qualitative data has added new dimensions to the
change process not initially identified by the six readiness drivers in the quantitative
study. Thematic analysis clearly indicated that employees were discontented with the
limited factual information available for them to make informed decisions about the
dynamic change process. As discussed earlier, it is reasonable to suggest that the tight
confidentiality around the merger activities might have negatively affected the
adjustment of employees to both change types (Appelbaum, Gandall, Yortis, Proper, and
Jobin, 2000). The qualitative results also indicate that the majority of respondents seemed
concerned with training, receiving timely information, and being able to actively
132
participate in the change process (Weber and Weber, 2001). In contrast only a very small
number directly expressed their concerns about the ‘appropriateness of the change’, the
‘need for change’, and the concern for having sufficient organisational supports. These
results further highlight the importance of triangulating results from a variety of data sets,
as this method provides a more complete understanding of the research questions at hand
(Morse, 1991). In this research, triangulation demonstrated that respondents’ answers to
the quantitative questions were augmented by the qualitative data, suggesting that
otherwise unknown factors contribute to their readiness for change perception.
133
6 Discussion
In this chapter the findings of the previous two chapters are discussed in the light of the
organisational change type and the prevailing change stages. As stated before the HR
company experienced organisational changes both as part of mergers requiring major
organisational restructures, and the implementation of new IT hardware and software
seven months later. Despite these major changes employees were assured that their
employment was secure. However, employees were advised that these changes would
require operational and personal adjustments regarding changes to their line management
reporting structure, possible relocations of their work stations, separations of existing
work teams, and the modification of existing work procedures and policies. Throughout
the change process employees were regularly informed through newsletters, emails,
memoranda and staff meetings about the planned changes.
Three change stages were investigated in this thesis, namely the preparation,
implementation and post-implementation stages. As the progress of the two change types
was staggered the investigation was limited to only four measurements across the three
change stages. That is, employee perceptions of the IT change was measured at the
preparation and implementation stages whereas organisational restructure was measured
at the implementation and post-implementation stages.
This discussion chapter is structured into three main sections, and will integrate the
research findings with the current research literature.
The first section discusses the findings of the four combinations of change stages and
change type (preparation for IT change, implementation for organisational restructures
and IT change, and post-implementation for organisational restructure). This section also
discusses findings across change types at the implementation stage, and longitudinal
findings across change stages. The longitudinal findings are discussed for IT change in
the planning stage and implementation stage and for the organisational restructure
findings at implementation and post-implementation.
134
The second section discusses the findings in terms of the six readiness drivers. The
discussion attempts to identify specific patterns and integrates the results with the
prevailing literature.
The third section discusses the qualitative findings comprising a summary of the
unstructured interview with the Change Project Officer, numerical triangulation findings
and findings of the thematic analyses.
The final section explores the limitations and implications of this thesis.
6.1 Change stages and types
This section integrates both the qualitative and quantitative findings across four
combinations of change stages and change types. It should be noted here that due to an
electronic data collection problem one demographic variable namely the age variable was
not collected in the first survey, and qualitative data (employee comments) was only
collected in the first survey i.e. for the IT planning stage and the organisational
restructure implementation stage.
6.1.1 IT preparation
At the planning stage data was collected for the IT change including demographic
variables and readiness drivers to predict employees’ behavioural intention for IT
changes. The demographic variables included ‘age’, ‘sex’, ‘time in organisation’, ‘time in
position’, and ‘supervisor/subordinate’ grouping. Demographic variables were regressed
together with the six readiness drivers on ‘behavioural change intention’ for IT change at
preparation.
135
6.1.1.1 Demographics.
It was expected that the demographic variables ‘age’, ‘sex’, ‘level of education’ together
with ‘time in the organisation’ and ‘time in position’ would assert an influence over an
employee’s intention to accept and work with the changes.
Before discussing the influence of ‘age’ on behavioural change intention it is important
to be reminded that ‘age’ was only measured at the second measurement point. The
second measurement point relates to the post-implementation stage of the organisational
restructure and the implementation stage of the IT change. The results showed that ‘age’
was statistically predictive of behavioural change intention for the IT change at
implementation, but was not predictive for the organisational restructure at post-
implementation. However, the real significance of ‘age’ was weak as it only accounted
for 4% of the total variance. That is 96% of the variance is predicted by other variables. It
would have been interesting to compare the predictive value of ‘age’ at other change
stages, particularly at the planning stage, but technical problems with the online data
collection prevented this.
Furthermore, the findings also suggest that older employee from both the combined
employee group and the subordinate group seemed to be more accepting of the IT
changes. This outcome was not expected even though the organisational literature
seemed equivocal in age related findings (Chiu, Chan, Snape, and Redman, 2001; Rosen
and Jerdee, 1976). This literature suggested that younger employees are more adaptable
especially when related to IT change adjustment. From this result one could infer that
older subordinates were very computer literate from the outset and that the provided
training alleviated their initial fear of the change.
These findings of ‘age’ being a predictor for behavioural intention to change needs to be
interpreted with caution, given the marked differential in sample size between supervisor
and subordinate group, and that the difference between supervisor and subordinate was
not statistically significant. Furthermore, ‘age’ as a predictor in the regression model for
subordinates was only weakly significant in empirical terms. Although ‘age’ can not be
ignored as a weak predictor, it may only be weak predictor for specific change
conditions, which is also consistent with the equivocal findings in the literature. These
136
studies suggest that comparisons between actual age and work performance are more
related to selected change conditions rather than ‘age’ being a strong predictor across all
change conditions. (McEvoy and Cascio, 1989; Waldman and Avolio, 1986; Warr,
1994).
The second demographic variable with a statistical significance was the ‘time in position’
measure. ‘Time in position’ had a weak influence on ‘behavioural intention’ accounting
for less than 3% of the variance. The negative regression coefficient indicates that
employees with recent appointment to their position were more inclined to work with the
IT change. It appears that, compared to subordinates familiar with their current position,
subordinates in new positions were less impacted by the IT changes as they did not have
to relearn the software program and may have felt less threatened by the IT
implementation.
In summary, it can be concluded that both demographic variables are very weak
predictors and that their predictive influence is heavily dependent on the actual change
conditions.
6.1.1.2 Readiness drivers.
At the planning stage for the IT change employees were informed that major IT changes
were planned to improve communication and data sharing across specific business units.
They were also advised that this change entailed the introduction of new hardware and
software systems. However, at this stage the precise details of the IT change were not
communicated as top management was still considering a number of software options.
Before discussing the influence of the readiness drivers on behavioural intention, it is
important to emphasise that the regression models did not find significant differences
between the supervisor and subordinate groups with the exception of the organisational
restructure at the post implementation stage. Furthermore, the findings did not detect any
statistical significant differences on the longitudinal data. The following discussion is
137
based on individual regression models and is descriptive when comparing longitudinal
results and findings for the supervisor and subordinate groups.
The readiness driver ‘appropriateness of the change’ was a dominant predictor of
behavioural intention for the combined employee group and for the subordinate group at
the IT planning stage. This suggests that employees and particular subordinates felt
strongly about the ‘appropriateness’ of the IT changes at this early stage. The results also
revealed that all three groups (combined, supervisor and subordinate) showed concerns
about their own ability to cope with the new technology changes. The ‘change efficacy’
driver also indicates that employees with confidence in their ability tend to show greater
behavioural change intention. This result is consistent with the organisational literature
where supervisors prepare themselves in their role as mentor and role model for their
subordinates (Yukl, Falbe, and Youn, 1993). The second readiness driver for supervisors
was ‘personal valence’. The personal valence predictor suggests that supervisors feared
that the new IT changes would have a negative personal impact on them. Unfortunately
the quantitative data does not permit a more specific conclusion. However, exploration of
the qualitative data (Project Change Officer – unstructured interview) indicates that
supervisors were considerably bothered by the potential loss of bonus remunerations,
given the improved accessibility and transparency of information between business units.
With these changes, supervisors feared that the new transparencies of the data between
business units would seriously undermine their ability to reach target levels,
compromising their bonuses.
The above findings suggest that the HR company planned well for the IT changes by
conducting focus groups, providing managerial support, timely information, extensive IT
training and up-to-date physical resources i.e. new IT hardware. However, despite this
preparation for the practical IT changes, it seems that neither employee group was
convinced that the introduction of the new IT system benefited the HR company. Perusal
of employee comments suggests that employees did not feel sufficiently consulted before
the new IT system was introduced. This is reflected and supported by employee
comments like, ‘Someone who actually uses the system on a day-to-day basis as part of
his or her job should have been road testing it. Similarly there have been decisions made
on what other resources we can have or not have with no notice nor surveying of the
people’ and ‘as an experienced user I would like to have seen some sort of steering
138
committee that at the least would have given me confidence that the new system will suit
my needs. At the moment it feels as though management wants the system and the
business must use it. At this stage with very little communication I have no confidence
that we will be using a state of the art system that will aid my work’.
In summary, the above findings clearly indicate that the HR company has not
communicated the IT changes well and the implementation process is perceived to lack
consultation with employees working with the new software programs. Furthermore,
employees indicated that to alleviate their concerns for the IT change, they would like to
be more engaged in the change process through participation and to receive timely
information of the next change steps.
6.1.2 Implementation
This section describes the influences of demographic variables and the six readiness
drivers on ‘behavioural intention’ with the initial focus on the combined employee group
and then separately for supervisors and subordinates.
The first part describes and interprets the impact of the readiness drivers for the
organisational structures for the implementation stage, and enhances the discussion by
integrating qualitative findings. The second part of this section discusses the predictive
readiness drivers for the IT change. Unfortunately qualitative data was not available for
the IT change at the implementation stage.
6.1.2.1 Organisational restructure
Prior to the implementation of the organisational restructure employees received
extensive and timely information relating to the actual and pending mergers. The HR
company did acquire, or was in the process of acquiring, a number of smaller niche firms
to enhance its market share and to complement and develop broader service provisions in
139
the recruitment sector. The HR company was cognisant of the impact of these changes on
their employees and developed and applied a number of change strategies to reduce the
fears and anxieties of its existing and acquired employees. Change strategies included
conducting focus groups, providing timely and informative updates of the change process
by emails and memos and for management representatives from head office to visit
employees at all their offices in person to explain the changes, simultaneously
demonstrating their support for the proposed changes.
The regression results show that employees considered the influence of ‘change
efficacy’, ‘appropriateness of the change’, and ‘understanding of the change’ to be
important factors for them to concur with the organisational change implementation. The
readiness driver ‘appropriateness of the change’ had the strongest influence in
determining employees’ change readiness.
When considering the regression results separately for the supervisor and subordinate
group, it becomes evident that ‘appropriateness of the change’ was the major active
driver for both groups. In addition to these findings the subordinate group was also
sensitive to ‘change efficacy’ and ‘understanding of the change’, although to a lesser
extent when compared with the importance of “appropriateness for the organisation”
readiness driver.
These findings clearly demonstrate that the supervisors were well prepared for the
current organisational restructure in understanding these changes and in feeling confident
in their ability to perform under the new organisational structure. This result was not
unexpected since supervisors act as models and require additional know-how and
performance confidence to guide their subordinates through the change process (Yukl,
Falbe, and Youn, 1993).
However, both supervisors and subordinates continue to express great concern about the
‘appropriateness of the change’ for the organisation. That is, employees were doubtful
whether a broadening of the HR service provision from a previously successful niche
market would be the best pathway for the organisation to take. Apart from these shared
concerns, subordinates indicated uncertainty in understanding the actual changes and
apprehension about their ability to cope with the organisational restructure. This
differential in ‘understanding the changes’ is consistent with the literature. Supervisors
140
and middle managers are normally the first to become familiar with the changes as they
are entrusted to facilitate the changes by being mentors and providing guidance and
direction for subordinates (Bowers and Seashore, 1966; Fenton-O'Creevy, 1998;
Gleeson, McPhee, and Spatz, 1988; Verespej, 1990). Consulting the qualitative data i.e.
analysis of employee comments provides extra detail to the interpretation of the
quantitative findings and augments knowledge by providing specific insights into
employees change perceptions. Perusal of the employee comments suggests that the
employee concerns with the ‘appropriateness for the organisation’ driver relate mainly to
employees’ fear that the gained competitive advantages of the past are forfeited by
embracing a greater market segment of the HR industry. Information from the
unstructured interview with the Change Project Officer indicate that employees are very
concerned that their proven market competitiveness in a specific HR niche market i.e.
providing quality recruitment services to the executive level of organisations could be
jeopardised by these changes. These assertions are further supported by employee
comments like, ‘provide more information of how each business unit fits within the
organization. Have more information on the changes occurring’, and ‘ I am concerned
that we will be structured and asked to behave just like any other recruitment agency out
there in the market and that the cultural changes will involve the losing of our high
quality name and a less personal and more bureaucratic environment. This is already
happening. I think some of this should have been thought through beforehand’.
In summary, separate analysis of the results for supervisors and subordinates indicates
that both groups are concerned about the ‘appropriateness’ of the changes for the
organisation. Additionally, subordinates also feel uncertain in their understanding of the
changes and their ability to cope. This differential pattern between supervisors and
subordinates is expected as supervisors are expected to lead subordinates through the
changes, thus requiring advanced information to feel competent in their role as
supervisor and change agent (Bowers and Seashore, 1966; Fenton-O'Creevy, 1998;
Gleeson, McPhee, and Spatz, 1988; Verespej, 1990).
141
6.1.2.2 IT change
The implementation of the IT changes was the second major change for the HR company
within seven (7) months. The regression model for the combined groups indicated that
‘appropriateness of the change’ was a strong predictor for behavioural change intention.
This result is repeated when the data is separately analysed for supervisors and
subordinates. The readiness driver ‘appropriateness for the organisation’ was again the
main predictor for ‘behavioural intention’. In addition the subordinate results suggest
some sensitivity about their ability to effectively use the new software programs and
older employees appeared to be more willing to comply with these IT changes.
Despite the lack of qualitative information for this change type at implementation, the
quantitative data indicate that the HR company was unable to shift employees’ concerns
about the change appropriateness for supervisors and subordinates alike. The cause of
this apparent failure may reside in the strong branding of the past HR services and the
lack of balance by management to integrate the existing service into the new structure.
In summary, the HR company’s attempts to prepare employees through training for these
IT changes did not impact on their ‘appropriateness’ perception. Despite the training,
employees seemed unable to conceptualise the advantages an expanded HR service
together with the new IT network could provide for the HR company in the medium to
long term. This is an indication that the organisation failed to convince their employees -
supervisors and subordinates alike - that the IT changes would be of benefit to the HR
company. This failure may be the result of a strong branding of the HR company to
provide HR services for a specific niche market, raising doubt in the effectiveness of
these new IT systems.
142
6.1.3 Post-implementation
Interpretation of the findings of the organisational restructure at the post-implementation
stage is discussed in the following section. The interpretation of the findings is first
discussed for the combined employee group which is followed by separated discussions
of the supervisor and subordinate findings. Post-implementation measurement occurred
seven months after the actual implementation of the organisational restructure. Given that
these mergers leading to the organisational restructure were staggered, most of the
mergers were completed at that time of measurement. Note that qualitative data are not
available for the post-implementation measure.
6.1.3.1 Demographics
This section explores the predictive power of demographic variables including ‘age’,
‘sex’, ‘time in organisation’, ‘time in position’, and ‘supervisor/subordinate’ grouping
when regressed together with the six readiness drivers, on ‘behavioural change
intention’. Only one demographic variable namely ‘sex’ contributed significantly
towards the regression model for the combined employee group and the subordinate
group. However, ‘sex’ was not was statistically significant for comparing the supervisor
and subordinate group. In the regression model ‘sex’ only accounted for 4% and 6% of
the variance for the combined employee group and the subordinate group respectively.
The inverse relationship between ’sex’ and ‘behavioural intention for change’ suggests
that female employees, particularly subordinates, show a reduced willingness to accept
changes. The reason for this unexpected result is unknown, but employee comments from
the first survey permit the speculation that hours of employment may explain this result.
This speculation is underpinned by female employee comments like, ‘our group/team
does not have regular meetings – a lot of us are PT (part time) and very busy. I think
meetings from time to time (monthly) would improve communication’ and ‘keeping
peripheral/casual staff better informed’. The employment levels of female staff could not
143
be inferred from the quantitative data except to say that the respondent sample consisted
of three times as many female than male respondents. It could be inferred from this
sample differential that more female employees may have been working part time
compared to male employees. Furthermore, it is not unreasonable to suggest that part
time and casual employees are not as well prepared for change in terms of training and
receiving updated and timely information about the change.
6.1.3.2 Readiness drivers
The combined employee results clearly indicate that supervisors’ and subordinates’
‘behavioural intention for change’ activated different readiness drivers at post
implementation of the organisational restructure. Further regression modelling using
indicator and interaction variables found that ‘understanding of the change’ is the only
readiness driver that is statistically differentiating the supervisor group from subordinate
group. That is, supervisors seemed to be most concerned with ‘understanding the change’
compared with subordinates. Furthermore, the results suggest that informed supervisors
are more likely to actively facilitate the change process.
In contrast, subordinates’ behavioural intentions seem to be influenced by readiness
drivers like ‘need for change’, ‘personal valence’ and ‘managerial support’, all of which
tend to influence this employee group’s willingness to support the changes. It is
interesting to note here that subordinates shifted activated readiness drivers from
implementation to post-implementation. At implementation subordinates were concerned
mainly with ‘appropriateness of the change’ compared with ‘need for change’ at post-
implementation. This suggests that subordinate thinking had lapsed back to the planning
stage as they questioned the benefit of the changes at post-implementation.
In summary, the quantitative findings demonstrated that different readiness drivers are
active for supervisors and subordinates, suggesting that role responsibility is a factor in
activating selective readiness drivers.
144
6.1.4 Implementation comparison
The following section discusses activated readiness drivers across change type at the
same change stage. That is, the predictive value of readiness drivers for two different
change types (namely IT change and organisational restructure) are compared at the
implementation stage.
The regression results for both groups (supervisor and subordinate) combined at the
implementation stage suggest that the main readiness driver for both change types was
‘appropriateness of the change’. This result is a strong indication that all employees
perceived considerable concern in how these changes will affect the HR company in the
long-term. Employees who considered the changes to be appropriate, seemed more
inclined to embrace the required changes.
The findings were consistent with the combined employee results when separate
regression statistics were applied for the supervisor and subordinate groups. Here again
‘appropriateness of the change’ was a strong predictor for the supervisor group (see
Table 60) and the subordinate group (see Table 61).
Table 61: Predictor variables at implementation of the organisational restructure and IT change by supervisors
Appropriateness
T1 ORG Supervisor �
T2 IT Supervisor �
Appropriateness = appropriateness of the change
These results are consistent with the findings of Holt et al. (2003). They empirically
tested change message components including appropriateness, valency and management
support surveying 339 military and civilian officers for a number of planned
organisational changes. Holt et al. (2003) found that ‘appropriateness of the change’ and
‘personal valence’ were strong predictors of perceptions of change benefits. This
145
suggests that the perception of ‘appropriateness’ is an important readiness driver in
formulating a positive change attitude for organisational change.
However, the results were less clear for the subordinate group. ‘appropriateness of the
change’ remained the main predictor with ‘change efficacy’ and ‘understanding the
change’ being weaker predictors in relation to organisational change at the
implementation stage. The results also reveal that subordinates considered their level of
confidence in coping with both change types as important when compared with the
supervisor group whose perception to concur with the changes was not significantly
influenced by their change efficacy.
Table 62: Predictor variables at implementation of the organisational restructure and IT change by subordinates
Appropriateness Efficacy Understanding Age T1 ORG Subordinate � � � T2 IT Subordinate � � �
Efficacy = change efficacy, Understanding = understanding of the change, Appropriateness = appropriateness of the change;
Furthermore, the findings indicate that subordinates experienced some uncertainty in
understanding the organisational restructure as their intention for change was influenced
by the ‘understanding of the change’ driver. It is likely that the overall organisational
restructure was too complex for all employees to understand the smaller details of this
change at the implementation stage, given that some of these organisational changes
could not be entirely pre-planned.
Interestingly, ‘intention to change’ was also influenced by ‘age’ for the IT change with
older employees more willing to concur with the IT changes (see table 62). This result
was unexpected given that the literature into stereotype for age and performance
concludes that younger people are perceived as more amenable to accepting IT changes
(Chiu, Chan, Snape, and Redman, 2001; Rosen and Jerdee, 1976). However, meta-
analysis of studies into age and work performance is less conclusive. (McEvoy and
Cascio, 1989; Waldman and Avolio, 1986; Warr, 1994). McEvoy and Cascio (1989)
146
found that younger employees showed performance differences in comparison to older
workers. Furthermore, Warr (1994) suggested that the relationship between age and work
performance is non-linear with performance declining from a plateau once employees
move into retirement. From these findings it can be argued that the relationship between
age and work performance remains unclear. However, our findings of older employees
being more adaptable to change could be attributed to the level of education of older
employees, and the associated cognitive skills and strategies they have to deal with the
challenge of change compared with a less educated population group.
Table 63: Predictor variables at implementation of the organisational restructure and IT change by supervisors and subordinates
Appropriateness Understanding Efficacy Age Time in position T1 ORG � � � T2 IT � � �
Time in position = time in position in months; Efficacy = change efficacy, Understanding = understanding of the change, Appropriateness = appropriateness of the change;
In summary, the major readiness predictor for ‘behavioural change intention’ for both
change types at the implementation stage is ‘appropriateness of the change’. This
indicates that both employee groups are concerned about the impact the changes are
likely to have on the performance of the organisation. That is, employees do not believe
that the implemented changes are likely to improve the HR company’s performance. This
interpretation is underlined by an employee’s comment collected during the first survey,
‘ I am concerned that we will be structured and asked to behave just like any other
recruitment agency out there in the market and that the cultural changes will involve the
losing of our high quality name and a less personal and more bureaucratic environment.
This is already happening’. Such comments support the view that staff fear that the
current strong market position of the HR company for providing specialist recruitment
services for a selected niche market could be jeopardized by these changes. It appears
that this organisational setting is unique in that it initially provided HR services to a
niche market and the implemented changes are perceived by employees to threaten the
HR company’s competitive advantage.
147
6.1.5 Longitudinal findings
The longitudinal assessments of readiness drivers predicting behavioural intention
provide insight into perceptions of employees toward the changes across two
measurement points. In this study the two measurement points relate to the preparation
and implementation stages for the IT change, whereas for the organisational restructure
the two measurement points relate to the implementation and post-implementation
stages. The results for the two change types are discussed separately and identified
differences between supervisors and subordinates are highlighted.
The discussion also integrates the findings with the information obtained from the two
unstructured interviews with the Change Project Officer. The Change Project Officer
provided specific details of the IT change and the likely impact of these changes on
different staff groupings. Of particular interest here is the impact of these changes on the
supervisor and subordinate groups. Although the planned IT change related mainly to
new software applications and data systems, it also had broader impacts on the
organisation’s functioning. That is, the IT changes provided greater transparency as a
result of data sharing with different business units which would impact on employees. IT
changes do not only relate to the software and network component; they also require
modifications of existing organisational policy and procedure manuals to ensure an
integrated implementation of the new IT system.
Changing IT systems does not only demand the learning of new software applications,
but impacts on the organisation’s functioning at different levels. The new IT system
provides the opportunity for more data sharing of client information between business
units. This will have a direct impact on the performance of the individual business unit,
placing business units in competition with each other. Given that business performance is
one of several key benchmarks for supervisors, it is not unreasonable to assume that
supervisors are cautious about complying with change during the change process. This
assertion is supported by the finding that supervisors remain concerned about the
‘appropriateness of the change’ at this stage of the change process.
148
This discussion will also show that the integration of quantitative longitudinal findings
with qualitative information enhances the understanding of the dynamic change process.
The qualitative data are used to explain and clarify some of the quantitative findings
using a triangulation approach. This triangulation approach utilises quantitative findings
and qualitative narratives with the intention to provide improved insights into the
dynamic change process.
This following section is divided into six parts. The first three parts discuss the IT change
at the preparation and implementation stages analysed by the combined employee group
and separately for supervisors and subordinates. The next three parts explain the findings
for the organisational restructure at implementation and post-implementation, also
analysed by the combined employee group and separately for supervisors and
subordinates.
6.1.5.1 IT change for all employees
The longitudinal findings for the combined employee group suggest no significant
differences between supervisor and subordinate group. The combined employee group
indicated that they are concerned about the ‘appropriateness of the change’ at both
measurements points. This concern is underlined by employees’ concerns of feeling that
they had not been consulted in the selection of the software program as highlighted in
some of the employee comments at the planning stage: ‘Not prepared at all for the IT
change, don’t even know what exactly that change is’, training and support for IT
systems has been OK except that it is just not a good system for either assignment of
client management. Someone who actually uses the system on a day-to-day basis as part
of his or her job should have been road testing it’ and ‘I have no confidence that we will
be using a state of the art system that will aid my work’.
Furthermore, at the planning stages the combined employee group was also concerned
with their ability to cope with the change. This is to be expected as employees did not
have detailed information of the IT change nor did they have training for the new
software.
149
The combined results at the implementation stage suggest that older employees tend to
be more ready to accept the IT changes as well as employees with a short time in the
position. These demographic findings have already been discussed in 6.1.1.1.
Despite the lack of significant differences between supervisor and subordinate in the
combined assessment, separate analysis produces some interesting findings as discussed
below.
6.1.5.2 IT change for supervisors
The longitudinal assessments of the readiness driver influence on behavioural intention
for IT change indicate that two different readiness drivers are active at the different
change stages. At the planning stage supervisors seem much more concerned with their
ability to operate the new software applications, whereas the main readiness driver in the
implementation stage becomes ‘appropriateness of the change’ (see Table 63). This is not
unexpected since supervisors are required to assist subordinates in the application of the
new technology and their focus tends to shift after they have reached a sufficient level of
confidence with the IT system.
It would also be expected that supervisors are concerned about training and resources as
this will impact on their ability to master the new IT changes (Yukl, Falbe, and Youn,
1993). The results again support this assertion as supervisors consider ‘change efficacy’
as an important readiness driver at this stage of the change process. Supervisors with
high ‘change efficacy’, a measure of the individual’s perceived confidence to cope with
the IT changes, indicated greater willingness to support the intended IT changes. It
should be noted here that supervisors had little detailed information about the specific IT
changes and no familiarisation training for the new software program at this
measurement point.
Given the new level of the change dynamic at the implementation stage, it is reasonable
to assume that different readiness drivers influence behavioural intention to change. Here
supervisors identified ‘appropriateness of the change’ as the main drivers that influenced
150
their behavioural intention. Supervisors with strong concerns about change
appropriateness were less inclined to accept the changes. Supervisors’ concern about
change appropriateness could negatively affect the overall change process if this
perception is not addressed adequately with this important group. The literature has
demonstrated on numerous occasions that supervisors’ attitude towards any changes are
critical for the change process to succeed (Yukl, Falbe, and Youn, 1993).
As the new IT changes with its improved business transparencies between business units
challenged existing business practices within the HR company, the added
competitiveness between business units are likely to compromise previous business unit
performance and directly affect the performance based remunerations of supervisors. At
the planning stage of the IT change supervisors were already aware of this matter as
demonstrated by the quantitative finding. Supervisors’ endorsement of the ‘personal
valence’ readiness driver suggests that they are concerned about the impact of these
changes on their remuneration. The analysis of the supervisor data confirmed that
‘personal valence’ significantly influenced supervisors’ willingness to concur with the IT
changes. That is, supervisors who perceived the IT change as personally beneficial
seemed more willing to concur with the planned IT change.
Table 64: Predictor variables at the preparation and implementation stages for the IT change by supervisors
Efficacy Appropriateness Valence T1 IT Supervisor � � T2 IT Supervisor �
Efficacy = change efficacy, Appropriateness = appropriateness of the change; Valence = personal valence.
151
6.1.5.3 IT change for subordinates
The findings show that subordinates’ readiness drivers with a significant influence on
behavioural change intention remained stable across time with ‘appropriateness for the
organisation’ and ‘change efficacy’ as the main readiness drivers for both the preparation
and the implementation stages. This indicates that subordinates see ‘appropriateness of
the change’ and ‘change efficacy’ as important drivers in their decision making to
comply with the IT change. It could be argued that the ‘appropriateness of the change’
driver is a reflection of subordinates’ concern for the IT changes to impact negatively on
the organisation’s performance in a competitive HR industry. That is, the HR company’s
current competitive advantage could be undermined by the proposed IT changes. The
stability of this driver over time also suggests that the HR company was not able to shift
subordinates’ concerns despite providing detailed information through the
implementation process. It appears that subordinates saw the existing system as being
more beneficial for the HR company’s success and future competitiveness.
Interestingly, the second driver namely ‘change efficacy’ also remained stable across
time despite subordinates being provided with targeted applied IT training to work
effectively with the new IT changes. It could be argued that subordinates were concerned
about their ability to cope with the challenge of IT change at the planning stage, but
training and time to apply the new skills throughout the implementation period should
have lifted these specific concerns. Employee comments in the survey suggest that the
roll out of the IT changes was not uniform, but rather piecemeal, mainly affecting
regional staff. Secondly, although not quantitatively assessed, the employee comments
also suggest that part time staff did not feel as well informed about the changes compared
with full time employees. Both the piecemeal roll out for regional offices and the
difficulties for part-time employees to familiarise themselves with these changes could
have contributed for ‘change efficacy’ to be an important readiness driver across time.
Ignoring the importance of the ‘change efficacy’ readiness driver for these target groups
could jeopardise the change implementation process.
152
Furthermore, ‘age’ although statistically significant was a weak factor influencing change
behaviour. It also should be noted here that age data was not collected in the first survey
due to a technical problem, thus making it difficult to use this variable for longitudinal
comparison. Given the weak influence of the ‘age’ variable (Table 64), the direction of
this demographic variable on change behaviour was unexpected especially since
familiarity and adjustment to IT technology changes is anecdotally seen as the domain of
young people. Here the findings suggest that older employees are more willing to work
with the IT changes. In order to make sense of these results one needs to differentiate
between a person’s willingness to work with the IT changes with their ability and
comfort in using this new IT system. Older subordinates seemed to show greater
willingness to work with the new IT system, but may not have the ability to adapt easily
to the new IT challenges. An alternate interpretation of these findings could be that older
subordinates experience a greater sense of trust in the organisation’s ability to manage
the implementation of the IT changes, rather than adjusting easily to the new IT changes.
These interpretations are supported when reviewing the ‘behavioural intention’
statements, which demonstrate the individuals’ support and perception of ‘good will’
towards the changes for the organisation rather than their performance ability.
Table 65: Predictor variables at the preparation and implementation stages for the IT change by subordinates
Efficacy Appropriateness Age T1 IT Subordinate � � T2 IT Subordinate � � �
Efficacy = change efficacy, Appropriateness = appropriateness of the change
In summary, ‘appropriateness of the change’ and ‘change efficacy’ were readiness
drivers significantly contributing towards the prediction of ‘behavioural intention’.
However, as expected, the influence of the ‘change efficacy’ driver in supervisors
diminished as training prepared them for their new tasks at the implementation stage.
This change in ‘change efficacy’ is explained by the already well educated employees.
More than 50% had obtained a tertiary qualification, suggesting that these employees
were more able to learn new tasks. This positive education factor of employees together
153
with the serious effort of the HR company to provide professional training assisted the
organisation in preparing its employees for the new challenges. This is reflected in their
level of confidence in coping with the challenges of the IT change.
The influence of ‘personal valence’ on ‘behavioural intention’ by supervisors was not
unexpected when considering the broader ramifications of the IT changes. Apart from
learning and adjusting to a new software program, supervisors of the HR company
needed to cope with improved transparencies of business data, develop new policies and
procedures and cope with increased competition between business units. In particular the
greater inter-business unit transparency and the associated competition between business
units changed the existing business practices. The new business practices required also a
modification of the performance based remuneration system as existing performance
bench marks became outdated. Fortunately, the HR company listened at the planning
stage to the supervisors’ concerns about performance bench marks, thus alleviating a
potential implementation obstacle.
At the implementation stage both groups seemed to consider ‘appropriateness of the
change’ as an important issue affecting their behavioural intention. This is an indication
that the HR company was struggling to move away from the previously successful niche
market business model as both supervisors and subordinates seem to doubt whether
broadening the business model would present the same competitive advantage.
These findings demonstrated the importance of a) having good knowledge of the specific
change context and b) understanding that IT changes do have a broader impact on
employees apart from adjusting and learning a new software program. This suggests that
readiness drivers are sensitive to specific change stages and can alert change agents about
employee concerns. The HR company was receptive to its staff and has addressed the
identified concerns related to training and remuneration concerns. By doing so it
facilitated an effective implementation process.
154
6.1.5.4 Organisational restructure for all employees
This part discusses the different impact of readiness drivers on behavioural intention for
employees whilst organisational restructure was implemented, and seven months after
implementation. The two measurement points chosen identify different change stages of
the dynamic organisational restructure process. At the first measurement point (T1) the
organisational change was in the implementation process as the acquired niche
businesses were merged into a new company structure. This organisational restructure
affected most of the employees as reporting relationships changed, existing teams were
fragmented and employees were required to relocate their workstations within the office
building.
At the second measurement point (T2) most of the merger implementations were
completed and only minor fine tuning was required regarding specific procedures and
policy developments.
The combined employee group findings suggest not only differences between the two
change stages, namely implementation and post-implementation stages, but also
significant differences between supervisors and subordinates at post-implementation.
The main results depicted in table 65 show that ‘appropriateness of the change’ was the
main driver during the implementation stage, but the importance of ‘appropriateness of
the change’ was replaced by the ‘need for change’ driver and ‘personal valence’ drivers
as the main predictor for behavioural intention at the post-implementation stage. This
change in driver should be worrying for the HR company at this late stage of the change
restructure as ‘need for change’ is considered an early change driver. That is, ‘need for
change’ is considered a measure for the pre-implementation dissonance, that is
dissonance is deliberately facilitated between the present and the future state of the
organisation. At this late change stage, employees expressing their concerns about the
‘need for change’ are of great concern for any change agent given the negative impact on
the change process. Employees are less motivated to support the change process, when
they start to doubt the need for organisational change. This doubt in the need for change
155
together with a perception of low management support should be a warning sign for a
changing organisation as it can easily undo the change process (Isabella, 1992; Piderit,
2000).
At post-implementation, employees seemed also to consider their personal rewards from
these changes, and employees with a positive perception of their rewards are more likely
to continue with the change progress compared with employees who felt frustrated or
disappointed.
Furthermore, perusal of the ‘Responsibility’ variable in table 65 suggests that
supervisors’ and subordinates’ perception of change intention differ significantly at the
post-implementation stage. The findings indicated that supervisors are more willing to
embrace change than the subordinate group. This finding is consistent with the literature,
which suggests that supervisors and subordinates respond differently to organisational
changes given their different role in the organisation. The roles of supervisors are much
broader in influencing the change process as they manage and lead their employees and
set a positive example for their subordinates (Crawford, Thomas, and Fink, 1980; Daley,
1988).
Table 66: Predictor variables at the implementation and post-implementation stages for the organisational restructure by supervisors and subordinates
Appropriateness Understanding Efficacy T1 ORG � � � Sex Responsibility Need Valence Support T2 ORG � � � � �
Efficacy = change efficacy, Understanding = understanding of the change, Appropriateness = appropriateness of the change; Responsibility = Supervisor/subordinate; Valence = Personal Valence, Support = Principal Support; Need = Need for the change
In regard to the HR company those findings, together with the differential between the
two employee groups, should be concerning for a changing organisation occurring as
they do, so late in the change process. This statistically significant differential between
the two employee groups is further discussed below.
156
6.1.5.5 Organisational restructure for supervisors
Examination of all the six readiness drivers in relation to behavioural intention to change
for the supervisor group showed that the ‘appropriateness of the change’ driver was the
main predictor as depicted in table 66 for the change process for both the implementation
stage and the post-implementation stage. This suggests that throughout the two change
stages supervisors remained concerned with the ‘appropriateness of the change’ for the
organisation. Despite these concerns the relationship shown in the ‘Responsibility’
variable (Table 65) in the combined analysis suggests that supervisors are more willing
to comply with the changes than the subordinate group.
Table 67: Predictor variables at the implementation and post-implementation stages for the organisational restructure by supervisors.
The supervisors indicated that their perception of the organisational restructure was
consistent for both the implementation and post-implementation stages (Table 66).
6.1.5.6 Organisational restructure for subordinates
In contrast to the supervisors, the subordinate group seemed to experience difficulties
accepting or complying with the changes. This is indicated by the changes in readiness
drivers as depicted in table 67.
157
Table 68: Predictor variables at the implementation and post-implementation stages for the organisational restructure by subordinates
Sex Need Valence Support Efficacy Appropriateness Understanding T1 ORG Subordinate
� � �
T2 ORG Subordinate
� � � �
Efficacy = change efficacy, Understanding = understanding of the change,
Appropriateness = appropriateness of the change; Need = need for change, Support =
principal support, Valence = personal valence.
At implementation, subordinates seemed to be primarily concerned with the
‘appropriateness of the change’. However, at post-implementation their perceptual focus
of the change shifted as the readiness driver ‘appropriateness of the change’ was replaced
by the ‘need for change’ driver. Although subordinates showed initial concern regarding
the ‘change appropriateness’ similar to the supervisor group, subordinates behavioural
intention was at the post-implementation stage influenced by the ‘need for change’. This
finding suggests that subordinates’ motivation to change may be more influenced by the
actual need for change rather than whether the direction of the changes is appropriate.
This outcome was unexpected as the literature purports that creating a discrepancy
between the pre-change and post-change states is considered an important first change
message to create readiness for change (Armenakis and Stanley, 2002).
It could be speculated that the supervisors’ lack of conviction for the organisational
restructure as demonstrated in their own concerns of change appropriateness may have
created a degree of doubt in their subordinate staff. This doubt in subordinates is
demonstrated in their questioning the validity and necessity of the organisational
restructure. This interpretation finds support in the literature where the influence of
management and principal support towards change is seen as pivotal for the change
implementation process to succeed (Crawford, Thomas, and Fink, 1980; Daley, 1988).
158
6.1.6 Summary
The quantitative findings show that readiness drivers are sensitive to the change context -
both type and stage - and the role an individual plays in the organisation. This study
compared the activation of readiness drivers for three different change stages namely the
planning stage, implementation stage, and the post-implementation stage across two
different change types. The findings suggest that different change types and the three
different change stages activate different readiness drives. All six readiness drivers
examined in this study played a significant role at varying stages of the change process
and for specific change types. However the findings did not identify specific patterns of
activated individual readiness drivers. That is, the findings did not reveal a consistent
pattern of activated readiness drivers for either different change types or change stages.
However, differences were observed between the supervisor and subordinate groups. In
the main, supervisors indicated that ‘appropriateness of the change’ influenced their
‘behavioural intention to change’. In contrast, the subordinate group showed a variety of
different activated readiness drivers with ‘appropriateness of the change’ dominating
their intention to change’ together with ‘change efficacy’, understanding the change’,
‘need for change’, ‘personal valence’, and ‘principal support’. It was not possible to
identify from the findings a specific pattern in relation to change types and change
stages.
6.2 Readiness drivers
In this section the importance of the individual readiness drivers to the change process is
explored using quantitative and qualitative data. This approach integrates the main
findings with the prevailing research and further provides more detailed information of
employees’ perceptions by adding new information to the understanding of the change
process. The findings of the triangulation from three different sources including two
unstructured interviews with the project coordinator, comparing quantitative mean values
159
with directionality of employee comments, and a theme analysis of the employee
comments are discussed below.
Armenakis and Stanley’s (2002) model identified five readiness drivers that act as
precursors to preparing individual employees for the changes. This researcher added
‘understanding of the change’ as the sixth driver. ‘Understanding of the change’ was not
directly assessed in their model, but Armenakis and Stanley (2002) implicitly referred to
this driver in their overall change model.
This thesis is testing the influence of the six readiness drivers on change perception and
change attitude by discussing the triangulated findings. The following section discusses
the individual drivers and their impact on change attitude as measured by ‘behavioural
change intention’.
The impact of the following six readiness drivers: ‘appropriateness for change’, ’need for
change’, ‘change efficacy’, ‘personal valence’, supervisory support’, and ‘understanding
of the change’ are discussed below in terms of a) overall importance to the formation of
change attitude, and b) ability to differentiate between the two change types and the three
change stages. Identified differences between subordinates and supervisors are also
discussed below.
160
Table 69: Summary table listing the research findings for research questions 1 to 3
Organisational Change IT Change RQ 1 At the planning stage – to what extent do demographic variables and the six readiness drivers predict employees’ behavioural intention to change for the IT change?
n/a Efficacy
Appropriateness of the change
RQ 2 At the planning stage - to what extent do demographic variables and the six readiness drivers for supervisors and subordinates predict behavioural intention to change for the IT change?
n/a Supervisor
Efficacy
Personal Valence
Subordinate
Efficacy
Appropriateness of the change RQ 3 At the implementation stage - to what extent do demographic variables and the six readiness drivers predict behavioural intention to change for the two specific change types?
Efficacy
Appropriateness of the change
Understanding of the change
Age
Time in position
Appropriateness of the change
161
Table 70: Summary table listing the research findings for research questions 4 and 5
Organisational Change IT Change RQ 4 At the implementation stage - to what extent do demographic variables and the six readiness drivers for supervisors and subordinates differ in predicting behavioural intention to change for two specific change types?
Supervisor
Appropriateness of the change
Subordinate
Efficacy
Appropriateness of the change
Understanding of the change
Supervisor
Appropriateness of the change
Subordinate
Efficacy
Appropriateness of the change
Age RQ 5 At the post-implementation stage - to what extent do demographic variables and the six readiness drivers predict employees’ behavioural intention to change for the organisational restructure?
Sex
Responsibility
Personal Valence
Principal Support
Need for change
n/a
162
Table 71: Summary table listing the research findings for research questions 6 and 7
Organisational Change IT Change RQ 6 At the post-implementation stage - to what extent do demographic variables and the six readiness drivers for supervisors and subordinates predict behavioural intention to change for the organisational restructure?
Supervisor
Appropriateness of the change
Subordinate
Sex
Need for change
Personal Valence
Principal Support
n/a
RQ 7 Cross-sectional design at implementation stage - to what extent do demographic variables and the six readiness drivers for supervisors and subordinates differ in predicting behavioural intention to change between two specific change types?
Supervisor
Appropriateness of the change
Subordinate
Efficacy
Appropriateness of the change
Understanding of the change
Supervisor
Appropriateness of the change
Subordinate
Efficacy
Appropriateness of the change
Age
163
Table 72: Summary table listing the research findings for research question 8
Planning Implementation RQ 8 Longitudinal design for IT change - to what extent do demographic variables and the six readiness drivers for supervisor and subordinates differ in predicting behavioural intention to change for both the planning and the implementation stages?
Supervisor
Efficacy
Personal Valence
Subordinate
Efficacy
Appropriateness of the change
Supervisor
Appropriateness of the change
Subordinate
Efficacy
Appropriateness of the change
Age
164
Table 73: Summary table listing the research findings for research question 9
Implementation Post Implementation RQ 9 Longitudinal design for organisational restructure - to what extent do demographic variables and the six readiness drivers for supervisors and subordinates differ in predicting behavioural intention to change for both the implementation and the post-implementation stages?
Supervisor
Appropriateness of the change
Subordinate
Efficacy
Appropriateness of the change
Understanding of the change
Supervisor
Appropriateness of the change
Subordinate
Sex
Need for change
Personal Valence
Principal Support
165
6.2.1 Appropriateness for change
Armenakis and Stanley (2002) consider ‘appropriateness for change’ to be an important
change driver. They argue that although employees have good intentions towards the
change and recognise a need for organisational change, the same employees demonstrate
their resistance towards change by disagreeing with a specific change strategy.
Furthermore, ‘appropriateness for change’ was also identified by Sastry (1997) when she
identified a list of six conditions that may cause organisational change failure. One of the
listed causes was that the ‘new strategic orientation selected may not match the
requirements of its environment’ (Sastry, 1997, p. 265). In this study the HR company
seemed to operate well within a defined niche market in the HR sector, while at the same
time a growing economy and greater skill demand provided new challenging
opportunities for the HR sector. The HR company’s expansion of its business through
selected merger acquisitions was perceived by employees as undermining the
competitive advantage enjoyed by existing arrangements. Furthermore, the HR company
was seen by it’s employees to focus more on the development of a new business model
by restructuring the entire HR company, thus threatening the competitive advantage from
the niche market business. Both the quantitative and qualitative findings support these
assertions. The findings from regression analyses show that ‘appropriateness for change’
was a significant and dominant driver for ‘behaviour change intention’ for subordinates
and supervisors alike. Those findings enforce the previous assertion that the strategic
organisation of merging and integrating new business was not perceived as matching the
employees’ perceived environment conditions. Employee comments like, ‘I am
concerned that we will be structured and asked to behave just like any other recruitment
agency out there in the market and that the cultural changes will involve the losing of our
high quality name and a less personal and more bureaucratic environment. This is
already happening. I think some of this should have been thought through beforehand’
only further underline these concerns.
166
6.2.2 Change efficacy
“Change efficacy’ is the second readiness driver in Armenakis and Stanley’s (2002)
model of creating change. The importance of this ‘change efficacy’ driver is explained in
Bandura’s (1982) Social Cognitive Theory model, which suggests that individuals are
less likely to accept changes when the challenge is perceived to be beyond the
individual’s ability. One could argue from the Social Cognitive Theory that an employee
faced with change challenges without being sufficiently trained and resourced for the
task, is less willing to work with the changes. Rather, that employee will display a
defensive attitude towards the change process. The findings of this thesis further
highlight the importance of this driver for dealing with change. The findings show that
‘change efficacy’ was an important driver for both the organisational restructure and the
IT change mainly in planning and implementing the change process for the supervisor
and subordinate groups alike. That is, initially supervisors identify with ‘change efficacy’
issues during the preparation change, but become more confident at the implementation
stage. This pattern related to ‘change efficacy’ is mimicked by the subordinate group
who show confidence concerns for the preparation and implementation stages, but seem
less concerned with ‘change efficacy’ at the post-implementation stage. This pattern was
expected since training and familiarity with the changes assist the build up of confidence
in dealing with changes (Bandura, 1982).
The qualitative employee comments did not identify with ‘change efficacy directly’, but
acknowledged the importance of training and the availability of adequate resources. This
is demonstrated in the following employee comments, ‘well prepared with training and
frequent emails regarding system updates. I've had some opportunity for input into the
development of the online testing system which I'm appreciative of’’ and ‘I have been a
little left behind with the IT changes due to missing an initial training session and at the
moment I rely on others to "bale me out" when IT issues occur. I also have very little
exposure to the IT system to the point where I am not sure exactly what it is’, and ‘so
many changes in IT and technology that staff are so overwhelmed that the majority are
not fully participating any longer. They have therefore found it difficult to use all the new
IT changes effectively’. These comments indicate that some employees are well prepared,
while others appear less confident in working with the new IT software application not
167
only in terms of their own ability, but also in respect of the perceived support available
from their peers and supervisors. The organisation is well advised to focus attention to
this matter and commence an audit of the current usage of the new software system
before commencing targeted intervention strategies like training and mentoring.
6.2.3 Need for change
The third readiness driver in Armenakis and Stanley’s (2002) model is ‘need for change’.
This driver assesses the HR company’s ability to create dissonance between the existing
internal structures and the required changes through to external influences, thus justifying
the planned changes (Pettigrew, 1987). Armanakis et al.(1993) indicated that dissonance
or ‘need for change’ is an important precursor to change readiness. In this thesis ‘need
for change’ influences behavioural intention only at the post-implementation stage. This
suggests that the organisation initially succeeded in justifying the planned changes to
their employees, but it seems that at the post-implementation stage dissonance becomes
an issue for subordinate staff. Perusal of the employee comments provide further insight
into employees’ attitude towards the ‘need for change’. Employees’ comments like, ‘you
get used to the constant change after a while. I think change is good. It can help a
company develop and become strong. However change that is too constant can cause a
great deal of uncertainty and distress which can lead to lack of productivity’ and ‘it
would receive greater support if system requirements were addressed prior to
implementation with ground floor users. The question “why?” always seems to be asked’
indicate that subordinates gained the perception that this organisational restructure had
no end point, permitting the consolidation of the achieved changes. It could be argued
that the expressed ‘uncertainty’ created a sense of overall doubt about the entire change
process. From the data it appears that the HR company managed the initial change
process well, but seemed to lose connection with its employees when the change process
was perceived as continual in nature.
168
6.2.4 Principal support
The literature has demonstrated that principal support is an essential ingredient in
facilitating and maintaining support for the change process (Beer, Eisenstat, and Spector,
1990a; Covin and Kilmann, 1990; Olian and Rynes, 1991; Savolainen, 1998). Armenakis
and Stanley (2002) included principal support as the fourth readiness driver in their
readiness for change model. In the quantitative findings principal support becomes
significant in determining behavioural intention at the post-implementation stage. The
influence of ‘principal support’ on behavioural intention at this late stage in the change
process suggests that management seemed initially very engaged in the change process,
but appeared to become less involved in the change process at the post-implementation
stage. The reduction of management involvement at that later change process is not
uncommon and is well documented in the literature on the failure of change
implementation (Covin and Kilmann, 1990; Olian and Rynes, 1991).
In summary, ‘principal support’ is an important driver for change readiness. This thesis
indicates that in the studied HR company ‘principal support’ has weaned off towards the
end stage of change implementation suggesting that management was already focusing
on matters different from the change process. Literature has demonstrated that the neglect
of ‘principal support’ has led to the failure of the change process even at this late stage
(Covin and Kilmann, 1990; Olian and Rynes, 1991).
6.2.5 Personal valence
Employees involved in change have a natural desire to want to improve their own
situations (Lloyd and Griffin, 2000). Therefore, it is important for the organisation to
inform employees about the benefits for them in order to ensure that the latter are willing
to embrace organisational change (Mauer, 1996; McNabb, 1995).
In this thesis, ‘personal valence’ was shown to be an important readiness driver for
supervisors in the planning stage of the changes, and for subordinates in the post-
169
implementation stage. As already discussed, supervisors realised early on that the new IT
changes were inconsistent with the existing bonus system leading to personal
disadvantage if the system was not modified. The reluctance of management to address
this issue would have undermined the change readiness in supervisors thus jeopardising
the entire change process. As previously stated, supervisors are crucial to the success of
change implementation.
The reasons for subordinates identifying ‘personal valence’ is not entirely clear as there
is a lack of qualitative information to augment quantitative findings. However, one could
speculate that some subordinates may have expected promotions as part of the change, or
felt that the extra work as a result of the change did not enhance their standing in the
company which is associated with an increased remuneration. This perceived lack of
personal rewards in subordinates may also be associated with the resurgence of the ‘need
for change’ driver, as subordinates may ask themselves ‘what is the need for all this
change?’.
These findings further demonstrate that readiness drivers like ‘personal valence’ act as a
monitor of individual perceptions of change readiness and ignoring these changes for
different change stages may lead to change implementation failure.
6.2.6 Understanding of the change
‘Understanding of the change’ although indirectly mentioned in Armenakis et al. (2001;
Armenakis, Harris, and Mossholder) has been demonstrated to be another important
readiness driver in itself. The quantitative findings show that the combined employee
group was concerned with understanding the complexities of the organisational
restructure at the implementation stage. The findings also show that at the post
implementation stage ‘understanding of the change’ played a key role in predicting
behavioural change intention. Significant differences in ‘understanding of change’ were
detected between the supervisor and subordinate groups for organisational change at the
post implementation stage. As expected, supervisors were better informed about the
organisational restructure compared to the subordinate group.
170
From the qualitative information and the unstructured interview with the Change Project
Officer it has been clear that the organisation experienced difficulties in clearly
explaining the organisational restructure due to confidentiality factors relating to the
merging process. Furthermore, it appears that management did not shift fast enough from
‘commercial in confidence’ to ‘enhanced communication’ after the specific merger
arrangements became binding.
The degree of uncertainty surrounding the secrecy of merger talks may also have
contributed to communication problems, as management could not provide a clear
picture of the organisational structure, given that successful merger talks would
determine the final shape of the organisational restructure.
In summary it has been shown that ‘understanding of the change’ has been an important
readiness driver especially in the light of change uncertainties where the direction of the
company was determined more by ‘at hoc’ processes rather then by clear forward
preparation. However, it appears that supervisors were sufficiently informed of the
organisational restructure, and understood the change requirement for them to adequately
facilitate the change process.
6.3 Qualitative data
This discussion attempts to further understand the change process as perceived by the
employees of the HR company in this study by triangulating the quantitative and
qualitative findings. This approach adds to the existing information of the change process
by providing more detailed information of employees’ perceptions. Furthermore, this
discussion integrates the main findings with the prevailing research. The findings of the
triangulation from three different sources including two unstructured interviews with the
project coordinator, comparing quantitative mean values with directionality of employee
comments, and a theme analysis of the employee comments are discussed below. Before
the findings are discussed in detail a brief summary is provided of the main findings.
171
6.3.1 Unstructured interview
As part of the qualitative information augmenting quantitative findings, the information
from the unstructured interviews with the Change Project Officer has been invaluable in
expanding on the findings. Information from this interview provided further insights into
the perception of management and how these perceptions are translated into the change
process.
From the interview it has become clear that the HR company realised the conflict
between confidentiality the mergers and the communication of the change in a clear and
timely manner as one of their challenges. This conflict has also been indirectly reflected
through the quantitative findings as employees seem to be very concerned with the
‘appropriateness of the change’. Furthermore, the lack of timely communication also
made it difficult for the HR company to move away, and to shift employees perception
from the HR company’s past narrow niche market branding towards the implementation
of a more varied recruitment service capturing a greater market share and opportunities in
the HR sector.
The interview provided specific detail about the need to adjust the bonus system as the
greater transparency between business units by the enhanced communication through
organisational restructure and a streamlined IT communication system disadvantaged
supervisors financially.
It appears that the new practice of sharing physical and human resources across business
units i.e. staff could easily move between business units as required, was not identified as
an issue in the quantitative finding. However, the quantitative findings at post-
implementation showed some doubt about the need of the change and some concerns in
subordinates regarding expected personal rewards.
In summary, it is evident that qualitative information makes a marked contribution in
allowing a more comprehensive interpretation of the quantitative results.
172
6.3.2 Triangulation Approach
The numerical triangulation method compares the content of the qualitative comments
with the mean scores from the ‘behavioural intention’ scale in the quantitative findings in
order to identify directional consistencies and inconsistencies. That is, positive comments
are associated with positive endorsements of the quantitative responses. Directional
consistency would further validate the quantitative data set.
Directional consistency comparisons of the qualitative and selected quantitative findings
suggest that respondents’ endorsements for the ‘behavioural change’ scale were
consistent with their qualitative comments for subordinates and supervisors alike. This
numerical triangulation method validates the appropriateness of employing a quantitative
approach in measuring attitudinal changes in population groups experiencing changes.
Furthermore, the employee comments further provided insight into their perception of the
changes as they identified additional issues not captured by the quantitative
measurement. The comments indicated that:
1. employees understood the changes, but expected more detailed information and
clearer future direction;
2. employees acted on trust of management’s decision making rather than having
factual information and guidance in following the changes process;
3. employees trusted management implicitly and felt they were well prepared for the
changes;
4. employees expressed personal confidence, flexibility and efficacy for the
6. new employees did not feel affected by the changes.
The contextual nature of employee comments will be further discussed in the following
section employing the thematic analysis method
173
6.3.3 Thematics
The thematic analysis method attempts to categorise employee comments by identifying
underlying themes that are common amongst the comments. Theme analysis assists in
making sense of large numbers of comments or narratives by highlighting core themes,
thus making the qualitative data set more meaningful. Core themes are formulated by
reducing themes with shared commonalities to a single theme. Meier and Boivin (2000,
p.59) state that ‘core themes are determined by their conceptual relationship to the
subsidiary themes and not by their frequency and occurrence’.
In this study the core themes were analysed separately for the two change types
(organisational restructure & IT change) and for the supervisor and subordinate groups.
The thematic analysis identified two main themes for each change type:
• information dissemination • perception of uncertainty.
Information dissemination was one of the major issues identified by both supervisors and
subordinates for both organisational restructure and IT change. The findings show that
the majority of the subordinates felt that information about the changes was lacking. In
contrast, the results for supervisors was leaning more towards the positive side,
indicating that as a whole they felt well informed, particularly regarding the pending IT
changes. This lack of timely information dissemination has also been identified by the
interview with the Change Project Officer who attributed this shortcoming to a slow shift
from ‘commercial in confidence’ attitude to a more forceful explanation of the
organisational restructure.
A perception of uncertainty was the second major theme identified for the organisational
restructure for subordinates. It is well known that change causes uncertainty, but the level
of uncertainty in this case may have been further fuelled by a lack of available
information about the change process given the nature of the organisational change. This
174
HR company chose to acquire selected businesses to expand their HR services and
develop greater competitive advantages in their industry sector. Horizontal merger
combines two or more competitive businesses for the purpose of market expansion, or
growth, and increased market power (Gaughan, 1996). Merger is considered a special
category of organisational change as it includes legalistic manoeuvres that demand
strictest confidentiality in addition to transformative changes requiring specific change
strategies for the acquisition to be successful. The demand for secrecy and confidentiality
at the pre-merger stage was acknowledged by Appelbaum et al. (2000) and accepted as
hindering the required communication of the changes to employees often leading to poor
communication which may persist into the merger stage. Furthermore, apart from being
able to communicate the changes Appelbaum et al. (2000, p.651) assert that
‘communication must be honest, timely, truthful, open, and address the uncertainty and
resolving as much uncertainty as quickly as possible’.
Implementation of transformative changes as required in merger activities demand a well
developed plan in terms of legal and financial aspects, and a well executed human
resource plan. Although, mergers are well planned from a financial and legal aspect, the
disappointing economic performance of mergers are mostly due to poor human resource
preparation. The poor human resource management is attributed to insufficient focus
placed on five identified factors comprising communication, corporate culture, change,
stress, and management (Appelbaum, Gandall, Yortis, Proper, and Jobin, 2000).
The second theme for the IT change indicated that training was an important component
in preparing employee for the new IT challenges. The qualitative comments from
employees suggest that the training provided was adequate for working with the new
software system as indicated by, ‘Reasonable amounts of training and consideration
were given to people's concerns. There would not be much they could do to improve’, or
‘Training is always an afterthought’, or ‘Ensure training is to consistent level when
upgrading to new technologies’ or ‘I received one day of training for the IT changes. The
organisation could offer further tailored training for staff experiencing difficulty in
specific areas’.
Although not identified as a major theme, employees also provided comment with
respect to their levels of employment i.e. part time vs. full time, and the size and
remoteness of business units away from the main offices of the HR company. It is
175
suggested from the comments that employees working part time are less well prepared
for the change initially, and that despite electronic communication more remote
employees feel less able to take part in the change process.
Finally, it is of interest to note here that only four of the identified themes were
represented in the quantitative findings, further strengthening the need for triangulations
of findings to provide a most comprehensive interpretation of the dynamics within an
organisation.
In summary, information dissemination was identified as the major theme for both
change types. These findings may shed some doubt on the importance of the readiness
drivers and Armenakis et al. (2001; Armenakis, Harris, and Mossholder) model.
However, information dissemination is implicitly linked with communication, as
information can only be disseminated when information is communicated. For this
reason the focus should be at the types and levels of communication as information
dissemination is part of the overall communication process. Furthermore, the Armenakis
et al. (2001; Armenakis, Harris, and Mossholder) model explicitly mentions
communication by the change agent as an important facet of the change dynamic.
Receipt of communication informs and contributes to attitude formation as represented
by the six readiness drivers. That is, communication is an overarching factor that is
essential when forming opinions and attitudes. Readiness drivers are measures that
inform on the prevailing attitudes and perception of individuals and for this reason are
very fluid and easily influenced by internal and external events. Nevertheless, monitoring
readiness drivers during a change process provides valuable information on the strategic
preparation and implementation of organisational change.
Unfortunately this investigation into the dynamics of organisational change did not
identify specific attitudinal patterns for each change stage or change type. However, the
readiness drivers easily identified issues when combined with qualitative information
providing valuable information in reducing implementation obstacles that could easily
lead to change implementation failure.
176
7 Conclusion
Employee readiness for change has only been investigated by a very few empirical
studies (Eby, Adams, Russell, and Gaby, 2000; Holt, Self, Thal, and Lo, 2003) despite
the failure of a great number of change implementations. This thesis has extended the
work of a small number of researchers by expanding and operationalising the change
readiness model of Armenakis and Stanley (2002). The selection of suitable scales to
measure the six readiness drivers was the first challenge, as identified existing scales
needed to be amended. The statistical validity of these scales was subsequently
confirmed by factor analysis. The selection process of the readiness scales is described in
the methodology section.
In order to minimize the complexity of the research project, an organisation with a flat
hierarchical structure was selected consisting of one layer of supervisors and one layer of
subordinates. That is, in most cases a supervisor had direct line responsibilities and
reported directly to the executive level. The selected organisation experienced change
through merger activities by acquiring a small business to create fast competitive
advantages within the HR industry sector. This type of change presented a unique
opportunity for researching employees’ perception of two separate change types, namely
the organisational restructure and the subsequently planned IT change. The two change
types were staggered and the two measure points provided data sets for three change
stages consisting of a planning stage, implementation stage and post-implementation
stage.
This thesis has expanded and applied the readiness model by Armenakis and Stanley
(2002) including an additional readiness driver, to a dynamic change process that
investigated two change types across three change stages. The IT change process was
examined across the preparation and implementation stages and the organisational
restructure was investigated for the implementation and post-implementation stages.
Furthermore, the quantitative findings were further clarified by applying a triangulation
approach employing three different qualitative data structures, namely information from
two unstructured interviews with the Change Project Officer, a numerical triangulation
177
analysis and a thematic analysis. This triangulation approach combining quantitative
findings with qualitative findings has been shown to be valuable in interpreting the
meaning of data, thus enhancing the knowledge and understanding of the data (Morse,
1991).
The findings suggest that the demographic variables like ‘age’ and ‘time in position’
contributed although statistically significant only weakly to the employees’ behavioural
intention for change. In the implementation stage for IT change ‘age’, and ‘time in
position’ were weak predictive variables. The inverse correlation for ‘age’ was
unexpected, especially for IT change as it requires older employees to demonstrate effort
in learning new computer application skills. Review of the learning literature and ‘age’
led to no definite findings as learning is not only a function of age alone, but also a
function of one’s motivation to learn (Calhoun, Staley, Hughes, and McLean, 1989;
Rosen and Jerdee, 1976; Thijssen, 1992).
In the post-implementation stage for organisational restructure only ‘sex’, and
‘responsibility’ (supervisor/subordinate) influenced employees’ tendency to comply with
the organisational restructure. The applied regression models did not detect any statistical
significant differences between male and female employees for the supervisor ans
subordinate groups, suggesting that hours of employment rather than gender differences
contributed to the significant regression result for ‘sex’ being a predictor on ‘behavioural
change intention’.
The findings regarding the readiness drivers suggest that all measured readiness drivers
played a significant role in determining employees’ behavioural change intention.
However, the most powerful predictors of employees’ behavioural change intentions
were ‘appropriateness of the change’, ‘change efficacy’, ‘need for change’, and ‘personal
valency’. Unfortunately the quantitative findings did not produce a clear readiness driver
pattern for any of the four combinations of change type and change stage. The lack of a
change readiness pattern may be due to:
1. the measuring scales used to operationalise the six readiness drivers do not
capture the relationship of readiness and different change stages;
2. employees experiencing change do not adhere to particular readiness drivers at a
given change stage;
178
3. employees experiencing change activate readiness drivers depending on the
change types; that is, IT changes place different demands on employees compared
to an organisational restructure where the impact on employees may be broader
and far reaching.
Future research in the area of employees’ change perception and the development of
more sophisticated measures will further clarify the relationship between change types,
change stages and activation of specific readiness drivers.
The numerical triangulation analysis findings comparing the mean values of the
‘behavioural intention’ score with employee comments was consistent. This outcome
validates the quantitative findings as numerical triangulation verifies that employees with
positive comments also endorsed higher mean scores.
The thematic analysis applied to employee comments identified nine themes for
organisational restructure and six themes for IT change. The identified themes were
information, uncertainty, training, participation, need for change, personal valence,
preparation, appropriateness, and principal support. For both change types the thematic
analysis identified lack of information as the main them with the majority of subordinates
and a significant number of supervisors expressing their concerns. As previously
explained, the HR company was very focused on confidentiality of information and
limited information dissemination to employees prior to specific mergers. Unfortunately
this focus on confidentiality continued to prevail some time after the mergers damaging
the change implementation process. This expressed lack of change information is likely
to have contributed to a higher degree of uncertainty in the subordinate group in terms of
their own employment status and the change process at large. Although this specific
information about the change process is considered important for the change process to
succeed, none of this information was evident from the quantitative data.
The qualitative data also assists in explaining the ‘sex’ factor in predicting employee
behavioural intention. From the employee comments it becomes evident that female
employees working part time felt left out in receiving timely training and felt that they
did not receive regular up-dates about the changes. These factors are likely to have
prevented them from being regularly involved in the change process given their irregular
attendance at work. Furthermore, the fact that female employees make up more than 75%
179
of the HR company work force could explain why the ‘sex’ variable contributed as a
significant predictor for behavioural intention. The findings suggesting that female
employees are less inclined to endorse the organisational restructure could be explained
by the qualitative findings that relate to part-time employment. That is, female employees
are not concerned with the change as such, but their hours of employment per week limit
their involvement in the change process.
Overall, it has become clear that knowledge of activated readiness drivers can assist an
organisation to positively influence a change outcome. This thesis has shown the value of
measuring and assessing employees’ change perception through the application of
readiness drivers. At this time measuring employees’ change perception in an
organisational setting is in the early stages due to the lack of sophisticated measurement
scales and the complexity of the change process. However, the application of employee
readiness drivers provides advancement in knowledge and understanding of the complex
and dynamic change process.
7.1 Limitations
This thesis represents for the first time the application of six employee readiness drivers
across change types and change stages in one organisation. In order to minimize further
complexity of the change process, the selection of a flat hierarchical organisation for this
study limits the transfer of these findings to more hierarchically structured organisations.
Furthermore, the specific demographics of the sample population in this study i.e. highly
educated employees, and high proportion of female employees means that caution should
be exercised when extrapolating the findings to the general employee population. In
addition to the special demographics, the small number of surveyed employees (189
respondents at time 1 and 141 respondents at time 2) places limitations on generalising
these findings in respect of the employee population at large. The surveyed population
group may be representative for the HR company, but is not likely to be representative of
employees at large. A larger population sample of employees from organisations with
different organisational structures would have been more representative and would
180
permit the generalisation of these findings across employee groups and employment
settings.
The data gathered at two measurement points was not individually matched for each
employee, but rather aggregated differentiating only for the role in the HR company
(supervisor/subordinate). An individually matched data set would have provided more
specific details of the changes for a given employee across sampling.
Furthermore, the sample was self selected and the quantitative and qualitative data came
from the same subject pool, limiting generalisation of these findings.
Finally, the predictive findings are based on employee behavioural intention rather than
actual performance outcomes of the implemented changes. An employee may indicate
positive change intentions, but the employee’s behaviour may be inconsistent with the
change intention.
7.2 Implications for companies
The value of measuring and assessing employees’ perception of the organisational
changes through identified readiness drivers cannot be underestimated. Although no clear
pattern of activated readiness drivers for either change type or change stage could be
identified, knowledge of employees’ behavioural change intention provides management
with an opportunity to make a timely intervention to facilitate the success of the change
implementation.
Companies undergoing planned changes could utilise the readiness driver evaluation as a
tool to monitor employees’ perception of change intention. The use of measuring
employees’ readiness drivers using survey methodology would provide management
with in-time information about the change progress based on employee perception. This
information would permit the organisation to manage change implementation better by
firstly applying organisational resources and training more strategically considering the
expressed needs of their employees, and secondly this knowledge of employee change
perception permits management to intervene in a timely fashion to facilitate change
implementation through improved communication and management support.
181
7.3 Opportunities for further research
Further research in assessing and influencing employee readiness for change as compared
to organisational readiness for change is required in order to reduce the large number of
change implementation failures reported in the literature (Waldersee and Griffiths, 1997).
Future research may benefit from firstly developing and expanding existing employee
change models and secondly operationalising and empirically testing existing employee
change models. The development of new or expanding existing employee change
readiness models could benefit by considering current psychological models in the areas
of addiction and health prevention research.
The existing measurement scales employed for measuring employee change readiness
could be improved by developing and validating a more sophisticated employee
readiness assessment tool. Recent literature reviewed shows that Holt et al. (2007) have
already endeavoured to develop such a scale.
There is currently a lack of empirical research in assessing and measuring employee
readiness for change. However, future research in this area is likely to be encouraged
with the development of new validated employee readiness scales, thus providing greater
understanding of employee motivation for change and the complexities of the change
dynamics.
Future research must also link perceptual and attitudinal research with actual
performance outcomes. This can be achieved by linking change perception through
employee readiness measures to actual performance outcomes such as days absent from
work, turn over intention and utilisation of a newly introduced measure such as, for
example, a software program.
182
Appendix A: Introduction letter (T1)
Dear Participant,
I take this opportunity to introduce myself. My name is Karl Wiener and I am currently enrolled in the PhD program with the School of Management at QUT. I understand that you have already been briefed by management that I will approach you to fill in my survey in relation to the current changes experienced in your organisation.
The purpose of this survey is two-fold. Firstly, you have an opportunity as a group to inform your organisation about your change experience, and making the organisation aware of any shortcomings observed by you during the change process. The aggregated descriptive results are considered useful for all levels of your organisation. Management has agreed that you will be informed about the aggregated group results through your supervisors.
Secondly, this survey is an important part in my research for my university degree.
This will approximately take 30 minutes of your time, and management has agreed for you to fill in this survey during work time.
DEADLINE: Please complete this survey within two weeks from the date of this email.
In advance I thank you for your participation and encourage you to click on the URL
PS: Please note that I will ask you again for your involvement in my research project in a few months time.
183
INSTRUCTION
WEBPAGE PASSWORD
To access the survey webpage at all times you have to use the following
Username: peter
Password: wAtson (all case sensitive).
This brings you to the introductory page. You can commence with your survey after you have clicked on the "agree" button at the bottom of this page.
SURVEY PASSWORD
The demographic second will ask you questions including;
Name:
Contact Email:
Password: (you will have to create your own SURVEY PASSWORD)
PLEASE MEMORISE YOUR SURVEY PASSWORD.
Your SURVEY PASSWORD together with your Email are important as it will give you access to your partially completed survey i.e. you can save your survey data at any stage, and will be able to access it where you left off.
184
The following procedure brings you back to the place you saved before you logged off from the survey.
1) Login into the Webpage, and then
2) Login into your survey using your e-mail and your SURVEY PASSWORD. (blue login box on the top left of the first page).
Your organisation is undergoing many changes. This survey asks you to comment on the various changes and describe your perceptions about the change to your job, and your feelings about your job.
How do fill in the survey?
Management has agreed for you to fill in this survey during working hours. This survey is not a test. There are no right or wrong answers. We simply want to know your personal views about the changes occurring at your organisation. There are instructions at the top of each section. Read these carefully before you begin answering the questions in the section. Please answer EVERY question by clicking on the respective checkbox. Respond according to your first reaction. Do not spend too long on any one question.
Confidentiality
This project is being conducted as part of Mr Wiener’s doctoral studies with the School of Management at the QUT under the supervision of Dr Mark Griffin. Karl Wiener can be contacted on 07-38649410 or [email protected], and Dr Griffin can be contacted on 07 38644264 or [email protected].
After receipt of your information vial email, the personal identifiers will be replaced with an identifier number that is not associated with your personal details. The database will not contain information regarding your personal details, like your name or e-mail address.
Voluntary participation
Although we encourage you to participate in this project, it is also important for you to know that you can terminate your participation at any time without penalty.
Feedback
Participants of the research project will receive group feedback provided through their supervisors.
Statement of consent
186
By returning the completed survey, you are indicating that you:
Have read and understood the information sheet about this project;
Have had any questions answered to your satisfaction;
Understand that if you have any additional questions you can contact the research team;
Understand that you are free to withdraw at any time, without comment or penalty;
Understand that you can contact the research team if you have any questions about the project, or the Secretary of the University Human Research Ethics Committee on 3864 2902 if they have concerns about the ethical conduct of the project; and agree to participate in the project.
How long have you been working in your current position?
Approximately _________ months
How long have you been working with this organisation?
• Less than 6 months • 6 months to 12 months • 2 years • 3-5 years • more than 5 years
188
Position Level
No direct supervisor responsibility
Direct supervisor responsibility
If YES, then please indicate number of staff directly reporting to you
Number of staff ______________
189
Organisational Structure changes
Your organisation is undergoing structural changes. Part of the structural change combines X group, Y group, and Z group to form the HR Group. This structural change encourages staff to work together as one organisation to provide Human Resource Services to combined client groups. Some of this structural change will affect how the teams work. That is staff compositions in teams may be changed requiring you to work closely together with professionals from different professional disciplines.
We ask you to think about the structural change’s impact on your work unit/team when you answer the questions below.
1= strongly disagree
2 = moderately disagree
3 = disagree
4 = neutral
5 = agree
6 = moderately agree
7 = strongly agree
I do understand why this structural change is needed for this organisation.
I do feel the structural change is needed at this time. The need for the structural change is not urgent. The need for structural change is vague. It is important that this structural change happens. I am confident in my ability to deal with the structural change.
However this structural change affects me, I am sure that I can handle them.
I am sure that I will be able to cope with this structural change.
I have reason to believe that I may not perform well in my job, following the implementation of this structural change.
I feel insecure about my ability to work effectively once this structural change is implemented.
190
I am convinced that I will have a lot to gain from this structural change.
I can’t see how this structural change will help me. This structural change is personally meaningful for me. I can’t see how this structural change will enhance my career prospects.
This structural change will benefit me personally. I believe top management are strongly behind this structural change and support its implementation.
Most of my work colleagues are supportive of this structural change.
My immediate superior is supportive of this structural change.
There is support from the managers in this work unit for this structural change.
The managers in this work unit can be relied on when things get tough.
The desired structural change will benefit the organization.
It is the right time for the organization to implement this structural change.
This structural change will improve the organisation. This structural change is in the best interest for the organisation.
This structural change poses a great risk for the organisation.
{UNDERSTANDING = UN}
The questions below are concerned with how well have understood the requested structural change.
1= not at all
2= just a little
3= a moderate amount
4=quite a lot
5= a great deal
Do you understand what is involved in the structural change?
Do you understand the rationale underlying the structural change?
191
Do you understand why the structural change is made? Do you see why the structural change is necessary? Do you understand what is expected of you to implement the structural change?
{Intention = INT}
There have been many changes at your workplace in regard to your work team. The questions below ask you about your level of support for implementing the structural change affecting your work team.
1= strongly disagree
2 = moderately disagree
3 = disagree
4 = neutral
5 = agree
6 = moderately agree
7 = strongly agree
In the future I will resist the structural change. In the future I will be inclined to try the structural change.
In the future I will support the structural change. In the future I will do whatever possible to support the structural change.
In the future I will hesitate to press for such structural change.
In the future I actively defend the structural change as I believe that they will work.
In the future I will put in time to support the structural change.
192
IT changes
There have been changes in your organisation including the introduction of a new Information Technology system (IT system). The proposed introduction of the “(name) Software” system requires the learning of the new system, and to adapt your working procedures to the new software system. We ask you to think about the impact of the proposed “(name) Software” system on your work procedures when you answer the following questions.
1= strongly disagree
2 = moderately disagree
3 = disagree
4 = neutral
5 = agree
6 = moderately agree
7 = strongly agree
I do understand why this proposed IT change is needed for this organisation.
I do feel this proposed IT change is needed at this time. The need for the proposed IT change is not urgent. The need for proposed IT change is vague. It is important that this proposed IT change happens. I am confident in my ability to deal with the proposed IT changes.
However the proposed IT change affect me, I am sure that I can handle it.
I am sure that I will be able to cope with the proposed IT change.
I have reason to believe that I may not perform well in my job, following the implementation of the proposed IT change.
I feel insecure about my ability to work effectively once the proposed IT change is implemented.
I am convinced that I will have a lot to gain from this proposed IT change.
I can’t see how this proposed IT change would help me. This proposed IT change is personally meaningful for me I can’t see how this proposed IT change would enhance
193
my career prospects.
This proposed IT change would benefit me personally. I believe top management are strongly behind this proposed IT change and support its implementation.
Most of my work colleagues are supportive of the proposed IT change.
My immediate superior is supportive of the proposed IT change.
There is support from the managers for this proposed IT change in this work unit.
The managers in this work unit can be relied on when things get tough.
The desired proposed IT change will benefit the organization.
It is the right time for the organization to implement the proposed IT change.
This proposed IT change would improve the organisation.
This proposed IT change is in the best interest for the organisation.
This proposed IT change poses a great risk for the organisation.
{UNDERSTANDING = UN}
The questions below are concerned with how well have understood the proposed IT change.
1= not at all
2= just a little
3= a moderate amount
4=quite a lot
5= a great deal
Do you understand what is involved in the proposed IT change?
Dou you understand the rationale underlying the proposed IT change?
Do you understand why the proposed IT change is made?
Do you see why the proposed IT change is necessary? Do you understand what is expected of you to implement the proposed IT change?
194
{Intention = INT}
There have been many changes at your workplace in regard to your work team. The questions below ask you about your level of support for implementing the proposed IT change affecting your work team.
1= strongly disagree
2 = moderately disagree
3 = disagree
4 = neutral
5 = agree
6 = moderately agree
7 = strongly agree
In the future I will resist the IT change. In the future I will be inclined to try the IT change. In the future I will support the IT change. In the future I will do whatever possible to support the IT change.
In the future I will hesitate to press for such IT change. In the future I actively defend the IT change as I believe that they will work.
In the future I will put in time to support the IT change.
195
Appendix C: Letter of Apology
Dear Participant,
SORRY for the inconvenience caused.
Due to some server problems at QUT, the online survey was unavailable for you to peruse and complete. However, the problems have been resolved and you should now be able to access the online survey on:
You can commence with your survey after you have clicked on the "agree" button at the bottom of the introductory page. This brings you to the second page
Name:
Contact Email:
196
Password: (you will have to create your own SURVEY PASSWORD)
PLEASE MEMORISE YOUR SURVEY PASSWORD.
SURVEY PASSWORD
The survey password ((blue login box on the top left of the first page) is ONLY important when you have not completed the survey, but saved your answers and want to return to the online survey. By entering your email and password, you can access your incomplete online survey were you previously left off, and complete the survey.
Thank you,
Karl Wiener, School of Management, Queensland University of Technology
Some of you have already assisted me with my studies by filling in the first survey in February this year. My name is Karl Wiener and I am currently enrolled in the PhD program with the School of Management at QUT.
In order for me to complete my study I ask you again to help me by giving me some of your work time to fill in my second survey. This survey is considerably shorter than the first survey, and should take less time for you to complete (max 20 minutes). Management has agreed for you to fill in this survey during work time.
As you may notice, I have selected a different server and I simplified the online procedure making it easier for you to complete the survey.
Please note that the numbering on the left column of the survey is not representative of the number of items for you to answer, as you can skip some identified sections of the survey as some items are applicable only for supervisors or non-supervisors.
I would like to invite all staff to participate in this survey irrespective whether you participated in the first survey.
The purpose of this survey is two-fold. Firstly, you have an opportunity as a group to inform your organisation about your change experience, and making the organisation aware of any shortcomings observed by you during the change process. The aggregated descriptive results are considered useful for all levels of your organisation. Management has agreed that you will be informed about the aggregated group results through your supervisors.
198
Secondly, this survey is an important part in my research for my university degree.
DEADLINE: Please complete this survey within three weeks from the date of this email.
In advance I thank you for your participation and encourage you to click on the URL: http://www.zydec.com.au/karl/
Thank you,
Karl Wiener,
PhD student,
199
Appendix E: Thank you letter
Dear Survey Respondents,
The online Karl-Survey is now closed and I would like to express my gratitude and thanks for your willingness and time to assist me in my research project. As promised, you will receive feedback through your respective supervisors in early 2003.
The holiday season is close and I want to wish you all a MERRY CHRISTMAS and a PEACEFUL NEW YEAR.
Karl Wiener
200
Appendix F: Employee comments
Respondents comments at time one listed and sorted in ascending order for the supervisor and subordinate groups (SP1- subordinate denotes 0;supervisor denoted as 1), and the mean values of the behavioural intention scales for structural change (INT) and IT change (ITINT).
The ‘ORG COMMENTS’ column reports the comments of employees of the organisational restructure and the ‘IT COMMENTS’ lists employee comments for the IT change.
id sex SP1 INT ITINT ORG COMMENTS IT COMMENTS 172 f 0 3.71 4.00 More information about the changes. Not prepared at all for the IT change
don’t even know what exactly that change is.
184 f 0 4.00 3.43 We have been kept informed through the whole process. But the main part has not happened yet there should be second showings so that we can all learn what is happening within the organisation as the information often does not get relayed back to those that were unable to attend meetings.
Doesn't really apply to my work I don't think.
201
id sex SP1 INT ITINT ORG COMMENTS IT COMMENTS 164 f 0 4.00 4.00 Enough information was given. it just
wasn't relevant to my work unit as there was no structural change.
Don't use IT software in my job even though I was given training in it.
258 f 0 4.00 4.00 You get used to the constant change after a while. I think change is good. It can help a company develop and become strong. However change that is too constant can cause a great deal of uncertainty and distress which can lead to lack of productivity.
The preparation was fine.
155 f 0 4.29 4.29 Reasonably well prepared; though the organisation is generally poor at communicating issues thoroughly. Typically details are brushed over and major issues kept "hush hush".
I don't think this impacts me greatly
131 f 0 4.29 4.86 Quite well. Unfortunately I was unable to attend the major meeting in regards to this so I do have a bit of a knowledge gap which I am working through with my Team Leader.
Well prepared for the IT change. Do not believe that I could have been better prepared.
163 f 0 4.57 6.43 Only received thorough information by attending the annual conference. Provided more information sheets / emails with information on changes and what to expect.
Well prepared with training and frequent emails regarding system updates. I've had some opportunity for input into the development of the online testing system which I'm appreciative of.
202
id sex SP1 INT ITINT ORG COMMENTS IT COMMENTS 106 f 0 4.71 4.29 In terms of structural change I feel that
I have been pretty well prepared for what occurred in relation to ex management at the HR company. Perhaps not as prepared or up to date with what will happen thereafter however up until now has been sufficient.
That too has been fine we have had some briefings during our sales meetings for other staff members and IT in Sydney.
71 f 0 4.71 4.71 We will find more information about the structural change in our regional meeting at end of November.
I have not prepared anything as there has not been a great deal of change in the office. Once things are definite with changes of IT I will prepare myself for it then.
194 f 0 4.86 4.86 By completing the deal with Bundy sooner. By treating staff who were being made redundant with more care and respect.
By providing flow charts of how the organisations will be interrelated. Examples and print outs of what the data base looks like. Quality procedures etc.
73 f 0 4.86 5.00 You need to be prepared for change in any environment. There is no point in trying to fight it. Change is inevitable not only for the company to grow but you as an individual.
Not at all. Just go with what changes are implemented and hope adequate training is provided
203
id sex SP1 INT ITINT ORG COMMENTS IT COMMENTS 66 f 0 4.86 5.29 Have just started working here so do
not really know what the company was like before. I have been told but as yet do not fully understand. I have just started working here so am not completely aware of the changes.
I have been told a little. It does not really apply to me as for me it is no more of a change than before.
149 m 0 5.14 4.71 I haven't really been told very much at all. More detail on the finer points would be nice.
More info would be handy.
39 m 0 5.14 4.86 There has been some communication regarding the changes that will be made. I do understand why complete information has not been communicated and at this stage.
I feel reasonably confident in management that we will be prepared I am a total buyer of new technology. As an experienced user I would like to have seen some sort of steering committee that at the least would have given me confidence that the new system will suit my needs. At the moment it feels as though management wants the system and the business must use it. At this stage with very little communication I have no confidence that we will be using a state of the art system that will aid my work. In context I have been very disappointed with the system we have historically used and the ability of the IT team to be in any way innovative or helpful with the users
204
id sex SP1 INT ITINT ORG COMMENTS IT COMMENTS 239 f 0 5.00 4.29 I have taken the "unit" to be HR
company. Sydney and the "work team" to be the team within which I work. We have been reasonable well prepared for the fact that it is coming and of its necessity. However the aspect of how the change will affect me personally has been handled very badly and a lot of people feel this way to the point that they have almost given up on it. I am concerned that we will be structured and asked to behave just like any other recruitment agency out there in the market and that the cultural changes will involve the losing of our high quality name and a less personal and more bureaucratic environment. This is already happening. I think some of this should have been thought through beforehand. I also feel that I have not been canvassed about my skills or preferences and that I am being placed in a position where because of the shambles in the structure and the delay in anything happening I cannot possibly perform well. Also I feel that on the one hand we are being asked to perform as per other agencies (meet
Training and support for IT systems has been OK except that it is just not a good system for either assignment of client management. Someone who actually uses the system on a day-to-day basis as part of his or her job should have been road testing it. Similarly there have been decisions made on what other resources we can have or not have with no notice nor surveying of the people
205
targets which are x3 of our base salary) but that no other part of the structure supports this mode of work. Therefore we cannot possibly meet the personal targets. I think that the whole thing should have been planned better and that personal targets should not have been changed until the structure has been changed. The impact on the individual has not been thought through.
206
id sex SP1 INT ITINT ORG COMMENTS IT COMMENTS 128 m 0 5.00 5.57 The structural change has not had a
significant impact upon our day to day activities, but has impacted upon longer term aims particularly in the impetus for increased business development and greater accountability in revenue forecasting.
I have been a little left behind with the IT changes due to missing an initial training session and at the moment I rely on others to "bale me out" when IT issues occur. I also have very little exposure to the IT system to the point where I am not sure exactly what it is.
99 f 0 5.14 4.86 Have a reasonable knowledge but not to any great extent - still feel a little separated as we are based in NZ compared to the rest of the co being Australian based.
I know very little of any proposed IT changes other than the fact we will be getting a new database.
186 f 0 5.14 5.86 Nothing more than hearsay at this point. We will be attending an in-house conference on 23 November at which I expect much will be explained to ALL of the staff. While some information trickles down on a daily basis.
IT/IS have issued much email concerning their restructure on the whole we just carry on doing our jobs until they move the cheese again. A: Not at all. B: By keeping the rank and file better informed.
52 f 0 5.14 6.57 Internally we have been quite well prepared....I guess it might have been nice to have all been invited to meet the team at ore we merge...so that it isn't and "us" and "them" situation..(apart from the Christmas party)....very conscious about losing our culture and it might be nice to understand theirs...
We know its happening and we know that we will have full training and support for quite some time...until the changes happen its difficult to assess
207
id sex SP1 INT ITINT ORG COMMENTS IT COMMENTS 123 f 0 5.14 6.86 Not particularly well - when the changes
were going to occur in this office many of the staff were asking questions about what was happening and then we would be told.
Very good with continually emails advising staff of the changes.
185 f 0 5.29 4.71 By making sure that everyone could see the videos detailing changes to the organisation. If people are absent when videos are shown. There should be second showings so that we can all learn what is happening within the organisation as the information often does not get relayed back to those that were unable to attend meetings
129 f 0 5.29 5.00 General staff have been fairly uninformed about structural changes made. Redundancies occur which are not communicated to the broader group etc. More honest and open communication would be of great benefit to the wider organisation.
The IT change was handled quite well with comprehensive hands-on training provided to all staff who would be affected by the changes. Staff were also asked for input on the function of the system BEFORE going live which was good.
154 f 0 5.43 4.43 More information. Open communication to everyone. Details of micro changes.
Not just macro by giving us adequate computers to cope with the change and by giving us detailed and relevant info about the change
208
id sex SP1 INT ITINT ORG COMMENTS IT COMMENTS 138 f 0 5.43 5.57 My knowledge of changes has come from
general emails from CEO and PA to whole group and not directly from my GM. Our group/team does not have regular meetings – a lot of us are PT and very busy. I think meetings from time to time (monthly) would improve communication.
I am unsure exactly of what is involved in IT changes as far as I know they will not directly affect my team - we do not use IT software, but rather recruit manager is our database.
141 f 0 5.57 4.57 As a relatively new employee; I feel that my preparedness was already limited anyway.
What IT change???
32 f 0 5.57 4.71 information has come from Australia and then we have had informal talks although none at all have not been given any information
165 f 0 5.57 4.86 Keeping peripheral/casual staff better informed.
I received training I was well prepared
189 f 0 5.57 5.14 Not really informed about the changes that will take place until they have happened. Have been advised in general about the possible changes and why- for the future. Just cope with them as they happen.
Training is minimal.
238 m 0 5.57 5.57 Have been prepared well. Advised me of the big picture earlier. Have been prepared average. Could not have been improved -
but IT needs to be more proactive in developing and acquiring adequate Resources
209
id sex SP1 INT ITINT ORG COMMENTS IT COMMENTS 25 m 0 5.57 5.86 Reasonably well- a fair bit of
communication. Greater work unit leadership and communication
As well as can be expected - it is constantly changing
55 f 0 5.71 3.71 More involvement and communication from middle / regional management. Talk to the people that use the program on a day to day basis to do their job and ask them what they want before
going ahead and implementing a system
166 m 0 5.71 5.29 Unprepared. Just awaiting to see how it goes. As long as we can recruit in an environment that is supportive. I will be just fine.
Not prepared. Tell us what areas in the systems now we can focus on as to ensure all info goes into the new system
118 m 0 5.71 5.57 Not a great deal of preparation required. In all the preparation has been adequate.
I received one day of training for the IT changes. The organisation could offer further tailored training for staff experiencing difficulty in specific areas.
159 f 0 5.71 5.57 I have not been informed of the structural change though it may be because I work part-time and have had time off for my university exams
210
id sex SP1 INT ITINT ORG COMMENTS IT COMMENTS 28 f 0 5.86 6.57 It's difficult to comment as I have only
been with the organisation for 1 month. However we have had several seminars and discussions about the takeover and how it will affect HR company.
Everyone in the organisation will be attending training seminars over the next month to prepare us for the changes although until this point we have not been told a great deal about the system and how it will affect us on a day-to-day basis.
145 f 0 6.00 5.14 Provide more information of how each business unit fits within the organization. Have more information on the changes occurring.
202 m 0 6.00 5.71 Change was not prepared well as there was a lot of uncertainty as to whether change would occur or not before the purchase of our division and then on the day of the purchase major changes were enacted.
Training is being provided on the IT changes and this has been handled well
257 m 0 6.00 5.86 as well as needed. keep me informed of the big picture and required changes. progress of others fine
nil
22 m 0 6.00 6.57 Increased communication
211
id sex SP1 INT ITINT ORG COMMENTS IT COMMENTS 60 f 0 6.00 6.57 Not very well overall. I would say the
communication from senior management to consultant level has been very poor in terms of other teams - how the existing organisation is going to look as a whole organisation in the future and in terms of payroll of us and our temporary workers. They seem to have forgotten that we have all worked closely together for a long time and everyone here is our friend. When we see our friends upset by lack of communication as to their future with the company or inadequate information is upsets us. The must communicate proposed changes to every aspect of the company BEFORE they occur. We should be given the chance to give our input then too.
IT side seems fine. A new system was needed anyway. It will be easier to answer this when we have actually seen what the new system is like and how it will be better for us. No real dramas here though.
212
id sex SP1 INT ITINT ORG COMMENTS IT COMMENTS 14 f 0 6.14 5.71 As our team is not local in Sydney we are
left out of the loop on a lot of occasions. ACT can be so far away and yet so close. Lack of communication and preparation from the higher managers of the Sydney team have left us juggling many tasks with the takeovers and changes being implemented. If it wasn’t for our fantastic branch manager here I think this team would have fallen apart. We need more training sessions for the new arrivals who have been thrown from one way of doing things into our midst of QA procedures and structural differences. Debriefing from Head Office for the teams in place and the team joining and then the two teams together. More follow through on how this is impacting on the individual and how that reflects on the team as a whole I feel a lot more communication and support would help a great deal in implementing procedures and changes.
48 m 0 6.14 6.14 Fairly well -however some things have been falling the cracks between the theory of setting it up to the practical application in the workplace more communication on the nuts and bolts as opposed to the generalizations.
213
id sex SP1 INT ITINT ORG COMMENTS IT COMMENTS 69 m 0 6.14 6.14 Not sure about details of change, but
don't know how it could be improved training
176 f 0 6.14 6.14 The organisation is very organised in informing staff about structural change. Regular staffing updates on organisation progress would be good.
I am very adaptable to change as long as good training is provided.
64 f 0 6.14 6.57 The organisation I worked for is the newest acquisition into the group. There was no way of preparing us for the takeover given the confidentiality – once the announcement was made. The changes were immediately imposed upon us. My new role was decided for me - but in line with my skills and experience. There was no opportunity for advance warning having said that the company has tried hard to assist me in adapting to my new role.
This has been more than satisfactory with workshops information updates and training available.
68 m 0 6.29 5.14 Preparation - minor. Improvement - communication should be pro-active rather than reactive. Clear goals and the direction to take to achieve these goals should be formulated and communicated.
IT change is not relevant to myself – as it was already in place when I joined five months ago
151 m 0 6.43 .00 Minimal 94 m 0 6.43 5.57 Use the experiences of operational
personnel to a much greater degree when developing strategies.
Ensure training is to consistent level when upgrading to new technologies
214
id sex SP1 INT ITINT ORG COMMENTS IT COMMENTS 50 m 0 6.57 6.00 In regards to structural change itself. I
have difficulty to imagine a way to prepare employees better than to keep them informed about what is happening when it is happening and whom it will affect. Often some feel that they don't really know what their responsibilities are or whether the scope of their position has changed.
I have been prepared for the proposed IT changes as such. What we need more than anything is a clear decision to be made (and then communicated) about the future of some of the systems. The biggest problem has been indecision earlier in the year. We were told that Axiom was on its way out so people stopped adding detail to it sticking with the bare minimum. But now its back and we have a poor database.
85 f 0 6.57 6.57 not applicable to WA - changes will be delayed -
not applicable just yet
58 m 0 6.71 5.14 Must have a flexible approach. - be educated about the big picture and what the strategists of the company are trying to achieve
Prepared as best I could but there has been little support and training on new systems etc. Here it is deal with it! Training is always an afterthought. Little is asked of the people who use the system the most. It would receive greater support if system requirements were addressed prior to implementation with ground floor users. The question “why?’ always seems to be asked.
215
id sex SP1 INT ITINT ORG COMMENTS IT COMMENTS 156 f 0 6.71 6.43 My unit has been disbanded and I am to
transition to HR Company but after 8 weeks this has not happened. I have no manager giving me direction (as he was retrenched) and I am not yet on the HR Company WA payroll. I am still on a Sydney corporate payroll. I am based in Perth and work from the HR company WA office. Previously I work in a National role. My work in assessment centres is now restricted to Perth yet there is no one selling our specialist program in Perth. The type of assessment conducted in Perth tends to be Psych assessment. Until the HR company business transitions in Perth it is hard for anyone to determine my role. So - I am in limbo. In fairness it is no one's fault - it is just a waiting game. I no longer belong to the People 2 People team so must wait for a decision on my future which will occur once HR X WA integrates with HR Company in WA.
I have read very little about the IT changes as largely they do not effect me as I am not a user of the software. I have had my laptop reconfigured for the HR company group but am not yet on their server.
216
id sex SP1 INT ITINT
ORG COMMENTS IT COMMENTS
12 m 0 6.71 6.57 Reasonably well. All staff knew of the many changes occurring well before they happened. The organisation could have had a few more general meetings to in-form of imminent changes. But overall it was handled as well as could be expected.
Reasonable amounts of training & consideration were given to people's concerns. There would not be much they could do to improve.
233 f 0 7.00 7.00 There are a lot of new employees within HR company business who are still learning what the company is all about. Lots of communication about where the company is going; the company's goals and more knowledge of the different brands under the HR company business banner including what each one specialises in can only be beneficial to staff and the future of the HR company business. I am also a new employee so this question doesn't really relate to me.
217
id sex SP1 INT ITINT
ORG COMMENTS IT COMMENTS
59 f 1 4.00 4.00 From a management point of view - I believe I was as well prepared as possible and have been kept updated regularly.
The IT changeover whilst it hasn't happened in my department yet - I have had regular call from those people managing the change. Once again from a management perspective - maybe fortnightly teleconference would have been beneficial to discuss issues. Problems and have updates This has been well managed so far - my department will not have the IT system online until end of January now but we have been kept up to date by the guys doing the changeover constantly. They are open to our requirements and happy to listen to any feedback and accommodate it where possible.
216 f 1 4.00 4.43 Limited communication has been the hallmark of the introduction of the change - decisions made "behind closed doors" in a non-inclusive sense.
Very well communicated - plenty of information and updates on the how why when and where
214 f 1 4.57 4.86 Information on changes have not been passed down the system very well. Know about changes when something needs to changed to work. Could have been given more information on the what
218
id sex SP1 INT ITINT
ORG COMMENTS IT COMMENTS
241 f 1 4.71 4.29 Not very well. Minimal consultation and little feed in. Communication of corporate strategy. Look for the quality solution not the quick fox and then give everyone the information and time required to obtain "buy in".
Preparation was good. Feed in trials and training. Further training once system was implemented. Their was resentment at people needing help once the system was live because they had had training but the training was not adequate to cope and there was a gap between the training and implementation
104 f 1 4.71 4.71 Information has been received regularly from CEO via email.
IT now update us regularly. We will probably be trained and go with the flow.
40 m 1 4.86 4.43 We are prepared but need a greater level of communication. Not seminars. Actual 1 on 1 meetings to discuss individual affects.
We are prepared but it does seem like we are changing quickly and are then likely to change again. My view is that we can wait and make the change comprehensively all at once
147 f 1 5.00 4.71 Information on changes have not been passed down the system very well. Know about changes when something needs to change to work.
Quite well they have told us of intended changes.
179 m 1 5.00 5.43 I've come in half way through the changes informing me before I started that they are in the middle of major changes that are not running all that smoothly.
None Get the end users involved in the decision process.
219
id sex SP1 INT ITINT
ORG COMMENTS IT COMMENTS
1 m 1 5.14 5.43 Change has been communicated very well.
IT now IS have been communicating their changes to us also.
191 f 1 5.43 4.71 Part of divisional preparation and strategy day. Excellent opportunity to understand goals and objectives and be part of long term preparation. Involved in decision making re performance reviews/redundancies/structural change and subsequent implementation within work unit. I require further training skills in these areas as I find this aspect extremely stressful and not planned well enough. Workload precludes allowing much time for consultation with subordinates re their needs. Aspirations etc.. All ad hoc and reactionary.
So many changes in IT and technology that staff are so over whelmed that the majority are not fully participating any longer. They have therefore found it difficult to use all the new IT changes effectively. Each office requires a dedicated IT tech support person available for training upgrades troubleshooting etc. Too much change with no on-site training support. Has caused great deal of stress and frustration. New equipment/software arrives and no one to drive its implementation. This is the area that requires the greatest attention in our region.
80 m 1 5.86 5.43 Involved in big picture presentations but not a lot of discussion at the micro level for my business unit. I would like to have been more involved in general management preparation.
My unit has been involved in IT introduction from the start.
220
id sex SP1 INT ITINT ORG COMMENTS IT COMMENTS 137 f 1 6.14 4.00 Being in NZ we are yet to see the full
implication of change; Not at all in NZ.
84 f 1 6.57 6.14 Because the WA section of X is under a separate partnership agreement we have had virtually no physical preparation for the changes – but they have attempted to keep us up to date with e-mails and verbally.
We have had no information at all about the IT changes and virtually none about the organisation changes. As mentioned we have had no preparation for the IT changes. I think that the majority of people in this company believe IT changes are essential as the system we use is well out of date and I expect them to embrace it.
92 f 1 6.71 5.71 Believe we have been extremely well prepared. Strongly support regional training road shows to minimise time taken to train and take-up of skills
117 f 1 6.86 4.86 Well prepared and informed. Not particularly applicable to me but well communicated including valid reasons.
42 f 1 6.86 6.00 I have not seen any plans for structural change but am aware that they are going to occur. I am happy with the management implementing change that will benefit the business.
I am again not sure of IT changes but agree with any new implementation or procedures or systems that will benefit the company and make our jobs easier on the administration side.
221
id sex SP1 INT ITINT ORG COMMENTS IT COMMENTS 67 m 1 7.00 5.14 Don't yet know that much about the
structural change apart from addition of new companies. -so don't feel very prepared as far as info given goes however do feel prepared in that accept and welcome change and reorganization so don't feel change will an adverse affect on me personally even though may have to change work practices etc
222
Appendix G: Thematic Analysis of organisational restructure comments
Thematic Analysis of organisational restructure comments
Subordinate organisational restructure In U T Pt N V Pl Ap S More information about the changes - We have been kept informed through the whole process. But the main part has not happened yet there should be second showings so that we can all learn what is happening within the organisation as the information often does not get relayed back to those that were unable to attend meetings.
-
Enough information was given. it just wasn't relevant to my work unit as there was no structural change.
+
You get used to the constant change after a while. I think change is good. It can help a company develop and become strong. However change that is too constant can cause a great deal of uncertainty and distress which can lead to lack of productivity.
-
Reasonably well prepared; though the organisation is generally poor at communicating issues thoroughly. Typically details are brushed over and major issues kept "hush hush".
-
223
Subordinate organisational restructure In U T Pt N V Pl Ap S Quite well. Unfortunately I was unable to attend the major meeting in regards to this so I do have a bit of a knowledge gap which I am working through with my Team Leader.
-
Only received thorough information by attending the annual conference. Provided more information sheets / emails with information on changes and what to expect.
-
In terms of structural change I feel that I have been pretty well prepared for what occurred in relation to ex management at the HR company. Perhaps not as prepared or up to date with what will happen thereafter however up until now has been sufficient.
- - -
We will find more information about the structural change in our regional meeting at end of November.
+
By completing the deal with Bundy sooner. By treating staff who were being made redundant with more care and respect.
-
You need to be prepared for change in any environment. There is no point in trying to fight it. Change is inevitable not only for the company to grow but you as an individual.
+
Have just started working here so do not really know what the company was like before. I have been told but as yet do not fully understand. I have just started working here so am not completely aware of the changes.
-
224
Subordinate organisational restructure In U T Pt N V Pl Ap S I have taken the "unit" to be HR company. Sydney and the "work team" to be the team within which I work. We have been reasonable well prepared for the fact that it is coming and of its necessity. However the aspect of how the change will affect me personally has been handled very badly and a lot of people feel this way to the point that they have almost given up on it. I am concerned that we will be structured and asked to behave just like any other recruitment agency out there in the market and that the cultural changes will involve the losing of our high quality name and a less personal and more bureaucratic environment. This is already happening. I think some of this should have been thought through beforehand. I also feel that I have not been canvassed about my skills or preferences and that I am being placed in a position where because of the shambles in the structure and the delay in anything happening I cannot possibly perform well. Also I feel that on the one hand we are being asked to perform as per other agencies (meet targets which are x3 of our base salary) but that no other part of the structure supports this mode of work. Therefore we cannot possibly meet the personal targets. I think that the whole thing should have been planned better and that personal targets should not have been changed until the structure has been changed. The impact on the individual has not been thought through.
+ + - + - -
225
Subordinate organisational restructure In U T Pt N V Pl Ap S The structural change has not had a significant impact upon our day to day activities, but has impacted upon longer term aims particularly in the impetus for increased business development and greater accountability in revenue forecasting.
-
I haven't really been told very much at all. More detail on the finer points would be nice.
-
There has been some communication regarding the changes that will be made. I do understand why complete information has not been communicated and at this stage.
-
Have a reasonable knowledge but not to any great extent - still feel a little separated as we are based in NZ compared to the rest of the co being Australian based.
-
Nothing more than hearsay at this point. We will be attending an in-house conference on 23 November at which I expect much will be explained to ALL of the staff. While some information trickles down on a daily basis.
-
Internally we have been quite well prepared....I guess it might have been nice to have all been invited to meet the team at ore we merge...so that it isn't and "us" and "them" situation..(apart from the Christmas party)....very conscious about losing our culture and it might be nice to understand theirs...
- - -
Not particularly well - when the changes were going to occur in this office many of the staff were asking questions about what was happening and then we would be told.
- -
226
Subordinate organisational restructure In U T Pt N V Pl Ap S By making sure that everyone could see the videos detailing changes to the organisation. If people are absent when videos are shown. There should be second showings so that we can all learn what is happening within the organisation as the information often does not get relayed back to those that were unable to attend meetings
-
General staff have been fairly uninformed about structural changes made. Redundancies occur which are not communicated to the broader group etc. More honest and open communication would be of great benefit to the wider organisation.
-
More information. Open communication to everyone. Details of micro changes.
-
My knowledge of changes has come from general emails from CEO and PA to whole group and not directly from my GM. Our group/team does not have regular meetings – a lot of us are PT and very busy. I think meetings from time to time (monthly) would improve communication.
-
As a relatively new employee; I feel that my preparedness was already limited anyway.
-
information has come from Australia and then we have had informal talks although none at all have not been given any information
-
Keeping peripheral/casual staff better informed. - Not really informed about the changes that will take place until they have happened. Have been advised in general about the possible changes and why- for the future. Just cope with them as they happen.
-
227
Subordinate organisational restructure In U T Pt N V Pl Ap S Have been prepared well. Advised me of the big picture earlier. Have been prepared average. Could not have been improved -
+
Reasonably well- a fair bit of communication. Greater work unit leadership and communication. As well as can be expected - it is constantly changing
+
More involvement and communication from middle / regional management. Talk to the people that use the program on a day to day basis to do their job and ask them what they want before going ahead and implementing a system
- -
Unprepared. Just awaiting to see how it goes. As long as we can recruit in an environment that is supportive. I will be just fine.
- -
Not a great deal of preparation required. In all the preparation has been adequate.
+
I have not been informed of the structural change though it may be because I work part-time and have had time off for my university exams
-
It's difficult to comment as I have only been with the organisation for 1 month. However we have had several seminars and discussions about the takeover and how it will affect HR company.
+
Provide more information of how each business unit fits within the organization. Have more information on the changes occurring.
-
228
Subordinate organisational restructure In U T Pt N V Pl Ap S Change was not prepared well as there was a lot of uncertainty as to whether change would occur or not before the purchase of our division and then on the day of the purchase major changes were enacted.
- -
as well as needed. keep me informed of the big picture and required changes. progress of others fine
+
Increased communication - Not very well overall. I would say the communication from senior management to consultant level has been very poor in terms of other teams - how the existing organisation is going to look as a whole organisation in the future and in terms of payroll of us and our temporary workers. They seem to have forgotten that we have all worked closely together for a long time and everyone here is our friend. When we see our friends upset by lack of communication as to their future with the company or inadequate information is upsets us. The must communicate proposed changes to every aspect of the company BEFORE they occur. We should be given the chance to give our input then too.
- -
229
Subordinate organisational restructure In U T Pt N V Pl Ap S As our team is not local in Sydney we are left out of the loop on a lot of occasions. ACT can be so far away and yet so close. Lack of communication and preparation from the higher managers of the Sydney team have left us juggling many tasks with the takeovers and changes being implemented. If it wasn’t for our fantastic branch manager here I think this team would have fallen apart. We need more training sessions for the new arrivals who have been thrown from one way of doing things into our midst of QA procedures and structural differences. Debriefing from Head Office for the teams in place and the team joining and then the two teams together. More follow through on how this is impacting on the individual and how that reflects on the team as a whole I feel a lot more communication and support would help a great deal in implementing procedures and changes.
- -
Fairly well -however some things have been falling the cracks between the theory of setting it up to the practical application in the workplace more communication on the nuts and bolts as opposed to the generalizations.
-
Not sure about details of change, but don't know how it could be improved training
-
The organisation is very organised in informing staff about structural change. Regular staffing updates on organisation progress would be good.
+
230
Subordinate organisational restructure In U T Pt N V Pl Ap S The organisation I worked for is the newest acquisition into the group. There was no way of preparing us for the takeover given the confidentiality – once the announcement was made. The changes were immediately imposed upon us. My new role was decided for me - but in line with my skills and experience. There was no opportunity for advance warning having said that the company has tried hard to assist me in adapting to my new role.
- -
Preparation - minor. Improvement - communication should be pro-active rather than reactive. Clear goals and the direction to take to achieve these goals should be formulated and communicated.
-
Use the experiences of operational personnel to a much greater degree when developing strategies.
-
In regards to structural change itself. I have difficulty to imagine a way to prepare employees better than to keep them informed about what is happening when it is happening and whom it will affect. Often some feel that they don't really know what their responsibilities are or whether the scope of their position has changed.
-
Must have a flexible approach. - be educated about the big picture and what the strategists of the company are trying to achieve
+
231
Subordinate organisational restructure In U T Pt N V Pl Ap S My unit has been disbanded and I am to transition to HR Company but after 8 weeks this has not happened. I have no manager giving me direction (as he was retrenched) and I am not yet on the HR Company WA payroll. I am still on a Sydney corporate payroll. I am based in Perth and work from the HR company WA office. Previously I work in a National role. My work in assessment centres is now restricted to Perth yet there is no one selling our specialist program in Perth. The type of assessment conducted in Perth tends to be Psych assessment. Until the HR company business transitions in Perth it is hard for anyone to determine my role. So - I am in limbo. In fairness it is no one's fault - it is just a waiting game. I no longer belong to the People 2 People team so must wait for a decision on my future which will occur once HR X WA integrates with HR Company in WA.
-
Reasonably well. All staff knew of the many changes occurring well before they happened. The organisation could have had a few more general meetings to inform of imminent changes. but overall it was handled as well as could be expected.
+
232
Subordinate organisational restructure In U T Pt N V Pl Ap S There are a lot of new employees within HR company business who are still learning what the company is all about. Lots of communication about where the company is going; the company's goals and more knowledge of the different brands under the HR company business banner including what each one specialises in can only be beneficial to staff and the future of the HR company business. I am also a new employee so this question doesn't really relate to me.
-
Supervisor organisational restructure In U T Pt N V Pl Ap S From a management point of view - I believe I was as well prepared as possible and have been kept updated regularly.
+
Limited communication has been the hallmark of the introduction of the change - decisions made "behind closed doors" in a non-inclusive sense.
-
Information on changes have not been passed down the system very well. Know about changes when something needs to changed to work. Could have been given more information on the what
-
Not very well. Minimal consultation and little feed in. Communication of corporate strategy. Look for the quality solution not the quick fox and then give everyone the information and time required to obtain "buy in".
-
233
Supervisor organisational restructure In U T Pt N V Pl Ap S Information has been received regularly from CEO via email.
+
We are prepared but need a greater level of communication. Not seminars. Actual 1 on 1 meetings to discuss individual affects.
-
Information on changes have not been passed down the system very well. Know about changes when something needs to change to work.
+
I've come in half way through the changes informing me before I started that they are in the middle of major changes that are not running all that smoothly.
Change has been communicated very well. + Part of divisional preparation and strategy day. Excellent opportunity to understand goals and objectives and be part of long term preparation. Involved in decision making re performance reviews/redundancies/structural change and subsequent implementation within work unit. I require further training skills in these areas as I find this aspect extremely stressful and not planned well enough. Workload precludes allowing much time for consultation with subordinates re their needs. Aspirations etc.. All ad hoc and reactionary.
+ - +
Involved in big picture presentations but not a lot of discussion at the micro level for my business unit. I would like to have been more involved in general management preparation.
+ -
Being in NZ we are yet to see the full implication of change;
-
234
Supervisor organisational restructure In U T Pt N V Pl Ap S Because the WA section of X is under a separate partnership agreement we have had virtually no physical preparation for the changes – but they have attempted to keep us up to date with e-mails and verbally.
-
Believe we have been extremely well prepared. Strongly support regional training road shows to minimise time taken to train and take-up of skills
+ +
Well prepared and informed. + I have not seen any plans for structural change but am aware that they are going to occur. I am happy with the management implementing change that will benefit the business.
-
Don't yet know that much about the structural change apart from addition of new companies. -so don't feel very prepared as far as info given goes however do feel prepared in that accept and welcome change and reorganization so don't feel change will an adverse affect on me personally even though may have to change work practices etc
- +
In = information; U = uncertainty; T = training; Pt = participation; N= need for change; V= personal valence; Pl= preparation;
Ap = appropriateness; S= principal support
235
Comments that do not completely match with the sense making categories;
• ‘My unit has been disbanded and I am to transition to HR Company but after 8 weeks this has not happened. I have no manager giving me direction (as he was retrenched) and I am not yet on the HR Company WA payroll. I am still on a Sydney corporate payroll. I am based in Perth and work from the HR company WA office. Previously I work in a National role. My work in assessment centres is now restricted to Perth yet there is no one selling our specialist program in Perth. The type of assessment conducted in Perth tends to be Psych assessment. Until the HR company business transitions in Perth it is hard for anyone to determine my role. So - I am in limbo. In fairness it is no one's fault - it is just a waiting game. I no longer belong to the People 2 People team so must wait for a decision on my future which will occur once HR X WA integrates with HR Company in WA’.
• ‘Information was considered negative, and two new areas were mentioned relating to work role confusion and team membership’. • ‘Part of divisional preparation and strategy day. Excellent opportunity to understand goals and objectives and be part of long term
preparation. Involved in decision making re performance reviews/redundancies/structural change and subsequent implementation within work unit. I require further training skills in these areas as I find this aspect extremely stressful and not planned well enough. Workload precludes allowing much time for consultation with subordinates re their needs. Aspirations etc. All ad hoc and reactionary’.
• ‘Information & participation were considered positive, but training negatively. In addition supervisory responsibility was affected by the workload’.
236
Appendix H: Thematic Analysis of IT change comments
Subordinate IT change In U T Pt N V Pl Ap S Not prepared at all for the IT change don’t even know what exactly that change is.
- -
Don't use IT software in my job even though I was given training in it.
+
The preparation was fine. + I don't think this impacts me greatly Well prepared for the IT change. Do not believe that I could have been better prepared.
+ +
Well prepared with training and frequent emails regarding system updates. I've had some opportunity for input into the development of the online testing system which I'm appreciative of.
+ + +
That too has been fine we have had some briefings during our sales meetings for other staff members and IT in Sydney.
+
I have not prepared anything as there has not been a great deal of change in the office. Once things are definite with changes of IT I will prepare myself for it then.
-
By providing flow charts of how the organisations will be interrelated. Examples and print outs of what the data base looks like. Quality procedures etc.
-
Not at all. Just go with what changes are implemented and hope adequate training is provided
-
237
Subordinate IT change In U T Pt N V Pl Ap S I have been told a little. It does not really apply to me as for me it is no more of a change than before.
-
Training and support for IT systems has been OK except that it is just not a good system for either assignment of client management. Someone who actually uses the system on a day-to-day basis as part of his or her job should have been road testing it. Similarly there have been decisions made on what other resources we can have or not have with no notice nor surveying of the people
+ -
I have been a little left behind with the IT changes due to missing an initial training session and at the moment I rely on others to "bale me out" when IT issues occur. I also have very little exposure to the IT system to the point where I am not sure exactly what it is.
-
More info would be handy. -
238
Subordinate IT change In U T Pt N V Pl Ap S I feel reasonably confident in management that we will be prepared I am a total buyer of new technology. As an experienced user I would like to have seen some sort of steering committee that at the least would have given me confidence that the new system will suit my needs. At the moment it feels as though management wants the system and the business must use it. At this stage with very little communication I have no confidence that we will be using a state of the art system that will aid my work. In context I have been very disappointed with the system we have historically used and the ability of the IT team to be in any way innovative or helpful with the users
- - +
I know very little of any proposed IT changes other than the fact we will be getting a new database.
-
IT/IS have issued much email concerning their restructure on the whole we just carry on doing our jobs until they move the cheese again. A: Not at all. B: By keeping the rank and file better informed.
-
We know its happening and we know that we will have full training and support for quite some time...until the changes happen its difficult to assess
+
Very good with continually emails advising staff of the changes
+
239
Subordinate IT change In U T Pt N V Pl Ap S The IT change was handled quite well with comprehensive hands-on training provided to all staff who would be affected by the changes. Staff were also asked for input on the function of the system BEFORE going live which was good.
+ +
Not just macro by giving us adequate computers to cope with the change and by giving us detailed and relevant info about the change
+ +
I am unsure exactly of what is involved in IT changes as far as I know they will not directly affect my team - we do not use IT software, but rather recruit manager is our database.
-
What IT change??? - I received training I was well prepared + Training is minimal. - but IT needs to be more proactive in developing and acquiring adequate Resources
Not prepared. Tell us what areas in the systems now we can focus on as to ensure all info goes into the new system
-
I received one day of training for the IT changes. The organisation could offer further tailored training for staff experiencing difficulty in specific areas.
-
Everyone in the organisation will be attending training seminars over the next month to prepare us for the changes although until this point we have not been told a great deal about the system and how it will affect us on a day-to-day basis.
- +
240
Subordinate IT change In U T Pt N V Pl Ap S Training is being provided on the IT changes and this has been handled well
+
IT side seems fine. A new system was needed anyway. It will be easier to answer this when we have actually seen what the new system is like and how it will be better for us. No real dramas here though.
+
I am very adaptable to change as long as good training is provided. efficacy
+
This has been more than satisfactory with workshops information updates and training available.
+ +
IT change is not relevant to myself – as it was already in place when I joined five months ago
Ensure training is to consistent level when upgrading to new technologies
-
I have been prepared for the proposed IT changes as such. What we need more than anything is a clear decision to be made (and then communicated) about the future of some of the systems. The biggest problem has been indecision earlier in the year. We were told that Axiom was on its way out so people stopped adding detail to it sticking with the bare minimum. But now its back and we have a poor database.
-
241
Subordinate IT change In U T Pt N V Pl Ap S Prepared as best I could but there has been little support and training on new systems etc. Here it is deal with it! Training is always an afterthought. Little is asked of the people who use the system the most. It would receive greater support if system requirements were addressed prior to implementation with ground floor users. The question “why?’ always seems to be asked.
- - -
I have read very little about the IT changes as largely they do not effect me as I am not a user of the software. I have had my laptop reconfigured for the HR company group but am not yet on their server.
-
Reasonable amounts of training & consideration were given to people's concerns. There would not be much they could do to improve.
+
242
Supervisor IT change In U T Pt N V Pl Ap S The IT changeover whilst it hasn't happened in my department yet - I have had regular call from those people managing the change. Once again from a management perspective - maybe fortnightly teleconference would have been beneficial to discuss issues. Problems and have updates This has been well managed so far - my department will not have the IT system online until end of January now but we have been kept up to date by the guys doing the changeover constantly. They are open to our requirements and happy to listen to any feedback and accommodate it where possible.
+ +
Very well communicated - plenty of information and updates on the how why when and where
+
Preparation was good. Feed in trials and training. Further training once system was implemented. Their was resentment at people needing help once the system was live because they had had training but the training was not adequate to cope and there was a gap between the training and implementation
+
IT now update us regularly. We will probably be trained and go with the flow.
+ +
We are prepared but it does seem like we are changing quickly and are then likely to change again. My view is that we can wait and make the change comprehensively all at once
+
Quite well they have told us of intended changes. + IT now IS have been communicating their changes to us also.
+
243
Supervisor IT change In U T Pt N V Pl Ap S So many changes in IT and technology that staff are so over whelmed that the majority are not fully participating any longer. They have therefore found it difficult to use all the new IT changes effectively. Each office requires a dedicated IT tech support person available for training upgrades troubleshooting etc. Too much change with no on-site training support. Has caused great deal of stress and frustration. New equipment/software arrives and no one to drive its implementation. This is the area that requires the greatest attention in our region.
- -
My unit has been involved in IT introduction from the start.
+
Not at all in NZ. - We have had no information at all about the IT changes and virtually none about the organisation changes. As mentioned we have had no preparation for the IT changes. I think that the majority of people in this company believe IT changes are essential as the system we use is well out of date and I expect them to embrace it.
- +
Not particularly applicable to me but well communicated including valid reasons.
+
I am again not sure of IT changes but agree with any new implementation or procedures or systems that will benefit the company and make our jobs easier on the administration side.
+ +
In = information; U = uncertainty; T = training; Pt = participation; N= need for change; V= personal valence; Pl= preparation; Ap = appropriateness; S= principal support
244
Endnote
Adams, G. R., and Schvaneveldt, J. D. (1991). Understanding research methods - Second edition. New York & London: Longman.
Appelbaum, S. H., Gandall, J., Yortis, H., Proper, S., and Jobin, F. (2000). Anatomy of a merger: Behavior of organizational factors and processes throughout the pre-during-post-stages (part 1). Management Decision, 38(9), 649-669.
Armenakis, A. A. (1999b). Organizational change: A review of theory and research in the 1990s. Journal of Management, 25(3), 293-315.
Armenakis, A. A., Harris, S., and Feild, H. (2001). Paradigms in organizational change: Change agent and change target perspectives. In R. Golembiewski (Ed.), Handbook of Organizational Behavior. New York: Marcel Dekker.
Armenakis, A. A., Harris, S. G., and Feild, H. S. (1999a). Making change permanent - A model for institutionalizing change interventions. In Research in Organizational Change and Development (Vol. 12, pp. 97-128).
Armenakis, A. A., Harris, S. G., and Mossholder, K. W. (1993). Creating readiness for organizational change. Human Relations, 46(6), 681-703.
Armenakis, A. A., Mossholder, K. W., and Harris, S. (1990). Diagnostic bias in organizational consultation. The International Journal of Management Science, 18(6), 161-179.
Armenakis, A. A., and Stanley, G. H. (2002). Crafting a change message to create transformational readiness. Journal of Organizational Change Management., 15(2), 169-183.
Ashford, S. J. (1988). Individual strategies for coping with stress during organizational transitions. The Journal of Applied Behavioral Science, 24(1), 19-36.
Ashforth, B. E., and Lee, R. T. (1990). Defensive behavior in organizations: A preliminary model. Human Relations, 43, 621-648.
Ashton, C. (1992). The dawn of a new era. Total Quality Management, 4(4), 215-219.
245
Balogun, J. (2003). From blaming the middle to harnessing its potential: Creating change intermediaries. British Journal of Management, 14(1), 69-83.
Bandura, A. (1982). Self-efficacy mechanism in human agency. American Psychologist, 37(2), 122-147.
Bandura, A. (1997). Self-efficacy: The exercise of control. New York: Freeman.
Beer, M. R., Eisenstat, R. A., and Spector, B. (1990a). The critical path to corporate renewal. Boston, MA: Harvard Business School Press.
Beer, M. R., Eisenstat, R. A., and Spector, B. (1990b). Why change programs don't produce change. Harvard University Business Review(November/December), 158-166.
Bernerth, J. (2004). Expanding our understanding of the change message. Human Resource Development Review, 3(1), 36-52.
Bordia, P., Hobman, E., Jones, E., Gallois, C., and Callan, V. J. (2004). Uncertainty during organizational change: Types, consequences, and management strategies. Journal of Business and Psychology, 18(4), 507-532.
Bourantas, D., and Nicandrou, I. I. (1998). Modelling post-acquisition employee behavior: Typology and determining factors. Employee Relations, 20(1), 73-91.
Bovey, W. H., and Hede, A. (2001). Resistance to organisational change: The role of defence mechanisms. Journal of Managerial Psychology, 16(7), 534-548.
Bowers, D. G., and Seashore, S. E. (1966). Predicting organisational effectiveness with a four-factor theory of leadership. Administrative Science Quarterly, 11(2), 238-263.
Brewer, J., and Hunter, A. (1989). Multimethod research: A synthesis of styles. Newbury Park CA: Sage.
Bryant, M. (2006). Talking about change - Understanding employee responses through qualitative research. Management Decision, 44(2), 246-258.
Burke, W. W., and Trahant, W. (2000). Business climate shifts. Boston MA: Price Waterhouse Coopers.
Burns, J. M. (1978). Leadership. New York, NY: Harper Torchbooks.
246
Burrell, G., and Morgan, G. (1979). Social paradigms and organizational analysis. London: Heinemann.
Calder, B., Phillips, L., and Tybout, A. (1981). Designing research for application. Journal of Customer Research, 8(2), 197-207.
Calhoun, M., Staley, M. A., Hughes, L., and McLean, M. (1989). The relationship of age, level of formal education, and duration of employment towards attitudes concerning the use of computers in the workplace. Journal of Medical Systems, 13(1), 1-9.
Chiu, W. C. K., Chan, A. W., Snape, E., and Redman, T. (2001). Age stereotypes and discriminatory attitudes towards older workers: an East-West comparison. Human Relations, 54(5), 629-661.
Chrusciel, D., and Field, D. W. (2006). Success factors in dealing with significant change in an organization. Business Process Management Journal, 12(4), 503-516.
Clark, L. A., and Watson, D. (1995). Constructing validity: Basic issues in objective scale development. Psychological Assessment, 7(3), 309-319.
Coch, L., and French, J. (1948). Overcoming resistance to change. Human Relations, 1(4), 512-532.
Cohen, J., and Cohen, P. (1983). Applied multiple regression and correlation analysis for the behavioral sciences. Hillsdale, NJ: Erlbaum.
Cole, M. S., Harris, S. G., and Bernerth, J. B. (2005). Exploring the implications of vision, appropriateness, and execution of organizational change. Leadership and Organization Development Journal, 27(5), 352-367.
Conner, D. R. (1992). Managing at the speed of change: How resilient managers succeed and prosper where others fail. New York: Villard Books.
Covin, T. J., and Kilmann, R. H. (1990). Participant perceptions of positive and negative influences on large-scale change. Group and Organizational Studies, 15, 233-248.
Coyle-Shapiro, J. A. M. (1999). Employee participation and assessment of an organizational change. The Journal of Applied Behavioral Science, 35(4), 439-456.
Crawford, K., Thomas, E., and Fink, J. (1980). Pygmalion at sea: Improving work effectiveness of low performers. Journal of Applied Behavioral Science, 16(4), 482-505.
247
Creswell, J. W. (1994). Research design: Qualitative and quantitative approaches. London: Sage.
Cummings, T. G., and Huse, E. F. (1989). Organizational development and change. St Paul, MN: West.
Cummins, R. A., and Gullone, E. (2000). Why we should not use 5-point Likert scales: The case for subjective quality of life measurement. Paper presented at the Second International Conference on Quality of Life in Cities, National University of Singapore.
Daley, D. M. (1988). Profile of the uninvolved worker: An examination of employee attitude towards management practices. International Journal of Public Administration, 11(1), 65-90.
Dato, V. A., Potter, M. A., and Fertman, C. I. (2001). Training readiness of public health agencies: A framework for management assessment Journal of Public Health Practice, 7(4), 91-95.
Datta, L. (1994). Paradigm wars: A basis for peaceful coexistence and beyond. In C. S. Reichardt & S. F. Rallis (Eds.), The Qualitative-quantitative debate: New perspectives (pp. 53-70). San Francisco: Jossey-Bass.
Decker, D., Wheeler, G. E., Johnson, J., and Parsons, R. J. (2001). Effect of organizational change in the individual employee. Health Care Manager, 19(4), 1-12.
Dent, E. B., and Goldberg, S. G. (1999). Challenging "resistance to change". Journal of Applied Behavioral Science, 35(1), 25-41.
Dent, E. B., and Goldberg, S. G. (1999a). "Resistance to change": A limiting perspective. The Journal of Applied Behavioral Science, 35(1), 45-50.
Denzin, N., and Lincoln, Y. (2000). Handbook of qualitative research. Thousand Oaks, CA: Sage.
Diefenbach, M. A., Weinstein, N. D., and O'Reilly, J. (1993). Scales for assessing perceptions of health hazard susceptibility. Health Education Research, 8, 181-192.
Dunham, R. B., Grube, J. A., Gardner, D. G., and Cummings, L. L. (1989). The development of an attitude towards change instrument. Paper presented at the Academy of Management Annual Meeting, Washington DC.
248
Dunphy, D. C., and Stace, D. A. (1988). Transformational and coercive strategies for planned organizational change: Beyond the O.D. model. Organization Studies, 9(3), 317-334.
Easterby-Smith, M., Thorpe, R., and Lowe, A. (1991). Management research: An introduction. London: Sage.
Eby, L. T., Adams, D. M., Russell, J. E. A., and Gaby, S. H. (2000). Perceptions of organizational readiness for change: Factor related to employee's reactions to the implementation of team-based selling. Human Relations, 53(3), 419-442.
Eisenberg, E. M., and Whitten, M. G. (1987). Reconsider openness in organizational communication. Academy of Management Review, 12(3), 418-426.
Eisenberger, R., Huntington, R., Hutchison, S., and Sowa, D. (1986). Perceived organizational support. Journal of Applied Psychology, 71(5), 500-507.
Emmert, P. (1989). Attitude measurement. In P. Emmert & L. L. Barker (Eds.), Measurement of communication behavior (pp. 134-153). New York & London: Longman.
Evanski, G. A. (1996). Teachers' attitudes toward organizational changes: The development of an assessment survey. Unpublished Doctor of Education Thesis, Wayne State University, Detroit.
Fenton-O'Creevy, M. (1998). Employee involvement and the middle manager: Evidence from a survey of organizations. Journal of Organizational Behavior, 19, 67-84.
Fiol, C. M., and Lyles, M. A. (1985). Organizational learning. Academy of Management Review, 10(4), 803-813.
Fiorelli, J. S., and Margolis, H. (1993). Managing and understanding large system change: Guidelines for executives and change agents. Organization Development Journal, 11(3), 1-13.
Floyd, S. W., and Wooldridge, B. (1997). Middle management's strategic influence and organizational performance. Journal of Management Studies, 34(3), 465-485.
Galpin, T. (1996). The human side of change: A practical guide to organization redesign. San Francisco: Jossey-Bass.
Gaughan, P. (1996). Mergers, acquisitions, and corporate restructurings New York: John Wiley & Sons.
249
Gleeson, J., McPhee, J., and Spatz, L. (1988). Training needs of supervisors and middle managers. Work and People, 13(3), 32-36.
Greenwood, R., and Hinings, C. R. (1996). Understanding radical organizational change: Bringing together the old and new institutionalism. Academy of Management Review, 21(4), 1022-1054.
Guba, E. G., and Lincoln, Y. S. (1994). Competing paradigm in qualitative research. In N. K. Denzin & Y. S. Lincoln (Eds.), Handbook of qualitative research (pp. 105-117). Thousand Oaks, CA: Sage.
Hanpachern, C., Morgan, G. A., and Griego, O. V. (1998). An extension of the theory of margin: A framework for assessing readiness for change. Human Resource Development Quarterly, 9(4), 339-350.
Hitt, M. A., Gimeno, J., and Hosskisson, R. E. (1998). Current and future research methods in strategic management. Organizational Research Methods, 1, 6-44.
Hogarty, D. B. (1996). The young and the restless. Working Women, 21(8), 27-28.
Holt, D. T. (2000). The measurement of readiness for change: A review of instruments and suggestions for future research. Paper presented at the Annual meeting of the Academy of Management, Toronto, Canada.
Holt, D. T. (2002). Readiness for change: The development of a scale. Paper presented at the Annual meeting of the Academy of Management, Denver, Colorado.
Holt, D. T., Armenakis, A. A., Feild, H. S., and Harris, S. G. (2007). Readiness for organizational change: The systematic development of a scale. Journal of Applied Behavioral Science, 43(2), 232-255.
Holt, D. T., Self, D. R., Thal, A. E., and Lo, S. W. (2003). Facilitating organizational change: a test of leadership strategies. Leadership and Organization Development Journal, 24(5), 262 - 272.
Isabella, L. (1990). Evolving interpretations as a change unfolds: How managers construe key organizational events. Academy of Management Journal, 33(1), 7-41.
Isabella, L. (1992). Managing the challenges of trigger events: The mindsets governing adaptation to change. Business Horizons, 35(5), 59-66.
250
Jones, J. E., and Bearley, W. L. (1986). Organizational change readiness survey. King of Prussia, PA: Organization Design and Development Inc.
Judge, W. Q., and Zeithami, C. P. (1992). Institutional and strategic choice perspectives on board involvement in the strategic decision process. Academy of Management Journal, 35, 766-794.
Judson, A. (1991). Changing behavior in organizations: Minimizing resistance to change. Cambridge, MA: Basil Blackwell.
Kanter, R. M. (1982). Dilemmas in managing participation. Organisational Dynamics, 11(1), 5-27.
Karami, A., Rowley, J., and Analoui, F. (2006). Research and knowledge building in management studies: An analysis of methodological preferences. International Journal of Management, 23(1), 43-52.
Karlsson, C., and Ahlstrom, P. (1995). Change processes towards lean production: The role of the remuneration system. International Journal of Operations and Production Management, 15(11), 80-99.
Kim, S. W. (1996). Employee intent to stay: The case of automobile workers in South Korea. Unpublished PhD Thesis, University of Iowa, Iowa City, IA.
Kotter, J. (1995). Leading change: Why transformation efforts fail. Harvard Business Review, 73(2), 59-67.
Kotter, J. P., and Schlesinger, L. A. (1979). Choosing strategies for change. Harvard Business Review, 57(2), 106-114.
Lawrence, P., and Lorsch, J. (1967). Organization and environment: Managing differentiation and integration. Homewood, IL: Irwin.
Leedy, P. D. (1997). Practical research: Planning and design (Sixth ed.). Upper Saddle River, NJ: Prentice Hall.
Lehman, W. E., Greener, J. M., and Simpson, D. D. (2002). Assessing organizational readiness for change. Journal of Substance Abuse Treatment, 22(4), 197-209.
Levy, A. (1986). Second-order planned change: Definition and conceptualization. Organizational Dynamics, 15(1), 5-20.
251
Lewin, K. (1951). Field theory in social science. New York: Harper & Row.
Lewin, K. (1958). Group decisions and social change. New York: Holt, Rinehart, and Winston.
Likert, R. (1932). A technique for the measurement of attitudes. Archives of Psychology, 140, 1-55.
Lincoln, Y. S., and Guba, E. G. (1985). Naturalistic inquiry. Beverley Hills, CA: Sage.
Lloyd, B., and Griffin, G. (2000). Leadership and power. Leadership and Organization Development Journal, 21(5), 1.
Madsen, S., R., Miller, D., and John, C., R. (2005). Readiness for organizational change: Do organizational commitment and social relationships in the workplace make a difference? Human Resource Development Quarterly, 16(2), 213-233.
Mamman, A. (1996). A diverse employee in a changing workplace. Organization Studies, 17(3), 449-477.
Marks, M. L., and Mirvis, P. H. (2000). Managing mergers, acquisitions, and alliances: Creating an effective transition structure. Organizational Dynamics, 28(3), 35-47.
Matz, C. M. (1999). Administration of web versus paper surveys: Mode effects and response rate. Unpublished Masters Research Paper, University of North Carolina, Chapel Hill.
Mauer, R. (1996). Beyond the wall of resistance. Marietta, GA: Brad Press.
Mauyama, M. (1973). A new logical model for futures research. Futures, 5, 435-437.
McCalla, R. A. (2002). Getting results from online surveys - Reflections on a personal journey. Electronic Journal of Business Research Methods, 1(1), 55-62.
McEvoy, G. M., and Cascio, W. F. (1989). Cumulative evidence of the relationship between employee age and job performance Journal of Applied Psychology, 74(1), 11-17.
McNabb, D. E. (1995). Culture, climate, and total quality management: Measuring readiness for change. Public Productivity and Management Review, 18(4), 369-385.
Meier, A., Boivin, M., and Meier, M. (2006). The treatment of depression: a case study using theme-analysis. Counselling & Psychotherapy Research, 6(2).
252
Meier, A., and Boivin, M. A. (2000). The achievement of greater selfhood: The application of theme-analysis to a case study. Psychotherapy Research, 10(1), 57-77.
Menard, S. W. (2002). Longitudinal research. Thousand Oaks, CA: Sage.
Monge, P. R. (1995). Theoretical and analytical issues in studying organizational processes. In G. P. Huber & A. H. V. d. Ven (Eds.), Longitudinal field research methods: Studying processes of organizational change (pp. 267-298). Thousand Oaks, CA: Sage.
Morse, J. M. (1991). Approaches to qualitative-quantitative methodological triangulation. Nursing Research, 40(1), 120-123.
Mossholder, K. W., Settoon, R. P., Armenakis, A. A., and Harris, S. G. (2000). Emotion during organizational transformations: An interactive model of survivor reactions. Group and Organization Management, 25(3), 220-243.
Nadler, D. A. (1981). Managing organizational change: An integrative perspective. Journal of Applied Behavioral Science, 17(2), 191-211.
Nadler, D. A., and Tushman, M. L. (1989). Organizational frame bending: Principles for managing reorganization. Academy of of Management Executive Magazine, 3(3), 194-204.
Nutt, P. C. (1986). Tactics of implementation. Academy of Management Journal, 29(2), 230-261.
Olian, J., and Rynes, S. (1991). Making total quality work: Aligning organizational processes, performance measures, and stakeholders. Human Resource Management, 30(3), 303-333.
Palich, L. E., and Hom, P. W. (1992). The impact of leader power and behavior on leadership perceptions. Group and Organization Management, 17(3), 279-296.
Parks, J. M., Kidder, D. L., and Gallagher, D. G. (1998). Fitting square pegs into round holes: Mapping the domain of contingent work arrangements onto the psychological contract. Journal of Organizational Behavior, 19, 697-730.
Pettigrew, A. (1987). Context and action in transforming the firm. Journal of Management Studies, 24(6), 649-670.
253
Pettigrew, A. M. (1985). The awakening giant: Continuity change in imperial chemical industries. Oxford, UK: Blackwell.
Pettigrew, A. M. (1995). Longitudinal field research on change: Theory and practice. In G. P. Huber & A. H. V. d. Ven (Eds.), Longitudinal field research methods: Studying processes of organizational change (pp. 91-125). Thousand Oaks, CA: Sage.
Pfeffer, J. (1977). The ambiguity of leadership. Academy of Management Review, 2, 104-112.
Pfeffer, J., and Salancik, G. R. (1978). The external control of organizations: A resource dependent perspective. New York, NY: Harper and Row.
Phillips, A. S., and Bedeian, A. G. (1994). Leader-follower exchange quality: The role of personal and interpersonal. Academy of Management Journal, 37(4), 990-1001.
Piderit, S. K. (2000). Rethinking resistance and recognizing ambivalence: A multidimensional view. Academy of Management. The Academy of Management Review, 25(4), 783-794.
Pofi, J. A. D. (2002). Organizational diagnostics: Integrating qualitative and quantitative methodology. Journal of Organizational Change Management, 15(2), 156-168.
Prochaska, J. M., Prochaska, J. O., and Levesque, D. A. (2001). A transtheoretical approach to changing organizations. Administration and Policy in Mental Health, 28(4), 247-261.
Prochaska, J. O., DiClemente, C. C., and Norcross, J. C. (1992). In search of how people change: Applications to addictive behaviors. American Psychologist, 47(9), 1102-1114.
Pundziene, A. (2004). Managing organisational change: Insight into your employees. Management of Organizations: Systematic Research(29), 163-172.
Rosen, B., and Jerdee, T. H. (1976). The influence of age stereotypes on managerial decisions. Journal of Applied Psychology, 61(4), 428-432.
Rothe, J. P. (1994). Qualitative research; A practical guide. Toronto, Ontario: RCI and PDE Publications.
Rousseau, D. M. (1995). Psychological contracts in organizations: Understanding written and unwritten agreements. London & New York: Sage.
254
Rousseau, D. M., and Tijoriwal, S. A. (1998). Assessing psychological contracts: Issues, alternatives and measures. Journal of Organizational Behavior, 19, 679-695.
Saporito, B. (1986). The revolt against working smarter. Fortune, July, 44-48.
Saskin, M. (1984b). Participative management is an ethical imperative. Organisational Dynamics, 12(4), 5-22.
Saskin, M. (1986). Participative management remains an ethical imperative. Organisational Dynamics, 14(4), 62-75.
Sastry, M. A. (1997). Problems and paradoxes in a model punctuated by organizational change. Administrative Science Quarterly, 42(2), 237-275.
Savolainen, T. I. (1998). Managerial commitment process in organizational change: Findings from a case study. Academy of Strategic and Organizational Leadership Journal, 2(2), 1-12.
Schendel, D. E., and Hatten, K. J. (1972). Business policy or strategic management: A broader view for an emerging discipline. Academy of Management Proceedings, 2(2), 99-102.
Schunk, D. H. (1983). Progress self-monitoring: Effects on children's self-efficacy and achievement. Journal of Experiemental Education, 51, 89-93.
Schweiger, D. M., and DeNisi, A. S. (1991). Communication with employees following a merger: A longitudinal field experiment. Academy of Management Journal, 34, 110-135.
Schwoerer, C. E., and May, D. R. (1996). Age and work outcomes: The moderating effects of self-efficacy and tool design effectiveness. Journal of Organizational Behavior, 17, 469-487.
Schwoerer, C. E., and Rosen, B. (1992). The influence of self-efficacy, age, and gender on career management strategies. Paper presented at the Annual Meeting of the Academy of Managment, Las Vegas, Nevada.
Silverman, D. (2000). Doing qualitative research: A practical handbook. London, UK: Sage.
Smith, M. E. (2002). Implementing organizational change: Correlates of success and failure. Performance Improvement Quarterly, 15(1), 67-83.
255
Thijssen, J. (1992). A model for adult training in flexible organisations: Towards an experience concentrating theory. Journal of European Industrial Training, 16(9), 5-15.
Trochim, W. M. (2006). Research methods knowledge base. Types of Reliabilities Retrieved 20/10/2006, from www.socialresearchmethods.net/kb/reltypes.php
Tushman, M. L., Newman, W. H., and Romanelli, E. (1986). Convergence and upheaval: Managing the unsteady pace of organizational evolution. California Management Review, 29, 29-44.
Verespej, M. A. (1990). When you put the team in charge. Industry Week, 239, 29-32.
Waldersee, R., and Griffiths, A. (1997). The changing face of organisational change. Unpublished CCC Paper No. 065, Centre for Corporate Change, Australian Graduate School of Management, The University of New South Wales, Sydney.
Waldman, D. A., and Avolio, B. J. (1986). A meta-analysis of age differences in job performance. Journal of Applied Psychology, 71(1), 33-38.
Warr, P. (1994). Age and employment. In H. C. Triandis, M. D. Dunnette & L. M. Hough (Eds.), Handbook of industrial and organizational psychology (Vol. 4). Palo Alto, CA: Consulting Psychologists Press.
Washington, M., and Hacker, M. (2005). Why change fails: Knowledge counts. Leadership and Organization Development Journal, 26(5), 400-411.
Weber, P. S., and Weber, J. E. (2001). Changes in employee perceptions during organizational change. Leadership and Organization Development Journal, 22(6), 291-300.
Worren, N. A. M., Ruddle, K., and Moore, K. (1999). From organizational development to change management. Journal of Applied Behavioral Science, 35(3), 273-287.
Wu, Y., and Newfield, S. A. (2007). Comparing data collected by computerized and written surveys for adolescence health research. Journal of School Health, 77(1), 23-28.
Yukl, G., Falbe, C. M., and Youn, J. Y. (1993). Patterns of influence, behavior for mangers. Group and Organization Management, 18(1), 5-28.