Dynamic effects in the response of offshore wind turbines supported by jackets under wave loading Kai Wei a,b,⇑,1 , Andrew T. Myers a , Sanjay R. Arwade c a Department of Civil and Environmental Engineering, Northeastern University, Boston, MA 02115, USA b Department of Bridge Engineering, Southwest Jiaotong University, Chengdu, Sichuan 610031, China c Department of Civil and Environmental Engineering, University of Massachusetts Amherst, Amherst, MA 01003, USA article info Article history: Received 18 September 2016 Revised 16 March 2017 Accepted 29 March 2017 Available online 5 April 2017 Keywords: Offshore wind turbine Dynamic effects Dynamic amplification Wave loading Jacket abstract This paper studies the effect of structural dynamics on the response of an offshore wind turbine (OWT) supported by a jacket and subjected to wave loads. The study includes a series of time-domain dynamic analyses based on loading from regular and irregular wave histories and three example OWT support structures. The OWT support structures are proportioned to collectively span a broad range of the first fundamental period of an OWT supported by a jacket. For each dynamic analysis, a representative static analysis is also considered, and a dynamic amplification factor (DAF) is calculated and discussed as a function of wave height, wave regularity, and structural period. The results demonstrate that dynamic effects may amplify the structural response significantly for loading caused by smaller waves, but the amplification is minimal for loading caused by large waves, which have longer periods and, for the jacket geometry considered here, cause large wave-in-deck forces. For the specific scenarios and models consid- ered in this paper, the structural period is found to have a small influence on the DAF. Ó 2017 Elsevier Ltd. All rights reserved. 1. Introduction Performance-based design considers the diverse needs and objectives of owners and users of infrastructure by explicitly assessing the performance of structural designs during both expected and extreme loadings, the latter of which are anticipated to damage the structure [1]. Performance-based design relies on the assessment of the vulnerability of structures and on the recur- rence of hazards, resulting in estimations of the probability of damage for the structure during its lifetime [2–7]. Such informa- tion is essential to understanding and mitigating the risk of haz- ards, whether natural or otherwise. In the initial development of performance-based design, structural assessments were first based on nonlinear static analyses (i.e., static pushover analyses [8]) which aimed to ‘equivalently’ represent dynamic loading. Such sta- tic approaches have been used widely to, for example, estimate the structural capacity of buildings under earthquakes [9], offshore platforms under wave loads [10] and offshore wind turbine (OWT) support structures under wind and wave loads [11]. While static pushover analysis provides a reasonable and practical way to assess a comprehensive range of structural behavior by scaling a static force distribution that is representative of expected dynamic loading [8], the implications of this static approximation are not well understood for OWT structures and the intent of this study is to provide insight into the practice of approximating dynamic loading with static loading to see if equivalent static approaches can be used to reasonably assess the performance of OWTs sup- ported by jackets. The preference for static analysis is due, in part, to the compu- tational burden and greater overall complexity of modeling the dynamic response of a structure subject to time-varying loading [12]. The growth of computer processing power, however, has enabled the efficient assessment of structural performance using dynamic, time-domain analysis. In earthquake engineering, which has led the evolution of performance-based design, Vamvatsikos and Cornell started the transition to dynamic analysis with the development of the now widely-used method termed incremental dynamic analysis (IDA) [13]. In wind engineering, the influence of dynamic effects on structural inelastic behavior have been consid- ered by Tabbuso et al. who developed a method based on dynamic inelastic models of building frames subject to stochastic wind with long duration [14] and by Judd and Charney who have studied the inelastic behavior of buildings using an IDA-based approach [15]. http://dx.doi.org/10.1016/j.engstruct.2017.03.074 0141-0296/Ó 2017 Elsevier Ltd. All rights reserved. ⇑ Corresponding author at: 507 Tunnel Research Building, Southwest Jiaotong University, No. 111, North 1st Section of Second Ring Road, Chengdu, Sichuan 610031, China. E-mail address: [email protected](K. Wei). 1 Former post-doctoral research associate at Northeastern University, currently Associate Professor at Southwest Jiaotong University. Engineering Structures 142 (2017) 36–45 Contents lists available at ScienceDirect Engineering Structures journal homepage: www.elsevier.com/locate/engstruct
Transcript
Dynamic effects in the response of offshore wind turbines supported byjackets under wave loading
Kai Wei a,b,⇑,1, Andrew T. Myers a, Sanjay R. Arwade c
aDepartment of Civil and Environmental Engineering, Northeastern University, Boston, MA 02115, USAbDepartment of Bridge Engineering, Southwest Jiaotong University, Chengdu, Sichuan 610031, ChinacDepartment of Civil and Environmental Engineering, University of Massachusetts Amherst, Amherst, MA 01003, USA
a r t i c l e i n f o
Article history:Received 18 September 2016Revised 16 March 2017Accepted 29 March 2017Available online 5 April 2017
This paper studies the effect of structural dynamics on the response of an offshore wind turbine (OWT)supported by a jacket and subjected to wave loads. The study includes a series of time-domain dynamicanalyses based on loading from regular and irregular wave histories and three example OWT supportstructures. The OWT support structures are proportioned to collectively span a broad range of the firstfundamental period of an OWT supported by a jacket. For each dynamic analysis, a representative staticanalysis is also considered, and a dynamic amplification factor (DAF) is calculated and discussed as afunction of wave height, wave regularity, and structural period. The results demonstrate that dynamiceffects may amplify the structural response significantly for loading caused by smaller waves, but theamplification is minimal for loading caused by large waves, which have longer periods and, for the jacketgeometry considered here, cause large wave-in-deck forces. For the specific scenarios and models consid-ered in this paper, the structural period is found to have a small influence on the DAF.
! 2017 Elsevier Ltd. All rights reserved.
1. Introduction
Performance-based design considers the diverse needs andobjectives of owners and users of infrastructure by explicitlyassessing the performance of structural designs during bothexpected and extreme loadings, the latter of which are anticipatedto damage the structure [1]. Performance-based design relies onthe assessment of the vulnerability of structures and on the recur-rence of hazards, resulting in estimations of the probability ofdamage for the structure during its lifetime [2–7]. Such informa-tion is essential to understanding and mitigating the risk of haz-ards, whether natural or otherwise. In the initial development ofperformance-based design, structural assessments were first basedon nonlinear static analyses (i.e., static pushover analyses [8])which aimed to ‘equivalently’ represent dynamic loading. Such sta-tic approaches have been used widely to, for example, estimate thestructural capacity of buildings under earthquakes [9], offshoreplatforms under wave loads [10] and offshore wind turbine
(OWT) support structures under wind and wave loads [11]. Whilestatic pushover analysis provides a reasonable and practical way toassess a comprehensive range of structural behavior by scaling astatic force distribution that is representative of expected dynamicloading [8], the implications of this static approximation are notwell understood for OWT structures and the intent of this studyis to provide insight into the practice of approximating dynamicloading with static loading to see if equivalent static approachescan be used to reasonably assess the performance of OWTs sup-ported by jackets.
The preference for static analysis is due, in part, to the compu-tational burden and greater overall complexity of modeling thedynamic response of a structure subject to time-varying loading[12]. The growth of computer processing power, however, hasenabled the efficient assessment of structural performance usingdynamic, time-domain analysis. In earthquake engineering, whichhas led the evolution of performance-based design, Vamvatsikosand Cornell started the transition to dynamic analysis with thedevelopment of the now widely-used method termed incrementaldynamic analysis (IDA) [13]. In wind engineering, the influence ofdynamic effects on structural inelastic behavior have been consid-ered by Tabbuso et al. who developed a method based on dynamicinelastic models of building frames subject to stochastic wind withlong duration [14] and by Judd and Charney who have studied theinelastic behavior of buildings using an IDA-based approach [15].
http://dx.doi.org/10.1016/j.engstruct.2017.03.0740141-0296/! 2017 Elsevier Ltd. All rights reserved.
⇑ Corresponding author at: 507 Tunnel Research Building, Southwest JiaotongUniversity, No. 111, North 1st Section of Second Ring Road, Chengdu, Sichuan610031, China.
E-mail address: [email protected] (K. Wei).1 Former post-doctoral research associate at Northeastern University, currently
Associate Professor at Southwest Jiaotong University.
In offshore oil/gas engineering, dynamic methods have been estab-lished to estimate the behavior of offshore jacket platforms againstenvironmental wave loading. Golafshani et al. have introduced theidea of Dynamic Incremental Wave Analysis (DIWA), which esti-mates capacities for oil/gas jacket structures through nonlineardynamic analysis [16]. In offshore wind engineering, Taflanidiset al. have developed a surrogate model based on elastic dynamicanalyses of OWTs supported by tripods to predict structuralresponse under extreme wave and wind loads [7].
Although dynamic analysis is becoming more commonplace,static analysis remains popular because of its simplicity. For off-shore structures, the difference between dynamic and static analy-ses in the response of offshore structures is still a subject of activeresearch. For example, Jensen [17] studied the dynamic amplifica-tion factor (DAF) of a jack-up platform subjected to non-Gaussianwave loads and a single degree of freedom structural model. Golaf-shani et al. [16] studied oil/gas jacket platforms under wave loadsand found that, for two different example platforms, the differencebetween the maximum structural base shear of dynamic and staticanalyses was either negligible (less than 0.5%) or approximately14%, with dynamic analysis providing a larger maximum response.Horn et al. [18] investigated the dynamic amplification of dragdominated structures and found that simplified analytical methodswere not accurate for considering dynamic amplification in irregu-lar seas. Kim et al. [19] considered both static pushover anddynamic approaches to assess the response of a 5 MW offshorewind turbine supported by a monopile subjected to seismic load-ing considering nonlinear soil-pile interaction and found pushoveranalysis compared well with dynamic analysis results.
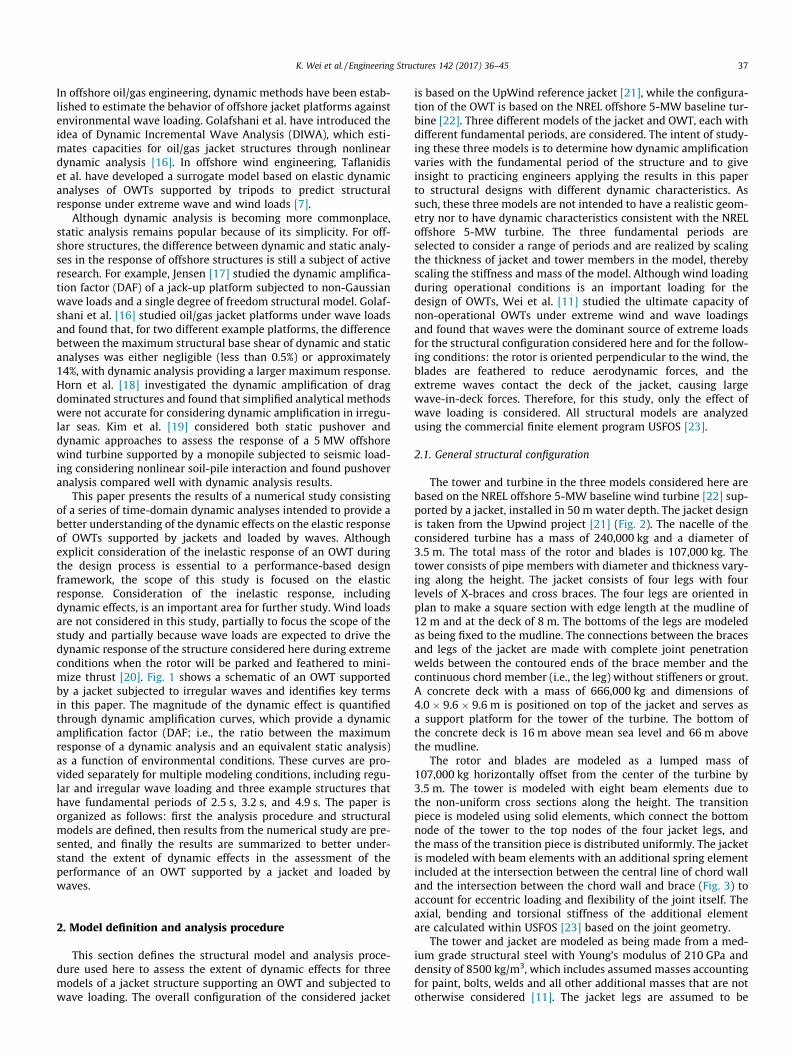
This paper presents the results of a numerical study consistingof a series of time-domain dynamic analyses intended to provide abetter understanding of the dynamic effects on the elastic responseof OWTs supported by jackets and loaded by waves. Althoughexplicit consideration of the inelastic response of an OWT duringthe design process is essential to a performance-based designframework, the scope of this study is focused on the elasticresponse. Consideration of the inelastic response, includingdynamic effects, is an important area for further study. Wind loadsare not considered in this study, partially to focus the scope of thestudy and partially because wave loads are expected to drive thedynamic response of the structure considered here during extremeconditions when the rotor will be parked and feathered to mini-mize thrust [20]. Fig. 1 shows a schematic of an OWT supportedby a jacket subjected to irregular waves and identifies key termsin this paper. The magnitude of the dynamic effect is quantifiedthrough dynamic amplification curves, which provide a dynamicamplification factor (DAF; i.e., the ratio between the maximumresponse of a dynamic analysis and an equivalent static analysis)as a function of environmental conditions. These curves are pro-vided separately for multiple modeling conditions, including regu-lar and irregular wave loading and three example structures thathave fundamental periods of 2.5 s, 3.2 s, and 4.9 s. The paper isorganized as follows: first the analysis procedure and structuralmodels are defined, then results from the numerical study are pre-sented, and finally the results are summarized to better under-stand the extent of dynamic effects in the assessment of theperformance of an OWT supported by a jacket and loaded bywaves.
2. Model definition and analysis procedure
This section defines the structural model and analysis proce-dure used here to assess the extent of dynamic effects for threemodels of a jacket structure supporting an OWT and subjected towave loading. The overall configuration of the considered jacket
is based on the UpWind reference jacket [21], while the configura-tion of the OWT is based on the NREL offshore 5-MW baseline tur-bine [22]. Three different models of the jacket and OWT, each withdifferent fundamental periods, are considered. The intent of study-ing these three models is to determine how dynamic amplificationvaries with the fundamental period of the structure and to giveinsight to practicing engineers applying the results in this paperto structural designs with different dynamic characteristics. Assuch, these three models are not intended to have a realistic geom-etry nor to have dynamic characteristics consistent with the NRELoffshore 5-MW turbine. The three fundamental periods areselected to consider a range of periods and are realized by scalingthe thickness of jacket and tower members in the model, therebyscaling the stiffness and mass of the model. Although wind loadingduring operational conditions is an important loading for thedesign of OWTs, Wei et al. [11] studied the ultimate capacity ofnon-operational OWTs under extreme wind and wave loadingsand found that waves were the dominant source of extreme loadsfor the structural configuration considered here and for the follow-ing conditions: the rotor is oriented perpendicular to the wind, theblades are feathered to reduce aerodynamic forces, and theextreme waves contact the deck of the jacket, causing largewave-in-deck forces. Therefore, for this study, only the effect ofwave loading is considered. All structural models are analyzedusing the commercial finite element program USFOS [23].
2.1. General structural configuration
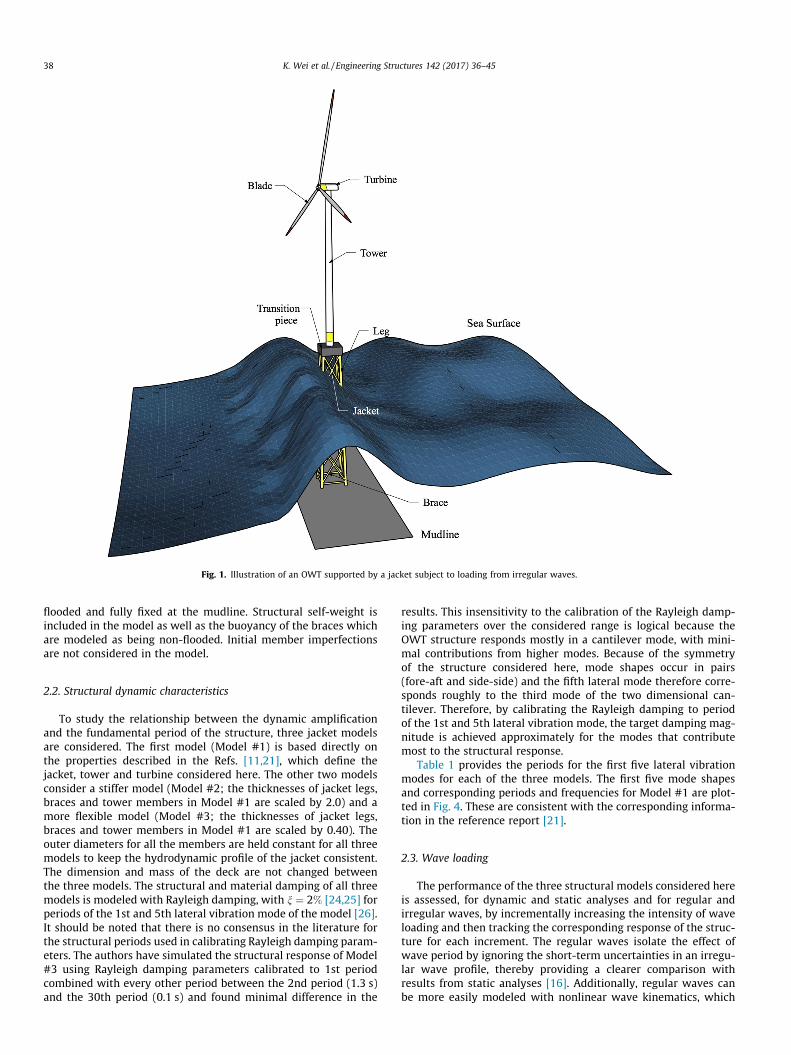
The tower and turbine in the three models considered here arebased on the NREL offshore 5-MW baseline wind turbine [22] sup-ported by a jacket, installed in 50 m water depth. The jacket designis taken from the Upwind project [21] (Fig. 2). The nacelle of theconsidered turbine has a mass of 240,000 kg and a diameter of3.5 m. The total mass of the rotor and blades is 107,000 kg. Thetower consists of pipe members with diameter and thickness vary-ing along the height. The jacket consists of four legs with fourlevels of X-braces and cross braces. The four legs are oriented inplan to make a square section with edge length at the mudline of12 m and at the deck of 8 m. The bottoms of the legs are modeledas being fixed to the mudline. The connections between the bracesand legs of the jacket are made with complete joint penetrationwelds between the contoured ends of the brace member and thecontinuous chord member (i.e., the leg) without stiffeners or grout.A concrete deck with a mass of 666,000 kg and dimensions of4.0 ! 9.6 ! 9.6 m is positioned on top of the jacket and serves asa support platform for the tower of the turbine. The bottom ofthe concrete deck is 16 m above mean sea level and 66 m abovethe mudline.
The rotor and blades are modeled as a lumped mass of107,000 kg horizontally offset from the center of the turbine by3.5 m. The tower is modeled with eight beam elements due tothe non-uniform cross sections along the height. The transitionpiece is modeled using solid elements, which connect the bottomnode of the tower to the top nodes of the four jacket legs, andthe mass of the transition piece is distributed uniformly. The jacketis modeled with beam elements with an additional spring elementincluded at the intersection between the central line of chord walland the intersection between the chord wall and brace (Fig. 3) toaccount for eccentric loading and flexibility of the joint itself. Theaxial, bending and torsional stiffness of the additional elementare calculated within USFOS [23] based on the joint geometry.
The tower and jacket are modeled as being made from a med-ium grade structural steel with Young’s modulus of 210 GPa anddensity of 8500 kg/m3, which includes assumed masses accountingfor paint, bolts, welds and all other additional masses that are nototherwise considered [11]. The jacket legs are assumed to be
K. Wei et al. / Engineering Structures 142 (2017) 36–45 37
flooded and fully fixed at the mudline. Structural self-weight isincluded in the model as well as the buoyancy of the braces whichare modeled as being non-flooded. Initial member imperfectionsare not considered in the model.
2.2. Structural dynamic characteristics
To study the relationship between the dynamic amplificationand the fundamental period of the structure, three jacket modelsare considered. The first model (Model #1) is based directly onthe properties described in the Refs. [11,21], which define thejacket, tower and turbine considered here. The other two modelsconsider a stiffer model (Model #2; the thicknesses of jacket legs,braces and tower members in Model #1 are scaled by 2.0) and amore flexible model (Model #3; the thicknesses of jacket legs,braces and tower members in Model #1 are scaled by 0.40). Theouter diameters for all the members are held constant for all threemodels to keep the hydrodynamic profile of the jacket consistent.The dimension and mass of the deck are not changed betweenthe three models. The structural and material damping of all threemodels is modeled with Rayleigh damping, with n ¼ 2% [24,25] forperiods of the 1st and 5th lateral vibration mode of the model [26].It should be noted that there is no consensus in the literature forthe structural periods used in calibrating Rayleigh damping param-eters. The authors have simulated the structural response of Model#3 using Rayleigh damping parameters calibrated to 1st periodcombined with every other period between the 2nd period (1.3 s)and the 30th period (0.1 s) and found minimal difference in the
results. This insensitivity to the calibration of the Rayleigh damp-ing parameters over the considered range is logical because theOWT structure responds mostly in a cantilever mode, with mini-mal contributions from higher modes. Because of the symmetryof the structure considered here, mode shapes occur in pairs(fore-aft and side-side) and the fifth lateral mode therefore corre-sponds roughly to the third mode of the two dimensional can-tilever. Therefore, by calibrating the Rayleigh damping to periodof the 1st and 5th lateral vibration mode, the target damping mag-nitude is achieved approximately for the modes that contributemost to the structural response.
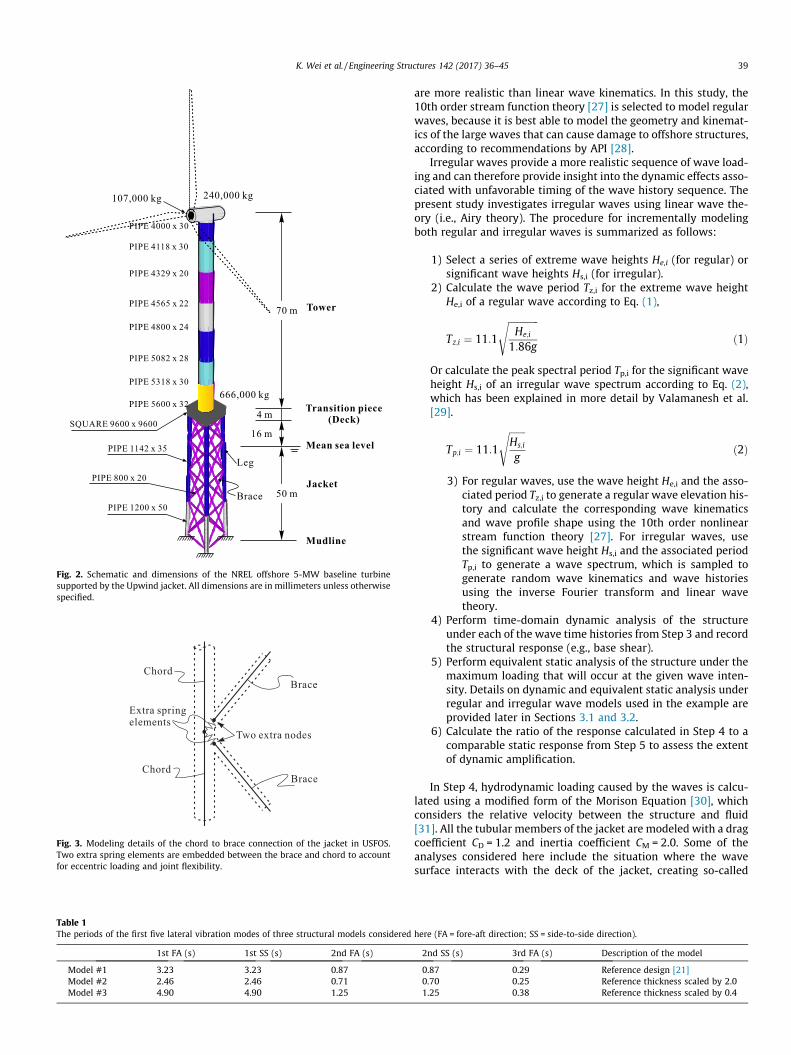
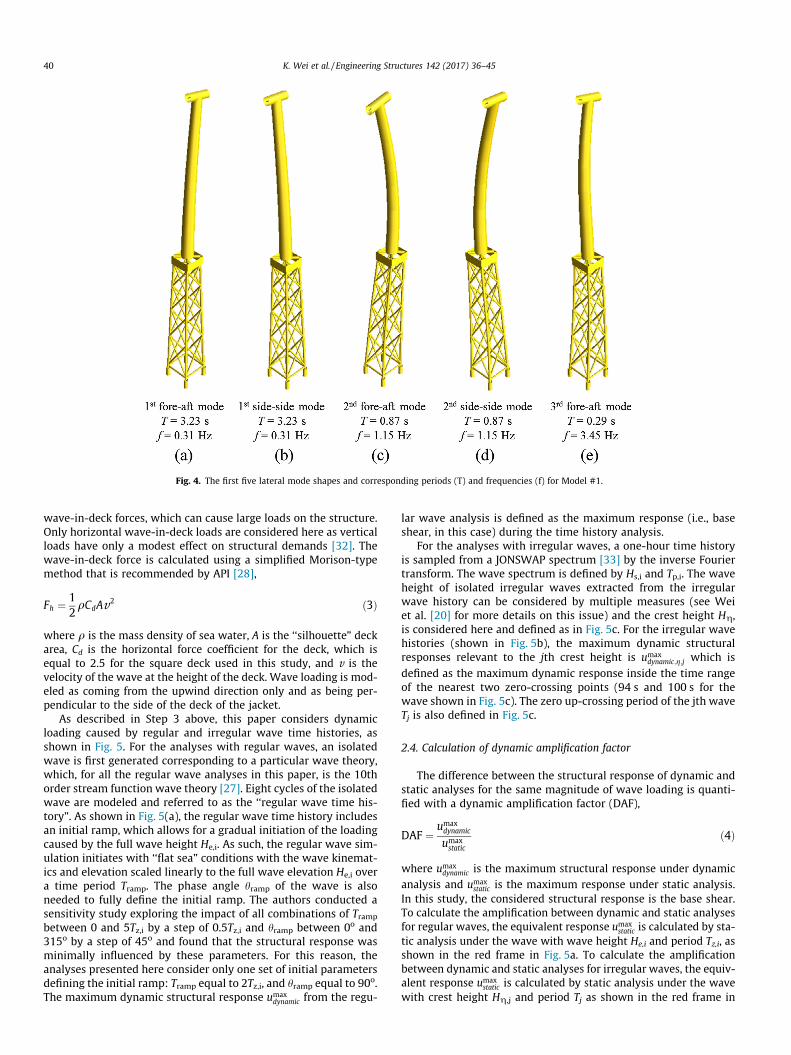
Table 1 provides the periods for the first five lateral vibrationmodes for each of the three models. The first five mode shapesand corresponding periods and frequencies for Model #1 are plot-ted in Fig. 4. These are consistent with the corresponding informa-tion in the reference report [21].
2.3. Wave loading
The performance of the three structural models considered hereis assessed, for dynamic and static analyses and for regular andirregular waves, by incrementally increasing the intensity of waveloading and then tracking the corresponding response of the struc-ture for each increment. The regular waves isolate the effect ofwave period by ignoring the short-term uncertainties in an irregu-lar wave profile, thereby providing a clearer comparison withresults from static analyses [16]. Additionally, regular waves canbe more easily modeled with nonlinear wave kinematics, which
Fig. 1. Illustration of an OWT supported by a jacket subject to loading from irregular waves.
38 K. Wei et al. / Engineering Structures 142 (2017) 36–45
are more realistic than linear wave kinematics. In this study, the10th order stream function theory [27] is selected to model regularwaves, because it is best able to model the geometry and kinemat-ics of the large waves that can cause damage to offshore structures,according to recommendations by API [28].
Irregular waves provide a more realistic sequence of wave load-ing and can therefore provide insight into the dynamic effects asso-ciated with unfavorable timing of the wave history sequence. Thepresent study investigates irregular waves using linear wave the-ory (i.e., Airy theory). The procedure for incrementally modelingboth regular and irregular waves is summarized as follows:
1) Select a series of extreme wave heights He,i (for regular) orsignificant wave heights Hs,i (for irregular).
2) Calculate the wave period Tz,i for the extreme wave heightHe,i of a regular wave according to Eq. (1),
Tz;i ¼ 11:1
ffiffiffiffiffiffiffiffiffiffiffiffiffiHe;i
1:86g
s
ð1Þ
Or calculate the peak spectral period Tp,i for the significant waveheight Hs,i of an irregular wave spectrum according to Eq. (2),which has been explained in more detail by Valamanesh et al.[29].
Tp;i ¼ 11:1
ffiffiffiffiffiffiffiHs;i
g
s
ð2Þ
3) For regular waves, use the wave height He,i and the asso-ciated period Tz,i to generate a regular wave elevation his-tory and calculate the corresponding wave kinematicsand wave profile shape using the 10th order nonlinearstream function theory [27]. For irregular waves, usethe significant wave height Hs,i and the associated periodTp,i to generate a wave spectrum, which is sampled togenerate random wave kinematics and wave historiesusing the inverse Fourier transform and linear wavetheory.
4) Perform time-domain dynamic analysis of the structureunder each of the wave time histories from Step 3 and recordthe structural response (e.g., base shear).
5) Perform equivalent static analysis of the structure under themaximum loading that will occur at the given wave inten-sity. Details on dynamic and equivalent static analysis underregular and irregular wave models used in the example areprovided later in Sections 3.1 and 3.2.
6) Calculate the ratio of the response calculated in Step 4 to acomparable static response from Step 5 to assess the extentof dynamic amplification.
In Step 4, hydrodynamic loading caused by the waves is calcu-lated using a modified form of the Morison Equation [30], whichconsiders the relative velocity between the structure and fluid[31]. All the tubular members of the jacket are modeled with a dragcoefficient CD = 1.2 and inertia coefficient CM = 2.0. Some of theanalyses considered here include the situation where the wavesurface interacts with the deck of the jacket, creating so-called
Mean sea level
50 m
70 m
16 m
4 m
Jacket
Tower
Transition piece(Deck)
240,000 kg107,000 kg
666,000 kg
PIPE 1200 x 50
PIPE 1142 x 35
PIPE 800 x 20
SQUARE 9600 x 9600
PIPE 5600 x 32
PIPE 5318 x 30
PIPE 5082 x 28
PIPE 4800 x 24
PIPE 4565 x 22
PIPE 4329 x 20
PIPE 4118 x 30
PIPE 4000 x 30
Mudline
Leg
Brace
Fig. 2. Schematic and dimensions of the NREL offshore 5-MW baseline turbinesupported by the Upwind jacket. All dimensions are in millimeters unless otherwisespecified.
Chord
Chord
Brace
Brace
Extra springelements
Two extra nodes
Fig. 3. Modeling details of the chord to brace connection of the jacket in USFOS.Two extra spring elements are embedded between the brace and chord to accountfor eccentric loading and joint flexibility.
Table 1The periods of the first five lateral vibration modes of three structural models considered here (FA = fore-aft direction; SS = side-to-side direction).
1st FA (s) 1st SS (s) 2nd FA (s) 2nd SS (s) 3rd FA (s) Description of the model
K. Wei et al. / Engineering Structures 142 (2017) 36–45 39
wave-in-deck forces, which can cause large loads on the structure.Only horizontal wave-in-deck loads are considered here as verticalloads have only a modest effect on structural demands [32]. Thewave-in-deck force is calculated using a simplified Morison-typemethod that is recommended by API [28],
Fh ¼12qCdAv2 ð3Þ
where q is the mass density of sea water, A is the ‘‘silhouette” deckarea, Cd is the horizontal force coefficient for the deck, which isequal to 2.5 for the square deck used in this study, and v is thevelocity of the wave at the height of the deck. Wave loading is mod-eled as coming from the upwind direction only and as being per-pendicular to the side of the deck of the jacket.
As described in Step 3 above, this paper considers dynamicloading caused by regular and irregular wave time histories, asshown in Fig. 5. For the analyses with regular waves, an isolatedwave is first generated corresponding to a particular wave theory,which, for all the regular wave analyses in this paper, is the 10thorder stream function wave theory [27]. Eight cycles of the isolatedwave are modeled and referred to as the ‘‘regular wave time his-tory”. As shown in Fig. 5(a), the regular wave time history includesan initial ramp, which allows for a gradual initiation of the loadingcaused by the full wave height He,i. As such, the regular wave sim-ulation initiates with ‘‘flat sea” conditions with the wave kinemat-ics and elevation scaled linearly to the full wave elevation He,i overa time period Tramp. The phase angle hramp of the wave is alsoneeded to fully define the initial ramp. The authors conducted asensitivity study exploring the impact of all combinations of Tramp
between 0 and 5Tz,i by a step of 0.5Tz,i and hramp between 0o and315o by a step of 45o and found that the structural response wasminimally influenced by these parameters. For this reason, theanalyses presented here consider only one set of initial parametersdefining the initial ramp: Tramp equal to 2Tz,i, and hramp equal to 90o.The maximum dynamic structural response umax
dynamic from the regu-
lar wave analysis is defined as the maximum response (i.e., baseshear, in this case) during the time history analysis.
For the analyses with irregular waves, a one-hour time historyis sampled from a JONSWAP spectrum [33] by the inverse Fouriertransform. The wave spectrum is defined by Hs,i and Tp,i. The waveheight of isolated irregular waves extracted from the irregularwave history can be considered by multiple measures (see Weiet al. [20] for more details on this issue) and the crest height Hg,is considered here and defined as in Fig. 5c. For the irregular wavehistories (shown in Fig. 5b), the maximum dynamic structuralresponses relevant to the jth crest height is umax
dynamic;g;j which isdefined as the maximum dynamic response inside the time rangeof the nearest two zero-crossing points (94 s and 100 s for thewave shown in Fig. 5c). The zero up-crossing period of the jth waveTj is also defined in Fig. 5c.
2.4. Calculation of dynamic amplification factor
The difference between the structural response of dynamic andstatic analyses for the same magnitude of wave loading is quanti-fied with a dynamic amplification factor (DAF),
DAF ¼umaxdynamic
umaxstatic
ð4Þ
where umaxdynamic is the maximum structural response under dynamic
analysis and umaxstatic is the maximum response under static analysis.
In this study, the considered structural response is the base shear.To calculate the amplification between dynamic and static analysesfor regular waves, the equivalent response umax
static is calculated by sta-tic analysis under the wave with wave height He,i and period Tz,i, asshown in the red frame in Fig. 5a. To calculate the amplificationbetween dynamic and static analyses for irregular waves, the equiv-alent response umax
static is calculated by static analysis under the wavewith crest height Hg,j and period Tj as shown in the red frame in
Fig. 4. The first five lateral mode shapes and corresponding periods (T) and frequencies (f) for Model #1.
40 K. Wei et al. / Engineering Structures 142 (2017) 36–45
Fig. 5c. Linear Airy wave theory including Wheeler stretching isused to calculate the wave profiles and the corresponding wavekinematics for irregular cases.
The static wave kinematics applied to the structure are those atthe instant causing the highest structural response, which, forsmall diameter drag-dominated components such as the tubes ofa jacket structure, generally occurs at the crest of the wave whenvelocities of the fluid particles are largest [11].
3. Illustrative Examples and results
The scope of the numerical study considered here is organizedinto two sub-studies, one with regular waves and one with irregu-lar waves. The intent of the study with regular waves is to comparethe elastic response of time-domain regular wave analyses and sta-tic analyses with the same wave height, while the intent of thestudy with irregular waves is to examine the effect of wavesequence on the dynamic response. Irregular wave analyses areperformed for one-hour irregular sea states with significant waveheights of Hs,i = 15 m, 20 m, 25 m, 30 m. In this example, the irreg-ular sea state samples with Hs,i = 15 m and 20 m have no wavescausing wave-in-deck forces, while the irregular wave sampleswith Hs,i = 25 m and 30 m do have waves causing wave-in-deckforces. For all cases considered here, the water depth is equal to50 m.
3.1. Regular wave analyses
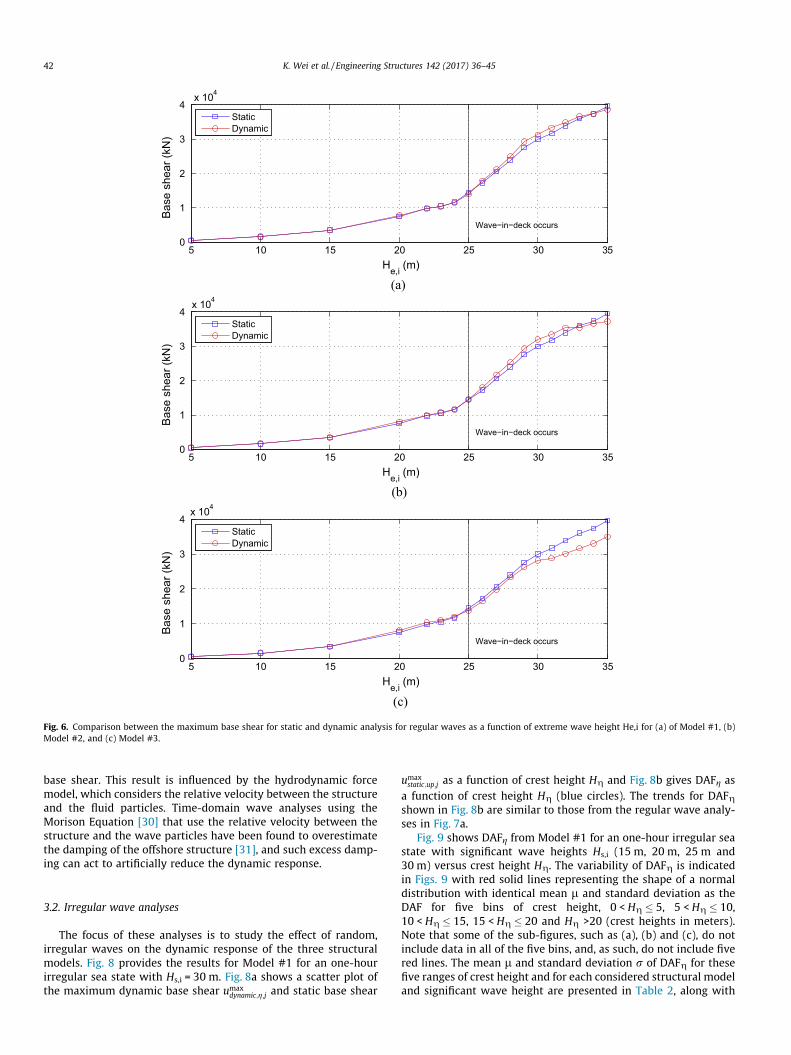
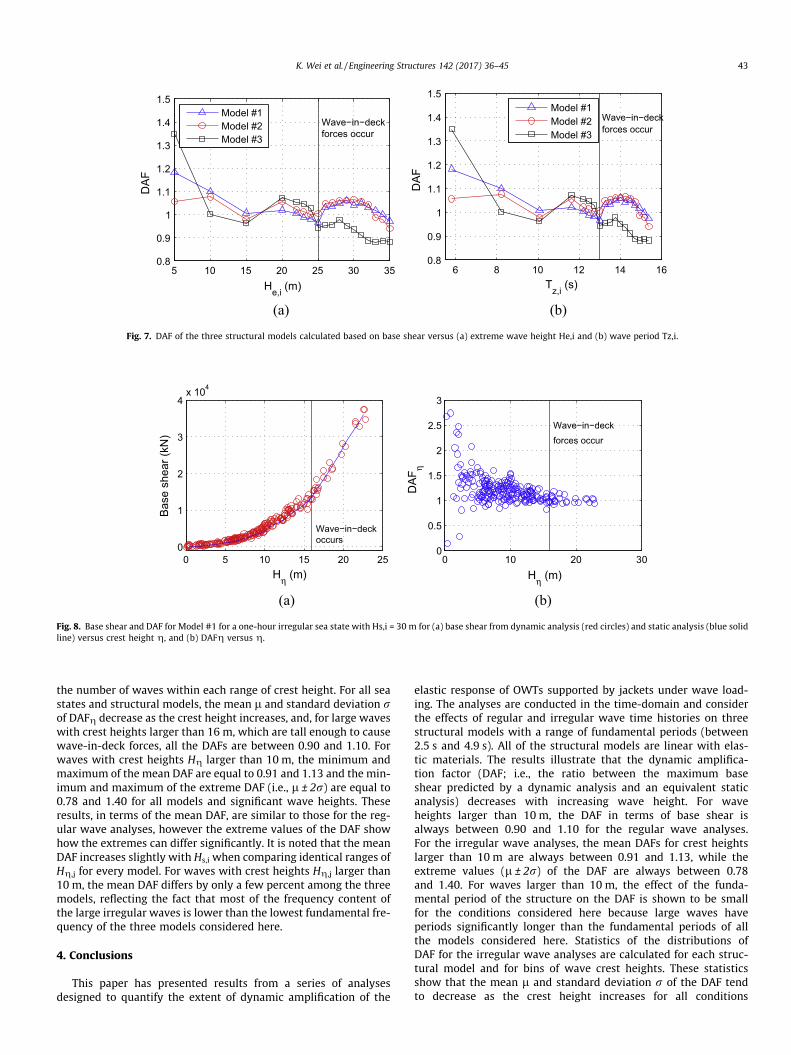
In this section, the performance of all three models are assessedunder regular waves with a large range of extreme wave heights,from 5 m to 20 m, spaced at 5 m and from 22 m to 35 m, spacedat 1 m. The 10th order stream function wave theory [27] is usedto calculate the wave kinematics. The DAF is calculated in termsof the maximum base shear from dynamic and static analyses,and the results are provided in terms of base shear versus extremewave height in Fig. 6 and in terms of DAF versus the extreme waveheight and the corresponding wave period in Fig. 7.
The extreme wave period Tz,i is calculated for each extremewave height He,i according to Eq. (1). The DAFs of the three modelstend to decrease with the increases in He,i and Tz,i, and, for waveheights larger than 10 m, the DAF is always between 0.90 and1.10. The periods of the regular waves larger than 10 m are longerthan 10 s which is significantly longer than the fundamental periodof even the most flexible model, Model #3. As such, the DAFs forthese large waves vary little between the models and are close to1.00. Waves with heights less than 10 m have periods closer tothe fundamental period of three OWT models and, accordingly,have larger DAFs than those for the larger waves. For waves largeenough to cause wave-in-deck forces, the DAFs of three modelsare never more than 1.10.
In many of the cases considering large waves, the DAF is slightlyless than 1.00, implying that a static analysis would overestimate
Fig. 5. Samples of (a) regular and (b) irregular waves with (c) highlight of the crest height Hg,j of the jth wave in the irregular wave train.
K. Wei et al. / Engineering Structures 142 (2017) 36–45 41
base shear. This result is influenced by the hydrodynamic forcemodel, which considers the relative velocity between the structureand the fluid particles. Time-domain wave analyses using theMorison Equation [30] that use the relative velocity between thestructure and the wave particles have been found to overestimatethe damping of the offshore structure [31], and such excess damp-ing can act to artificially reduce the dynamic response.
3.2. Irregular wave analyses
The focus of these analyses is to study the effect of random,irregular waves on the dynamic response of the three structuralmodels. Fig. 8 provides the results for Model #1 for an one-hourirregular sea state with Hs,i = 30 m. Fig. 8a shows a scatter plot ofthe maximum dynamic base shear umax
dynamic;g;j and static base shear
umaxstatic;up;j as a function of crest height Hg and Fig. 8b gives DAFg as
a function of crest height Hg (blue circles). The trends for DAFgshown in Fig. 8b are similar to those from the regular wave analy-ses in Fig. 7a.
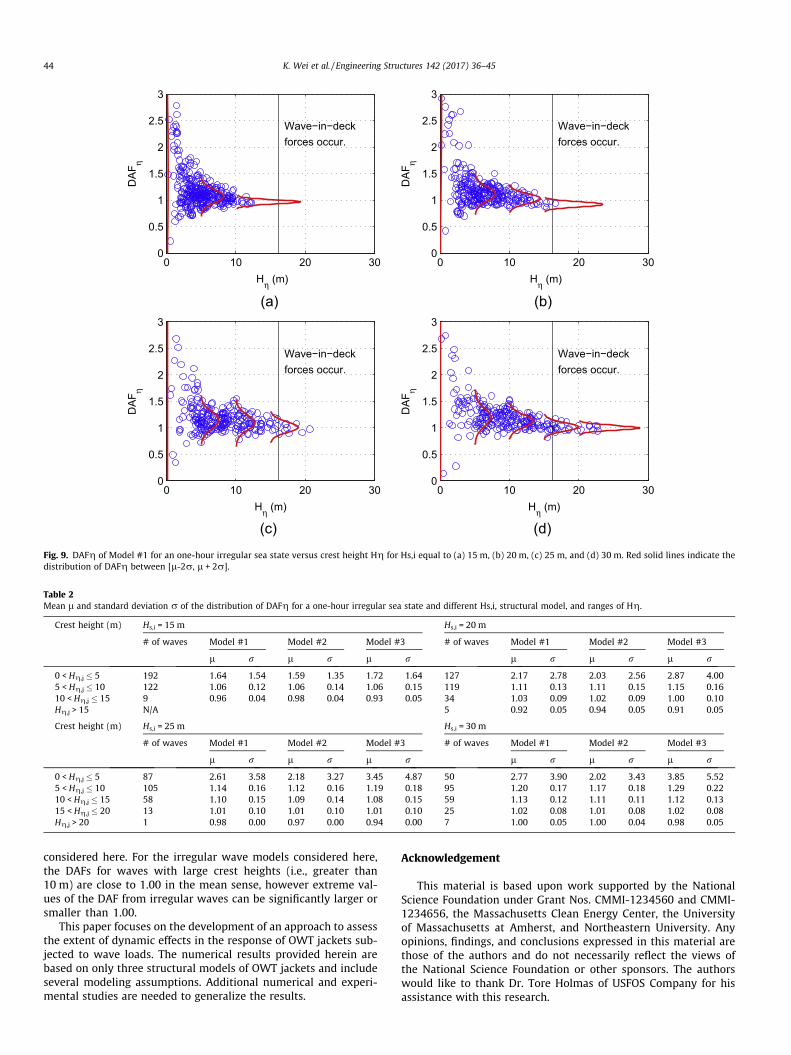
Fig. 9 shows DAFg from Model #1 for an one-hour irregular seastate with significant wave heights Hs,i (15 m, 20 m, 25 m and30 m) versus crest height Hg. The variability of DAFg is indicatedin Figs. 9 with red solid lines representing the shape of a normaldistribution with identical mean l and standard deviation as theDAF for five bins of crest height, 0 < Hg % 5, 5 < Hg % 10,10 < Hg % 15, 15 < Hg % 20 and Hg >20 (crest heights in meters).Note that some of the sub-figures, such as (a), (b) and (c), do notinclude data in all of the five bins, and, as such, do not include fivered lines. The mean l and standard deviation r of DAFg for thesefive ranges of crest height and for each considered structural modeland significant wave height are presented in Table 2, along with
5 10 15 20 25 30 350
1
2
3
4x 10⁴
He,i (m)
Base
she
ar (k
N)
Wave−in−deck occurs
StaticDynamic
(a)
5 10 15 20 25 30 350
1
2
3
4x 10⁴
He,i (m)
Base
she
ar (k
N)
Wave−in−deck occurs
StaticDynamic
(b)
5 10 15 20 25 30 350
1
2
3
4x 10⁴
He,i (m)
Base
she
ar (k
N)
Wave−in−deck occurs
StaticDynamic
(c)
Fig. 6. Comparison between the maximum base shear for static and dynamic analysis for regular waves as a function of extreme wave height He,i for (a) of Model #1, (b)Model #2, and (c) Model #3.
42 K. Wei et al. / Engineering Structures 142 (2017) 36–45
the number of waves within each range of crest height. For all seastates and structural models, the mean l and standard deviation rof DAFg decrease as the crest height increases, and, for large waveswith crest heights larger than 16 m, which are tall enough to causewave-in-deck forces, all the DAFs are between 0.90 and 1.10. Forwaves with crest heights Hg larger than 10 m, the minimum andmaximum of the mean DAF are equal to 0.91 and 1.13 and the min-imum and maximum of the extreme DAF (i.e., l ± 2r) are equal to0.78 and 1.40 for all models and significant wave heights. Theseresults, in terms of the mean DAF, are similar to those for the reg-ular wave analyses, however the extreme values of the DAF showhow the extremes can differ significantly. It is noted that the meanDAF increases slightly with Hs,i when comparing identical ranges ofHg,j for every model. For waves with crest heights Hg,j larger than10 m, the mean DAF differs by only a few percent among the threemodels, reflecting the fact that most of the frequency content ofthe large irregular waves is lower than the lowest fundamental fre-quency of the three models considered here.
4. Conclusions
This paper has presented results from a series of analysesdesigned to quantify the extent of dynamic amplification of the
elastic response of OWTs supported by jackets under wave load-ing. The analyses are conducted in the time-domain and considerthe effects of regular and irregular wave time histories on threestructural models with a range of fundamental periods (between2.5 s and 4.9 s). All of the structural models are linear with elas-tic materials. The results illustrate that the dynamic amplifica-tion factor (DAF; i.e., the ratio between the maximum baseshear predicted by a dynamic analysis and an equivalent staticanalysis) decreases with increasing wave height. For waveheights larger than 10 m, the DAF in terms of base shear isalways between 0.90 and 1.10 for the regular wave analyses.For the irregular wave analyses, the mean DAFs for crest heightslarger than 10 m are always between 0.91 and 1.13, while theextreme values (l ± 2r) of the DAF are always between 0.78and 1.40. For waves larger than 10 m, the effect of the funda-mental period of the structure on the DAF is shown to be smallfor the conditions considered here because large waves haveperiods significantly longer than the fundamental periods of allthe models considered here. Statistics of the distributions ofDAF for the irregular wave analyses are calculated for each struc-tural model and for bins of wave crest heights. These statisticsshow that the mean l and standard deviation r of the DAF tendto decrease as the crest height increases for all conditions
5 10 15 20 25 30 350.8
0.9
1
1.1
1.2
1.3
1.4
1.5
He,i (m)
DAF
Wave−in−deckforces occur
Model #1Model #2Model #3
6 8 10 12 14 160.8
0.9
1
1.1
1.2
1.3
1.4
1.5
Tz,i (s)
DAF
Wave−in−deckforces occur
Model #1Model #2Model #3
(a) (b) Fig. 7. DAF of the three structural models calculated based on base shear versus (a) extreme wave height He,i and (b) wave period Tz,i.
0 5 10 15 20 250
1
2
3
4x 10⁴
Hη (m)
Base
she
ar (k
N)
Wave−in−deckoccurs
0 10 20 300
0.5
1
1.5
2
2.5
3
Hη (m)
DAF
ηWave−in−deckforces occur
(a) (b)Fig. 8. Base shear and DAF for Model #1 for a one-hour irregular sea state with Hs,i = 30 m for (a) base shear from dynamic analysis (red circles) and static analysis (blue solidline) versus crest height g, and (b) DAFg versus g.
K. Wei et al. / Engineering Structures 142 (2017) 36–45 43
considered here. For the irregular wave models considered here,the DAFs for waves with large crest heights (i.e., greater than10 m) are close to 1.00 in the mean sense, however extreme val-ues of the DAF from irregular waves can be significantly larger orsmaller than 1.00.
This paper focuses on the development of an approach to assessthe extent of dynamic effects in the response of OWT jackets sub-jected to wave loads. The numerical results provided herein arebased on only three structural models of OWT jackets and includeseveral modeling assumptions. Additional numerical and experi-mental studies are needed to generalize the results.
Acknowledgement
This material is based upon work supported by the NationalScience Foundation under Grant Nos. CMMI-1234560 and CMMI-1234656, the Massachusetts Clean Energy Center, the Universityof Massachusetts at Amherst, and Northeastern University. Anyopinions, findings, and conclusions expressed in this material arethose of the authors and do not necessarily reflect the views ofthe National Science Foundation or other sponsors. The authorswould like to thank Dr. Tore Holmas of USFOS Company for hisassistance with this research.
0 10 20 300
0.5
1
1.5
2
2.5
3
Wave−in−deckforces occur.
Hη (m)
DAF
η
(a)
0 10 20 300
0.5
1
1.5
2
2.5
3
Wave−in−deckforces occur.
Hη (m)
DAF
η
(b)
0 10 20 300
0.5
1
1.5
2
2.5
3
Wave−in−deckforces occur.
Hη (m)
DAF
η
(c)
0 10 20 300
0.5
1
1.5
2
2.5
3
Wave−in−deckforces occur.
Hη (m)
DAF
η
(d)Fig. 9. DAFg of Model #1 for an one-hour irregular sea state versus crest height Hg for Hs,i equal to (a) 15 m, (b) 20 m, (c) 25 m, and (d) 30 m. Red solid lines indicate thedistribution of DAFg between [l-2r, l + 2r].
Table 2Mean l and standard deviation r of the distribution of DAFg for a one-hour irregular sea state and different Hs,i, structural model, and ranges of Hg.
Crest height (m) Hs,i = 15 m Hs,i = 20 m
# of waves Model #1 Model #2 Model #3 # of waves Model #1 Model #2 Model #3
44 K. Wei et al. / Engineering Structures 142 (2017) 36–45
References
[1] Krawinkler H, Zareian F, Medina RA, Ibarra LF. Decision support for conceptualperformance-based design. Earthquake Eng Struct Dyn 2006;35:115–33.
[2] Vision SEAOC. Performance based seismic engineering ofbuildings. Sacramento, California: Structural Engineers Association ofCalifornia; 1995.
[3] Hose YD, Seible F. Performance evaluation database for concrete bridgecomponents and systems under simulated seismic loads. Pacific EarthquakeEngineering Research Center; 1999.
[4] Nuta E, Christopoulos C, Packer JA. Methodology for seismic risk assessmentfor tubular steel wind turbine towers: application to Canadian seismicenvironment. Can J Civ Eng 2011;38:293–304.
[5] Fallon MB. A Probabilistic deformation demand model and fragility estimatesfor asymmetric offshore jacket platforms, 2012.
[6] Spence S, Chuang W, Tabbuso P, Bernardini E, Kareem A, Palizzolo L, et al.Performance-based engineering of wind-excited structures: a generalmethodology. Geotechnical and structural engineering congress2016. American Society of Civil Engineers; 2016. p. 1269–82.
[7] Taflanidis AA, Loukogeorgaki E, Angelides DC. Offshore wind turbine riskquantification/evaluation under extreme environmental conditions. Reliab EngSyst Saf 2013;115:19–32.
[8] Kim S, D’Amore E. Push-over analysis procedure in earthquake engineering.Earthquake Spectra 1999;15:417–34.
[9] Barros RC, Almeida R. Pushover analysis of asymmetric three-dimensionalbuilding frames. J Civ Eng Manage 2005;11:3–12.
[10] Stewart G, Moan T, Amdahl J, Eide OI. Nonlinear re-assessment of jacketstructures under extreme storm cyclic loading: Part I-philosophy andacceptance criteria. In: 12th international conference on offshore mechanicsand arctic engineering. ASME; 1993. p. 491–502.
[11] Wei K, Arwade SR, Myers AT. Incremental wind-wave analysis of the structuralcapacity of offshore wind turbine support structures under extreme loading.Eng Struct 2014;79:58–69.
[12] Ghobarah A. Performance-based design in earthquake engineering: state ofdevelopment. Eng Struct 2001;23:878–84.
[14] Tabbuso P, Spence SMJ, Palizzolo L, Pirrotta A, Kareem A. An efficientframework for the elasto-plastic reliability assessment of uncertain windexcited systems. Struct Saf 2016;58:69–78.
[15] Judd JP, Charney FA. Inelastic Behavior and Collapse Risk for BuildingsSubjected to Wind Loads. Structures Congress 2015. Portland, Oregon 2015.p. 2483–96.
[16] Golafshani AA, Bagheri V, Ebrahimian H, Holmas T. Incremental wave analysisand its application to performance-based assessment of jacket platforms. JConstr Steel Res 2011;67:1649–57.
[17] Jensen JJ. Dynamic amplification of jack-up platforms subjected to non-Gaussian wave loads. J Res Natl Inst Stand Technol 1993;99:455–64.
[18] Horn J-TH, Amdahl J, Haver SK. Dynamic amplification of drag dominatedstructures in irregular seas. In: OCEANS’15 MTS/IEEE. Washington: IEEE; 2015.
[19] Kim DH, Lee SG, Lee IK. Seismic fragility analysis of 5 MW offshore windturbine. Renewable Energy 2014;65:250–6.
[20] Wei K, Arwade SR, Myers AT, Hallowell S, Hajjar JF, Hines EM, et al. Towardperformance-based evaluation for offshore wind turbine jacket supportstructures. Renewable Energy 2016;97:709–21.
[21] Vemula NK, DeVries W, Fischer T, Cordle A, Schmidt B. Design solution for theupwind reference offshore support structure. Rambøll; 2010. Upwinddeliverable D425.
[22] Jonkman JM, Butterfield S, Musial W, Scott G. Definition of a 5-MW referencewind turbine for offshore system development. Colorado: National RenewableEnergy Laboratory; 2009.
[23] Holmas T, Amdahl J, Emami Azadi MR. USFOS, a computer program forultimate strength analysis of framed structures (with Pile-Soil Module), 2006.Norway.
[24] Hensel J, Sharma MSR, Baxter CDP, Hu SLJ. Development of a technology typefactor for jacket structures for offshore wind turbines in Rhode Island. JRenewable Sustainabe Energy 2012;4.
[25] Shirzadeh R, Weijtjens W, Guillaume P, Devriendt C. The dynamics of anoffshore wind turbine in parked conditions: a comparison betweensimulations and measurements. Wind Energy 2015;18:1685–702.
[26] Correia HJD, Mendes AnC, Oliveira CAFS. Structural Analysis of an OffshoreJacket Model Under Seismic Excitation. In: ASME 2008 27th InternationalConference on Offshore Mechanics and Arctic Engineering. Estoril, Portugal;2008. p. 265–74.
[27] Fenton J. Nonlinear wave theories. Sea 1990;9:3–25.[28] API R. Recommended practice for planning, designing, and constructing fixed
offshore platforms-working stress design. 21st ed. Washington, D.C.: APIPublishing Services; 2005. API RP 2A-WSD.
[29] Valamanesh V, Myers AT, Arwade SR. Multivariate analysis of extrememetocean conditions for offshore wind turbines. Struct Saf 2015;55:60–9.
[30] Morison JR, O’Brien MP, Johnson JW, Schaaf SA. The force exerted by surfacewaves on piles. J Petrol Technol 1950;2:149–54.
[31] Laya EJ, Connor JJ, Sunder SS. Hydrodynamic forces on flexible offshorestructures. J Eng Mech 1984;110:433–48.
[32] Loch K. The effects of wave induced vertical deck loads on ultimate limit statestatic pushover analyses results. Berkeley, CA: Marine TechnologyManagement Group, Department of Civil Environmental Engineering,University of California at Berkeley; 1994.
[33] Hasselmann K, Barnett T, Bouws E, Carlson H, Cartwright D, Enke K, et al.Measurements of wind-wave growth and swell decay during the Joint NorthSea Wave Project (JONSWAP), 1973.
K. Wei et al. / Engineering Structures 142 (2017) 36–45 45