Dynamic Effects Produced on Transmission Towers due to Line Cable Rupture Neftalí Rodríguez- Cuevas 1 , Roger Morales- Hernández 2 1 Investigador, Instituto de Ingeniería, Universidad Nacional Autónoma de México, Apdo. Postal 70-472, 04510, México, D.F., Tel. (55)5622-3472; [email protected]. 2 Graduate student. Consejo Nacional de Ciencia y Tecnología (CONACYT). Universidad Nacional Autónoma de México, Apdo. Postal 70-472, 04510, México, D.F., Tel. (55) 56 23 35 00 ext. 1015. ABSTRACT In the analyses of aerial lines of electric energy, is common the use of models, in which the support towers are considered as isolated structures, without any consideration of their interaction with isolators chains, hardware and cables. On the other hand, wind loads are applied as static forces on the structure, as its own weight and accessories, but there exist other type of actions, with dynamic characteristics, as those produced by cable rupture. On this paper are presented the results obtained from a mathematical model, on which were considered all the elements that form a portion of a transmission line, with support towers, hardware, isolator chains and cables; it was used to analyze the dynamic effects produced by the accessories on the support towers. A method was developed to simulate cable breakage, by the use of a time dependant function by which the dynamic effects were evaluated, on two support tower, with different foundation conditions. INTRODUCTION Technical norms for structural design usually take in consideration the possible line rupture on transmission towers, assuming amplified static loads that induce an internal disequilibrium on the support towers; it is an oversimplification of the phenomenon of what happens in the line. The rupture acts as a longitudinal impact load, transferred through the line to the tower hardware and isolation chains, producing torsional moments on the supporting towers, inducing important amplification on the acting forces on each member of the tower. This is the main reason to study these dynamic effects Clear evidence in México is found on the collapse of a great number of supporting towers on electric transmission lines all over the country, produced by meteorological events, strong hurricanes, or severe down pour storms (ref. 3); the last type of event differs on the air velocity profile, as compared with a hurricane event; design recommendations on our country do not specified design procedures for strong down pour events. On ref. 6 velocity profiles only correspond to velocity profiles observed when a hurricane occurs on the coastal zones. 1. CHARACTERÍSTICS OF PART OF A TRASSMISION LINE UNDER ANALYSIS The analysis and design of a transmission line was reviewed; it is located near Ciudad del Carmen, Campeche, with support towers type 68T10, whose height is equal to 67.53 m., and carries two circuits and six phases (one at each cross arm), originally design with Mexican specifications (ref. 9).
Transcript
Dynamic Effects Produced on Transmission Towers due to Line Cable Rupture
Neftalí Rodríguez- Cuevas1
, Roger Morales- Hernández2
1 Investigador, Instituto de Ingeniería, Universidad Nacional Autónoma de México, Apdo.
Postal 70-472, 04510, México, D.F., Tel. (55)5622-3472; [email protected]. 2 Graduate student. Consejo Nacional de Ciencia y Tecnología (CONACYT). Universidad
Nacional Autónoma de México, Apdo. Postal 70-472, 04510, México, D.F., Tel. (55) 56 23 35
00 ext. 1015. ABSTRACT
In the analyses of aerial lines of electric energy, is common the use of models, in which the
support towers are considered as isolated structures, without any consideration of their
interaction with isolators chains, hardware and cables. On the other hand, wind loads are
applied as static forces on the structure, as its own weight and accessories, but there exist
other type of actions, with dynamic characteristics, as those produced by cable rupture.
On this paper are presented the results obtained from a mathematical model, on which were
considered all the elements that form a portion of a transmission line, with support towers,
hardware, isolator chains and cables; it was used to analyze the dynamic effects produced by
the accessories on the support towers. A method was developed to simulate cable breakage, by
the use of a time dependant function by which the dynamic effects were evaluated, on two
support tower, with different foundation conditions. INTRODUCTION Technical norms for structural design usually take in consideration the possible line rupture on
transmission towers, assuming amplified static loads that induce an internal disequilibrium on the
support towers; it is an oversimplification of the phenomenon of what happens in the line. The rupture
acts as a longitudinal impact load, transferred through the line to the tower hardware and isolation
chains, producing torsional moments on the supporting towers, inducing important amplification on the
acting forces on each member of the tower. This is the main reason to study these dynamic effects
Clear evidence in México is found on the collapse of a great number of supporting towers on electric
transmission lines all over the country, produced by meteorological events, strong hurricanes, or severe
down pour storms (ref. 3); the last type of event differs on the air velocity profile, as compared with a
hurricane event; design recommendations on our country do not specified design procedures for strong
down pour events. On ref. 6 velocity profiles only correspond to velocity profiles observed when a
hurricane occurs on the coastal zones.
1. CHARACTERÍSTICS OF PART OF A TRASSMISION LINE UNDER ANALYSIS
The analysis and design of a transmission line was reviewed; it is located near Ciudad del Carmen,
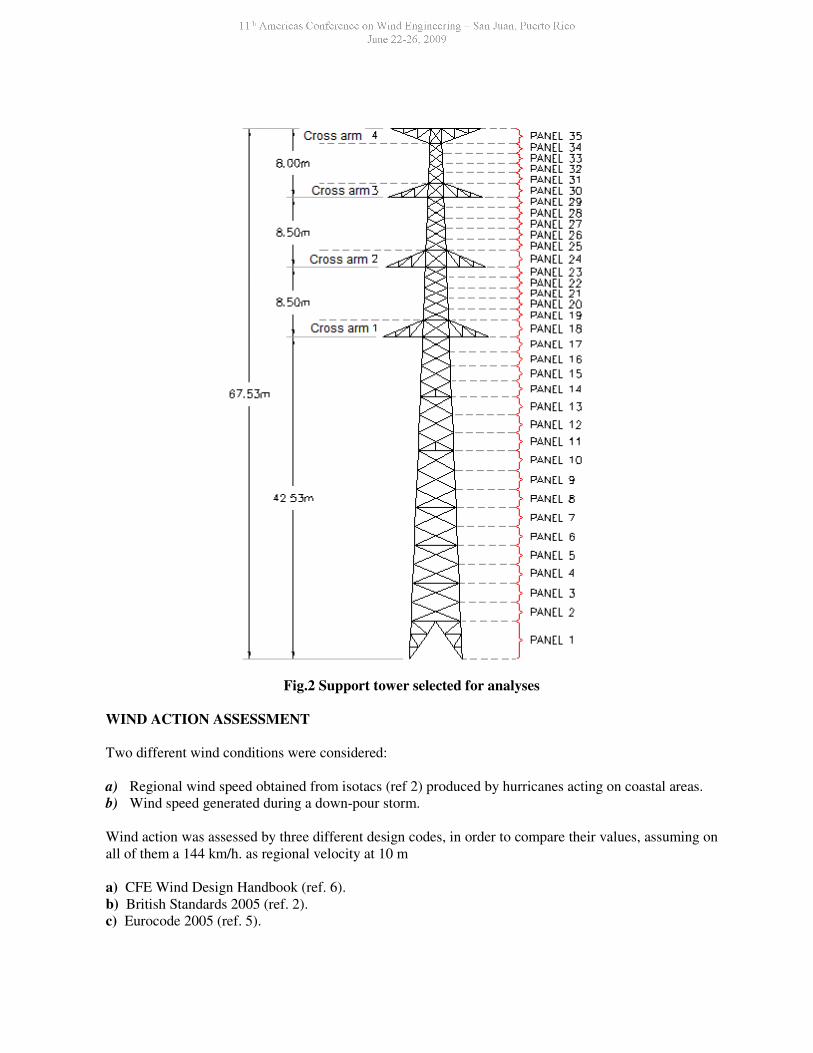
Campeche, with support towers type 68T10, whose height is equal to 67.53 m., and carries two circuits
and six phases (one at each cross arm), originally design with Mexican specifications (ref. 9).
The part of the line under analyses is formed by two support towers, of the type previously mentioned,
which support three 450 m. spans, (see fig.1); on each tower were considered six isolator chains; they
support the six lines, on each cross arm; besides, two ground lines were on top of the tower directly
connected to hardware on top of the towers.
Fig.1 Portion of the line selected for the dynamic analyses
Support towers are formed by angular steel members, type L1, (ref.7). Some of them have yield stress
equal to Fy = 2530 Kg/cm2 (A36), and others with Fy = 3515 Kg/cm
2 (Grade 50 steel).
Line conductors and the ground lines were design to satisfy common specifications (ref. 9), and their
properties are mentioned on the following paragraphs.
a) Line conductor ACSR 1113 kCM “Bluejay”, Table 1. (ref. 9)
Concept Properties
Exterior diameter 32 mm
Cross area 603 mm2
Weight per unit length 1.870 Kg/m
Rupture force 14,030 Kg
Initial Young modulus 5,483 Kg/mm2
Final Young modulus 6,587 Kg/mm2
Initial thermal coefficient 20.53 x 10⁻⁶
/ºC
Final thermal coefficient 20.80 x 10⁻⁶
/ºC
Number of wires (aluminum/steel) 45/7
b) Extra galvanized high strength ground line:
Table 2. (ref. 9)
Concept Properties
Exterior Diameter 9.5 mm
Cross area 51.2 mm2
Own weight per unit length 0.406 Kg/m
Rupture force 4,900 Kg
Initial Young modulus 15,747 Kg/mm2
Final Young modulus 18,137 Kg/mm2
Thermal coefficient 11.52 x 10⁻⁶
/ºC
Number of wires (steel) 7
Fig.2 Support tower selected for analyses
WIND ACTION ASSESSMENT Two different wind conditions were considered:
a) Regional wind speed obtained from isotacs (ref 2) produced by hurricanes acting on coastal areas.
b) Wind speed generated during a down-pour storm.
Wind action was assessed by three different design codes, in order to compare their values, assuming on
all of them a 144 km/h. as regional velocity at 10 m
a) CFE Wind Design Handbook (ref. 6).
b) British Standards 2005 (ref. 2).
c) Eurocode 2005 (ref. 5).
TYPE OF FOUNDATION AT THE BASE OF THE SUPPORT TOWERS In order to know the effect of different subsoil conditions on the structural behavior of the towers, two
different subsoil conditions were selected for them; under one tower it was assumed it was supported by
a slab, to which it was connected. It was assumed that the slab might rotate around three different
centroidal axes, but displacements were restricted; with these restrictions it was expected to simulate the
condition of a foundation over subsoil with low compressibility (high strength capacity).
Under the other tower it was considered a foundation formed by a horizontal slab to which the tower
was connected. On the four sides of the slab, four vertical metallic sheet piling walls were connected, to
form a cofferdam, to transmit vertical loads by friction, to the surrounding low capacity soil. The
horizontal concrete slab was 20 cm thick, and the vertical sheet piling was considered 12m deep, to
confine the subsoil and increase its load capacity. For this foundation it was assumed the possibility of
translations on three orthogonal directions, and rotations around those axes; their magnitudes were
dependant on the foundation stiffness in contact with low capacity subsoil.
VERTICAL VARIATION OF WIND VELOCITY WITH HEIGTH, DURING A DOWN BURST STORM.
As mentioned by Kim y Hangan (ref. 8), a down burst storm is a natural phenomenon produced by a
sudden vertical flow of air, that creates vortex rings when strikes the ground, generating strong winds in
short time; ground wind speed may increase from 37 to 185 km/h. on two minutes interval. Maximum
wind speed appears at an altitude close to 5% the storm diameter. The wind velocity profile near the
ground is shown on Fig. 3; from it, expressions to asses wind velocity variation with height were
represented by a power law, in two intervals.
In order to define the exponent of the power law at each interval, the approach mentioned by
Benjamin and Cornell (ref. 1) was selected, by adjusting the wind data in a logarithmic space to a
straight line; it is equivalent to adjust a power law to data in that space. The procedure to adjust the data
was based on the following scheme:
En donde:
Vz = Average wind speed at height Z over ground level, Km/h.
V1
0 = Average wind speed at10 m over ground level, Km/h.
α = Exponent that defines wind velocity, v z at height z
α
10
Z=
V
V
10
z
10
ZLn=
V
VLn
10
zα
α
10
ZV=V 10z
Fig.3 Downburst wind speed profile
a) By the following change of variables:
b) Representing variables “x” and “y” in a logarithmic plane of reference.
c) Data was represented on the logarithmic space, and a straight line “y = Ax + B” was adjusted.
d) Coefficient A represents exponent α for the power law
On following paragraphs are presented expressions to evaluate average wind velocity for design
purposes at different height over ground level, for the following intervals: a) From 0 to 10 m; b) from 10
to 50 m, being the upper value the height at which maximum velocity appears; c) from 50 to 280.90 m,
maximum height at which the effects of the down-burst is felt.
1. For Z ≤ 10 m:
VD = FrZ · FC · FT · V10 …………….……..………….. (1) FrZ = 1.00, assuming wind velocity is kept constant between 0 to 10 m.
2. For 10 m < Z ≤ 50 m:
( ) 1732.0,10/FrZ == αα
beingz
( ) )V · F · (F10/zV 10TCD
αααα= ….………..…………….. (2)
10
ZLn=x
V
VLn=y
10
z
Fig. 4 Parameter “α ” for height mZm 5010 ≤≤
3. For 50 m < Z ≤ 280.90 m:
( ) 4137.0-,10/725.2FrZ == αα
beingz
( ) )V · F · (F10/z725.2V 10TCD
αααα= ….………..…………….. (3)
Fig. 5 Parameter “α ” for height mZm 9.28050 ≤≤
DESCRIPTION OF THE MATHEMATICAL MODEL SELECTED TO REPRESENT THE TOWER
Elements selected for the support tower SAP program was used and the tower elements were represented as bar elements with three degrees of
freedom, i.e. displacements on three orthogonal directions were allowed at each node, (Ux≠0, Uy≠0,
and Uz≠0). Due to the small value of the moment of inertia of their sections, flexural moments were
rather small; it was considered that the angular rotations were close to cero, (Rx≈0, Ry≈0, and Rz≈0).
y = - 0.4137x + 1.076
Line conductors Program SAP2000 has a command to generate these types of elements, once data for the acting tension
is given, and the maximum vertical value at the span center is also given, (defined from a static
analysis). Conductors were divided in 180 portions for integration purposes, according to what is
mentioned on ref. 10; hence fore tension forces on all the portions were kept constant along its whole
length.
Hardware and isolator chains Hardware was modeled according criteria mentioned on what follows:
a) Bar elements with equal stiffness and weight to hardware properties mentioned on ref. 13.
b) Hinged on its upper end to cross arm end, allowing lineal displacements, (Ux≠0, Uy≠0, Uz≠0), and
its lower end free to move without any restriction.
c) Line conductors were attached to the lower end, and their actions were considered as concentrated
loads, due to conductor own weight, wind action on them and priestesses tension.
d) Suspended isolators properties were taken from ref. 4:
Young modulus: E = 3,110,000 Kg/cm2.
Tensile strength = 2700 Kg.
Lineal elastic behavior was considered for them.
Every isolator chain was assumed formed by twenty porcelain units (for a 400 KV line); its
length was made equal to 2.95 m.
Isolator chain weight: 250 Kg (ref. 13).
Mass distribution and damping considered for the elements During a dynamic analysis, SAP2000 program considers half of the mass of each element, concentrated
on its connection to other elements; therefore half of its mass is concentrated on one end, and the other
half, to the other end. This assumption was considered for all the tower elements, conductor lines and
isolator chains. As far as damping is concerned for dynamic analyses, for elements of the tower, a value
0.01 was used (as fraction of their critical damping) as mentioned on ref. 11. For line conductors,
hardware and isolator chains, a value 0.02 were selected, as obtained from numerical models mentioned
on ref. 10.
Geometric non linearity (P·δ effect�) Two different type of analysis were carried out: a) Linear analyses, and b) Non-linear geometric
analyses.Non linear geometric analysis is needed when P·δ effects appear, due to eccentricity of axial
load on compression members of the support tower; secondary flexural moments appear and produce
increase on internal forces on the tower elements (see fig. 6.)
Fig. 6 δ⋅P effect on compression members
TIME INTEGRATION FUNCTION SELECTED TO REPRESENT RUPTURE OF A LINE CONDUCTOR In order to simulate conductor rupture on the analyzed models, it was necessary to develop a time
integration function, to represent the progressive relaxation of prestressed tension on one conductor that
produces rupture on it, (see fig. 7). In what follows, is mentioned each time interval selected, its
duration and the effect produced on the line conductor:
a) First stage. On this 3 second interval (0.00 s. ≤ ∆t1 ≤ 3.00 s.), it is assumed a progressive conductor
tensioning, to reach the design tension, (50% of the ultimate strength of the line conductor).
b) Second stage. During 7 seconds, (3.00 s. < ∆t2 ≤ 10.00 s.), it was assumed the conductor tension
was kept constant; during this stage it was assumed a stable behavior of the system, under design
conditions, i.e. no damage appeared on any element of the line.
c) Third stage. On this stage, lasting 0.5 s, (10.00 s. < ∆t3 ≤ 10.50 s.), the tension force on the
conductor is lost, in a lineal decrease, reaching at the end of the stage a zero magnitude at t = 10.5 s,
reproducing the line conductor fracture, and generating an unstable behavior on the tower.
d) Fourth stage. In order to review the effects produced by the fracture on the system elements, a final
stage was selected (10.50 s. < ∆t4 ≤ 25.5.), to observe the dynamic effects produced by the loss of line
conductor tension.
Fig. 7 Time integration function to represent line rupture
Fig. 8 Time integration function for constant load
On Fig. 8 is shown the time integration function selected to represent constant load application, during
an interval equal to 25.5 s.
Those time integration functions were introduced at SAP 2000 program, and used for analyses as “Time
History Linear”. For the dynamic analyses, Newmark’s time integration method was used, as
recommended by ref. 10. DYNANIC LOADS CONSIDERED On the dynamic analyses carried out, only one line conductor failure was considered on the load
combinations used; a concentrated load at hardware free end was considered, with the time integration
function shown on Fig. 7, when a line conductor failed, or on the cross arm node, when a ground
conductor broke. All the other loads were kept constant for each combination selected, following the
time integration function shown on Fig. 8. Several dynamic analyses were performed, under the
following load combinations: a) Support own weight, assumed constant during the analysis.
b) Line conductor weight, assumed constant during the analysis
c) Wind load on tower elements, assumed constant during the analysis
d) Wind load on line conductor, assumed constant during analysis.
e) Tensile force produced by unbroken line conductor, assumed constant during analysis.
f) Variable tensile force, produce by broken line conductor.
g) Variable broken line conductor load.
h) Variable wind load over one broken line conductor.
SOIL-STRUCTURE INTERACTION A previous result mentioned on ref. 12, indicated that soil shear modulus, G, is an important parameter
to define the dynamic properties of the support tower and the displacements at all the points of the tower
above ground. Also the type of foundation defines the soil-structure interaction. On ref 12 are given
nomograms to asses the foundation stiffness, when the tower bears on top of a square concrete slab with
sides whose length is equal to B, surrounded on its four sides by sheet piling walls, with a depth equal to
D. In order to define foundation stiffnesses, the following parameters were used: D/B, soil shear Young
modulus (G); D was sheet piling depth, and B, width of the upper slab forming the foundation.
Selected foundation
A slab, with dimension B=7,18m was selected to cover all the tower base, with four reinforced concrete
edge beams ( 40cm x 45cm), to support metallic sheet piling walls,1.30 cm thick and 12 m deep; Fy =
3,500 Kg/cm2 y E = 2.10 x 10
6 Kg/cm
2. Sheet piling walls were selected to confine the subsoil inside
them to reduce its compressibility, in order to decrease both displacements and rotations around three
orthogonal directions at the tower base.
Concrete slab strength was equal to f´c = 500 Kg/cm2, selected to reduce excessive cracking produced
by tension developed on top of the slab. Soil shear modulus of elasticity was assumed equal to G = 90
Ton/m2, to represent a low capacity subsoil. It should be mentioned that shear modulus G, for low
capacity soils, have values on the range 60 to 300 Ton/m2.
Foundation stiffnesses. From nomograms obtained from finite element analysis, it was possible to represent the results through
adjusted equations. In what follows, are given the functions to obtain the vertical, horizontal, angular
and torsional foundation stiffness, in terms of soil shear modulus G, and the geometrical dimensions: D,
depth; and B, side length; RLV, vertical lineal stiffness; RLH, horizontal lineal stiffness; RLA, angular
rotational stiffness, and RLT, torsional stiffness:
4346.0B
D5773.4
B
D1895.3
B
D3266.2
GB
RLV23
++++
++++
−−−−
====
.….....…….............……….... (4)
9014.30B
D2813.68
B
D491.126
B
D2037.96
GB
RLH23
++++
++++
−−−−
====
.…….………………….... (5)
0607.0B
D1745.0
B
D5871.5
B
D1085.7
GB
RLA23
3++++
++++
++++
====
…..……………..………..…. (6)
0273.6B
D0207.27
B
D3957.84
B
D9178.167
B
D4499.106
GB
RLT234
3++++
++++
++++
−−−−
====
.................... (7)
By use of these equations, foundation stiffnesses were evaluated.
Table 3. Foundation stiffnesses selected for the tower
For the second support tower, a concrete slab was selected, assuming the subsoil had high capacity. It
was modeled by four finite elements, with 6 springs to represent the stiffness on the nine nodes; Fig. 9
shows the mathematical model selected for the slab foundation under the second support tower.
1 2 3
4 5 6
7 8 9
Fig. 9 Stiffness springs used to model soil structure interaction
SUPPORT TOWER DESIGN REVIEW All members forming the support towers, under axial load, were reviewed by the use of the
recommendations mentioned on the Complementary Technical Norms for Steel Structures Design and
Construction, contained on the Federal District Building Code-2004 (ref. 11): those norms were also
used to check all joints design found on construction drawings.
These check up was done in order to observe the effects of down burst appearance or line conductor
rupture, on the original tower design, based in other recommendations, (ref. 9), commonly used on the
normal design practice for the original tower design, based on isolated tower under static loads; line
conductor rupture also assumes static loads to represent the rupture, on the traditional norms.
COMMENTS ON RESULTS OBTAINED Comments on wind load assessment
A comparison of wind loads obtained by the use of Mexican Norms, (ref. 6), British Standards. (ref. 2)
and Eurocode 2005 (ref. 5) was done; on Fig. 10 are shown the differences obtained; it may be noted
that wind loads evaluated by Mexican norms, were always higher than those obtained from the other
two codes already mentioned.
Fig. 10 Wind forces variation with height for 45º angle of attack
The differences shown are explained, by the assessment of design pressures defined by the norms used.
Both the British Standards and the Eurocode, select design wind velocities that correspond to average
values on 10 min. intervals, whereas the Mexican Norm, recommends design velocities, based on
average values recorded on a 3 sec interval.
Also it should be mentioned that the British Standard, accepts an increment factor associated to wind
direction, and a reduction factor due to minimum temperature; it produces that the wind loads
recommended by the British Standard are the smaller loads shown on Fig. 10. The Eurocode 2005(ref
5), recommends a reduction factor for ultimate axial strength in all members, in order to consider
structure slenderness effects.
On Fig. 11a, comparison is made for the design pressures recommended by each of the methodologies
under analysis, which explains the differences observed on the assessment of wind forces acting on
different heights above ground level
Fig. 11 Computed design pressure used on each studied methodology
On Fig.12 are shown the wind loads produced at different angle of attack, which varied from 0 º, 90 º
and 45 º; the last angle resulted the one that produced maximum loads, because the exposed areas are
the highest of all the angles analyzed. Loads shown on Fig. 12 correspond to wind actions produced by
application of recommendations mentioned on ref.6. From the above mentioned results, it is advisable
to perform wind action analyses, when wind direction forms a 45º angle of attack, with respect to the
line direction, and assess the loads by recommendations given on ref. 6.
Fig. 12 Computed wind loads for different angles for attack, evaluated by CFE handbook
Torsional moments produce by line conductor rupture
Evolution of the torsional moment around the vertical axis of both analyzed towers, is shown on Fig. 13,
at the cross section of the tower near the first cross arm, portion of the tower on which failure has been
detected, according information given by the Federal Commission on Electricity, (ref. 3).
Curves on Fig. 13 represent the evolution on the range 10.5 to 15 sec; on the first 4.5 s, after line
conductor failure; it shows four peaks on the torsional moment value, the second gives the maximum
computed values for both support towers. For the tower on low capacity sub soil, the first peaks shows
an increased value equal to 64.39 %, whereas for the second peak 102.78 % increased was obtained;
these results suggest that the tower failure appears at the first peak, after the line conductor failure, that
is, when t= 11 s.
For the tower with high capacity subsoil, the first maximum on torsional moment value represents a
28.6 percent increase respect to its value with static equilibrium; this increased value, might be
supported without failure by the tower, due to the security factors commonly used on steel design.
However, for the second maximum, there is a 93.36 % increase on torsional moment, condition that
necessarily produces the tower collapse, when t = 12.5 s.
Fig. 13 Torsional moment evolution for towers over different soils
These results clearly indicate the need to consider dynamic effects on the structural analyses of support
tower on electric transmission lines, as well as to consider soil structure interaction, as an important
factor on the design of these types of structures. Usual analyses of isolated towers, under static
equivalent loads, do not take into consideration amplification factors due to the impact loads produced
by cable rupture.
FINAL COMMENTS a) On structural analyses considerations As result of the analyses carried out, it is possible to mention that translations and rotations at the tower
base; displacements atop of the tower and total stresses at the tower members did not showed great
differences when a linear or a non-linear analyses were carried out; nevertheless, it is advisable to rely
on non linear analyses, (differences observed indicated 7 percent variations with respect to the linear
approach), because there is always the possibility of failure of two or more line conductors at the same
time. For this situation, geometrical effects produced by P-δ effect, may be quite important, as
compared with a linear approach.
As a result of the study carried out, it should be recommended that analyses of transmission lines should
consider structural models on which interaction between support towers and line conductors is
reproduced, in order to consider dynamic effects produced by wind action on conductors, and on its
rupture. The study presented in this paper showed the appearance of impact loads on cross arms. It
became evident that the analysis of the isolated support tower produced a design, on which all the
members supported axial loads with allowable code stresses. When a second analysis was carried out on
the design, with due consideration of a complete portion of the line, and the possible rupture of line
conductors, more than 150 members of the tower did not satisfy code requirements.
Also, the structural model of the line should consider soil structure interaction at the tower base, with
due consideration of foundation stiffness. The analysis carried out indicated that for towers over soft
soil, the displacements at its top became 46 percent higher than those computed for the same tower over
a rigid foundation, in orthogonal direction of the line. This result indicates that the tower on rigid
foundation is stiffer than the one on soft soil. Therefore, stability conditions of the line are highly
dependant on subsoil conditions.
b) On cable rupture effects Eight models were reviewed in order to seek for all the possibilities of cables rupture between the two
towers selected as a general structural model, On each model, one cable on different position was
assumed to fail, looking for the worst condition for failure. It was found that when a cable supported by
the lower cross arm fails, its effects become the critical condition for the support tower. This type of
failure produced buckling on diagonals close to the cross arm; they had the longest lengths as compared
with the ones close to the second, third or fourth cross arms, they were the most susceptible to the
torsional effects produce by the cable rupture.
For the tower diagonal members, the dynamic amplification factor became higher as its position became
closer to the failed cable. This study showed that the tower members close to the cross arm where the
cable failed, had dynamic amplifications of its axial load, which became 130 percent on panel 17, while
on panel 1, the dynamic amplification factor was only 80 percent.
c) Effects induced by soil structure interaction On the tower on top a soft soil, axial loads on diagonal members had higher values , as compared to
those of the tower on stiff subsoil; by contrast, axial loads on compression members near the
foundation, had higher values on the tower on top of a stiff foundation, as compared to those on the
tower on top of soft soil. As far as the fail condition on the compression member near the foundation, it
was not produced by buckling of the members; it was produced by premature failure of the connections.
When the connection design was reviewed, it was found that the number of bolts and their diameter
were good enough to support shear forces induced at the connection. Finite element analyses of the
connection plates indicated strong stress concentrations on the holes at the plates, with values over the
elastic limit. This effect was considered the cause of the premature failure of the connection.
Therefore, it seems that there is an absolute need to make finite element analyses of plates and angles
close to connections, to identified stress concentration zones, as well as failure lines on them, in order to
make a better plate thickness selection, to avoid premature connection failure.
REFERENCES [1] Benjamin, Jack R.; Cornell, C. Allin; “Probability, Statistics, and Decision for Civil Engineers”;
McGraw-Hill Book Company; New York, U.S.A.; 1970.
[2] British Standard; Guide to: “Loading and Strength of Overhead Transmission Lines”; 2005.
[3] Comisión Federal de Electricidad. Personal communication..
[4] Electrotecnia: Curso elemental, H. Huvscher, Editorial Reverte, Barcelona, 1987. Sitio de Internet:
www.electrini_inc.com.
[5] European Committee for Standardization; “Eurocode 1: Actions on Structures; Part 1-4: General
Actions-Wind Actions”; April, 2005.
[6] Instituto de Investigaciones Eléctricas; “Manual de Diseño de Obras Civiles - Diseño por Viento”;
CFE; Cuernavaca, Morelos; 1993.
[7] Instituto Mexicano de la Construcción en Acero, A. C.; “Manual de Construcción en Acero -