Dynamic Friction Measurementsat Sliding VelocitiesRepresentative of High-SpeedMachining ProcessesUnderstanding high speed machining processes requires knowledge of the dynamtion response at the tool-workpiece interface, the high strain rate response of the wpiece material and its fracture mechanisms. In this paper, a novel experimental technconsisting in the independent application of an axial static load and a dynamic torquused to investigate time resolved dynamic friction. Shear stress wave propagationan input bar, pressing statically against an output bar, is analyzed. The quasi-statickinetic friction coefficients of Ti-6Al-4V sliding against 1080 Steel, Al 6061-T6 slidagainst 1080 Steel, and Al 6061-T6 sliding against Al 7075-T6, with various surcharacteristics, are investigated. Sliding velocities up to 6.9 m/s are achieved. Suroughness is varied to understand its role on the frictional response of the sliding ifaces. The dependence of friction coefficient on material strain-rate sensitivity isassessed. Measured friction coefficients compared well with values reported in the lture using other experimental techniques. The experimental methodology discussedarticle provides a robust method for direct measurement of the quasi-static and dynfriction coefficients representative of high-speed machining, metal-forming and balpenetration processes.@S0742-4787~00!01304-7#
h
amv
e
r
t
o
hn
e
s, anly
izeres-sentm-nticalribepo-
ain
lablee
ash
of-n-sis.andg
ingtran-
amicstslyntly.
icalderand
ri-dy
de
eh
1 Introduction
Recently, attention has been focused on the mechanics ofspeed machining as a means for increasing manufacturing protivity through reduction of machining time. Some substantial sings have been achieved in the area of machining traditionalterials. However, there are still limitations in the tool life that haprevented advances in the machining of materials having hstrength or hardness such as titanium alloys, high strength stnickel alloys, and ceramics.
Friction is a very important factor in high-speed machining aballistic penetration processes. In fact, friction and wear onrake face as well as on the clearance face play very critical rolethe performance and life of a cutting tool, Komanduri et al.@1#.Other mechanisms such as shear-banding and chip formationan in-depth understanding if the machining process is to beproved, Komanduri et al.@2#. Similarly, friction and material in-stabilities are extremely important in modeling ballistic penettion, see for instance Zukas@3#, Meyers@4#, Camacho and Ortiz@5#, and Espinosa et al.@6,7#.
Another application related to the frictional behavior of marials is in their usage as coatings in components of rotary or linmotion devices. Most devices work lubricated making a studydry friction apparently unnecessary. However, this is the casewhen the machine or device reaches its operational steady sDuring the transient period, in which the devices are cold, in otwords without enough lubrication and sometimes without asolid to solid friction plays a major role. In addition, devices thdue to their complexity or specific use cannot employ oil or aother type of lubrication have to be considered, e.g., inertia wh
1Currently at Northwestern University, Mechanical Engineering, 2145 SheriRd., Evanston, IL 60208-3111, [email protected], http://clifton.mech.nwu.;espinosa
Contributed by the Tribology Division for publication in the ASME JOURNAL OFTRIBOLOGY. Manuscript received by the Tribology Division March 16, 1999; rvised manuscript received April 17, 2000. Associate Technical Editor: J. A. Tic
for steering satellites. In these advanced materials applicationin-depth understanding of their frictional response is highneeded.
A wide variety of experiments are required to fully characterthe friction phenomenon. In such experiments, conditions of psure, velocities, surface characteristics, and temperature, prein applications of interest, need to be achieved. A simple geoetry, from which local interface traction and sliding velocity cabe easily measured, must be employed. In this way, mathemamodels of frictional behavior of interfaces can be used to descthe friction phenomenon. In turn, these models can be incorrated in computational simulations to gain insight into the mfeatures associated to these processes.
Nowadays there are several experimental techniques avaifor the study of dynamic friction. They are basically divided in thfollowing groups:
• Pressure-shear plate impact frictional experiments, Prakand Clifton @8#, Prakash@9# and Espinosa et al.@10#, were em-ployed to investigate time-resolved friction. The configurationfers the simplicity of allowing the interpretation of the experimetal results by using the framework of elastic plane wave analyThese experiments can simulate local conditions of pressureslipping velocities occurring in high speed machininapplications.
• Modified Split-Hopkinson bar method, Ogawa@11#. Thistechnique consists of applying a dynamic axial force to a rotatbar/specimen system. The method can be used to investigatesient response under dynamic loading. To understand the dyncontact of two bodies with initial velocities, the impact load mube applied in the normal and tangential direction simultaneouand the corresponding reactions must be evaluated independeThis methodology is in the early stages of development. Typsliding velocities investigated with this apparatus are on the orof 1–5 m/s. The Kolsky bar apparatus was also used by FengRamesh@12#, in the study of lubricants.
• Pin-on-disk tests, designed for low-velocity friction expements, where the kinetic friction is evaluated only in the stea
andu/
-y.
2000 by ASME Transactions of the ASME
Journal
Fig. 1 Drawing of the stored-torque torsional Kolsky Bar Apparatus. Each gauge station has full strain gagebridge arrangement to measure torsional loads „with an alignment of 45 deg respect to the longitudinal axis ofthe bar … and to measure axial load „aligned parallel to the longitudinal axis of the bar …, except for the bendingstation „half bridge … which monitors the presence of any spurious bending wave transmitted through thespecimen.
a
o
e
T
l
t
xs
a
dy-
tal
ndateith
arutthing
andandf thendergytorat
f a
state condition, see ASM Handbook@13–15#. This is very helpfulin understanding the mechanisms involving degradation of mrial surfaces in contact for a long period of time.
• Various other techniques, ranging from quasi-static contions to very low sliding velocities, primarily used for studyinquasi-static frictional behavior; see, for instance, Anand and T@16#, Anand@17#.
In this article, we start by presenting the design of a modifiKolsky bar apparatus, suitable for the investigation of dynamfriction at sliding velocities between 1 and 7 m/s. The experimtal methodology together with a summary of formulas, usedinterpret the experimental data, are presented. A discussion otime evolution of interfacial friction, in several material pairs,given. The material pairs include the following, Al 6061-T6,6Al-4V, 1080 Steel, and 4340 Steel.
2 Dynamic Friction Experiments
2.1 The Stored-Energy Kolsky Bar. The torsional Kolskybar, also called split-Hopkinson torsional bar, is a reliable apratus for testing materials at strain rates from 102 to 104 s21. In1949, Kolsky used a modified pressure bar to test thin, wafer-specimens at high strain rates, see also Kolsky@18#. The loadingwas accomplished by propagating a compressive wave downof the bars toward the specimen. Measurements of the wavethe elastic bars were made on each side of the specimen. Koshowed that the portion of the incident loading wave that is tramitted through the specimen provides a measure of the axial sin the specimen, while the magnitude of the wave that is reflecis proportional to its strain rate.
The same general analysis applies to torsional loading withgular velocity and shear stress replacing axial velocity and astress. By combining outputs from the strain gages on eitherof the specimen and by integration of the strain rate versus timcomplete record of the stress-strain curve can be obtained eand accurately, Duffy et al.@19#.
Several investigators contributed to the development of thesional Kolsky bar. Duffy et al.@19#, originally used explosiveloading to initiate the loading pulse. This method has the advtage of producing a shorter pulse rise time, whereas a sto
of Tribology
te-
di-gng
edicn-to
f theisi
pa-
ike
ones inlskyns-ressted
an-ialide
e, asily
tor-
an-red-
torque loading system provides potentially a more progressivenamic loading, Gilat and Pao@20#. This last configuration is theone chosen for the design of our dynamic friction experimentechnique.
A stored-energy Kolsky bar, shown schematically in Fig. 1 aafter construction in Fig. 2, was designed and built to investigdynamic friction and compression-shear material behavior wspecimen recovery. It is composed of two 25.4 mm~1 in.!7075-T6 aluminum alloy bars. The so-called incident or input bis 2.3 m ~90.5 in.! long and the so-called transmission or outpbar is 1.9 m~75 in.! long. Each bar is supported along its lengand aligned properly. It is supported by a series of re-circulatball fixed-alignment bearing~INA KBZI6PP! minimizing the fric-tion resistance on the supports and allowing the bar to rotatetranslate freely in both directions. The compression/tensionshear loading pulses are produced by the sudden release ostored elastic energy. This requires both torsional acompression/tension actuators. The axial part of the elastic enis produced by means of a hydraulic double acting actua~Enerpac RD 166! which applies a compressive or tensile loadone end of the incident bar. Its capacity is 35 kip~150 kN!. Thetorsional part of the elastic energy is achieved by means o
Fig. 2 Photograph of the stored-energy Kolsky bar apparatus
OCTOBER 2000, Vol. 122 Õ 835
Fig. 3 „a… Lagrangian X-t diagram of friction experiment with quasi-static axial load and dynamic torque; „b… Lagrangian X-tdiagram of friction experiment with specimen subjected to a single compression-shear pulse.
b
l
l
s
r
theura-tumtactingthend
s ofthethe
y-edsi-
ngthevoidthetingnec-
theion
im-
il-can
hydraulic rotary actuator~Flo-Tork 15000-180-AICB-ST-MS2-RKH-N! located along the incident bar. It is connected to theby a 3/89 steel key. Its capacity is 1700 N•m ~15,000 Ib•in.!. Thesudden release of the stored energy is achieved using a cpositioned between the rotary actuator and the specimen. Thesign of the clamp is crucial for good results. The clamp mustable to hold the desired torque and compression/tension fowithout slippage, and release the stored energy rapidly enoto produce a sharp-fronted stress pulse traveling towardsspecimen.
In the case of friction experiments, the axial load can be appbefore gripping the clamp, i.e., the friction phenomenon is studunder quasi-static pressure conditions and a certain amounangular velocity, or it can be applied dynamically. In the first caupon release of the clamp, a torsional pulse, with constant amtude equal to one half of the stored torque, propagates downbar towards the specimen. Simultaneously, an unloading pulsequal magnitude propagates from the clamp towards the roand axial actuators. The torsional mechanical impedance ofrotary actuator is sufficiently large, that after reflection, the uloading wave reduces the torque in the incident bar to zero apropagates back along the bar. This is proven in the charactetion and calibration process of the bar, see Patanella@21#. TheLagrangianX-t diagram of the quasi-static axial load and shewave propagation is shown in Fig. 3~a!. In the second case, compressive and torsional waves are produced simultaneously.longitudinal and torsional elastic wave fronts, along the bar,shown in Fig. 3~b!. Upon release of the clamp, two waves, longtudinal and shear, are propagated towards the specimen an
836 Õ Vol. 122, OCTOBER 2000
ar
ampde-
berce,ughthe
iediedt ofe,pli-the
e oftarythen-s itiza-
ar-Thearei-d to-
wards the hydraulic actuators. The length of the bars andactuators positions are selected such that the incident pulse dtion can be transferred to the transmission bar before momentrapping caused by the arrival of an unloading wave, to the consurface, from the right end of the transmission bar. This trappconcept is identical to one used by Clifton and co-workers instudy of plate impact with specimen recovery, see Kumar aClifton @22#. It should be noted that since the specimen consisttwo surfaces in contact, separation of the output bar leavesincident bar free to translate and rotate due to the effect ofwaves trapped in the incident bar.
The choice of applying the axial load, quasi-statically or dnamically, is based on the fact that there is a trade off which neto be kept in mind. In fact, if the axial load is applied quasstatically, high sliding velocities can be achieved by maximizithe stored torque. If an axial load is stored by the clamp,magnitude of the storable torque decreases accordingly to asliding at the clamp pads. It should be pointed out here that incase of applying the axial load quasi-statically, the reverberashear waves, after the main pulse, are attenuated and do notessarily produce further sliding. Hence, post-examination ofsliding surfaces can be made to characterize the frictmechanisms.
In our view, the apparatus here described is conceptually spler than the one discussed by Ogawa@11#, and can be easilyobtained through modification of the traditional Kolsky bar avaable at many research laboratories. Moreover, the apparatus
Transactions of the ASME
Fig. 3 „Continued. …
i
o
sf
,e
,o
the
ofis
ulariam-ve-
tor-the
n by
G4,
,the
tted
also be used to study shear banding and dynamic failure ofvanced materials, with specimen recovery, when both compsive and shear pulses are applied.
2.2 Formulas for Dynamic Friction Coefficient Calcula-tions. We start this section by re-examining theX-t Lagrangiandiagram of the torsion bar as shown in Fig. 3~a!. The duration ofthe loading pulse is the time required for the pulse to travel twthe distance along the bar between the clamp and the torsactuator. The pulse duration can be varied by moving the claand torsional actuator positions along the incident bar. The allable relative separation between these devices is about 1 m~40in.!. In that case, the pulse duration can be adjusted up to 650ms.The configuration used in our tests is set to a 290ms pulse.
As the pulse travels down the bar, it is detected by two strgage stations on the incident bar and another one on the tranted bar. Each station consists in a full bridge arrangement ofstrain-gages of 350V ~MM EA-13-250BF-350!. The four straingauges are located at 45 deg respect to the longitudinal axis obar separated 90 deg in the radial direction one from the othermeasuring torsional waves. Four strain-gages, located parallthe longitudinal axis and separated 90 deg in the radial directare used for measuring the longitudinal waves. In each casespecific measurement is independent of any other potential ling on the bar, i.e., the effect of loads different to a torque~in thetorsional gage station! or compression/tension~in the axial gage
Journal of Tribology
ad-res-
iceonalmpw-
ainmit-our
f theforl to
ion,thead-
station!. An extra station is added between the clamp andtorque device to measure the stored static torque.
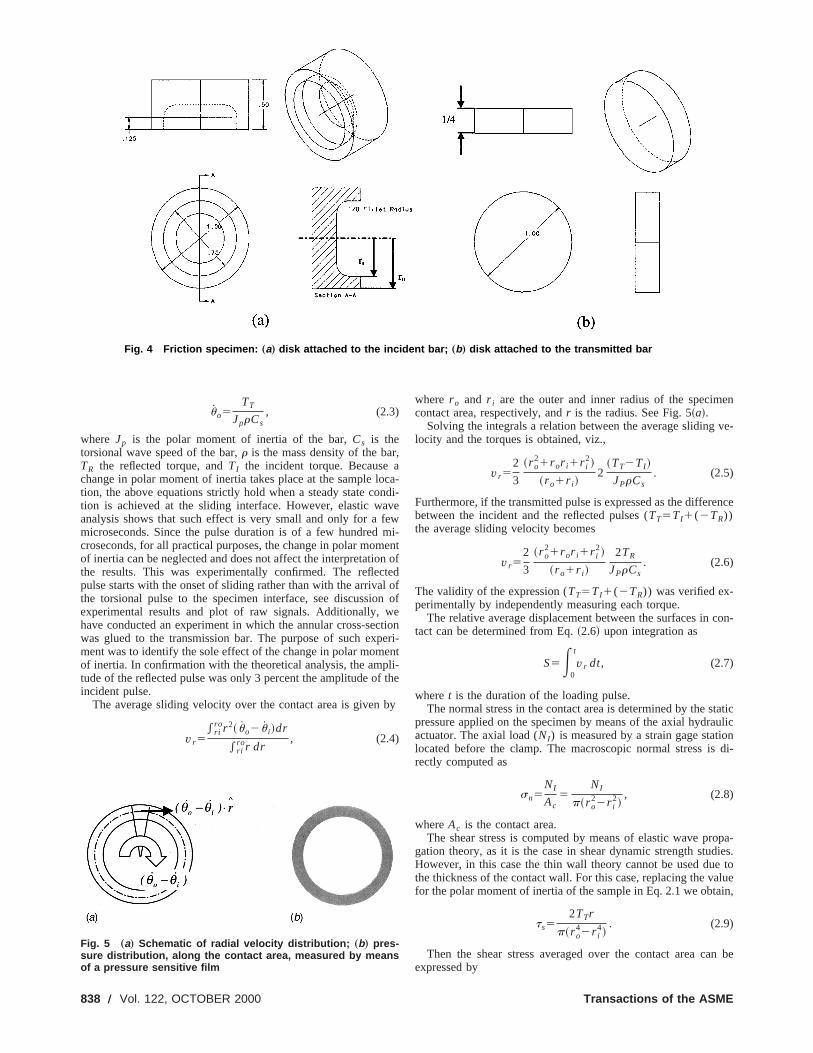
The specimen geometry is shown in Fig. 4. It is composedtwo disks one of which has a hollowed end. The specimendesigned such that an uniform traction is obtained in the anncontact surface. Furthermore, the specimen inner and outer deters are chosen such that an approximately uniform slidinglocity is obtained.
Based on the above description of pre-compression, elasticsional waves and measurement stations, we can infer thatshear frictional stress in the contact area of the sample is give
ts5TT•r
Jps, (2.1)
whereTT is the transmitted torque, measured at gauge stationJps is the contact area polar moment of inertia andr is the cen-terline radius.
The angular velocitiesu̇ i and u̇o , of the input and output barsrepresent the angular velocities at the contact surfaces. Usingmethod of characteristics, see Espinosa et al.@23#, they can beexpressed in terms of the incident, reflected and transmitorques by
u̇ i51
JprCs~Tl2TR! (2.2)
OCTOBER 2000, Vol. 122 Õ 837
838 Õ
Fig. 4 Friction specimen: „a… disk attached to the incident bar; „b… disk attached to the transmitted bar
r
o
f
l
c
en
ve-
nce
con-
taticulicndi-
opa-dies.e toaluein,
n be
u̇o5TT
JprCs, (2.3)
where Jp is the polar moment of inertia of the bar,Cs is thetorsional wave speed of the bar,r is the mass density of the baTR the reflected torque, andTI the incident torque. Becausechange in polar moment of inertia takes place at the sample ltion, the above equations strictly hold when a steady state cotion is achieved at the sliding interface. However, elastic waanalysis shows that such effect is very small and only for amicroseconds. Since the pulse duration is of a few hundredcroseconds, for all practical purposes, the change in polar momof inertia can be neglected and does not affect the interpretatiothe results. This was experimentally confirmed. The reflecpulse starts with the onset of sliding rather than with the arrivathe torsional pulse to the specimen interface, see discussioexperimental results and plot of raw signals. Additionally, whave conducted an experiment in which the annular cross-sewas glued to the transmission bar. The purpose of such expment was to identify the sole effect of the change in polar momof inertia. In confirmation with the theoretical analysis, the amptude of the reflected pulse was only 3 percent the amplitude ofincident pulse.
The average sliding velocity over the contact area is given
v r5* ri
ror 2~ u̇o2 u̇ i !dr
* riror dr
, (2.4)
Fig. 5 „a… Schematic of radial velocity distribution; „b… pres-sure distribution, along the contact area, measured by meansof a pressure sensitive film
Vol. 122, OCTOBER 2000
,aca-
ndi-veewmi-ent
n oftedof
n ofetioneri-entli-the
by
where r o and r i are the outer and inner radius of the specimcontact area, respectively, andr is the radius. See Fig. 5~a!.
Solving the integrals a relation between the average slidinglocity and the torques is obtained, viz.,
v r52
3
~r o21r or i1r i
2!
~r o1r i !2
~TT2TI !
JPrCs. (2.5)
Furthermore, if the transmitted pulse is expressed as the differebetween the incident and the reflected pulses (TT5TI1(2TR))the average sliding velocity becomes
v r52
3
~r o21r or i1r i
2!
~r o1r i !
2TR
JPrCs. (2.6)
The validity of the expression (TT5TI1(2TR)) was verified ex-perimentally by independently measuring each torque.
The relative average displacement between the surfaces intact can be determined from Eq.~2.6! upon integration as
S5E0
t
v r dt, (2.7)
wheret is the duration of the loading pulse.The normal stress in the contact area is determined by the s
pressure applied on the specimen by means of the axial hydraactuator. The axial load (NI) is measured by a strain gage statiolocated before the clamp. The macroscopic normal stress isrectly computed as
sn5NI
Ac5
NI
p~r o22r i
2!, (2.8)
whereAc is the contact area.The shear stress is computed by means of elastic wave pr
gation theory, as it is the case in shear dynamic strength stuHowever, in this case the thin wall theory cannot be used duthe thickness of the contact wall. For this case, replacing the vfor the polar moment of inertia of the sample in Eq. 2.1 we obta
ts52TTr
p~r o42r i
4!. (2.9)
Then the shear stress averaged over the contact area caexpressed by
Transactions of the ASME
Journa
Fig. 6 Sample of roughness analysis with the atomic force microscope DI 3100A
o
.u
sb
n
f
s
to
opes
ee-areaes alumi-gh-
ot oferity-ea-val-tummea-t ofnt in
hattanton-andcon-s the
ofingto
sure-thesure
ta5* ri
ror ts dr
* riror dr
ta52
3
~r o21r or i1r i
2!
~r o1r i !
2TT
p~r o42r i
4!. (2.10)
At this point all the variables needed to compute the fricticoefficientm, are defined. This coefficient is given by the ratbetween shear and normal traction, viz.,
m5ta
sn. (2.11)
The above formulas provide a direct measurement of the qustatic and kinetic frictional properties by using load~strain! histo-ries detected at the output and input bars.
3 Experimental ProcedureA static axial load is applied before the clamp is actuated
hold the torsional load. In this way, the surfaces of the pairmaterials to be tested are pre-stressed with a known pressurevery important that the surfaces in contact constitute an annwith small thickness, where the torsional stress profile canassumed to be almost constant. In this way, an almost conprofile of relative sliding velocity along the radial direction canachieved. For this reason, the specimen geometry, as theshown in Fig. 4, was chosen.
Before the test, each sample was grounded and lapped to ethe flatness and parallelism of their surfaces. A Lapmasterlapping machine, fromCrane Co., and silicon carbide powder o12.5mm was employed. The specimens were cleaned using Mand acetone in an ultrasonic bath for 30 minutes. After that,samples were marked and labeled carefully. Marking was pformed to allow the study of surface changes, in the area
l of Tribology
nio
asi-
toofIt islusbetanteone
sure24
EKtheer-ur-
rounding the mark, after the experiment. The objective wasqualify the friction mechanisms in the pair of materials tested.
To analyze the surface properties, an Atomic Force Microsc~AFM! from Digital Instruments model Dimension 3100A, waused. On each tested sample, an area of 50mm by 50mm about 50mm from the mark was scanned. The surface profile, a thrdimensional micrograph and the average roughness in thatwere taken from each scan, in each sample. Figure 6 providsample of the scanned data and parameters taken from the anum samples. The most important values taken from the rouness analysis, as shown in Fig. 6, are the Rms~Rq! and the Ra.The Rms, root mean square value, is defined as the square rothe deviations and represents the standard deviation of the aspheight distribution, Larsen-Basse@15#. The Ra, average roughness, is the mean vertical height deviation of the asperities msured from the centerline of the surface between peaks andleys, Larsen-Basse@15#. In the section analysis, the mosimportant features are the profile of the section and the maximdistance between valleys and peaks. All these parameters aresured again, after the experiment, to examine the amounroughness change and to infer the friction mechanisms presethe test.
Before clamping the incident bar, it is necessary to check tthe pressure along the contact area is uniform. This very imporvariable in the experiment needs to be verified using a nintrusive method to avoid altering the surface characteristicsalso to avoid adding contaminant elements to the surfaces intact. The simplest method that meets all these requirements iuse of pressure sensitivity films. These films have a layermicro-capsules which are broken under pressure. A color-formmaterial is released, reacting with the color-developing layergenerate a graded color scale. A Fuji Prescale Pressure Meament Film from Fuji Photo Film Co. is used. The pressure incontact area is usually greater than 10 MPa so a medium pres
OCTOBER 2000, Vol. 122 Õ 839
p
s
,
qat
u
n
e
tersd in
go re-pli-isthe
iven
uc-
alarelsen-ain.co-
d-ec-
ient
ue. Ine thefacestaticbe
thehearowns,
ongthetheelsthe
ainoflas-e
scale film is used ranging from 10 MPa to 50 MPa. A sampattern obtained from an experiment is shown in Fig. 5~b!. Theshaded ring represents the contact area and the grade of therepresents the pressure in that interface. The pattern showquite uniform. The same uniformity is kept in all the experimenIf the pressure pattern is non-uniform, the samples have topositioned again or further lapped until a uniform patternachieved.
After the specimen is glued, the pressure distribution oncontact area checked, and the surfaces cleaned, the test isducted. The cleaning is performed using MEK and acetoneeliminate any oil or grease resulting from the contact pressmeasurement, and methanol to eliminate any residues left byacetone.
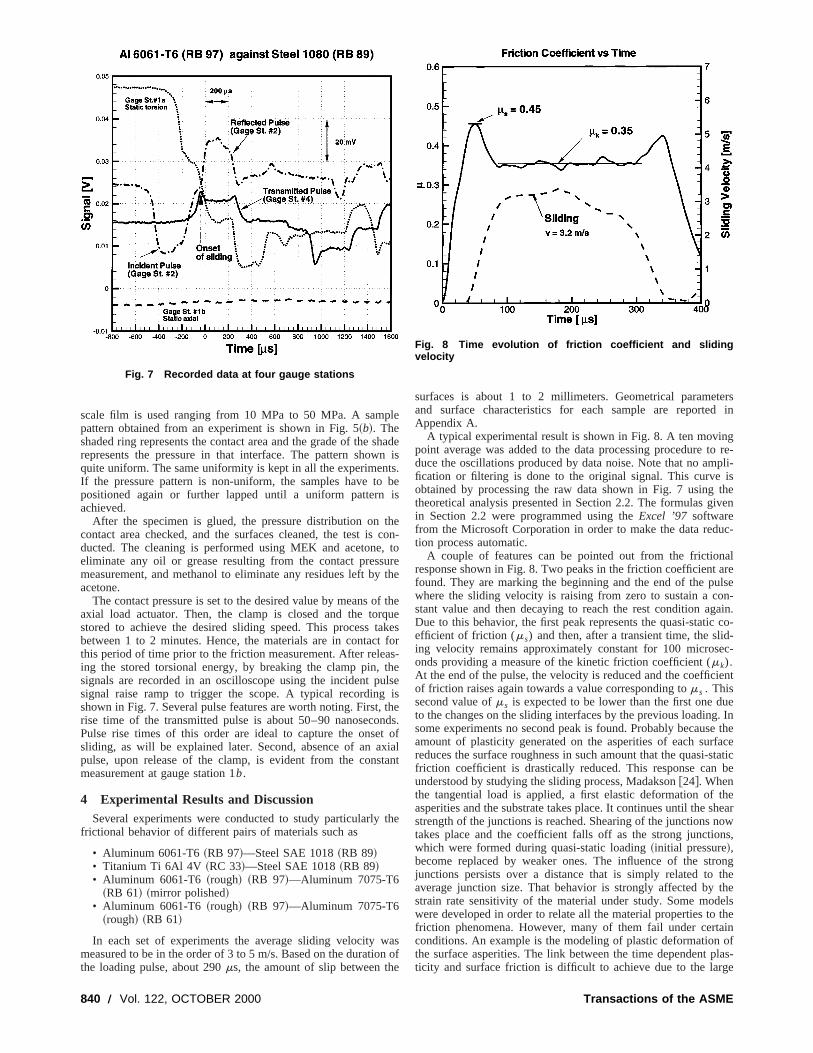
The contact pressure is set to the desired value by means oaxial load actuator. Then, the clamp is closed and the torstored to achieve the desired sliding speed. This process tbetween 1 to 2 minutes. Hence, the materials are in contacthis period of time prior to the friction measurement. After releaing the stored torsional energy, by breaking the clamp pin,signals are recorded in an oscilloscope using the incident psignal raise ramp to trigger the scope. A typical recordingshown in Fig. 7. Several pulse features are worth noting. First,rise time of the transmitted pulse is about 50–90 nanosecoPulse rise times of this order are ideal to capture the onsesliding, as will be explained later. Second, absence of an apulse, upon release of the clamp, is evident from the consmeasurement at gauge station 1b.
4 Experimental Results and DiscussionSeveral experiments were conducted to study particularly
frictional behavior of different pairs of materials such as
In each set of experiments the average sliding velocity wmeasured to be in the order of 3 to 5 m/s. Based on the duratiothe loading pulse, about 290ms, the amount of slip between th
Fig. 7 Recorded data at four gauge stations
840 Õ Vol. 122, OCTOBER 2000
le
haden ists.beis
thecon-to
urethe
f theuekesfors-thelseistheds.
t ofxialtant
the
asn of
surfaces is about 1 to 2 millimeters. Geometrical parameand surface characteristics for each sample are reporteAppendix A.
A typical experimental result is shown in Fig. 8. A ten movinpoint average was added to the data processing procedure tduce the oscillations produced by data noise. Note that no amfication or filtering is done to the original signal. This curveobtained by processing the raw data shown in Fig. 7 usingtheoretical analysis presented in Section 2.2. The formulas gin Section 2.2 were programmed using theExcel ’97 softwarefrom the Microsoft Corporation in order to make the data redtion process automatic.
A couple of features can be pointed out from the frictionresponse shown in Fig. 8. Two peaks in the friction coefficientfound. They are marking the beginning and the end of the puwhere the sliding velocity is raising from zero to sustain a costant value and then decaying to reach the rest condition agDue to this behavior, the first peak represents the quasi-staticefficient of friction (ms) and then, after a transient time, the sliing velocity remains approximately constant for 100 microsonds providing a measure of the kinetic friction coefficient (mk).At the end of the pulse, the velocity is reduced and the coefficof friction raises again towards a value corresponding toms . Thissecond value ofms is expected to be lower than the first one dto the changes on the sliding interfaces by the previous loadingsome experiments no second peak is found. Probably becausamount of plasticity generated on the asperities of each surreduces the surface roughness in such amount that the quasi-friction coefficient is drastically reduced. This response canunderstood by studying the sliding process, Madakson@24#. Whenthe tangential load is applied, a first elastic deformation ofasperities and the substrate takes place. It continues until the sstrength of the junctions is reached. Shearing of the junctions ntakes place and the coefficient falls off as the strong junctiowhich were formed during quasi-static loading~initial pressure!,become replaced by weaker ones. The influence of the strjunctions persists over a distance that is simply related toaverage junction size. That behavior is strongly affected bystrain rate sensitivity of the material under study. Some modwere developed in order to relate all the material properties tofriction phenomena. However, many of them fail under certconditions. An example is the modeling of plastic deformationthe surface asperities. The link between the time dependent pticity and surface friction is difficult to achieve due to the larg
Fig. 8 Time evolution of friction coefficient and slidingvelocity
Transactions of the ASME
al
n
i
o
t
osf
sning
urev-
en-icmen-eri-ithrtessoef-
othicals andd in
is of
number of variables involved in the friction phenomena, Madson @24# and Martins et al.@25#. Some models have successfulincorporated material strain rate sensitivity on the predictionthe friction coefficient, as described by Brechet and Estrin@26#.These models may provide valuable tools to further understthe experimental observations here discussed. The key featuthat the measurement shown in Fig. 8 provides insight intoevolution of friction.
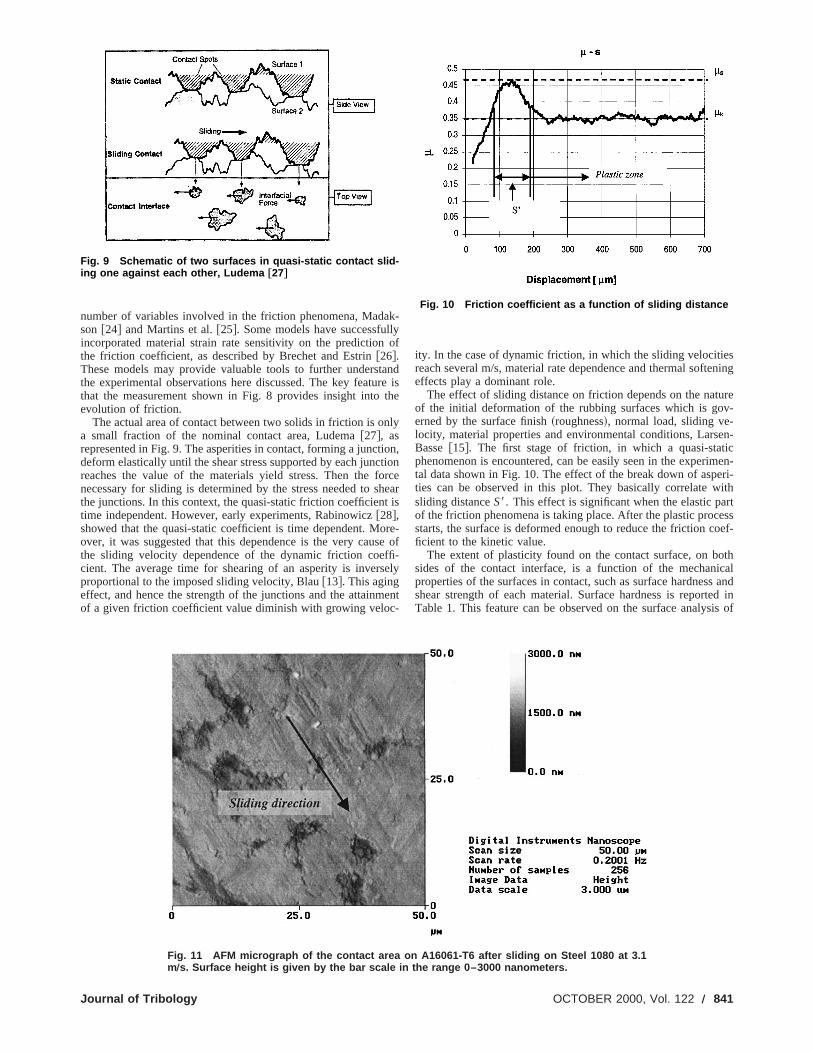
The actual area of contact between two solids in friction is oa small fraction of the nominal contact area, Ludema@27#, asrepresented in Fig. 9. The asperities in contact, forming a junctdeform elastically until the shear stress supported by each juncreaches the value of the materials yield stress. Then the fnecessary for sliding is determined by the stress needed to sthe junctions. In this context, the quasi-static friction coefficientime independent. However, early experiments, Rabinowicz@28#,showed that the quasi-static coefficient is time dependent. Mover, it was suggested that this dependence is the very cauthe sliding velocity dependence of the dynamic friction coecient. The average time for shearing of an asperity is inversproportional to the imposed sliding velocity, Blau@13#. This agingeffect, and hence the strength of the junctions and the attainmof a given friction coefficient value diminish with growing veloc
Fig. 9 Schematic of two surfaces in quasi-static contact slid-ing one against each other, Ludema †27‡
Journal of Tribology
k-yof
andre isthe
ly
on,tionrcehearis
re-e offi-ely
ent-
ity. In the case of dynamic friction, in which the sliding velocitiereach several m/s, material rate dependence and thermal softeeffects play a dominant role.
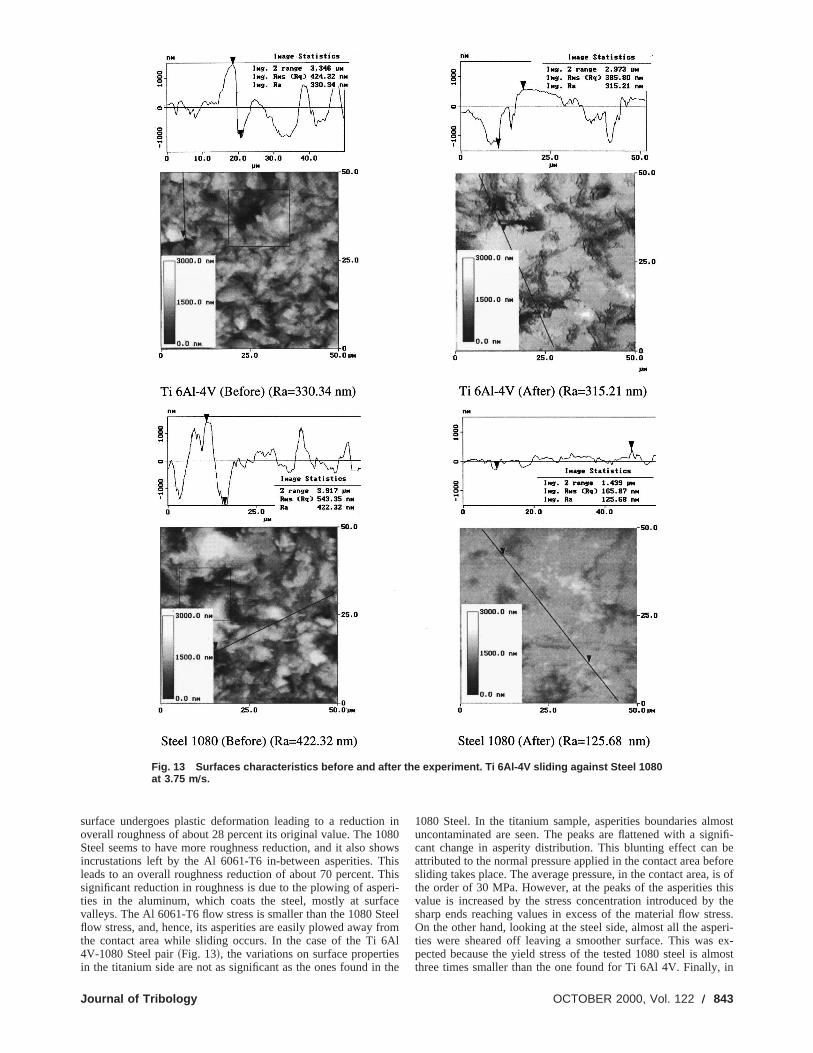
The effect of sliding distance on friction depends on the natof the initial deformation of the rubbing surfaces which is goerned by the surface finish~roughness!, normal load, sliding ve-locity, material properties and environmental conditions, LarsBasse@15#. The first stage of friction, in which a quasi-statphenomenon is encountered, can be easily seen in the experital data shown in Fig. 10. The effect of the break down of aspties can be observed in this plot. They basically correlate wsliding distanceS8. This effect is significant when the elastic paof the friction phenomena is taking place. After the plastic procstarts, the surface is deformed enough to reduce the friction cficient to the kinetic value.
The extent of plasticity found on the contact surface, on bsides of the contact interface, is a function of the mechanproperties of the surfaces in contact, such as surface hardnesshear strength of each material. Surface hardness is reporteTable 1. This feature can be observed on the surface analys
Fig. 10 Friction coefficient as a function of sliding distance
Fig. 11 AFM micrograph of the contact area on A16061-T6 after sliding on Steel 1080 at 3.1mÕs. Surface height is given by the bar scale in the range 0–3000 nanometers.
OCTOBER 2000, Vol. 122 Õ 841
thetionastactperi-be-
achore
2,nalcesT6
Table 1 Summary of experimental results
842 Õ Vol. 122, OCTOBER 2000
tested samples, in which the harder material, i.e., the one withhigher flow stress, presents significantly less plastic deformathan the softer material. The plastic deformation is foundscratches left by the asperities of the harder material in the conarea, see Fig. 11. Grooves generated due to the plowing of asties and blunting of asperities peaks are also observed. Thishavior is illustrated in Figs. 12–14, where the contact area of epair of tested materials is shown with their characteristics befand after the experiment.
A careful examination of the AFM data presented in Figs. 113, and 14 reveals how material properties change the frictiobehavior of the interfaces, and how friction can alter the surfain contact. For example, in the case of Fig. 12, the Al 6061-
Fig. 12 Surfaces characteristics before and after the experiment. Al 6061-T6 sliding against Steel1080 at 3.1 m Õs. Image statistics performed along black lines.
Transactions of the ASME
Journal of T
Fig. 13 Surfaces characteristics before and after the experiment. Ti 6Al-4V sliding against Steel 1080at 3.75 m Õs.
n0hhTeatf
ostnifi-beforeis ofthisthe
ress.eri-ex-
lmostin
surface undergoes plastic deformation leading to a reductiooverall roughness of about 28 percent its original value. The 1Steel seems to have more roughness reduction, and it also sincrustations left by the Al 6061-T6 in-between asperities. Tleads to an overall roughness reduction of about 70 percent.significant reduction in roughness is due to the plowing of aspties in the aluminum, which coats the steel, mostly at surfvalleys. The Al 6061-T6 flow stress is smaller than the 1080 Sflow stress, and, hence, its asperities are easily plowed awaythe contact area while sliding occurs. In the case of the Ti 64V-1080 Steel pair~Fig. 13!, the variations on surface propertiein the titanium side are not as significant as the ones found in
ribology
in80owsishisri-ceeelromAlsthe
1080 Steel. In the titanium sample, asperities boundaries almuncontaminated are seen. The peaks are flattened with a sigcant change in asperity distribution. This blunting effect canattributed to the normal pressure applied in the contact area besliding takes place. The average pressure, in the contact area,the order of 30 MPa. However, at the peaks of the asperitiesvalue is increased by the stress concentration introduced bysharp ends reaching values in excess of the material flow stOn the other hand, looking at the steel side, almost all the aspties were sheared off leaving a smoother surface. This waspected because the yield stress of the tested 1080 steel is athree times smaller than the one found for Ti 6Al 4V. Finally,
OCTOBER 2000, Vol. 122 Õ 843
844 Õ Vo
Fig. 14 Surfaces characteristics before and after the experiment. Al 6061-T6 rough sliding at 3.1 m Õsagainst Al 7075-T6 mirror polished.
ro
T
ticu-ivenent isbe
butpair.bleiondif-
the last example, Fig. 14, the amount of change found inmirror-polished Al 7075-T6 surface is large when compared wits original state. There are a large number of scratches geneby the asperities of the other sliding surface on the mirrpolished surface, which roughness is more than 10 times the onal value. This particular case will be discussed in more delater in this section because of the observed peculiar time evtion of the friction coefficient.
A summary of experimental results together with the paraeters obtained for each type of experiment is listed in Table 1.
l. 122, OCTOBER 2000
theithatedr-
rigi-tailolu-
m-he
data is presented taking the average value found in every parlar set of experiments. The computed standard deviation is gbetween parentheses. The complete data set for each experimreported in Appendix A. The scatter found in the data canattributed to the many variables involved in the experiment,after several experiments a clear trend can be drawn for eachThe deviation falls in the order of 10 percent which is acceptafor engineering applications. Moreover, the quasi-static frictcoefficients obtained are in agreement with data reported byferent investigators using other test methods.
Transactions of the ASME
t
h
c
ue.
dt
inst
n.kythe
o-inow
ostto
ractthes of
es.i-
. Inthe
ur-ated
y a
The measured time evolution of the friction coefficients cancompared to friction coefficients reported in various referencBlau @13#, Rabinowicz@28,29#. The friction coefficient betweensolids under non-zero normal force is a function of several facwhose relative contributions vary on a test-by-test basis makdifficult the homogenization of the reported values. The fact tthe obtained quasi-static friction coefficients are within the ranreported in the literature shows the validity of the procedure hpresented. One should be aware of the shortcomings in compafriction coefficients obtained by various investigators. Valuesported by Blau@13#, in the ASM handbook suggest a good mat
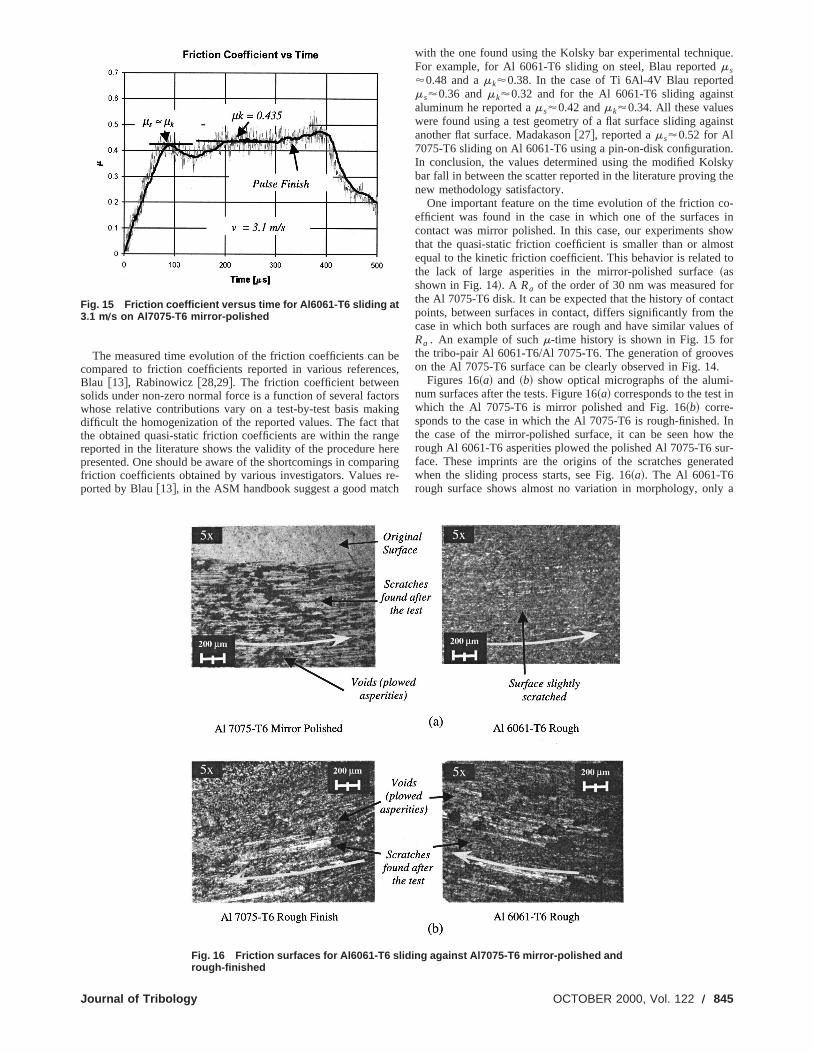
Fig. 15 Friction coefficient versus time for Al6061-T6 sliding at3.1 mÕs on Al7075-T6 mirror-polished
Journal of Tribology
bees,
orsingatgeereringre-h
with the one found using the Kolsky bar experimental techniqFor example, for Al 6061-T6 sliding on steel, Blau reportedms'0.48 and amk'0.38. In the case of Ti 6Al-4V Blau reportems'0.36 andmk'0.32 and for the Al 6061-T6 sliding againsaluminum he reported ams'0.42 andmk'0.34. All these valueswere found using a test geometry of a flat surface sliding agaanother flat surface. Madakason@27#, reported ams'0.52 for Al7075-T6 sliding on Al 6061-T6 using a pin-on-disk configuratioIn conclusion, the values determined using the modified Kolsbar fall in between the scatter reported in the literature provingnew methodology satisfactory.
One important feature on the time evolution of the friction cefficient was found in the case in which one of the surfacescontact was mirror polished. In this case, our experiments shthat the quasi-static friction coefficient is smaller than or almequal to the kinetic friction coefficient. This behavior is relatedthe lack of large asperities in the mirror-polished surface~asshown in Fig. 14!. A Ra of the order of 30 nm was measured fothe Al 7075-T6 disk. It can be expected that the history of contpoints, between surfaces in contact, differs significantly fromcase in which both surfaces are rough and have similar valueRa . An example of suchm-time history is shown in Fig. 15 forthe tribo-pair Al 6061-T6/Al 7075-T6. The generation of groovon the Al 7075-T6 surface can be clearly observed in Fig. 14
Figures 16~a! and ~b! show optical micrographs of the alumnum surfaces after the tests. Figure 16~a! corresponds to the test inwhich the Al 7075-T6 is mirror polished and Fig. 16~b! corre-sponds to the case in which the Al 7075-T6 is rough-finishedthe case of the mirror-polished surface, it can be seen howrough Al 6061-T6 asperities plowed the polished Al 7075-T6 sface. These imprints are the origins of the scratches generwhen the sliding process starts, see Fig. 16~a!. The Al 6061-T6rough surface shows almost no variation in morphology, onl
Fig. 16 Friction surfaces for Al6061-T6 sliding against Al7075-T6 mirror-polished andrough-finished
OCTOBER 2000, Vol. 122 Õ 845
tlhve
t
g
w
e
m
p
v
e
opi
ot
g
r
rq
p
ns
af
ressreThe
ichnda-ighownasings of
nda-nge-r.a J.ose
dis-berepro-ky
bo-asyheago-tedearareed
d in
mkyultsre
r the
small reduction in roughness can be measured. No deep scracan be seen in its surface. The same behavior was found in asamples studied where one of the surfaces was mirror polisWhen the same pair of materials is tested with both sides hasimilar roughness, the value of the quasi-static friction coefficideparts from the kinetic one~ms'0.466,mk'0.342 at 3.22 m/s,reported in Table 1!. The quasi-static friction coefficient is highethan the one encountered for the case discussed previously~ms'mk'0.41 at 3.45 m/s!. This change in the friction coefficientakes place because the friction mechanism changes whensurfaces are rough. The interlocking mechanism results in a hims . When the shear stress produced by the shear wave, reacvalue close to the material flow stress, the asperities are ploand sheared reducing the frictional coefficient. This can be seethe micrograph shown in Fig. 16~b!. Here, no new asperities argenerated. By contrast, some are eliminated. Both surfashowed a marked deformation with holes left by imprints ascratches of the same magnitude in both surfaces. This exashows the importance of roughness and plasticity in the frictphenomena and how it can affect the frictional response of aof materials in contact.
Many parameters can be varied to study the frictional behaof materials. Various combinations of sliding velocities, pressuand roughness of the surfaces need to be tested. The paramin all the conducted experiments, were kept in a narrow rangorder to investigate the repeatability of the measurementsroughness effects. In this way, the measured friction coefficiewere compared with values reported in the literature, to validour experimental approach. In-depth frictional studies in othervanced materials will be reported in future publications.
5 ConclusionsA new testing technique was developed by modifying the K
sky apparatus. A dynamic shear stress and a staticcompression are applied, independently. This leads to a uncapability to investigate the dynamic friction of several typesindustrial processes and ballistic penetration. Stress wave prgation of a torque stored in the input bar, traveling throughspecimen towards the output bar, was analyzed and experimtally verified. During the verification process, dynamic frictiostudies of Steel, Aluminum and Titanium alloys were carried o
The normal and tangential forces were directly and indepdently recorded by the measurement of the incident, reflectedtransmitted pulses in the input and output bars. Thus, givindirect reading of the sliding speed and friction coefficient. Tquasi-static and kinetic friction coefficients for various materpairs were obtained. The kinetic friction coefficient was obtainin a range of sliding velocity up to 7 m/s for different contapressures. Short sliding distances~1 to 2 mm! permit the study ofthe surfaces, on the recovered samples, providing insight intoearly frictional mechanisms. The velocity dependence of the ftion coefficient and its relationship with the strain rate sensitivof the materials was inferred from the experimental measuments. In the investigation here reported, the contact pressuapplied quasi-statically to be able to maximize the applied torand hence maximize the sliding velocity. However, as discuspreviously, for the recovery of specimens subjected to a sinshear pulse, the simultaneous generation of both axial andsional waves is needed. In this way, microscopy studiesformed on the surfaces in contact can be correlated to the msured dynamic friction coefficient without ambiguity.
The modified Kolsky bar was validated performing experimein similar materials that other researchers previously studied udifferent techniques. In this study, sliding velocities in the ran1–7 m/s were achieved. These sliding velocities are particulrelevant to high speed machining, metal forming and otherdeformation processes. The quasi-static and dynamic frictionefficients obtained in this investigation are in agreement with vues reported in the literature.
846 Õ Vol. 122, OCTOBER 2000
chesl theed.ingnt
r
bothher
hes aed
n in
cesnd
pleionair
iorre,eters,
inandntsatead-
l-re-
queofpa-
heen-
nut.en-and
aheialedct
theic-ityre-e isue
sedgletor-er-ea-
tsing
gerlyastco-al-
The experimental technique discussed in this paper can addboth dynamic friction and shear band instabilities, which apresent in high speed machining processes of hard metals.cutting action of material during machining is a process in whchip generation, material imperfections left on the workpiece awear of the tool are very important problems in industry. By anlyzing the shear behavior of the material to be machined at hstrain-rates, the parameters needed for optimum chip breakdcan be understood. Furthermore, parameters needed for incretool life and surface integrity can be determined by the analysifrictional behavior of material pairs in dynamic contact.
AcknowledgmentsThis research was supported by the National Science Fou
tion through Career award No. CMS-9624364, by ONR-YouInvestigator Award No. N00014-97-1-0550, and by the Army Rsearch Office through MURI grant No. DAAH04-96-1-0331. MPatanella was supported by the YPF S. A. Foundation throughA. Estenssoro Fellowship. The authors would like to thank AmGilat for providing very valuable insight during the design of thKolsky bar and the friction set up.
Appendix ADuring the review of this manuscript, Rajagopalan et al.@30#,
published an article describing a technique similar to the onecussed in this paper. However, the techniques differ in a numof key features. The approach here presented ensures better rducibility, high quality signals, and the use of the standard Kolsbar commonly employed for high strain rate studies in many laratories. No additional alignment fixtures that prevent an everification of the planarity of the surfaces in contact, prior to texecution of the experiments, are needed. Furthermore, Rajpalan’s technique resulted in high time variations in the reporfriction coefficient histories, see Figs. 14, 15 and 16 in his Warticle. Variations in friction coefficient as high as 100 percentobserved at quite uniform sliding velocities. The time resolvfriction coefficient, measured by Rajagopalan et al.@30#, does notcapture the onset of sliding~quasi-static friction coefficient! andthe transient to an almost constant sliding velocity as reportethis paper.
The authors would like to mention that Professor J. Duffy, froBrown University, performed friction experiments using a Kolstorsional bar and quasi-static compression in 1989. The resobtained in his pioneer work lacked reproducibility and therefowere not published. Nonetheless, they served as inspiration fotechnique and results here reported.
Appendix B: Specimen dimensions, roughness, and fric-tion data
Table 3 Surface roughness for Aluminum Al 6061-T6 slidingagainst Al 7075-T6 mirror polished
Table 4 Surface roughness for aluminum Al 6061-T6 slidingagainst Al 7075-T6 rough finished
Table 5 Surface roughness for Titanium Ti 6Al-4V slidingagainst Steel SAE 1080
Journal of Tribology
References@1# Komanduri, R., Merchant, M. E., and Shaw, M. C., 1993, ‘‘U.S. Machini
and Grinding Research in the 20th Century,’’ Appl. Mech. Rev.,46, pp. 69–132.
@2# Komanduri, R., Schroeder, T., Hazra, J., von Turkovich, B. F., and Flom,G., 1982, ‘‘On the Catastrophic Shear Instability in High Speed Machiningan AISI 4340 Steel,’’ J. Eng. Ind.,104, pp. 121–131.
@3# Zukas J. A., 1990,High Velocity Impact Dynamic, John Wiley & Sons, NewYork.
@4# Meyers, M. A., 1994,Dynamic Behavior of Materials, John Wiley & Sons,New York, NY.
@5# Camacho, G. T., and Ortiz, M., 1996, ‘‘Computational Modeling of ImpaDamage in Brittle Materials,’’ Int. J. Solids Struct.,33, No. 20–22, pp. 2899–2938.
@6# Espinosa, H. D., Dwivedi, S., Zavattieri, P. D., and Yuan, G., 1998, ‘‘Numecal Investigation of Penetration in Multi-Layered Structure/Material SystemInt. J. Solids Struct.,35, No. 22, pp. 2975–3001.
@7# Espinosa, H. D., Zavattieri, P. D., and Emore, G. L., 1998, ‘‘Adaptive FEComputation of Geometric and Material Nonlinearities with ApplicationBrittle Failure,’’ Special Issue of Mechanics of Materials, H. D. Espinosa, andR. J. Clifton, Mech. Mater.,29, pp. 275–305.
@8# Prakash, V., and Clifton, R., 1993, ‘‘Time Resolved Dynamic Friction Mesurement in Pressure-Shear,’’ ASME, AMD-165, pp. 33–48.
@9# Prakash, V., 1995, ‘‘Pressure-Shear Plate Impact Experiment for InvestigaTransient Friction,’’ Exp. Mech.,35, No. 4, pp. 329–336.
@10# Espinosa, H. D., Mello, M., and Xu, Y., 1997, ‘‘A Variable Sensitivity Displacement Interferometer with Application to Wave Propagation Expements,’’ J. Appl. Mech.,64, pp. 123–131.
@11# Ogawa, K., 1997, ‘‘Impact Friction Test Method by Applying Stress WavesExp. Mech.,37, pp. 398–402.
@12# Feng, R., and Ramesh, K. T., 1993, ‘‘Rheology of Lubricants at High ShRates,’’ J. Tribol.,115, No. 4, pp. 640–649.
@13# Blau, P. J., 1992, ‘‘Static and Kinetic Friction Coefficients for Selected Marials,’’ ASM Handbook, Vol. 18, ASM International, Materials Park, OH, Appendix, pp. 70–75.
@14# Larsen-Basse, J., 1992, ‘‘Introduction to Friction,’’ASM Handbook, Vol. 18,Friction, Lubrication and Wear of Materials, ASM International, MaterialsPark, OH, pp. 25–26.
@15# Larsen-Basse, J., 1992, ‘‘Basic Theory of Solid Friction,’’ASM Handbook,Vol. 18, Friction, Lubrication and Wear of Materials, pp. 27–38.
@16# Anand, L., and Tong, W., 1993, ‘‘A Constitutive Model for Friction in Forming,’’ Ann. CIRP, 42, pp. 361–366.
@17# Anand, L., 1993, ‘‘A Constitutive Model for Interface Friction,’’ ComputMech.,12, pp. 197–213.
@18# Kolsky, H., 1963,Stress Waves in Solids, Dover Publications, New York.@19# Duffy, J., Hawley, R. H., and Hartley, K. A., 1995, ‘‘The Torsional Kolsk
@20# Gilat, A., and Pao, Y. H., 1988, ‘‘High-Rate Decremental-Strain-Rate TesExp. Mech.,28, pp. 322–325.
@21# Patanella, A. J., 1998, ‘‘A Novel Experimental Technique for Dynamic Frtion Studies,’’ M.Sc. thesis, Purdue University, West Lafayette, IN.
Table 6 Friction experimental results
OCTOBER 2000, Vol. 122 Õ 847
i
o
,
of
talar,
@22# Kumar, P., and Clifton, R. J., 1979, ‘‘Dislocation Motion and GenerationLiF Single Crystals Subjected to Plate Impact,’’ J. Appl. Phys.,50, p. 4747.
@23# Espinosa, H. D., Patanella, A. J., and Fischer, M., 2000, ‘‘A Novel DynamFriction Experiment Using A Modified Kolsky Bar Apparatus,’’ to appearExp. Mech.40, No. 3, pp. 1–10.
@24# Madakson, P. B., 1983, ‘‘The Frictional Behavior of Materials,’’ Wear,87, pp.191–206.
@25# Martins, J. A. C., Oden, J. T., and Simo˜es, F. M., 1990, ‘‘A Study of Static andKinetic Friction,’’ J. Eng. Sci.,28, No. 1, pp. 29–92.
@26# Brechet, Y., and Estrin, Y., 1994, ‘‘The Effect of Strain Rate Sensitivity
848 Õ Vol. 122, OCTOBER 2000
in
icn
n
Dynamic Friction of Metals,’’ Scr. Metall. Mater.,30, No. 11, pp. 1449–1454.@27# Ludema, K. C., 1996,Friction, Wear, Lubrication, CRC Press, Boca Raton
FL.@28# Rabinowicz, E., 1951, ‘‘The Nature of the Static and Kinetic Coefficients
Friction,’’ J. Appl. Phys.,22, No. 11, pp. 1373–1379.@29# Rabinowicz, E., 1995,Friction and Wear of Materials, John Wiley & Sons,
New York.@30# Rajagopalan, S., Irfan, M. A., and Prakash, V., 1999, ‘‘Novel Experimen
Techniques for Investigating Time Resolved High Speed Friction,’’ We225-229, pp. 1222–1237.


![Solid friction at high sliding velocities: an explicit 3D ... · recognized that friction plays probably a fundamental role in the mechanics of earth-quakes [Brace and Byerlee, 1966].](https://static.documents.pub/doc/80x56/5f8c0df605b40d48b759e1a9/solid-friction-at-high-sliding-velocities-an-explicit-3d-recognized-that-friction.jpg)


