25
DYNAMIC GROWTH CONTINUES – RECORD SALES IN ALL REGIONS SIKA INVESTOR PRESENTATION, JANUARY 15, 2015

DYNAMIC GROWTH CONTINUES – RECORD SALES IN ALL REGIONS
SIKA INVESTOR PRESENTATION, JANUARY 15, 2015
1. HIGHLIGHTS AND SALES 2014
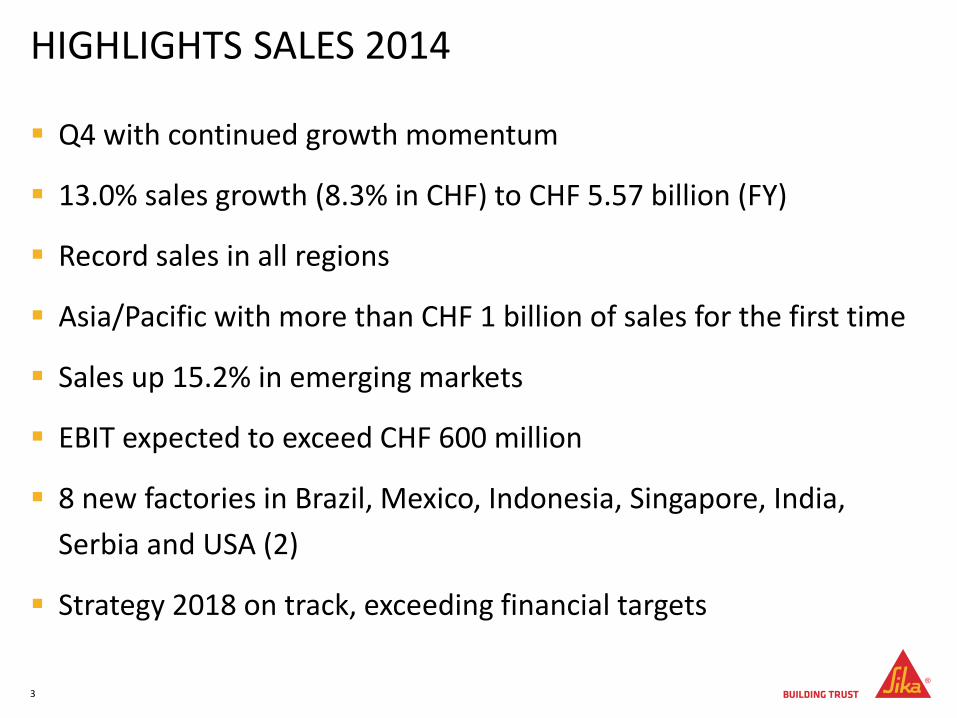
HIGHLIGHTS SALES 2014 Q4 with continued growth momentum
13.0% sales growth (8.3% in CHF) to CHF 5.57 billion (FY)
Record sales in all regions
Asia/Pacific with more than CHF 1 billion of sales for the first time
Sales up 15.2% in emerging markets
EBIT expected to exceed CHF 600 million
8 new factories in Brazil, Mexico, Indonesia, Singapore, India,
Serbia and USA (2)
Strategy 2018 on track, exceeding financial targets
3
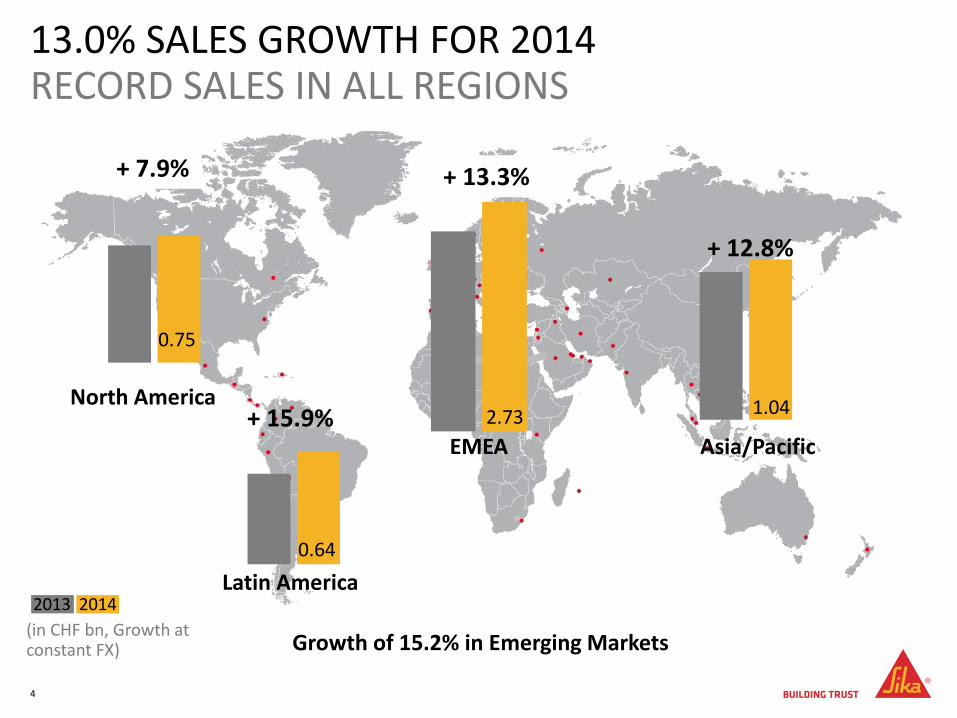
+ 15.9%
+ 13.3%
+ 12.8%
+ 7.9%
13.0% SALES GROWTH FOR 2014 RECORD SALES IN ALL REGIONS
4
0.75
0.64
1.04 North America
Latin America
EMEA Asia/Pacific
(in CHF bn, Growth at constant FX)
2013 2014
2.73
Growth of 15.2% in Emerging Markets
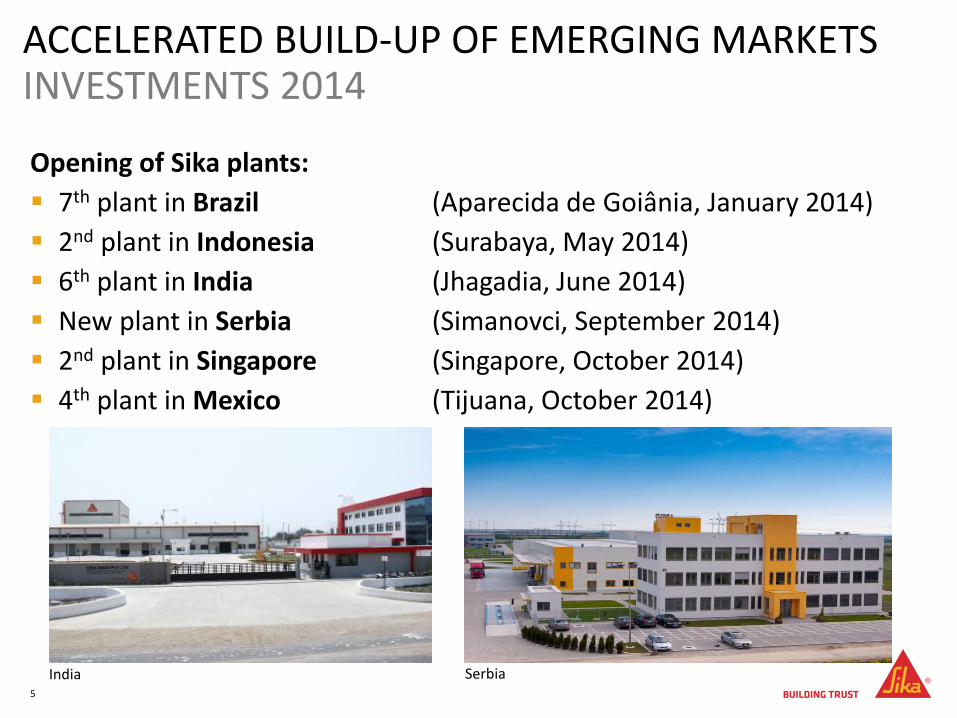
Opening of Sika plants:
7th plant in Brazil (Aparecida de Goiânia, January 2014)
2nd plant in Indonesia (Surabaya, May 2014)
6th plant in India (Jhagadia, June 2014)
New plant in Serbia (Simanovci, September 2014)
2nd plant in Singapore (Singapore, October 2014)
4th plant in Mexico (Tijuana, October 2014)
ACCELERATED BUILD-UP OF EMERGING MARKETS INVESTMENTS 2014
5
India Serbia
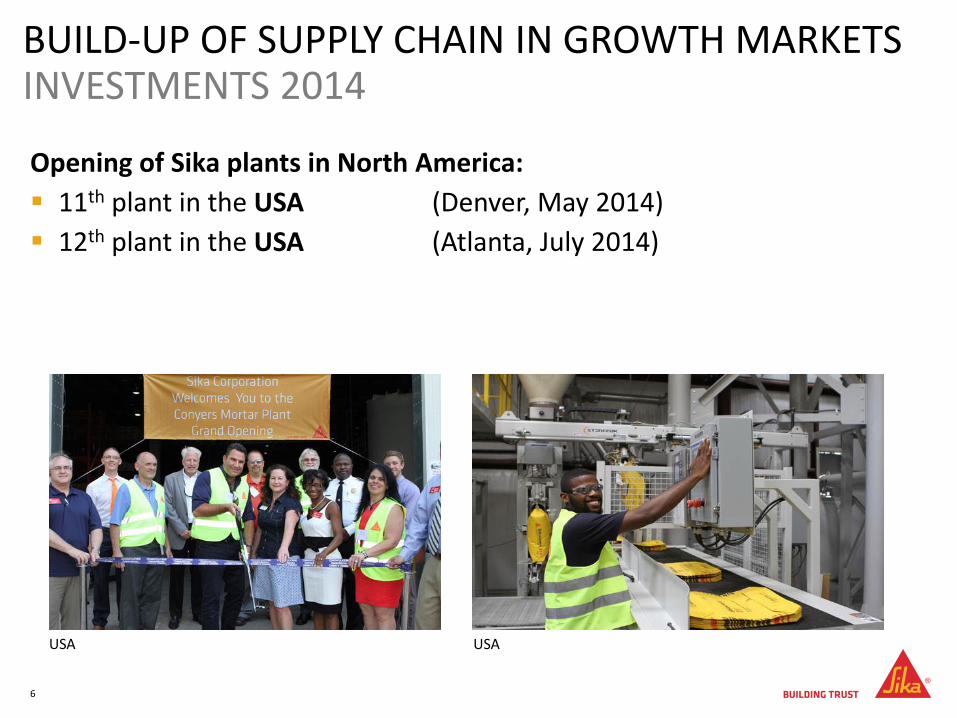
Opening of Sika plants in North America:
11th plant in the USA (Denver, May 2014)
12th plant in the USA (Atlanta, July 2014)
BUILD-UP OF SUPPLY CHAIN IN GROWTH MARKETS INVESTMENTS 2014
6
USA USA
2. SALES PERFORMANCE 2014
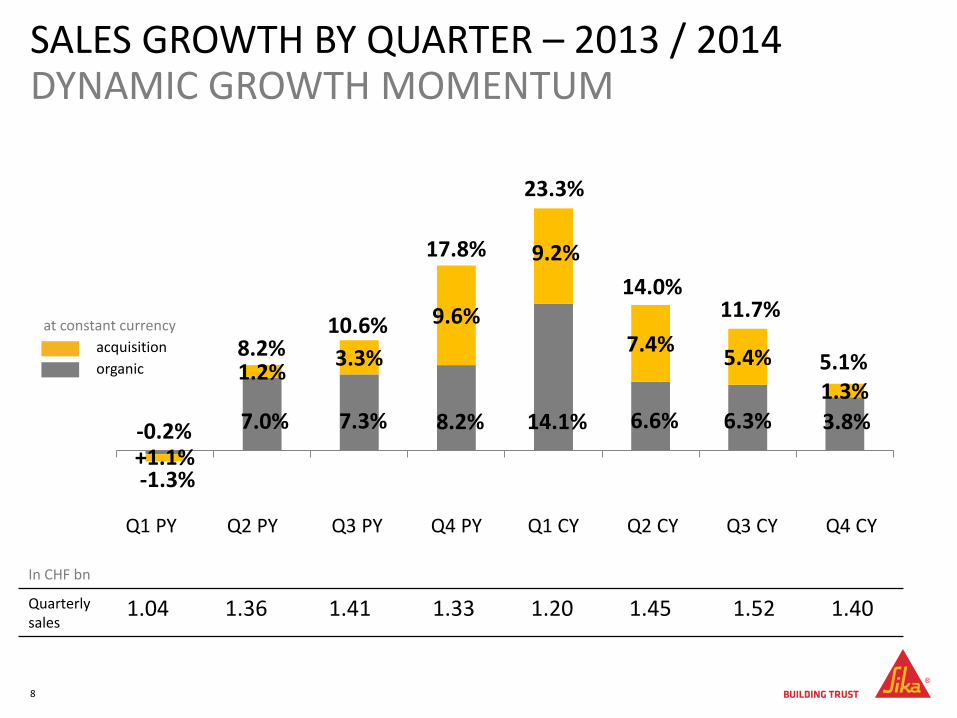
-1.3%
7.0% 7.3% 8.2% 14.1% 6.6% 6.3%
5.1%
+1.1%
1.2% 3.3%
9.6%
9.2%
7.4% 5.4%
1.3%
SALES GROWTH BY QUARTER – 2013 / 2014 DYNAMIC GROWTH MOMENTUM
8
-0.2%
8.2% 10.6%
17.8%
Q1 PY Q2 PY Q3 PY Q4 PY Q1 CY Q2 CY Q3 CY Q4 CY
QuarterlyS 1’043.1 1’359.4 1’405.2 1’334.5 1’206.2 1’450.7
23.3%
14.0% 11.7%
3.8%
at constant currency
acquisition
organic
Quarterly sales
1.04 1.36 1.41 1.33 1.20 1.45 1.52 1.40
In CHF bn
9
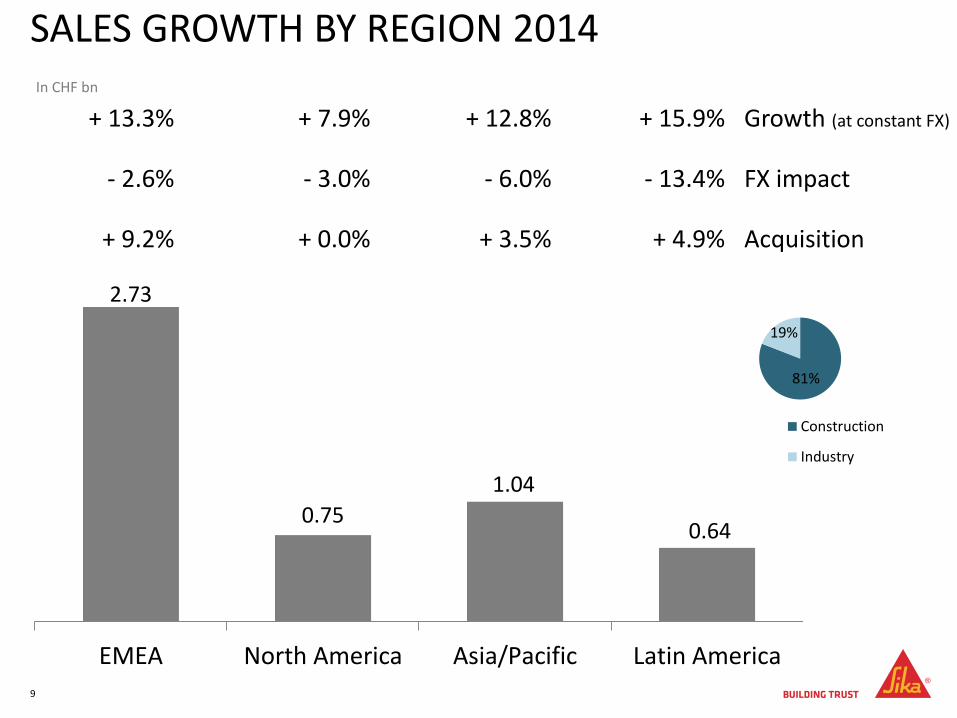
SALES GROWTH BY REGION 2014
2.73
0.75
1.04
0.64
EMEA North America Asia/Pacific Latin America
+ 13.3% + 7.9% + 12.8% + 15.9% Growth (at constant FX)
- 2.6% - 3.0% - 6.0% - 13.4% FX impact
+ 9.2% + 0.0% + 3.5% + 4.9% Acquisition
In CHF bn
81%
19%
Construction
Industry
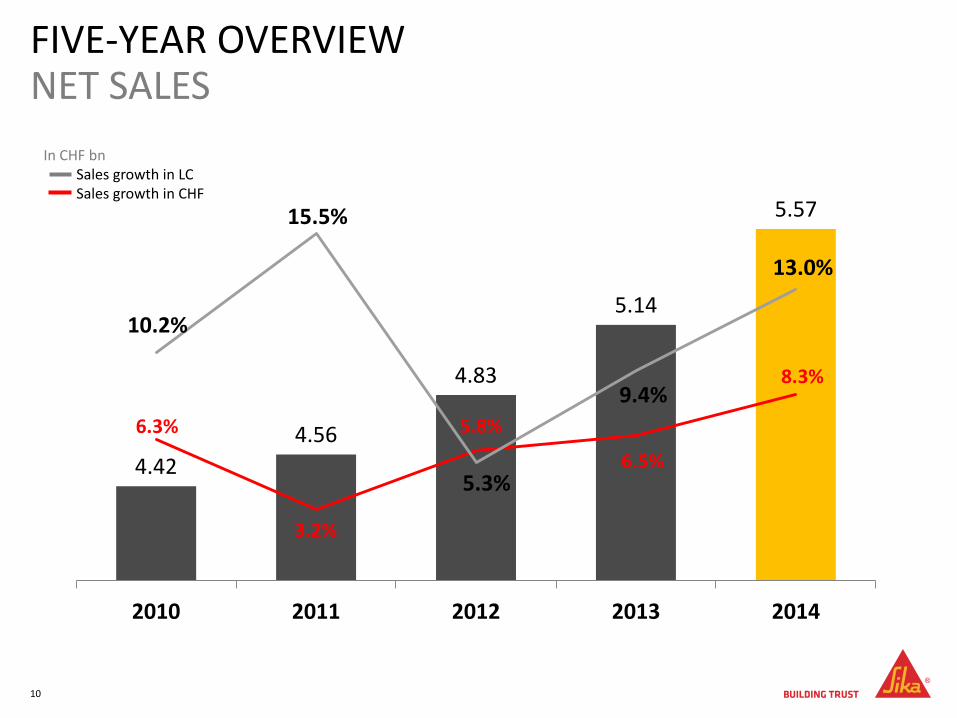
FIVE-YEAR OVERVIEW NET SALES
10
4.42
4.56
4.83
5.14
5.57
6.3%
3.2%
5.8%
6.5%
8.3%
10.2%
15.5%
5.3%
9.4%
13.0%
0.0%
2.0%
4.0%
6.0%
8.0%
10.0%
12.0%
14.0%
16.0%
18.0%
4.00
4.20
4.40
4.60
4.80
5.00
5.20
5.40
5.60
5.80
2010 2011 2012 2013 2014
In CHF bn Sales growth in LC Sales growth in CHF
3. STRATEGY 2018
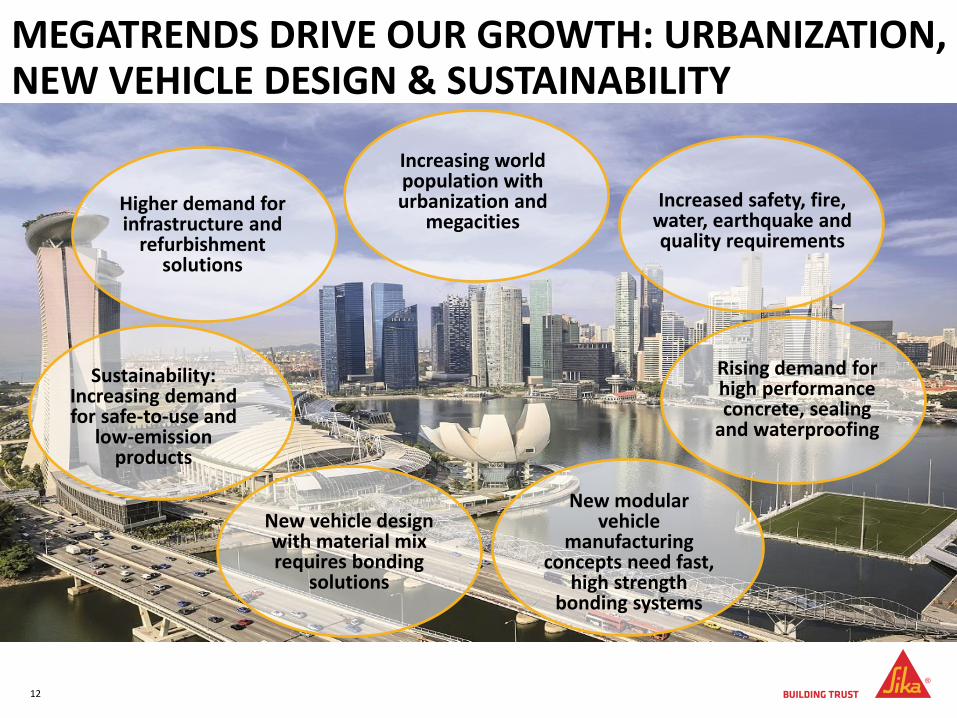
MEGATRENDS DRIVE OUR GROWTH: URBANIZATION, NEW VEHICLE DESIGN & SUSTAINABILITY
12
Higher demand for infrastructure and
refurbishment solutions
Sustainability: Increasing demand for safe-to-use and
low-emission products
Increased safety, fire, water, earthquake and quality requirements
Increasing world population with urbanization and
megacities
New modular vehicle
manufacturing concepts need fast,
high strength bonding systems
New vehicle design with material mix requires bonding
solutions
Rising demand for high performance concrete, sealing
and waterproofing
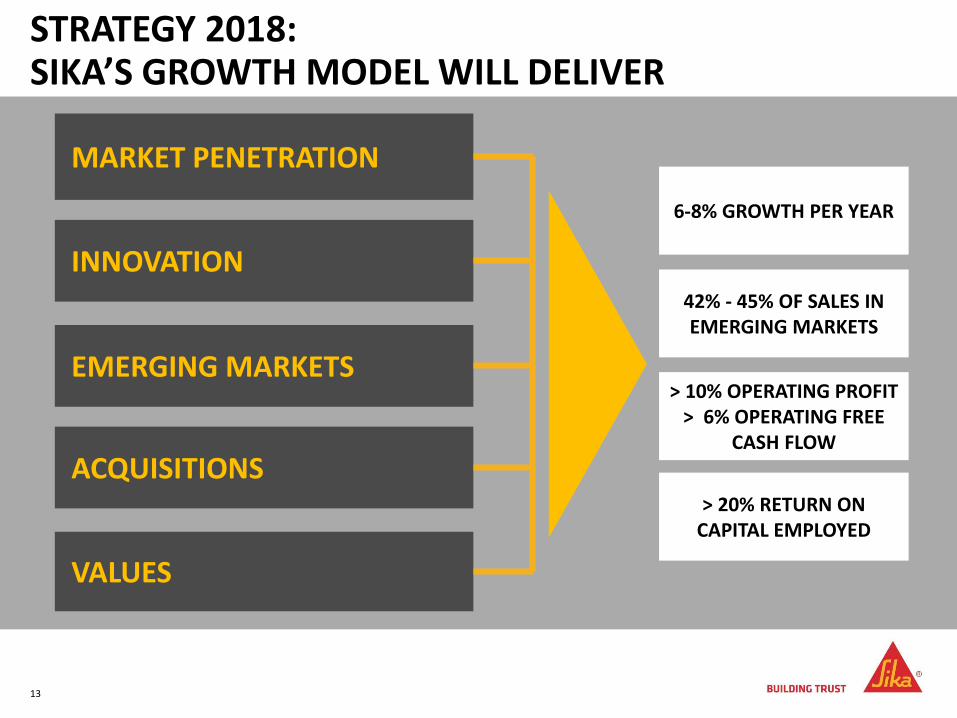
6-8% GROWTH PER YEAR
STRATEGY 2018: SIKA’S GROWTH MODEL WILL DELIVER
13 | 13 |
MARKET PENETRATION
INNOVATION
EMERGING MARKETS
ACQUISITIONS
VALUES
42% - 45% OF SALES IN EMERGING MARKETS
> 10% OPERATING PROFIT > 6% OPERATING FREE
CASH FLOW
> 20% RETURN ON CAPITAL EMPLOYED
13
4. REJECTION OF PLANNED CHANGE OF CONTROL TO SAINT-GOBAIN
14
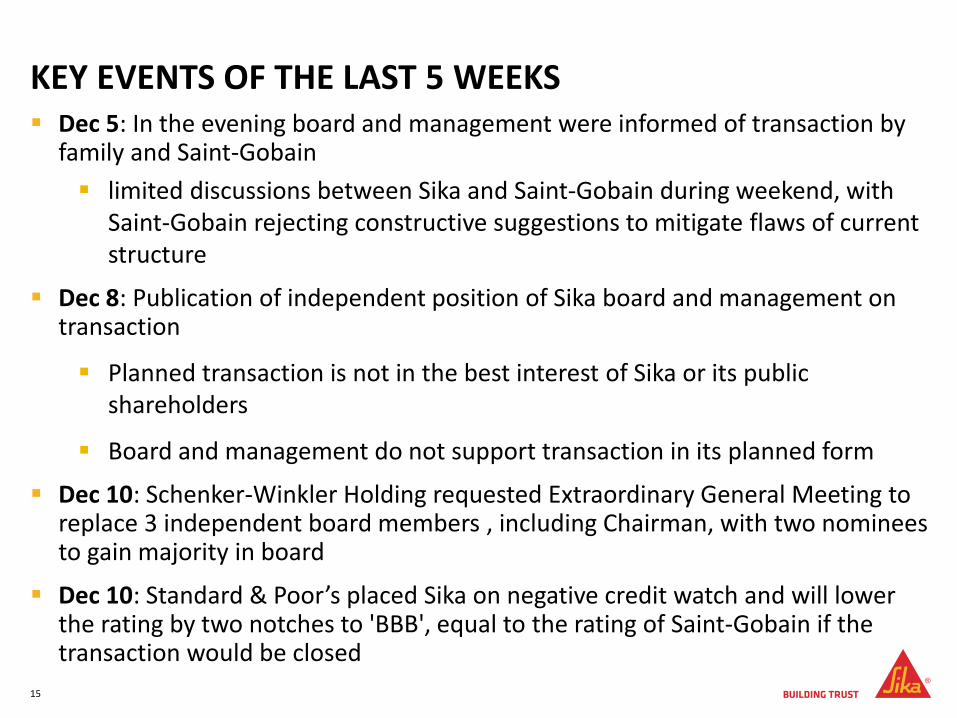
KEY EVENTS OF THE LAST 5 WEEKS Dec 5: In the evening board and management were informed of transaction by
family and Saint-Gobain
limited discussions between Sika and Saint-Gobain during weekend, with Saint-Gobain rejecting constructive suggestions to mitigate flaws of current structure
Dec 8: Publication of independent position of Sika board and management on transaction
Planned transaction is not in the best interest of Sika or its public shareholders
Board and management do not support transaction in its planned form
Dec 10: Schenker-Winkler Holding requested Extraordinary General Meeting to replace 3 independent board members , including Chairman, with two nominees to gain majority in board
Dec 10: Standard & Poor’s placed Sika on negative credit watch and will lower the rating by two notches to 'BBB', equal to the rating of Saint-Gobain if the transaction would be closed
15
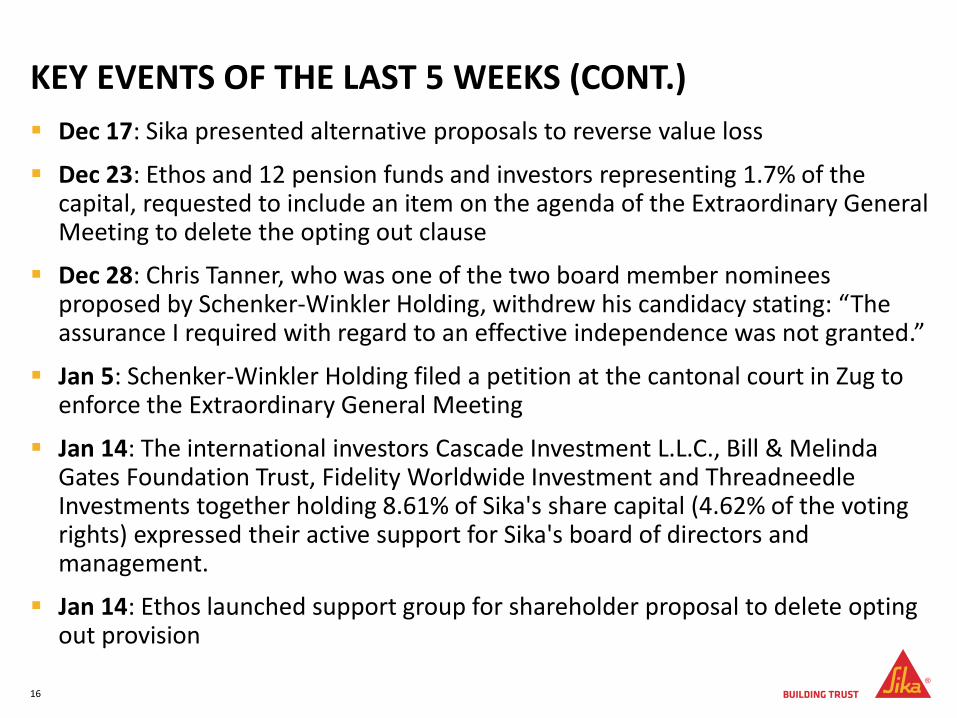
KEY EVENTS OF THE LAST 5 WEEKS (CONT.)
Dec 17: Sika presented alternative proposals to reverse value loss
Dec 23: Ethos and 12 pension funds and investors representing 1.7% of the capital, requested to include an item on the agenda of the Extraordinary General Meeting to delete the opting out clause
Dec 28: Chris Tanner, who was one of the two board member nominees proposed by Schenker-Winkler Holding, withdrew his candidacy stating: “The assurance I required with regard to an effective independence was not granted.”
Jan 5: Schenker-Winkler Holding filed a petition at the cantonal court in Zug to enforce the Extraordinary General Meeting
Jan 14: The international investors Cascade Investment L.L.C., Bill & Melinda Gates Foundation Trust, Fidelity Worldwide Investment and Threadneedle Investments together holding 8.61% of Sika's share capital (4.62% of the voting rights) expressed their active support for Sika's board of directors and management.
Jan 14: Ethos launched support group for shareholder proposal to delete opting out provision
16
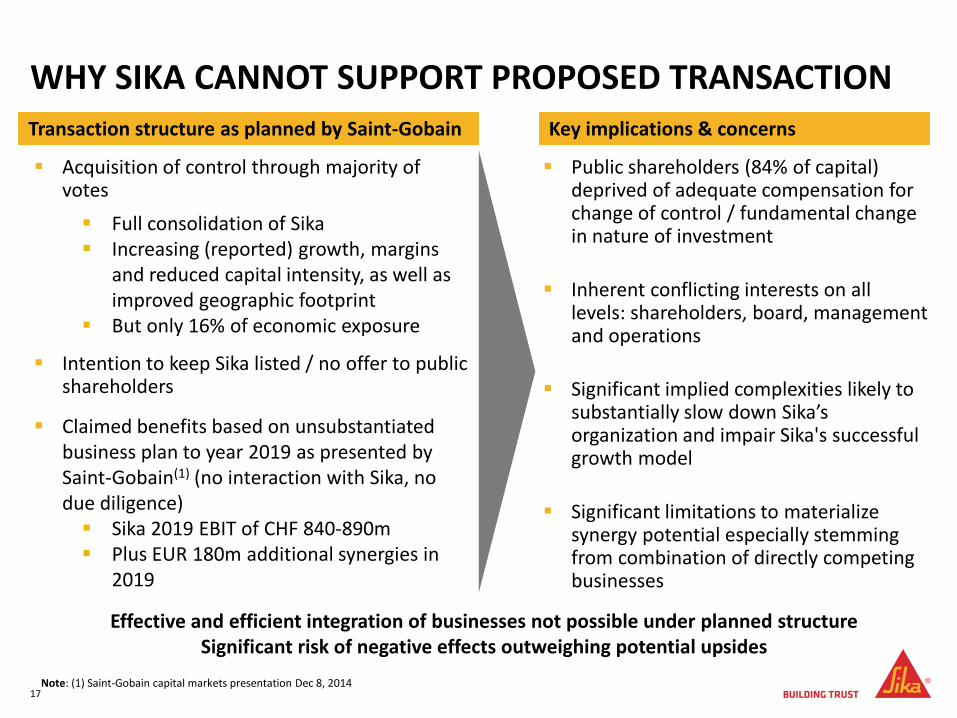
WHY SIKA CANNOT SUPPORT PROPOSED TRANSACTION
Acquisition of control through majority of votes
Full consolidation of Sika Increasing (reported) growth, margins
and reduced capital intensity, as well as improved geographic footprint
But only 16% of economic exposure
Intention to keep Sika listed / no offer to public shareholders
Claimed benefits based on unsubstantiated business plan to year 2019 as presented by Saint-Gobain(1) (no interaction with Sika, no due diligence) Sika 2019 EBIT of CHF 840-890m Plus EUR 180m additional synergies in
2019
17
Public shareholders (84% of capital) deprived of adequate compensation for change of control / fundamental change in nature of investment
Inherent conflicting interests on all levels: shareholders, board, management and operations
Significant implied complexities likely to substantially slow down Sika’s organization and impair Sika's successful growth model
Significant limitations to materialize synergy potential especially stemming from combination of directly competing businesses
Note: (1) Saint-Gobain capital markets presentation Dec 8, 2014
Transaction structure as planned by Saint-Gobain Key implications & concerns
Effective and efficient integration of businesses not possible under planned structure Significant risk of negative effects outweighing potential upsides
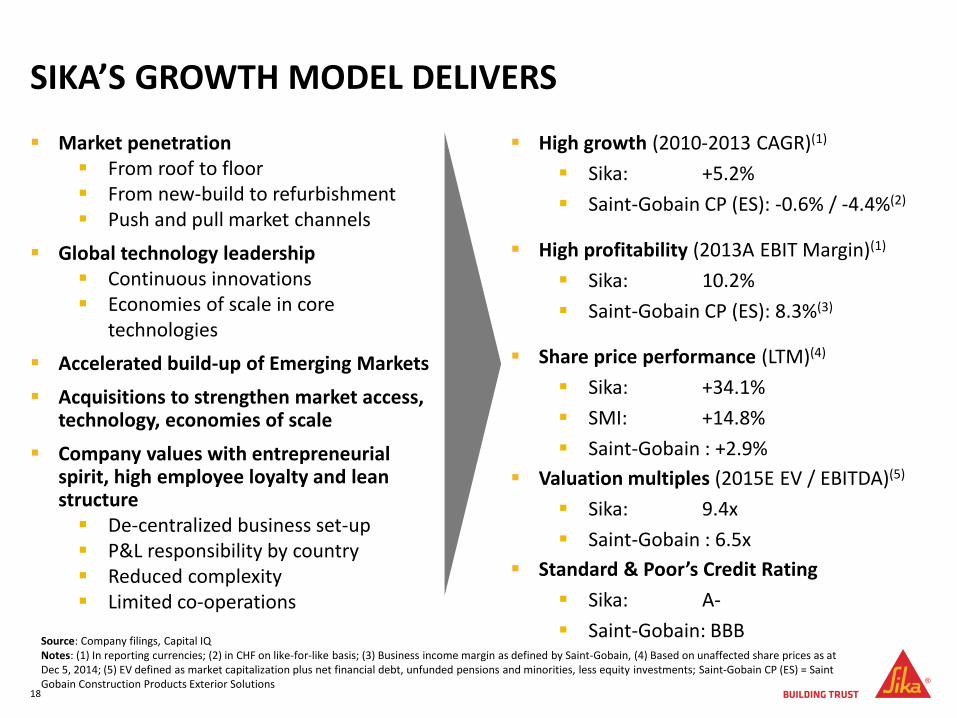
SIKA’S GROWTH MODEL DELIVERS
Market penetration From roof to floor From new-build to refurbishment Push and pull market channels
Global technology leadership Continuous innovations Economies of scale in core
technologies
Accelerated build-up of Emerging Markets
Acquisitions to strengthen market access, technology, economies of scale
Company values with entrepreneurial spirit, high employee loyalty and lean structure De-centralized business set-up P&L responsibility by country Reduced complexity Limited co-operations
18
High growth (2010-2013 CAGR)(1)
Sika: +5.2%
Saint-Gobain CP (ES): -0.6% / -4.4%(2)
High profitability (2013A EBIT Margin)(1)
Sika: 10.2%
Saint-Gobain CP (ES): 8.3%(3)
Share price performance (LTM)(4)
Sika: +34.1%
SMI: +14.8%
Saint-Gobain : +2.9%
Valuation multiples (2015E EV / EBITDA)(5)
Sika: 9.4x
Saint-Gobain : 6.5x
Standard & Poor’s Credit Rating
Sika: A-
Saint-Gobain: BBB Source: Company filings, Capital IQ Notes: (1) In reporting currencies; (2) in CHF on like-for-like basis; (3) Business income margin as defined by Saint-Gobain, (4) Based on unaffected share prices as at Dec 5, 2014; (5) EV defined as market capitalization plus net financial debt, unfunded pensions and minorities, less equity investments; Saint-Gobain CP (ES) = Saint Gobain Construction Products Exterior Solutions
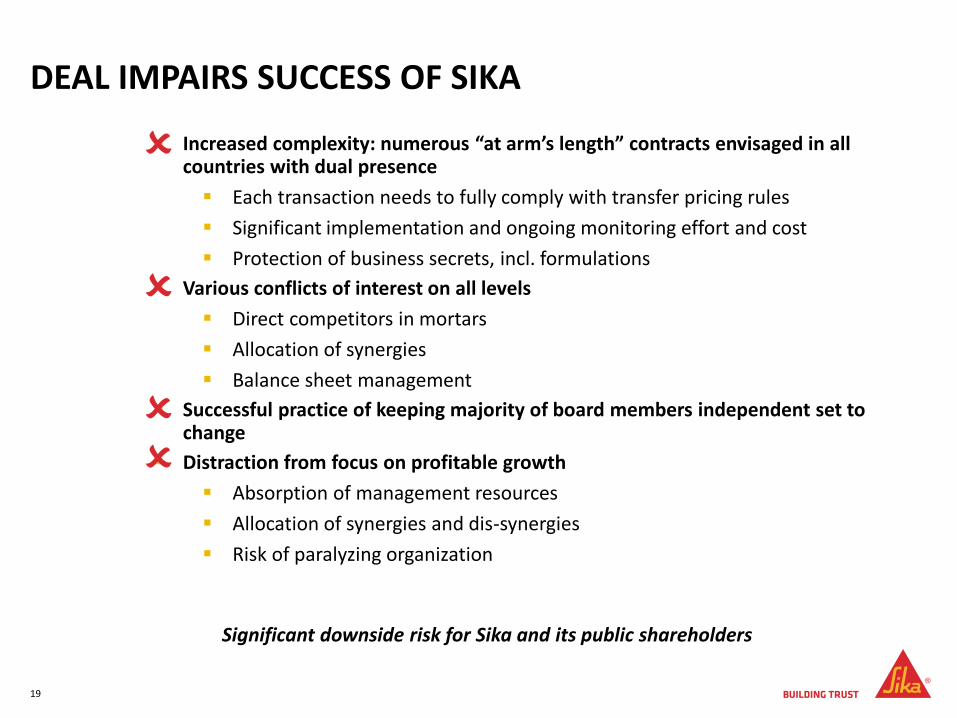
DEAL IMPAIRS SUCCESS OF SIKA
19
Significant downside risk for Sika and its public shareholders
Increased complexity: numerous “at arm’s length” contracts envisaged in all countries with dual presence
Each transaction needs to fully comply with transfer pricing rules
Significant implementation and ongoing monitoring effort and cost
Protection of business secrets, incl. formulations
Various conflicts of interest on all levels
Direct competitors in mortars
Allocation of synergies
Balance sheet management
Successful practice of keeping majority of board members independent set to change
Distraction from focus on profitable growth
Absorption of management resources
Allocation of synergies and dis-synergies
Risk of paralyzing organization
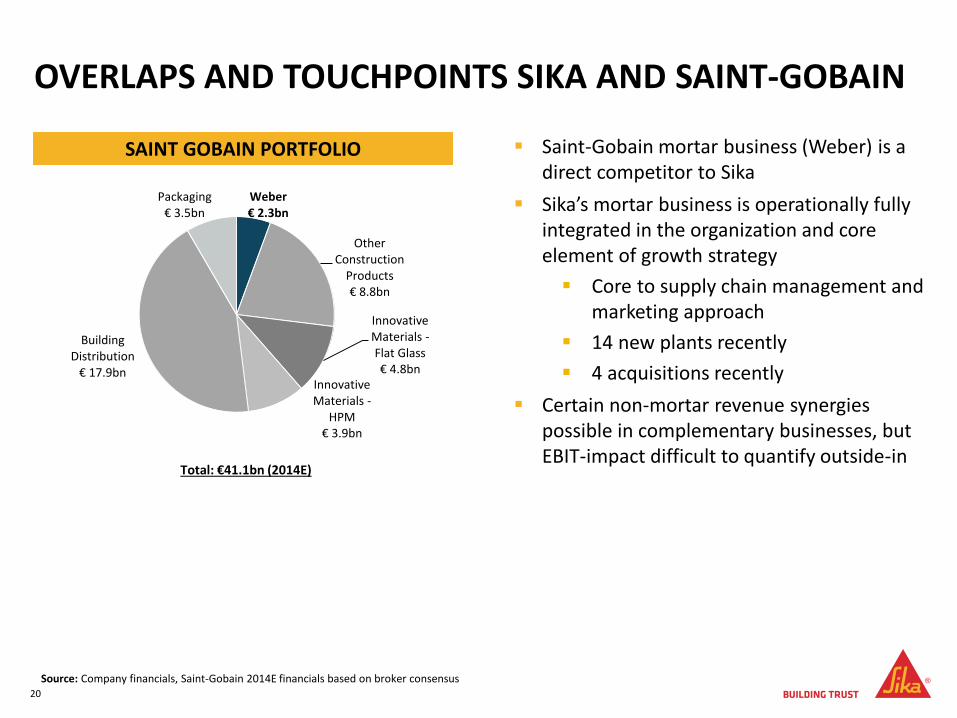
Weber € 2.3bn
Other Construction
Products € 8.8bn
Innovative Materials -Flat Glass€ 4.8bn
Innovative Materials -
HPM€ 3.9bn
Building Distribution
€ 17.9bn
Packaging€ 3.5bn
OVERLAPS AND TOUCHPOINTS SIKA AND SAINT-GOBAIN
20
Saint-Gobain mortar business (Weber) is a direct competitor to Sika
Sika’s mortar business is operationally fully integrated in the organization and core element of growth strategy
Core to supply chain management and marketing approach
14 new plants recently
4 acquisitions recently
Certain non-mortar revenue synergies possible in complementary businesses, but EBIT-impact difficult to quantify outside-in
SAINT GOBAIN PORTFOLIO
Source: Company financials, Saint-Gobain 2014E financials based on broker consensus
Total: €41.1bn (2014E)
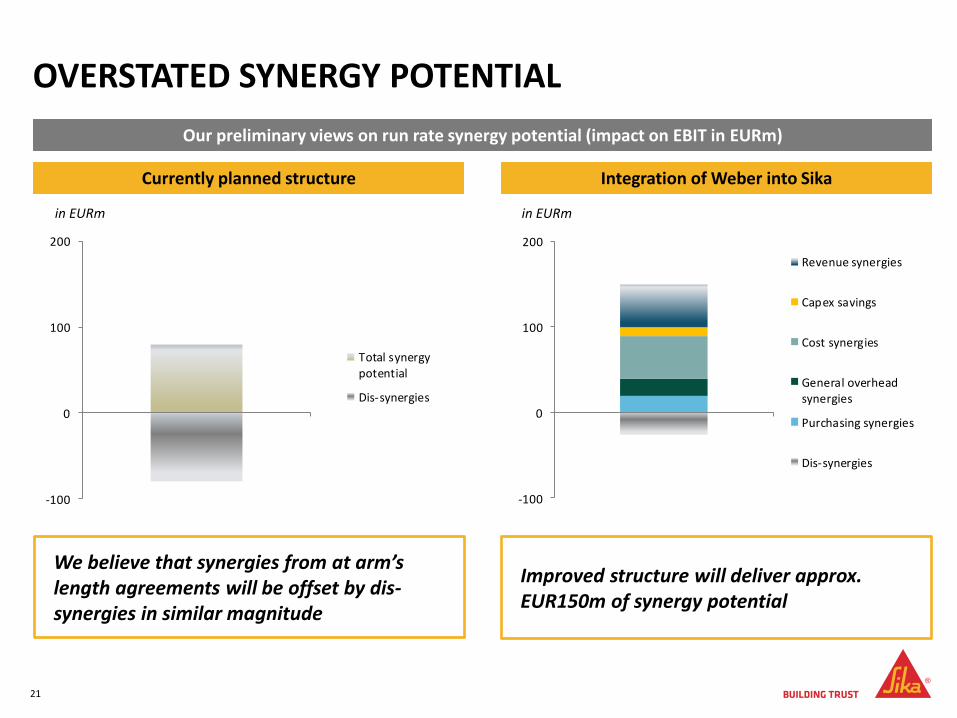
OVERSTATED SYNERGY POTENTIAL
Integration of Weber into Sika
Our preliminary views on run rate synergy potential (impact on EBIT in EURm)
Currently planned structure
We believe that synergies from at arm’s length agreements will be offset by dis-synergies in similar magnitude
21
in EURm in EURm
Improved structure will deliver approx. EUR150m of synergy potential
-100
0
100
200
Revenue synergies
Capex savings
Cost synergies
General overheadsynergies
Purchasing synergies
Dis-synergies
-100
0
100
200
Total synergypotential
Dis-synergies
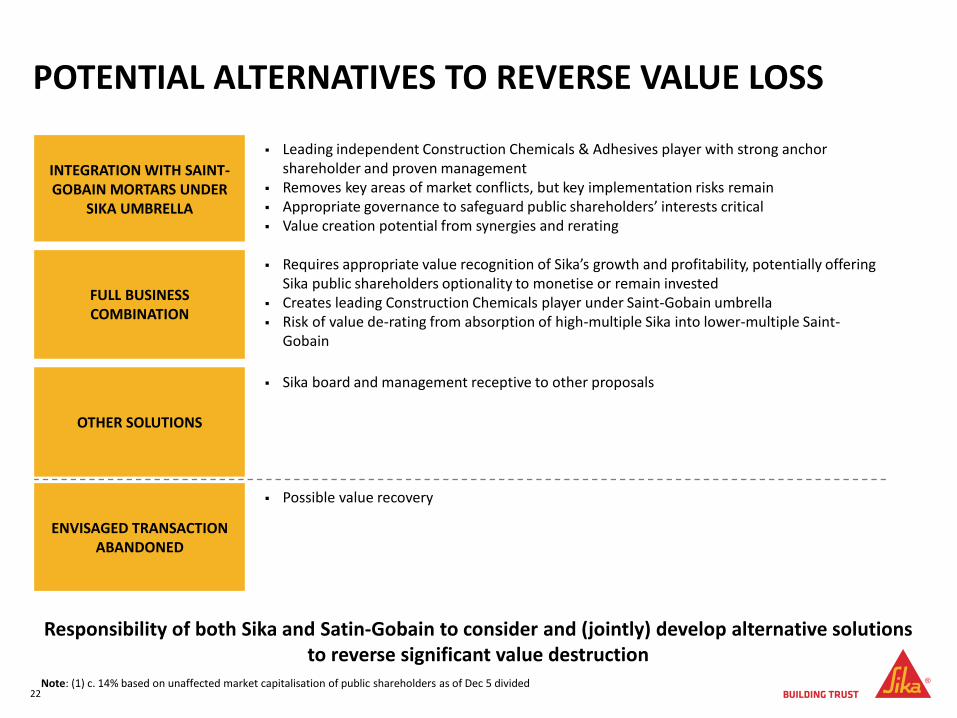
POTENTIAL ALTERNATIVES TO REVERSE VALUE LOSS
22
Responsibility of both Sika and Satin-Gobain to consider and (jointly) develop alternative solutions to reverse significant value destruction
Note: (1) c. 14% based on unaffected market capitalisation of public shareholders as of Dec 5 divided
INTEGRATION WITH SAINT-GOBAIN MORTARS UNDER
SIKA UMBRELLA
Leading independent Construction Chemicals & Adhesives player with strong anchor shareholder and proven management
Removes key areas of market conflicts, but key implementation risks remain Appropriate governance to safeguard public shareholders’ interests critical Value creation potential from synergies and rerating
FULL BUSINESS COMBINATION
Requires appropriate value recognition of Sika’s growth and profitability, potentially offering Sika public shareholders optionality to monetise or remain invested
Creates leading Construction Chemicals player under Saint-Gobain umbrella Risk of value de-rating from absorption of high-multiple Sika into lower-multiple Saint-
Gobain
OTHER SOLUTIONS
Sika board and management receptive to other proposals
ENVISAGED TRANSACTION ABANDONED
Possible value recovery
SIKA OPEN FOR CONSTRUCTIVE DIALOGUE
…that addresses obvious flaws of planned transaction
…that allows Sika to continue to flourish and that supports integrity of our business approach
…that allows optimal materialization of synergy potential
…that allows Sika’s public shareholders to (at least partially) recover experienced substantial value losses
…that converts currently planned ‘lose-lose’ transaction into a ‘win-win’ situation for both sides
23
Sika board and management act in the best interest of the company and its shareholders
This presentation contains certain forward-looking statements. These forward-looking statements may be identified by words such as ‘expects’, ‘believes’, ‘estimates’, ‘anticipates’, ‘projects’, ‘intends’, ‘should’, ‘seeks’, ‘future’ or similar expressions or by discussion of, among other things, strategy, goals, plans or intentions. Various factors may cause actual results to differ materially in the future from those reflected in forward-looking statements contained in this presentation, among others:
Fluctuations in currency exchange rates and general financial market conditions
Interruptions in production
Legislative and regulatory developments and economic conditions
Delay or inability in obtaining regulatory approvals or bringing products to market
Pricing and product initiatives of competitors
Uncertainties in the discovery, development or marketing of new products or new uses of existing products, including without limitation negative results of research projects, unexpected side-effects of pipeline or marketed products
Increased government pricing pressures
Loss of inability to obtain adequate protection for intellectual property rights
Litigation
Loss of key executives or other employees
Adverse publicity and news coverage.
Any statements regarding earnings per share growth is not a profit forecast and should not be interpreted to mean that Sika’s earnings or earnings per share for this year or any subsequent period will necessarily match or exceed the historical published earnings or earnings per share of Sika.
For marketed products discussed in this presentation, please see information on our website: www.sika.com
All mentioned trademarks are legally protected.
FORWARD-LOOKING STATEMENTS
24

THANK YOU FOR YOUR ATTENTION


