FINAL REPORT DYNAMIC IMPACT TESTING OF CRT WOOD POSTS IN A RIGID SLEEVE Submitted by Steven W. Arens, B.S.C.E., E.I.T. Graduate Research Assistant Ronald K. Faller, Ph.D., P.E. Research Assistant Professor John R. Rohde, Ph.D., P.E. Associate Professor Karla A. Polivka, M.S.M.E., E.I.T. Research Associate Engineer MIDWEST ROADSIDE SAFETY FACILITY University of Nebraska-Lincoln 527 Nebraska Hall Lincoln, Nebraska 68588-0529 (402) 472-0965 Submitted to MINNESOTA DEPARTMENT OF TRANSPORTATION (MnDOT) Transportation Building 395 John Ireland Boulevard Saint Paul, MN 55155 MwRSF Research Report No. TRP-03-198-08 April 11, 2008
Transcript
FINAL REPORT
DYNAMIC IMPACT TESTING OF
CRT WOOD POSTS IN A RIGID SLEEVE
Submitted by
Steven W. Arens, B.S.C.E., E.I.T. Graduate Research Assistant
Ronald K. Faller, Ph.D., P.E. Research Assistant Professor
John R. Rohde, Ph.D., P.E.
Associate Professor
Karla A. Polivka, M.S.M.E., E.I.T. Research Associate Engineer
MIDWEST ROADSIDE SAFETY FACILITY
University of Nebraska-Lincoln 527 Nebraska Hall
Lincoln, Nebraska 68588-0529 (402) 472-0965
Submitted to
MINNESOTA DEPARTMENT OF TRANSPORTATION (MnDOT) Transportation Building
12. Sponsoring Organization Name and Address 13. Type of Report and Period Covered
Minnesota Department of Transportation (MnDOT) Transportation Building 395 John Ireland Boulevard Saint Paul, MN 55155
Final Report, 2007-2008 14. Sponsoring Agency Code
15. Supplementary Notes
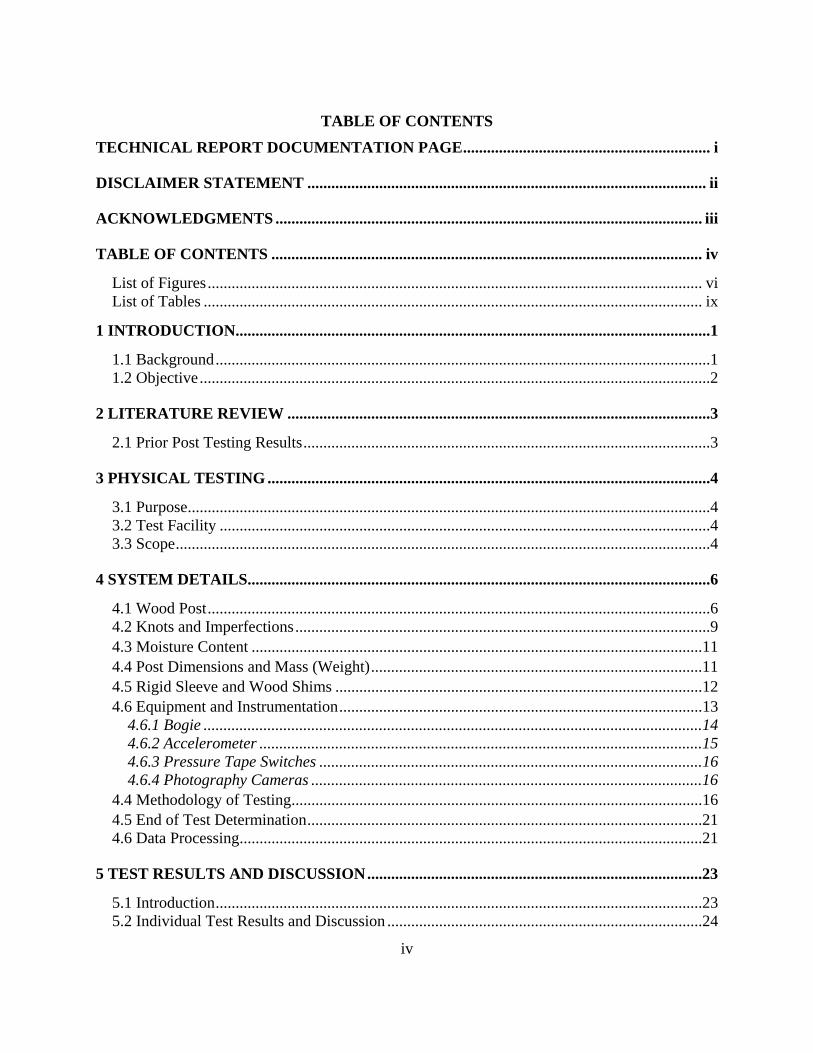
Prepared in cooperation with U.S. Department of Transportation, Federal Highway Administration 16. Abstract (Limit: 200 words)
Dynamic impact testing was performed on 152-mm x 203-mm (6-in. x 8-in.) CRT wood posts placed in a rigid sleeve at various angles. A total of nine bogie tests were performed with three tests each at 0, 90, and 45 degree rotation angles relative to the strong axis of bending. For each bogie test, the raw acceleration data was obtained from accelerometers and was filtered. Then, force-displacement and energy-displacement graphs were plotted. Based on the results, the properties and strengths of the CRT wood posts at the different impact angles were determined. The results of this study will be the basis in a future R&D effort to design a new, Universal Breakaway Steel Post for various guardrail applications.
No restrictions. Document available from: National Technical Information Services, Springfield, Virginia 22161
19. Security Class (this report) 20. Security Class (this page) 21. No. of Pages 22. Price
Unclassified Unclassified 89
ii
DISCLAIMER STATEMENT
The contents of this report reflect the views of the authors who are responsible for the
facts and the accuracy of the data presented herein. The contents do not reflect the official views
nor policies of the Federal Highway Administration nor the Minnesota Department of
Transportation. This report does not constitute a standard, specification, or regulation.
iii
ACKNOWLEDGMENTS
The authors wish to acknowledge the Minnesota Department of Transportation for
sponsoring this project.
Acknowledgment is also given to the following individuals who made a contribution to
the completion of this research project.
Midwest Roadside Safety Facility D.L. Sicking, Ph.D., P.E., Professor and MwRSF Director J.D. Reid, Ph.D., Professor R.W. Bielenberg, M.S.M.E., E.I.T., Research Associate Engineer S.K. Rosenbaugh, M.S.C.E., E.I.T., Research Associate Engineer J.C. Holloway, M.S.C.E., E.I.T., Research Manager C.L. Meyer, B.S.M.E., E.I.T., Research Engineer II A.T. Russell, B.S.B.A., Laboratory Mechanic II K.L. Krenk, B.S.M.A, Field Operations Manager A.T. McMaster, Laboratory Mechanic I Undergraduate and Graduate Assistants
iv
TABLE OF CONTENTS
TECHNICAL REPORT DOCUMENTATION PAGE .............................................................. i
DISCLAIMER STATEMENT .................................................................................................... ii
ACKNOWLEDGMENTS ........................................................................................................... iii
TABLE OF CONTENTS ............................................................................................................ iv
List of Figures ............................................................................................................................ vi List of Tables ............................................................................................................................. ix
3.1 Purpose ...................................................................................................................................4 3.2 Test Facility ...........................................................................................................................4 3.3 Scope ......................................................................................................................................4
4 SYSTEM DETAILS....................................................................................................................6
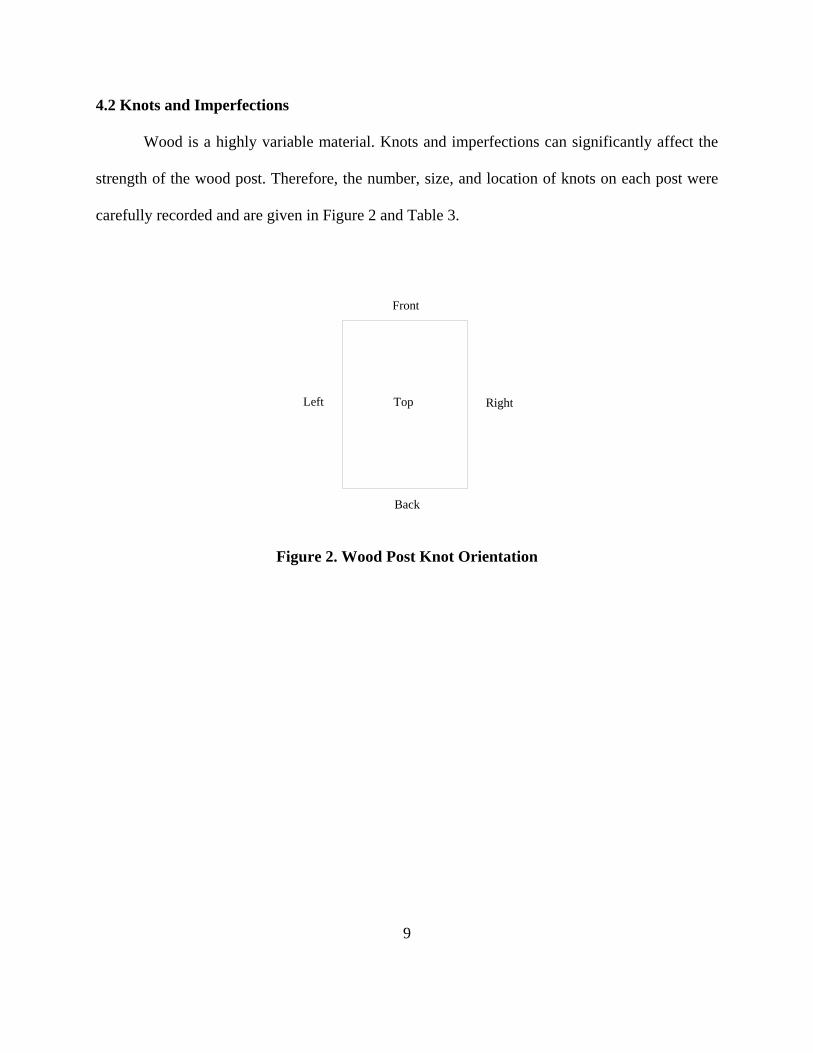
4.1 Wood Post ..............................................................................................................................6 4.2 Knots and Imperfections ........................................................................................................9 4.3 Moisture Content .................................................................................................................11 4.4 Post Dimensions and Mass (Weight) ...................................................................................11 4.5 Rigid Sleeve and Wood Shims ............................................................................................12 4.6 Equipment and Instrumentation ...........................................................................................13
4.4 Methodology of Testing .......................................................................................................16 4.5 End of Test Determination ...................................................................................................21 4.6 Data Processing ....................................................................................................................21
5 TEST RESULTS AND DISCUSSION ....................................................................................23
5.1 Introduction ..........................................................................................................................23 5.2 Individual Test Results and Discussion ...............................................................................24
v
5.2.1 Test MNCRT-1 – Strong-Axis (0 Degree) Impact on CRT Post ...................................25 5.2.2 Test MNCRT-2 – Strong-Axis (0 Degree) Impact on CRT Post ...................................28 5.2.3 Test MNCRT-3 – Strong-Axis (0 Degree) Impact on CRT Post ...................................31 5.2.4 Test MNCRT-4 – Weak-Axis (90 Degree) Impact on CRT Post ...................................34 5.2.5 Test MNCRT-5 – Weak-Axis (90 Degree) Impact on CRT Post ...................................37 5.2.6 Test MNCRT-6 – Weak-Axis (90 Degree) Impact on CRT Post ...................................40 5.2.7 Test MNCRT-7 – Diagonal-Axis (45 Degree) Impact on CRT Post .............................43 5.2.8 Test MNCRT-8 – Diagonal-Axis (45 Degree) Impact on CRT Post .............................46 5.2.9 Test MNCRT-9 – Diagonal-Axis (45 Degree) Impact on CRT Post .............................49
5.3 Force Discussion ..................................................................................................................52 5.3.1 Force Results for Test Nos. MNCRT-1, MNCRT-2 and MNCRT-3 ..............................53 5.3.2 Force Results for Test Nos. MNCRT-4, MNCRT-5 and MNCRT-6 ..............................55 5.3.3 Force Results for Test Nos. MNCRT-7, MNCRT-8 and MNCRT-9 ..............................57
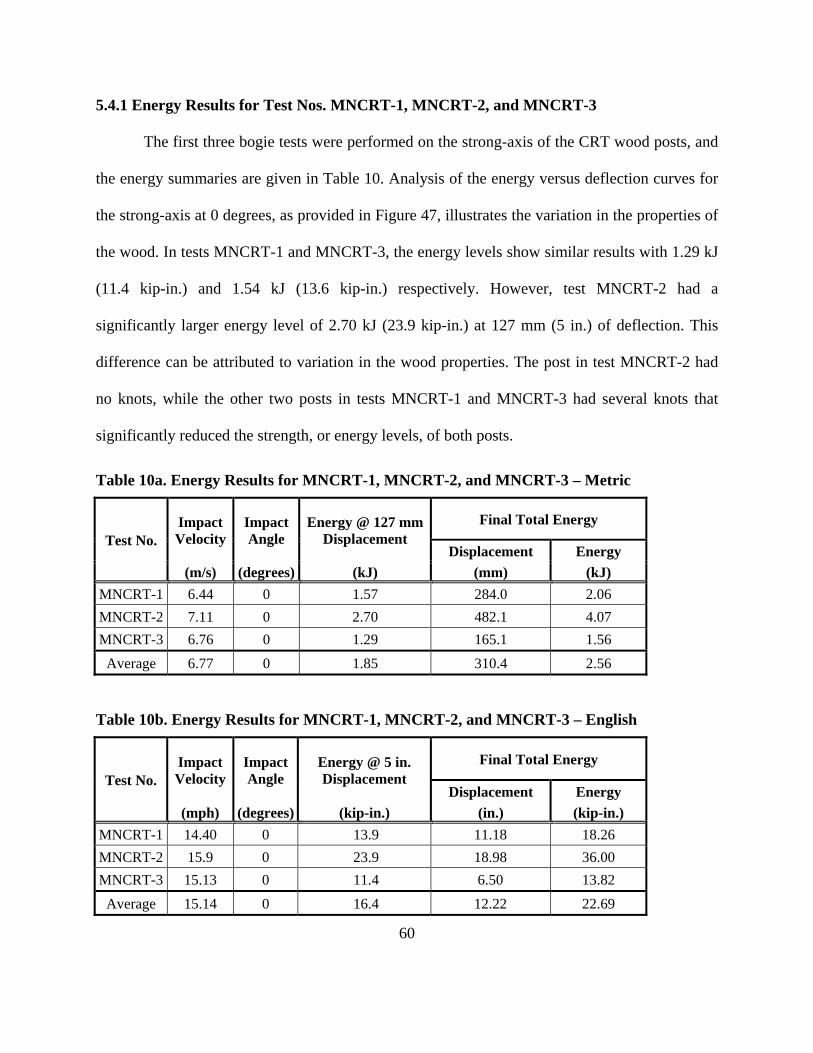
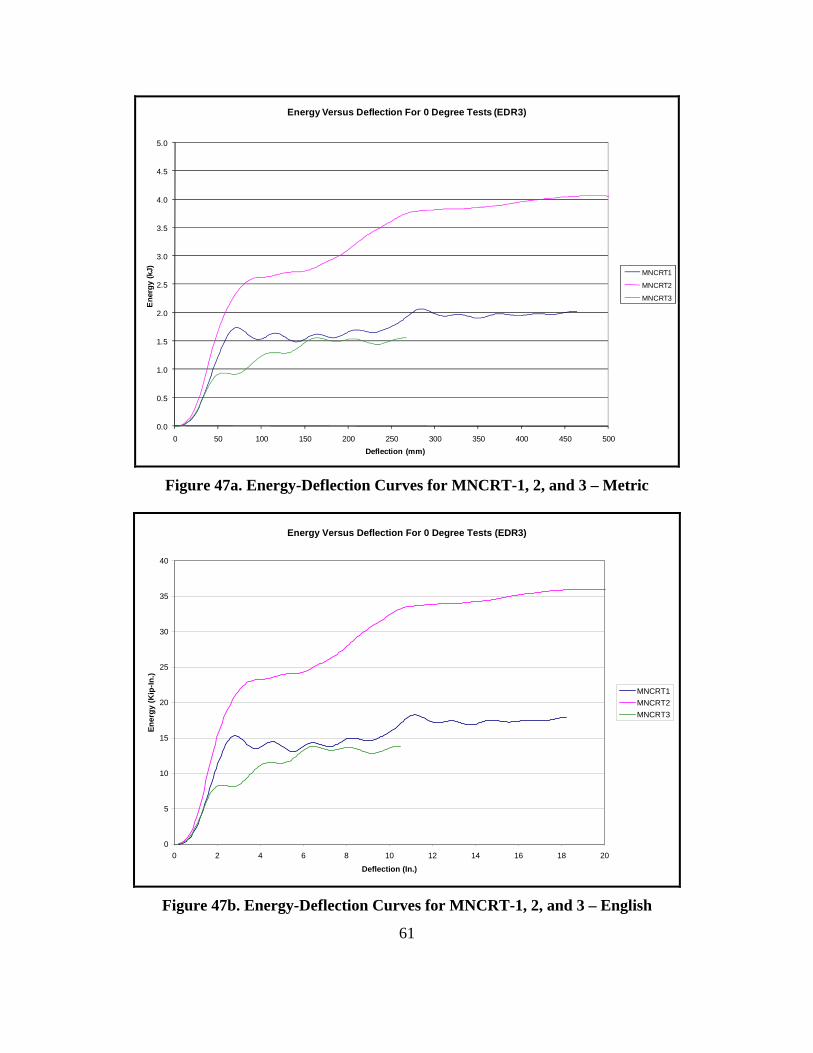
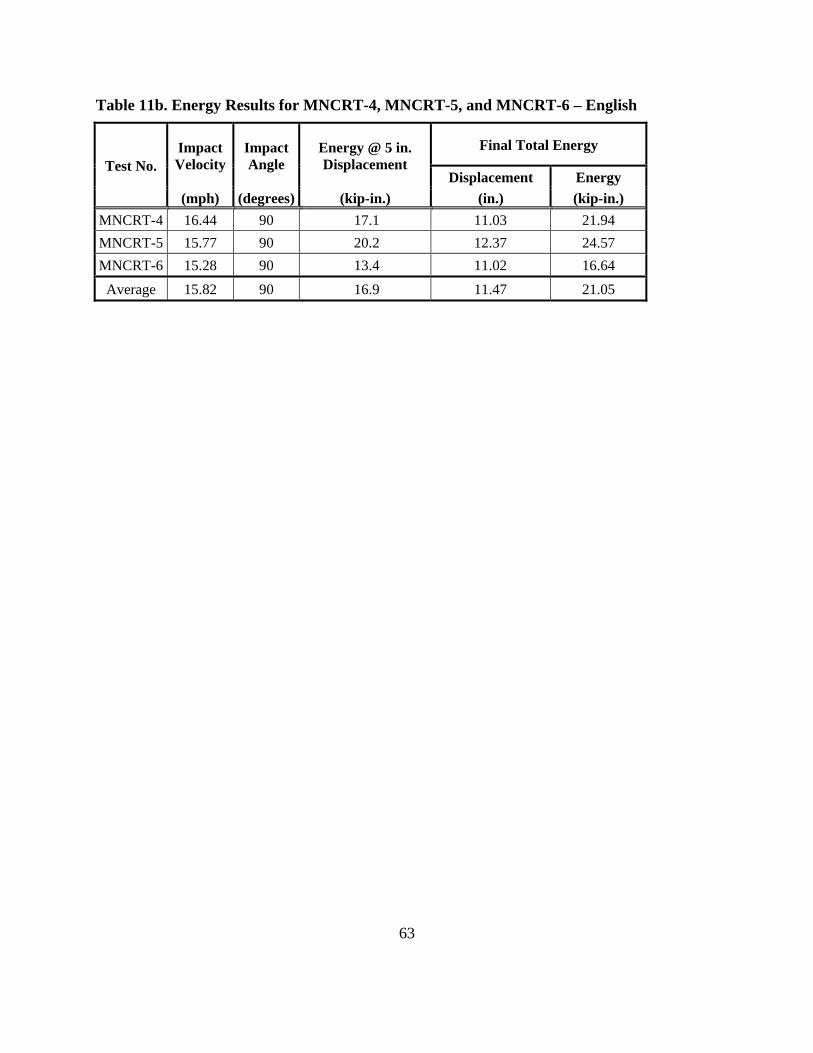
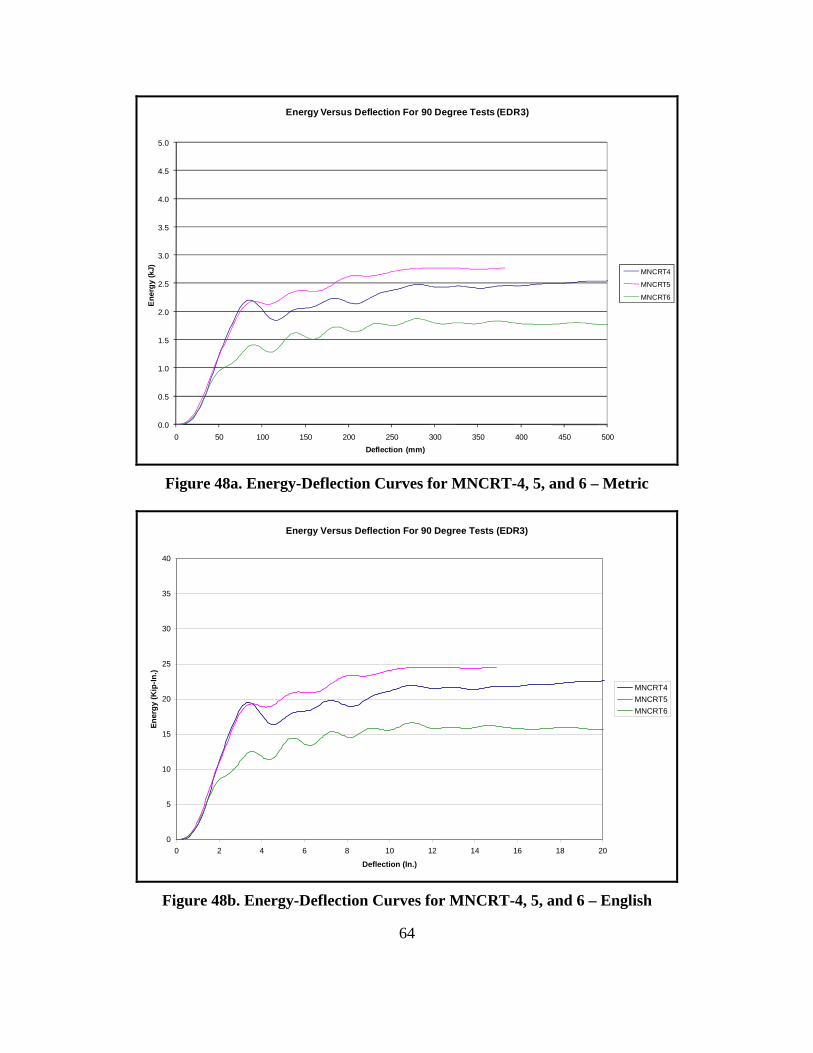
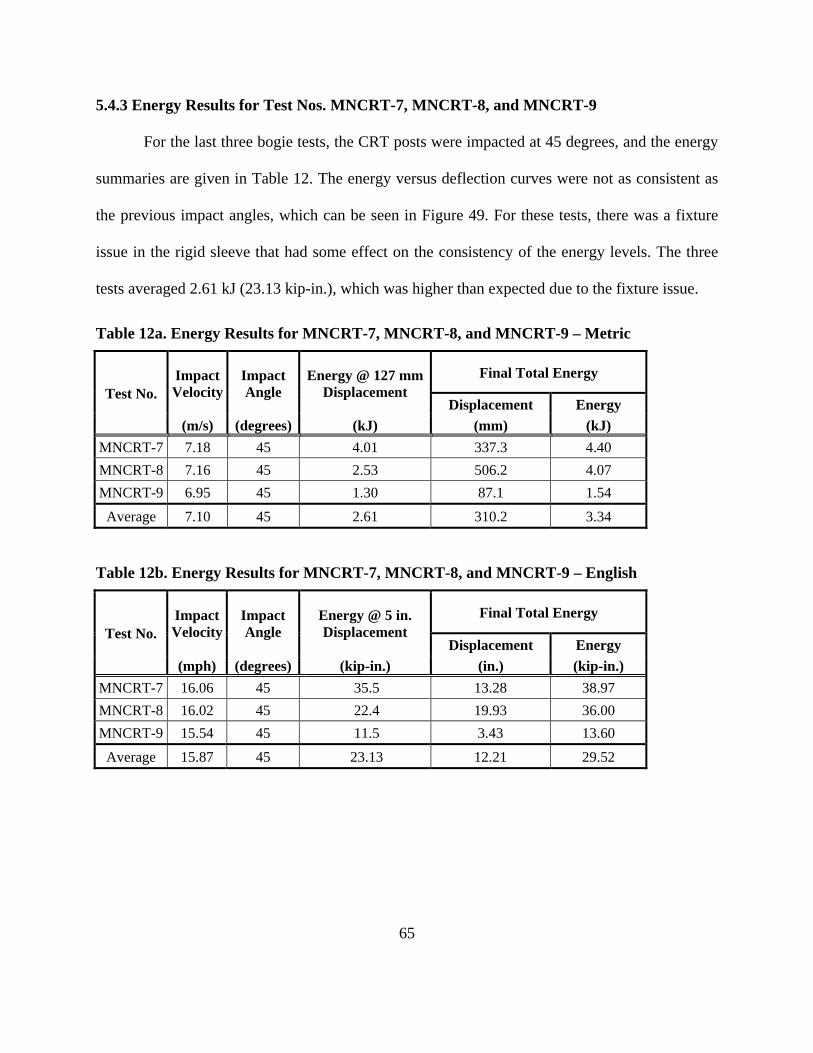
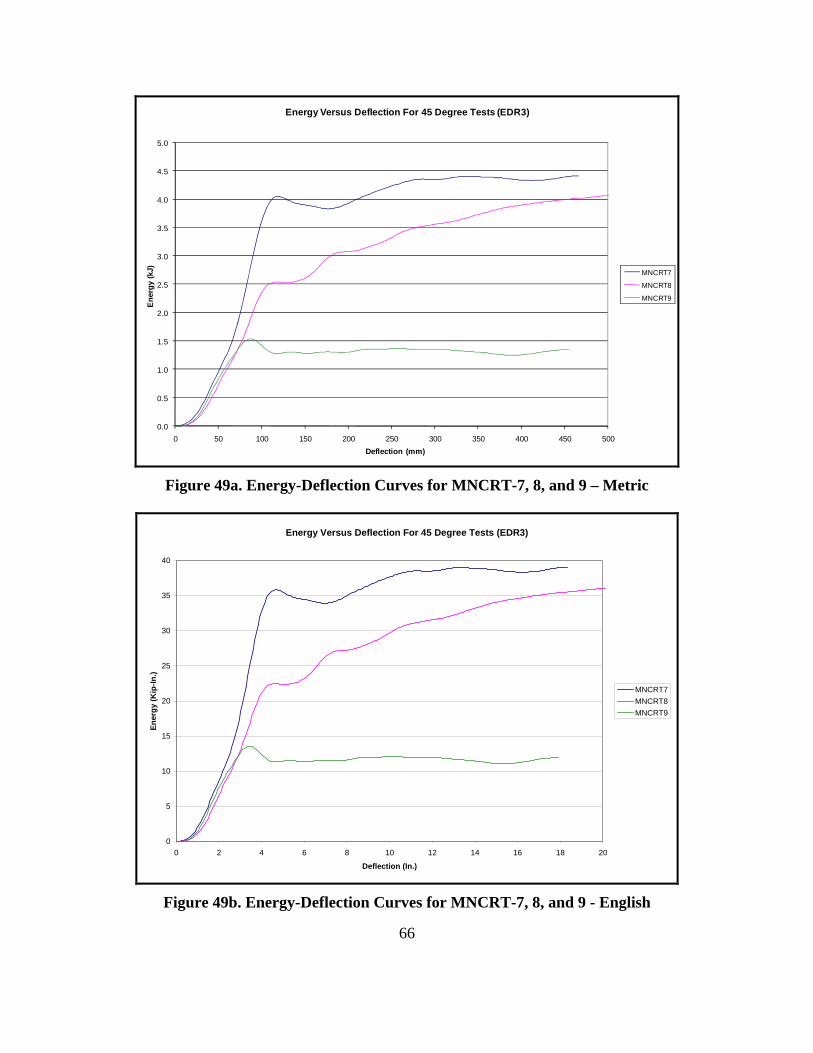
5.4 Energy Discussion ...............................................................................................................59 5.4.1 Energy Results for Test Nos. MNCRT-1, MNCRT-2 and MNCRT-3 ............................60 5.4.2 Energy Results for Test Nos. MNCRT-4, MNCRT-5 and MNCRT-6 ............................62 5.4.3 Energy Results for Test Nos. MNCRT-7, MNCRT-8 and MNCRT-9 ............................65
6 CONCLUSIONS AND RECOMMENDATIONS ..................................................................67
Appendix A ................................................................................................................................71 A.1 Test Summary Information .................................................................................................71
vi
List of Figures
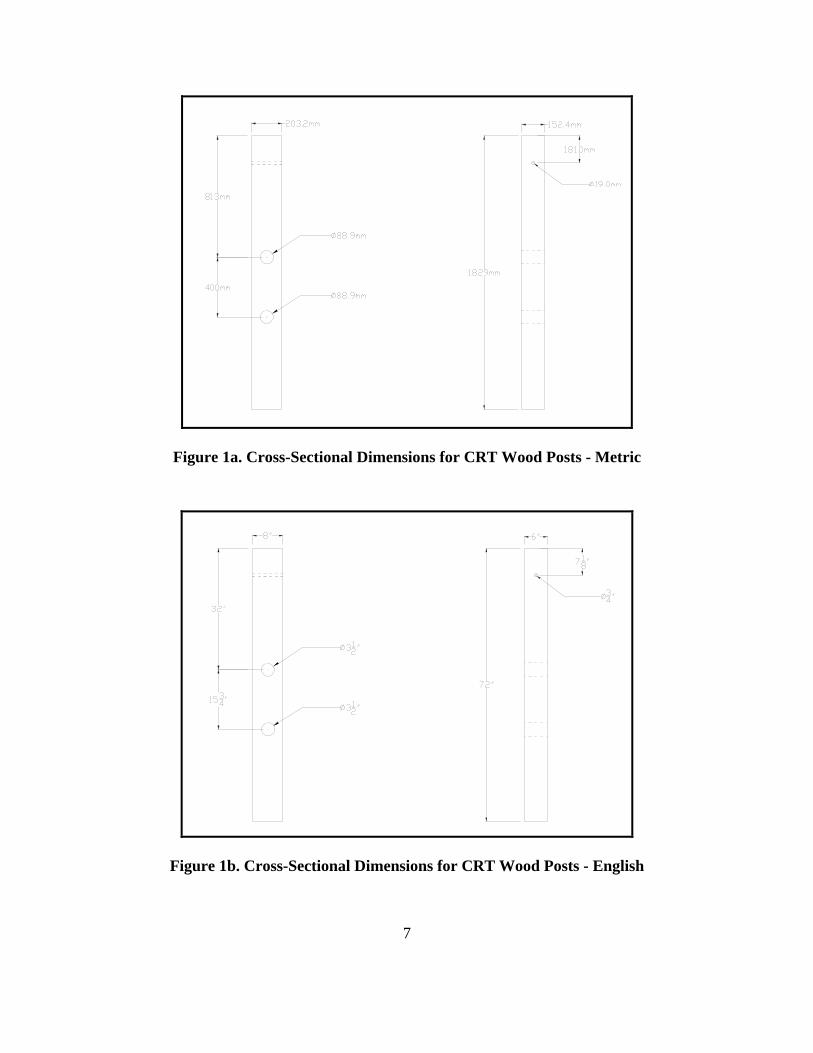
Figure 1a. Cross-Section Dimensions of the Wood Posts - Metric ........................................... 7 Figure 1b. Cross-Section Dimensions of the Wood Posts - English .......................................... 7 Figure 2. Wood Post Knot Orientation ....................................................................................... 9 Figure 3. Shimmed CRT in Rigid Sleeve .................................................................................. 13 Figure 4. Bogie and Test Setup .................................................................................................. 15 Figure 5. Test Setup for Test Nos. MNCRT-1 to MNCRT-3 (0 Degree Tests) ..................... 18 Figure 6. Test Setup for Test Nos. MNCRT-4 to MNCRT-6 (90 Degree Tests) ................... 19 Figure 7. Test Setup for Test Nos. MNCRT-7 to MNCRT-9 (45 Degree Tests) ................... 20 Figure 8. Time Sequential Photographs, Test MNCRT-1 ....................................................... 25 Figure 9a. Force versus Deflection Curve for MNCRT-1 – Metric ....................................... 26 Figure 9b. Force versus Deflection Curve for MNCRT-1 – English ...................................... 26 Figure 10a. Energy versus Deflection Curve for MNCRT-1 – Metric ................................... 26 Figure 10b. Energy versus Deflection Curve for MNCRT-1 – English ................................. 26 Figure 11. Post-Impact Images of MNCRT-1 .......................................................................... 27 Figure 12. Time Sequential Photographs, Test MNCRT-2 ..................................................... 28 Figure 13a. Force versus Deflection Curve for MNCRT-2 – Metric ..................................... 29 Figure 13b. Force versus Deflection Curve for MNCRT-2 – English .................................... 29 Figure 14a. Energy versus Deflection Curve for MNCRT-2 – Metric ................................... 29 Figure 14b. Energy versus Deflection Curve for MNCRT-2 – English ................................. 29 Figure 15. Post-Impact Images of MNCRT-2 .......................................................................... 30 Figure 16. Time Sequential Photographs, Test MNCRT-3 ..................................................... 31 Figure 17a. Force versus Deflection Curve for MNCRT-3 – Metric ..................................... 32 Figure 17b. Force versus Deflection Curve for MNCRT-3 – English .................................... 32 Figure 18a. Energy versus Deflection Curve for MNCRT-3 – Metric ................................... 32 Figure 18b. Energy versus Deflection Curve for MNCRT-3 – English ................................. 32 Figure 19. Post-Impact Images of MNCRT-3 .......................................................................... 33 Figure 20. Time Sequential Photographs, Test MNCRT-4 ..................................................... 34 Figure 21a. Force versus Deflection Curve for MNCRT-4 – Metric ..................................... 35 Figure 21b. Force versus Deflection Curve for MNCRT-4 – English .................................... 35 Figure 22a. Energy versus Deflection Curve for MNCRT-4 – Metric ................................... 35 Figure 22b. Energy versus Deflection Curve for MNCRT-4 – English ................................. 35 Figure 23. Post-Impact Images of MNCRT-4 .......................................................................... 36 Figure 24. Time Sequential Photographs, Test MNCRT-5 ..................................................... 37 Figure 25a. Force versus Deflection Curve for MNCRT-5 – Metric ..................................... 38 Figure 25b. Force versus Deflection Curve for MNCRT-5 – English .................................... 38 Figure 26a. Energy versus Deflection Curve for MNCRT-5 – Metric ................................... 38 Figure 26b. Energy versus Deflection Curve for MNCRT-5 – English ................................. 38 Figure 27. Post-Impact Images of MNCRT-5 .......................................................................... 39 Figure 28. Time Sequential Photographs, Test MNCRT-6 ..................................................... 40 Figure 29a. Force versus Deflection Curve for MNCRT-6 – Metric ..................................... 41 Figure 29b. Force versus Deflection Curve for MNCRT-6 – English .................................... 41 Figure 30a. Energy versus Deflection Curve for MNCRT-6 – Metric ................................... 41 Figure 30b. Energy versus Deflection Curve for MNCRT-6 – English ................................. 41
vii
Figure 31. Post-Impact Images of MNCRT-6 .......................................................................... 42 Figure 32. Time Sequential Photographs, Test MNCRT-7 ..................................................... 43 Figure 33a. Force versus Deflection Curve for MNCRT-7 – Metric ..................................... 44 Figure 33b. Force versus Deflection Curve for MNCRT-7 – English .................................... 44 Figure 34a. Energy versus Deflection Curve for MNCRT-7 – Metric ................................... 44 Figure 34b. Energy versus Deflection Curve for MNCRT-7 – English ................................. 44 Figure 35. Post-Impact Images of MNCRT-7 .......................................................................... 45 Figure 36. Time Sequential Photographs, Test MNCRT-8 ..................................................... 46 Figure 37a. Force versus Deflection Curve for MNCRT-8 – Metric ..................................... 47 Figure 37b. Force versus Deflection Curve for MNCRT-8 – English .................................... 47 Figure 38a. Energy versus Deflection Curve for MNCRT-8 – Metric ................................... 47 Figure 38b. Energy versus Deflection Curve for MNCRT-8 – English ................................. 47 Figure 39. Post-Impact Images of MNCRT-8 .......................................................................... 48 Figure 40. Time Sequential Photographs, Test MNCRT-9 ..................................................... 49 Figure 41a. Force versus Deflection Curve for MNCRT-9 – Metric ..................................... 50 Figure 41b. Force versus Deflection Curve for MNCRT-9 – English .................................... 50 Figure 42a. Energy versus Deflection Curve for MNCRT-9 – Metric ................................... 50 Figure 42b. Energy versus Deflection Curve for MNCRT-9 – English ................................. 50 Figure 43 Post-Impact Images of MNCRT-9 ........................................................................... 51 Figure 44a. Force-Deflection Curves for MNCRT-1, 2, and 3 - Metric ................................. 54 Figure 44b. Force-Deflection Curves for MNCRT-1, 2, and 3 – English .............................. 54 Figure 45a. Force-Deflection Curves for MNCRT-4, 5, and 6 - Metric ................................. 56 Figure 45b. Force-Deflection Curves for MNCRT-4, 5, and 6 – English .............................. 56 Figure 46a. Force-Deflection Curves for MNCRT-7, 8, and 9 - Metric ................................. 58 Figure 46b. Force-Deflection Curves for MNCRT-7, 8, and 9 – English .............................. 58 Figure 47a. Energy-Deflection Curves for MNCRT-1, 2, and 3 - Metric .............................. 61 Figure 47b. Energy-Deflection Curves for MNCRT-1, 2, and 3 - English ............................ 61 Figure 48a. Energy-Deflection Curves for MNCRT-4, 5, and 6 - Metric .............................. 64 Figure 48b. Energy-Deflection Curves for MNCRT-4, 5, and 6 - English ............................ 64 Figure 49a. Energy-Deflection Curves for MNCRT-7, 8, and 9 - Metric .............................. 66 Figure 49b. Energy-Deflection Curves for MNCRT-7, 8, and 9 - English ............................ 66 Figure 50a. Peak Forces and Energy Levels of the CRT Post - Metric ................................. 68 Figure 50b. Peak Forces and Energy Levels of the CRT Post - English ................................ 68 Figure A-1. Results of MNCRT-1 (EDR3) ................................................................................ 72 Figure A-2. Results of MNCRT-1 (EDR4) ................................................................................ 73 Figure A-3. Results of MNCRT-2 (EDR3) ................................................................................ 74 Figure A-4. Results of MNCRT-2 (EDR4) ................................................................................ 75 Figure A-5. Results of MNCRT-3 (EDR3) ................................................................................ 76 Figure A-6. Results of MNCRT-3 (EDR4) ................................................................................ 77 Figure A-7. Results of MNCRT-4 (EDR3) ................................................................................ 78 Figure A-8. Results of MNCRT-4 (EDR4) ................................................................................ 79 Figure A-9. Results of MNCRT-5 (EDR3) ................................................................................ 80 Figure A-10. Results of MNCRT-5 (EDR4) .............................................................................. 81 Figure A-11. Results of MNCRT-6 (EDR3) .............................................................................. 82 Figure A-12. Results of MNCRT-6 (EDR4) .............................................................................. 83
viii
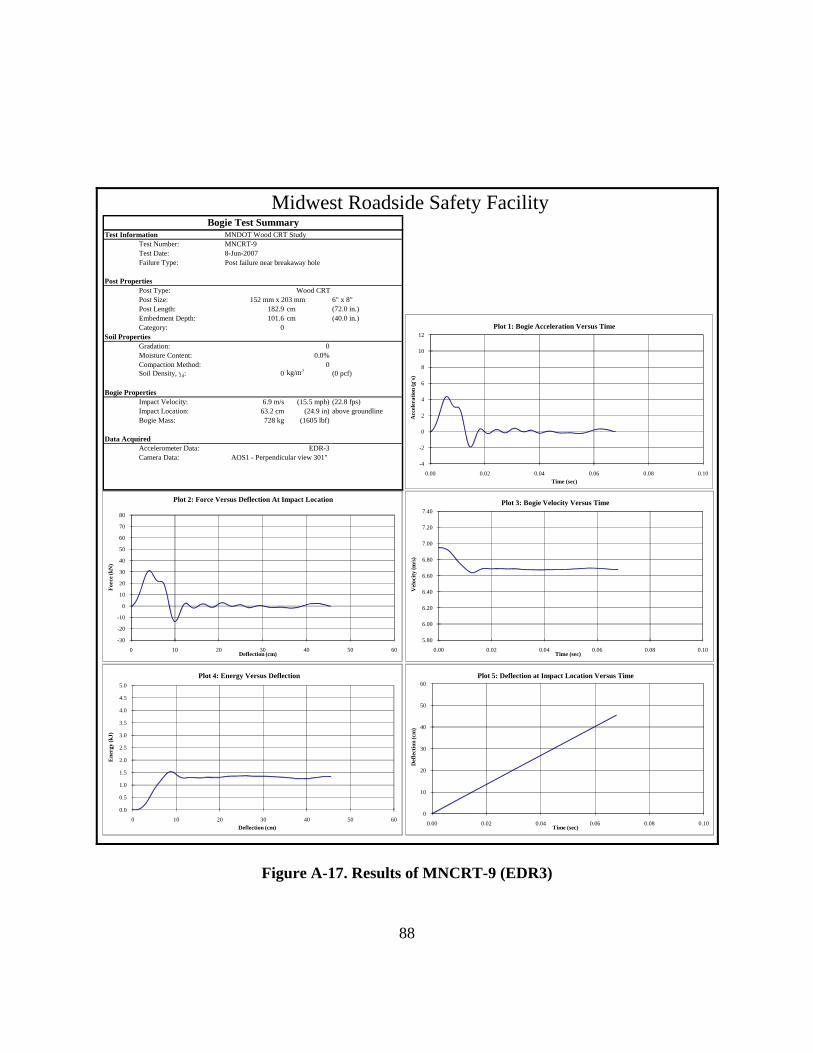
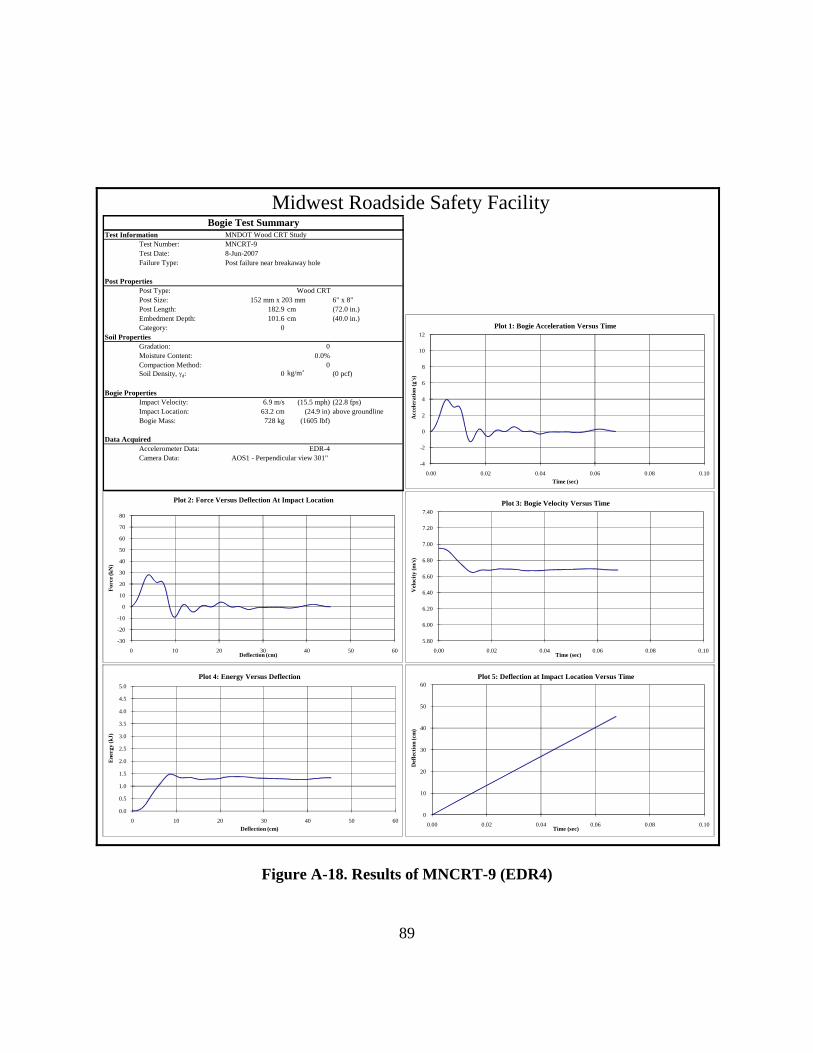
Figure A-13. Results of MNCRT-7 (EDR3) .............................................................................. 84 Figure A-14. Results of MNCRT-7 (EDR4) .............................................................................. 85 Figure A-15. Results of MNCRT-8 (EDR3) .............................................................................. 86 Figure A-16. Results of MNCRT-8 (EDR4) .............................................................................. 87 Figure A-17. Results of MNCRT-9 (EDR3) .............................................................................. 88 Figure A-18. Results of MNCRT-9 (EDR4) .............................................................................. 89
ix
List of Tables Page
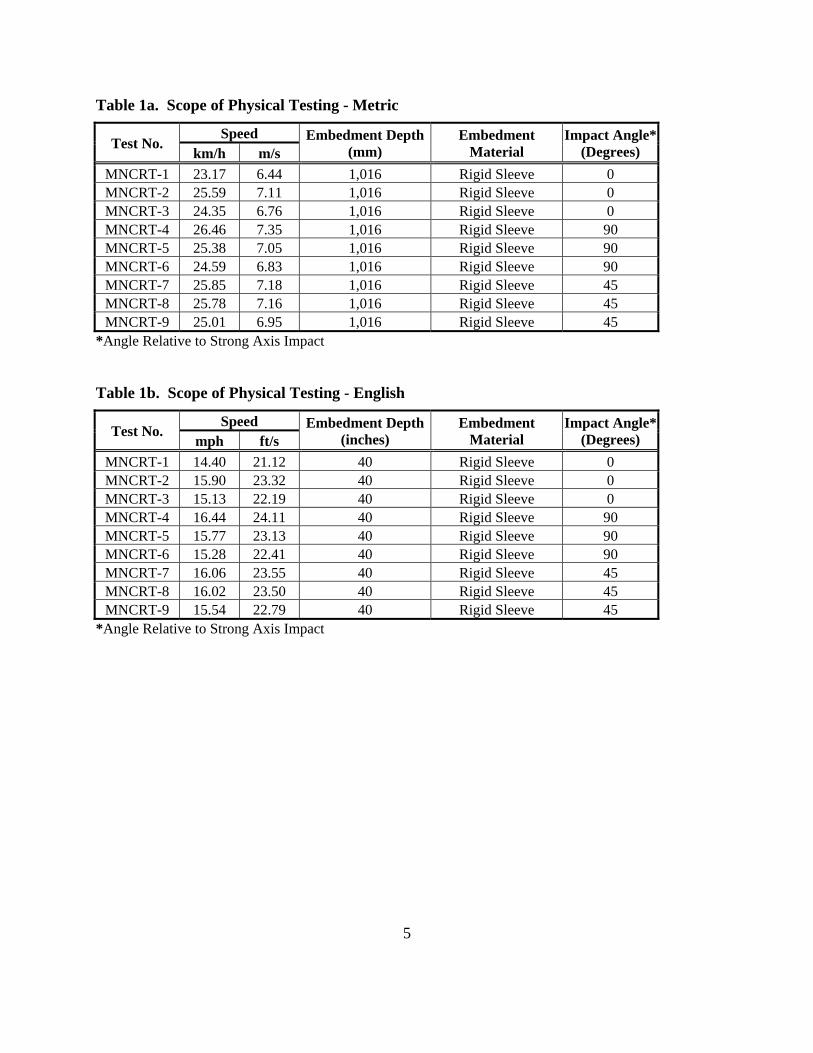
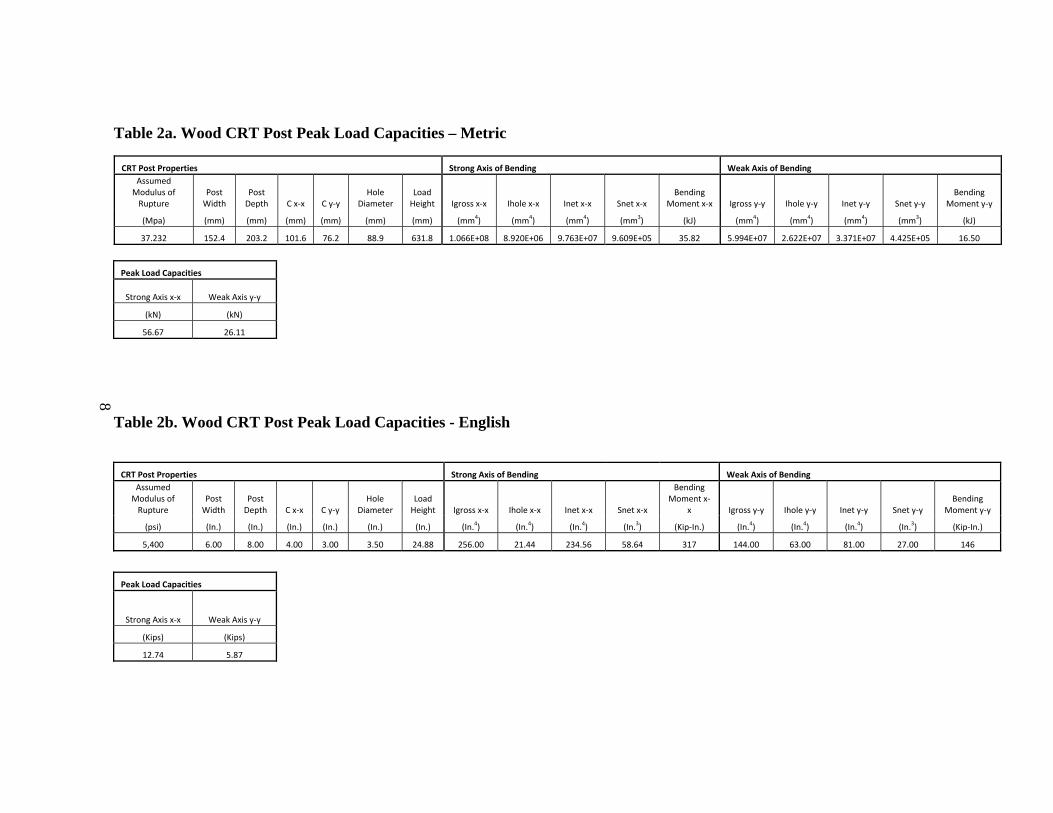
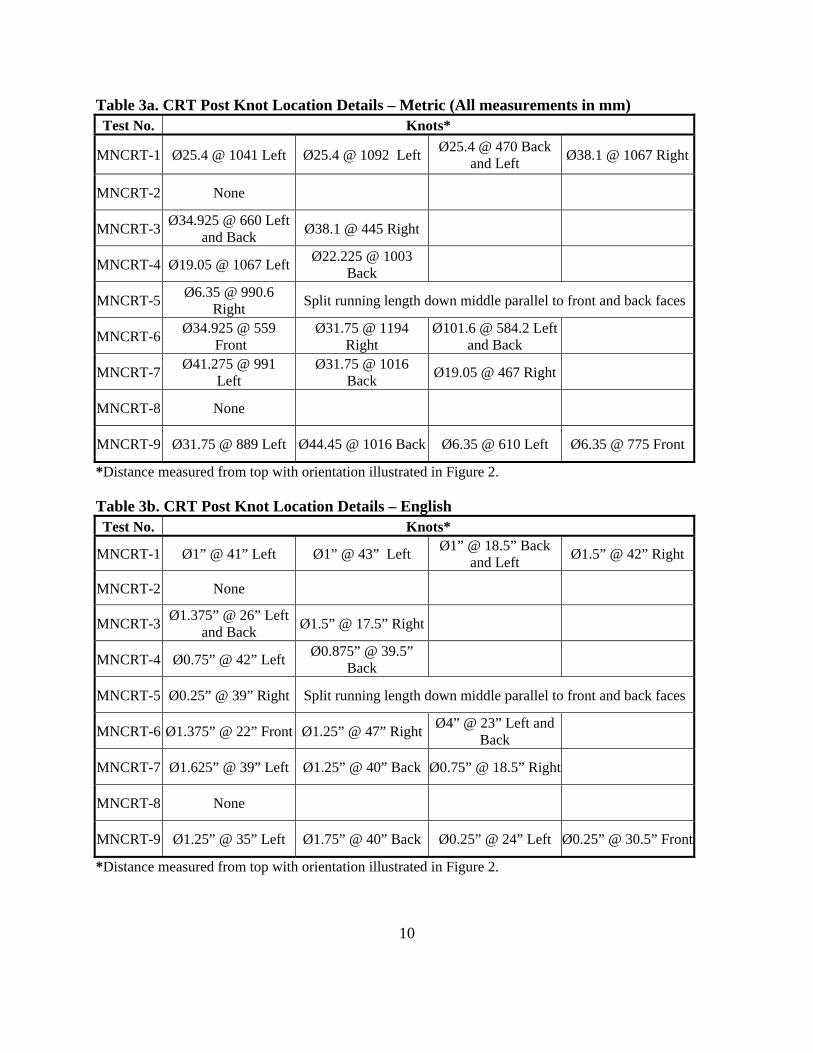
Table 1a. Scope of Physical Testing - Metric .............................................................................. 5 Table 1b. Scope of Physical Testing - English ............................................................................ 5 Table 2a. Wood CRT Post Peak Load Capacities - Metric ....................................................... 8 Table 2b. Wood CRT Post Peak Load Capacities - English ..................................................... 8 Table 3a. CRT Post Knot Location Details - Metric ............................................................... 10 Table 3b. CRT Post Knot Location Details - English .............................................................. 10 Table 4. Moisture Contents of Wood Posts .............................................................................. 11 Table 5a. Dimensions of CRT Wood Posts - Metric ................................................................ 12 Table 5b. Dimensions of CRT Wood Posts - English............................................................... 12 Table 6. Test Parameters ............................................................................................................ 16 Table 7a. Peak Force Results for MNCRT-1, MNCRT-2, and MNCRT-3 - Metric ............ 53 Table 7b. Peak Force Results for MNCRT-1, MNCRT-2, and MNCRT-3 - English ........... 53 Table 8a. Peak Force Results for MNCRT-4, MNCRT-5, and MNCRT-6 - Metric ............ 55 Table 8b. Peak Force Results for MNCRT-4, MNCRT-5, and MNCRT-6 - English ........... 55 Table 9a. Peak Force Results for MNCRT-7, MNCRT-8, and MNCRT-9 - Metric ............ 57 Table 9b. Peak Force Results for MNCRT-7, MNCRT-8, and MNCRT-9 - English ........... 57 Table 10a. Energy Results for MNCRT-1, MNCRT-2, and MNCRT-3 - Metric ................. 60 Table 10b. Energy Results for MNCRT-1, MNCRT-2, and MNCRT-3 - English ............... 60 Table 11a. Energy Results for MNCRT-4, MNCRT-5, and MNCRT-6 - Metric ................. 62 Table 11b. Energy Results for MNCRT-4, MNCRT-5, and MNCRT-6 - English ............... 63 Table 12a. Energy Results for MNCRT-7, MNCRT-8, and MNCRT-9 - Metric ................. 65 Table 12b. Energy Results for MNCRT-7, MNCRT-8, and MNCRT-9 - English ............... 65 Table A-1. Post Testing Summary ............................................................................................. 71 Table A-2. Post Testing Results Reference ............................................................................... 71
1
1 INTRODUCTION 1.1 Background
From 1997 through 2000, the Midwest Roadside Safety Facility (MwRSF) developed a
thrie-beam bullnose guardrail system for shielding median hazards found between divided
highways [1-3]. The new, non-proprietary bullnose guardrail system was successfully developed,
full-scale vehicle crash tested, and evaluated according to the Test Level 3 (TL-3) safety
performance criteria provided in National Cooperative Highway Research Program (NCHRP)
Report No. 350 [4].
In the bullnose guardrail system, controlled release terminal (CRT) wood posts were
used. Although the CRT posts adequately met the TL-3 safety requirements, these wood posts
contain several drawbacks. First, the properties and performance of wood posts can be variable
due to the existence of knots, checks, and splits, leading to the necessity of grading and
inspection requirements. In the CRT wood posts two holes are drilled in the post to allow the
post to breakaway upon impact, these holes further expose the interior of the wood to the
environment, which may accelerate deterioration. Wood posts can swell under certain
environmental conditions causing difficulty in the removal of broken posts from steel foundation
tubes after impact. Chemical preservatives used to treat the wood posts have been claimed to be
harmful to the environment. As such, the treated wood posts may require special consideration
during their disposal. As a result of these concerns about wood CRT posts, there exists a need for
the development of a new breakaway steel post to replace wood CRT posts for use in bullnose
guardrail systems, guardrail end terminals, and any longitudinal barrier systems.
2
For this study, several dynamic bogie tests on CRT wood posts oriented at varying angles
were performed. The results from the bogie tests will establish the performance criteria in the
development of a Universal Breakaway Steel Post for bullnose guardrail systems, guardrail end
terminals, and other longitudinal barrier systems. It is envisioned that the new steel post should
match the longitudinal, lateral, and torsional resistances of the existing CRT post, thus allowing
it to replace the CRT wood post in any guardrail application.
1.2 Objective
The objective of the research project was to determine the dynamic properties of the CRT
wood posts in different axes, thus later assisting the research team in the design of a Universal
Breakaway Steel Post. The breakaway steel post will need to reasonably reproduce the existing
properties of the CRT post that are observed in the dynamic bogie tests.
3
2 LITERATURE REVIEW
2.1 Prior Post Testing Results
Due to the wide variations of posts in roadside hardware, many post studies have been
previously performed. Hascall et al. [5] reviewed and summarized the previous post studies
completed from 1960 through 2004. The only relevant study of CRT post properties was
performed in the Ensco study “Safety Modification of Turned Down Guardrail Terminals” in
which the CRT post was developed [6]. This Ensco report consisted of three volumes and
described the development a safer turned-down guardrail terminal. The CRT wood post was
developed for use as a breakaway post in the turned-down terminal to allow the rail to fall freely
when impacted near the terminal and to redirect impacts occurring downstream of the first post
of the terminal.
4
3 PHYSICAL TESTING 3.1 Purpose
Physical testing of components is an important aspect of any design process. This study is
aimed at quantifying the mechanical properties of southern yellow pine CRT posts to set design
objectives for replacing them.
3.2 Test Facility
Physical testing of the control releasing terminal (CRT) wood posts was performed at the
MwRSF’s outdoor testing facility located at the Lincoln airpark, on the northwest side of the
Lincoln Municipal Airport.
3.3 Scope
The research objective was achieved by performing bogie crash tests on the CRT wood
posts oriented at different angles with known installation conditions. The dynamic properties of
the CRT wood post were determined with target impact conditions of a speed of 24.1 km/h (15
mph), rotation angles of 0, 45, and 90 degrees relative to the strong axis, and a height of 632 mm
(24.875 in.) above the ground line. The scope of the physical testing is listed in Table 1.
A total of nine tests, MNCRT-1 through MNCRT-9, were conducted with the posts
embedded in a rigid sleeve. All nine posts were embedded 1,016 mm (40 in.), as designed, into
the rigid sleeve, which placed the breakaway hole in the CRT at ground level. Design details for
the CRT posts are provided in Section 4.
The test results were analyzed and documented. Conclusions were then drawn that
pertain to the behavior of the wood posts under dynamic loading.
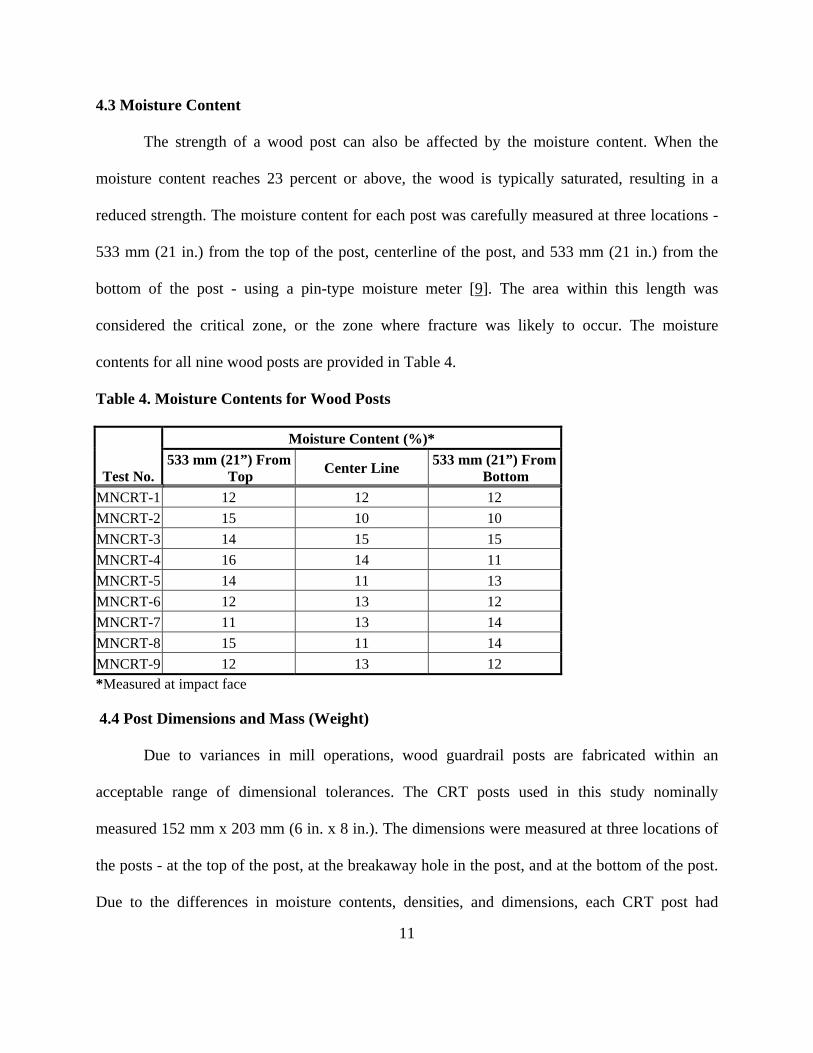
Due to variances in mill operations, wood guardrail posts are fabricated within an
acceptable range of dimensional tolerances. The CRT posts used in this study nominally
measured 152 mm x 203 mm (6 in. x 8 in.). The dimensions were measured at three locations of
the posts - at the top of the post, at the breakaway hole in the post, and at the bottom of the post.
Due to the differences in moisture contents, densities, and dimensions, each CRT post had
12
different weights. The results of the measurements and weights for each post test are given in
Table 5.
Table 5a. Dimensions of CRT Wood Posts – Metric
Test No. Mass (kg)
Post Dimensions (mm) @ Top @ Hole @ Bottom
MNCRT-1 24.9 154 x 205 152 x 202 152 x 203 MNCRT-2 35.4 151 x 203 149 x 198 152 x 202 MNCRT-3 25.9 154 x 200 149 x 200 151 x 203 MNCRT-4 29.0 152 x 203 156 x 203 156 x 202 MNCRT-5 28.6 152 x 200 149 x 200 149 x 203 MNCRT-6 30.8 151 x 200 151 x 197 149 x 198 MNCRT-7 29.5 151 x 200 149 x 200 149 x 202 MNCRT-8 28.6 149 x 200 151 x 202 151 x 203 MNCRT-9 29.5 149 x 202 151 x 200 152 x 200 Table 5b. Dimensions of CRT Wood Posts – English
Test No. Weight (lbs)
Post Dimensions (inches) @ Top @ Hole @ Bottom
MNCRT-1 55 6.06” x 8.06” 6” x 7.94” 6” x 8” MNCRT-2 78 5.94” x 8” 5.88” x 7.81” 6” x 7.94” MNCRT-3 57 6.06” x 7.88” 5.88” x 7.88” 5.94” x 8” MNCRT-4 64 6” x 8” 6.13” x 8” 6.13” x 7.94” MNCRT-5 63 6” x 7.88” 5.88” x 7.88” 5.88” x 8” MNCRT-6 68 5.94” x 7.88” 5.94” x 7.75” 5.88” x 7.81” MNCRT-7 65 5.94” x 7.88” 5.88” x 7.88” 5.88” x 7.94” MNCRT-8 63 5.88” x 7.88” 5.94” x 7.94” 5.94” x 8” MNCRT-9 65 5.88” x 7.94” 5.94” x 7.88” 6” x 7.88” 4.5 Rigid Sleeve and Wood Shims
For all nine tests, a rigid sleeve was utilized to anchor the post. The post was fitted into
the sleeve with wood blocks and shims to rigidly hold the post upright. The rigid placement of
the posts in the sleeve allowed for the determination of the dynamic wood properties before and
13
during fracture. It should be noted that there was no post interaction with soil. An example of a
post placed in the rigid sleeve with a 45 degree orientation is shown in Figure 3.
Figure 3. Shimmed CRT in Rigid Sleeve
4.6 Equipment and Instrumentation
The main equipment and instruments used for the tests were:
• Bogie
• Accelerometer
• Pressure Tape Switches
• Digital Photographic Cameras
14
4.6.1 Bogie
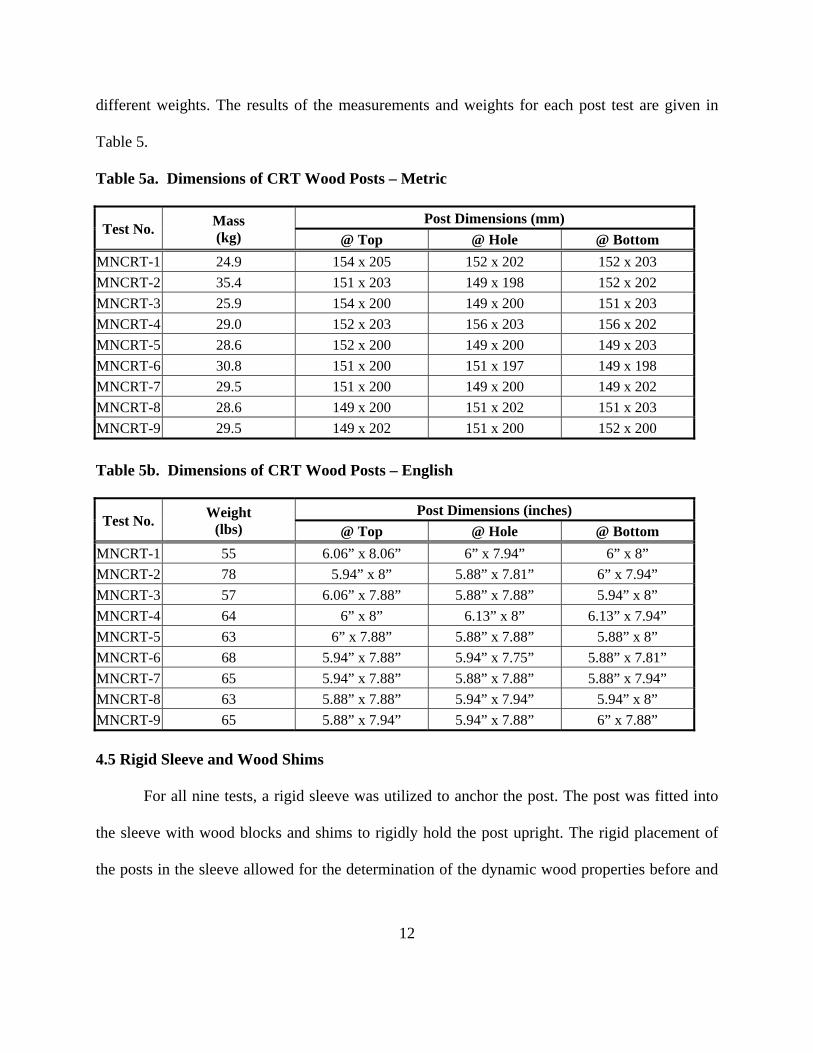
A rigid frame bogie was used to impact the posts. The bogie impact head was constructed
of 203-mm (8-in.) diameter by 12.5-mm (0.5-in.) thick, standard steel pipe, with 19-mm (0.75-
in.) thick, neoprene belting wrapped around the pipe to prevent local damage to the post from the
impact. The bogie with the impact head is shown in Figure 4. The mass (weight) of the bogie,
with the addition of the mountable impact head, was 728 kg (1,605 lbs). The impact height was
632 mm (24.875 in.) above the ground. The target speed for the tests was 24.14 km/h (15 mph).
In all tests, a pickup truck with a reverse cable tow and guide rail system was used to
propel the bogie. The bogie was accelerated toward the post along the guidance system, which
consisted of a steel pipe anchored above the tarmac. In all of the tests, the bogie wheels were
aligned for caster and toe-in values of zero so that the bogie would track properly. When the
bogie reached the end of the guidance system, it was released from the tow cable, allowing it to
be free rolling when it impacted the post. A remote braking system was installed on the bogie,
thus allowing it to be safely brought to rest after the test.
15
Figure 4. Bogie and Test Setup
4.6.2 Accelerometer
One tri-axial, piezo-resistive, accelerometer system Model EDR-4 with a range of ± 200
g’s was developed by Instrumented Sensor Technology (IST) of Okemos, Michigan and was
mounted on the frame of the bogie near its center of gravity. Data sampling was at 10,000 Hz
with a Butterworth low-pass filter with a –3dB cut-off frequency of 1,500 Hz was used for anti-
aliasing.
Another tri-axial, piezo-resistive, accelerometer system Model EDR-3 with a range of ±
200 g’s was also developed by Instrumented Sensor Technology (IST) of Okemos, Michigan and
was mounted on the frame on the bogie near its center of gravity. Data sampling was at 3,200 Hz
with a 1,120 Hz Butterworth low-pass filter with a -3dB cut-off.
A laptop computer downloaded the raw acceleration data immediately following each
test. The computer made the use of “DynaMax 1.75” accelerometer software [10] and then
16
loaded into “DADiSP 4.0” data processing program [11]. The data was processed according to
the SAE J211/1 specifications [12].
4.6.3 Pressure Tape Switches
Three pressure tape switches spaced at a distance of 0.457-m (1.5-ft) intervals were used
to determine the speed of the bogie before the impact. As the left-front tire of the bogie passed
over each tape switch, a strobe light was fired, sending an electronic timing signal to the data
acquisition system. Test speeds were determined by knowing the time between these signals
from the data acquisition system and the distance between the switches.
4.6.4 Photography Cameras
One high-speed AOS VIT cam digital video camera, with a Sigma 24-70 mm lens and an
operating speed of 500 frames/sec, was located perpendicular to the post impact direction. One
JVC digital video camera, with an operating speed of 29.97 frames/sec, was also used to film the
bogie test.
4.7 Methodology of Testing
A total of nine impact tests were carried out on posts placed in a rigid sleeve with three
tests each at 0, 45, and 90 degrees relative to the strong axis of bending. The test parameters are
shown in Table 6.
Table 6. Test Parameters
MNCRT Test Parameters MNCRT: Control Releasing Terminal Wood Post Test: Impact in rigid sleeve at 0, 45, and 90 degrees with respect to strong axis Accelerometer: EDR-3 and EDR-4 Data Bogie Mass (Weight): 728.0 kg (1,605 lbs) Bumper Height: 632 mm (24.875 in.) Posts: 152 mm x 203 mm (6 in. x 8 in.) Post Length: 1,829 mm (72 in.)
17
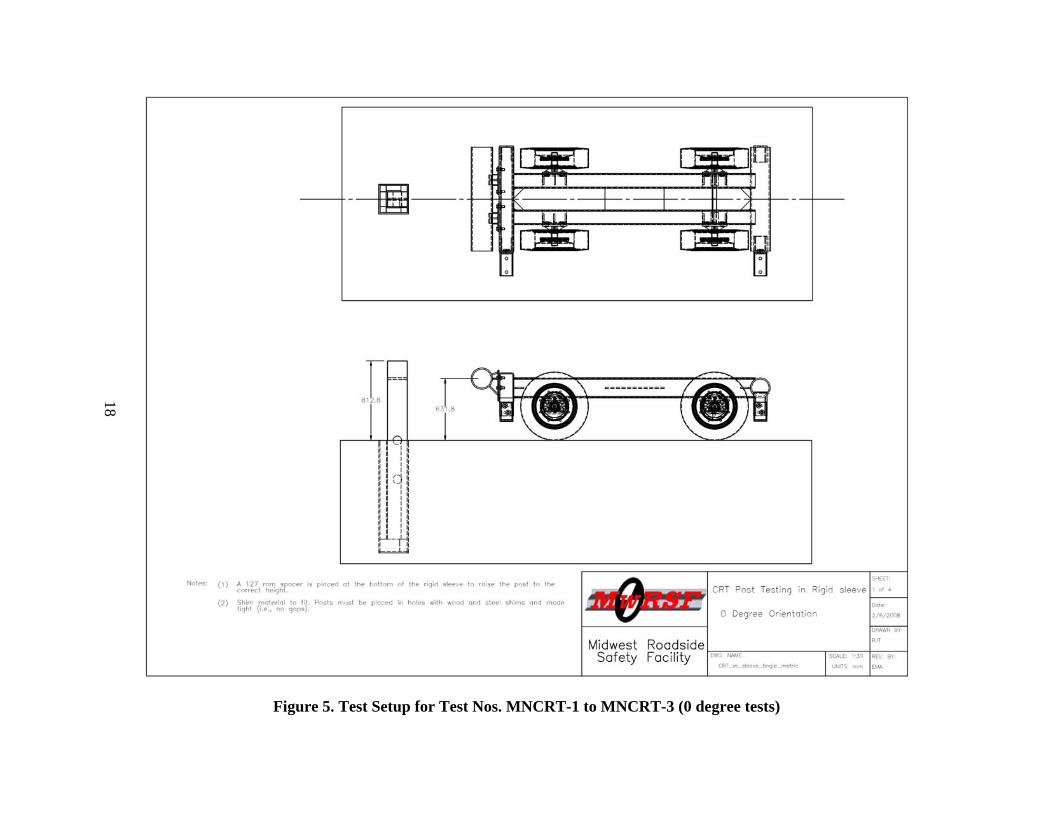
Three different test setups were used to conduct the tests. The test setup for the 0-degree,
strong-axis bogie tests, test nos. MNCRT-1 through MNCRT-3, is shown in Figure 5. The test
setup for the 90-degree, weak-axis bogie tests, test nos. MNCRT-4 through MNCRT-6, is shown
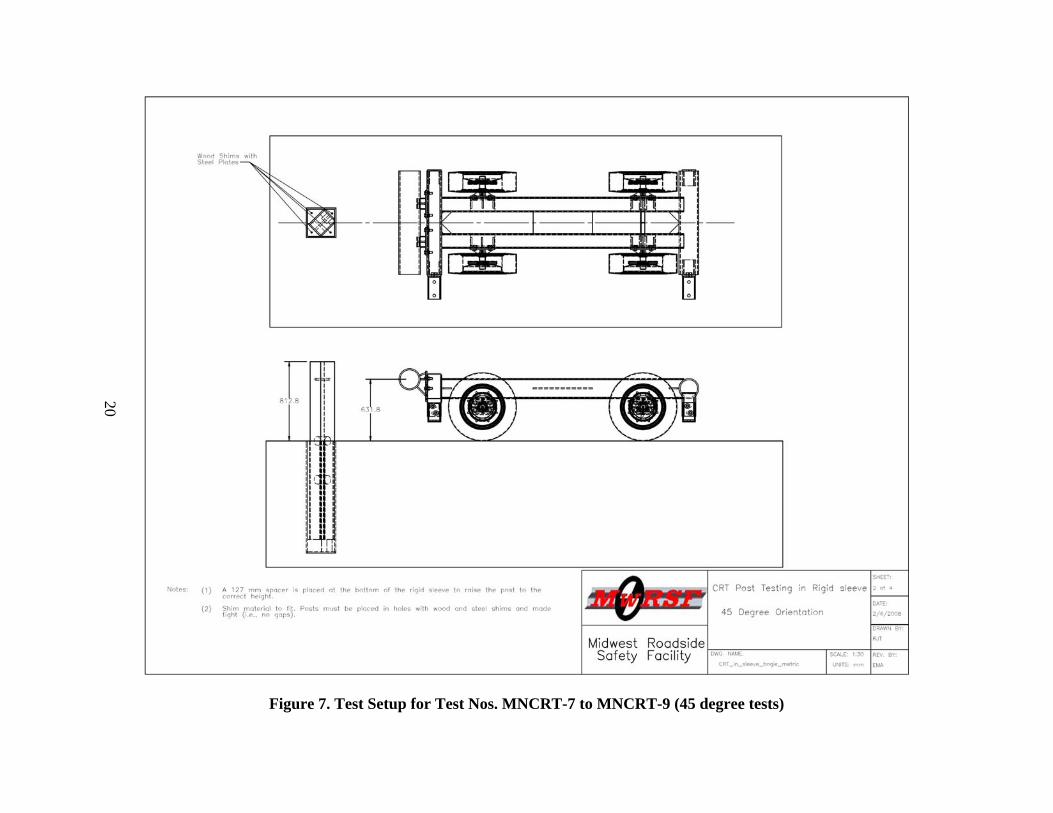
in Figure 6. For the final setup, the wood post’s orientation was changed for a 45 degree impact,
as provided in Figure 7.
18
Figure 5. Test Setup for Test Nos. MNCRT-1 to MNCRT-3 (0 degree tests)
19
Figure 6. Test Setup for Test Nos. MNCRT-4 to MNCRT-6 (90 degree tests)
20
Figure 7. Test Setup for Test Nos. MNCRT-7 to MNCRT-9 (45 degree tests)
21
4.8 End of Test Determination
During an impact, the data acquisition system records the accelerations that the bogie
observes from all sources, not just the post. Because of this, vibrations in the bogie vehicle,
impact head, and accelerometer mounting assembly are also recorded and result in a high
frequency acceleration trace. Since the bogie vehicle may still be vibrating after the impact
event, the data may extend beyond the failure of the post. For this reason, the end of the test
needed to be defined.
In general, this event time was identified as the time that the vibration peaks in the
acceleration trace subsided back toward zero when it was clear that the continuation of vibrations
were not caused by the interaction with the post. Also, some limitations were established so there
were no unreasonably long test durations. First, all tests were limited to a 508-mm (20-in.)
maximum deflection because it was decided that no post would have the capacity to deflect more
than 508 mm (20 in.) in a rigid sleeve without complete fracture. Second, each test was limited
by the bogie-post contact time. For each test, the high-speed video was used to establish the
length of time that the bogie was actually in contact with the post. This time was then used to
define the end of the test.
4.9 Data Processing
Initially, the bulk of the data was filtered using the SAE Class 60 Butterworth filter
conforming to the SAE J211/1 specifications. The pertinent acceleration signal was extracted
from the bulk of the data. The processed acceleration data was then multiplied by the mass of the
bogie to get the impact force using Newton’s Second Law. Next, the acceleration trace was
integrated to find the change in velocity. The initial velocity of the bogie, calculated using the
data from the pressure tape switches, was then used to determine the actual bogie velocity versus
22
time. The calculated actual velocity trace versus time was integrated to find the displacement
versus time trace. Subsequently, using the previous results, the force versus deflection curve was
plotted for each test. Finally, integration of the force versus deflection curve provided the energy
versus displacement curve for each test.
23
5 TEST RESULTS AND DISCUSSION 5.1 Introduction
The information desired from the physical tests was the relation between force on the
post and deflection of the post at the impact location. This data was then used to find total energy
(the area under the force versus deflection curve) dissipated during each test.
It should be noted that although the acceleration data was applied to the impact location,
the data came from the center of gravity of the bogie. This added some error to the data, since the
bogie was not perfectly rigid, causing vibrations in the bogie. Also, the bogie may have rotated
during impact, causing differences in accelerations between the bogie center of mass and the
bogie impact head. While these issues may affect the data, it was believed that the data was not
greatly influenced by them, and as a result, the data was useful for analysis. One useful aspect of
using accelerometer data was that it included influences of the post inertia on the reaction force.
This is important since the post's mass would affect the results.
The accelerometer data was processed for each test in order to obtain acceleration,
velocity, and displacement curves, as well as force versus deflection curves. This section
discusses those results for the EDR-3 accelerometer. Although both the EDR-3 and EDR-4 data
recorders were used for the tests, the current EDR-3 has a more accurate representation of the
data than the existing EDR-4 unit, even with the lower sampling rate. However, for this post
testing program, the two accelerometers provided similar results. Individual test results are
provided in Appendix A for both the EDR-3 and EDR-4 recorders.
24
5.2 Individual Test Results and Discussion
The following sections discuss the dynamic behaviors and results for test nos. MNCRT-1
through MNCRT-9. However, it was not the objective of this section to draw comparisons
between the posts tested but rather to identify the behaviors observed during each of the dynamic
impact tests. Conclusions regarding the performance comparison of the posts are discussed in a
subsequent chapter of this report.
25
TIME = 20 ms
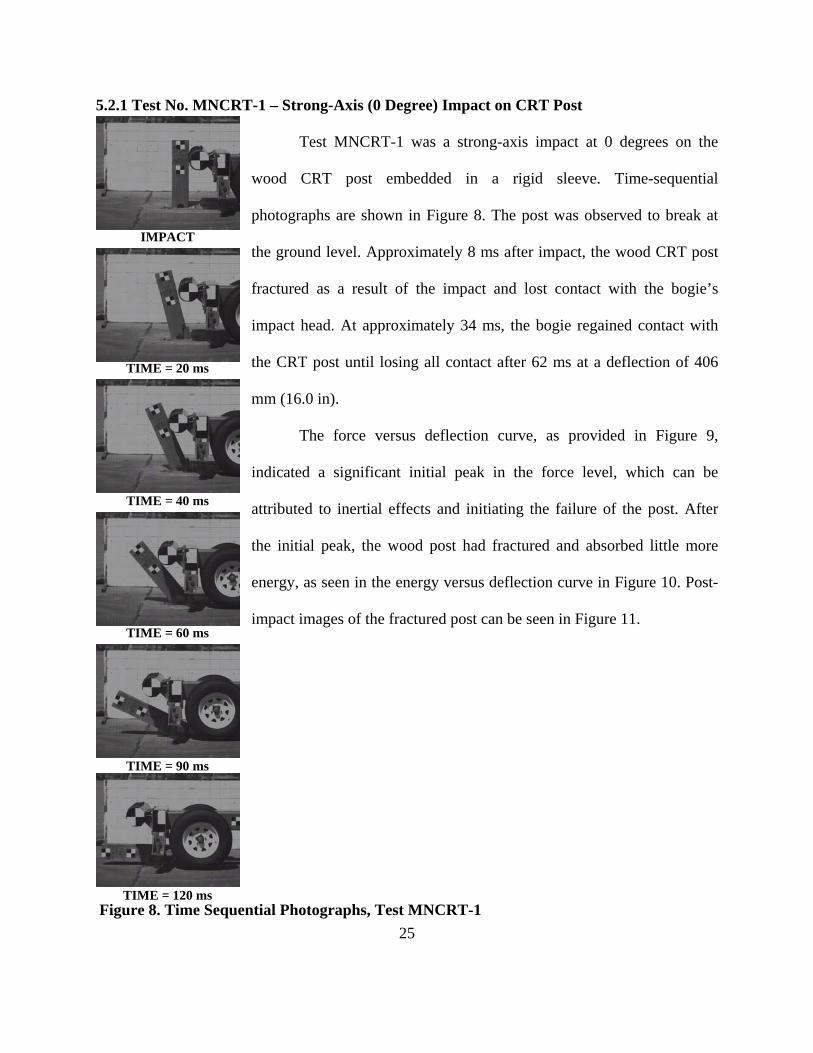
Figure 8. Time Sequential Photographs, Test MNCRT-1
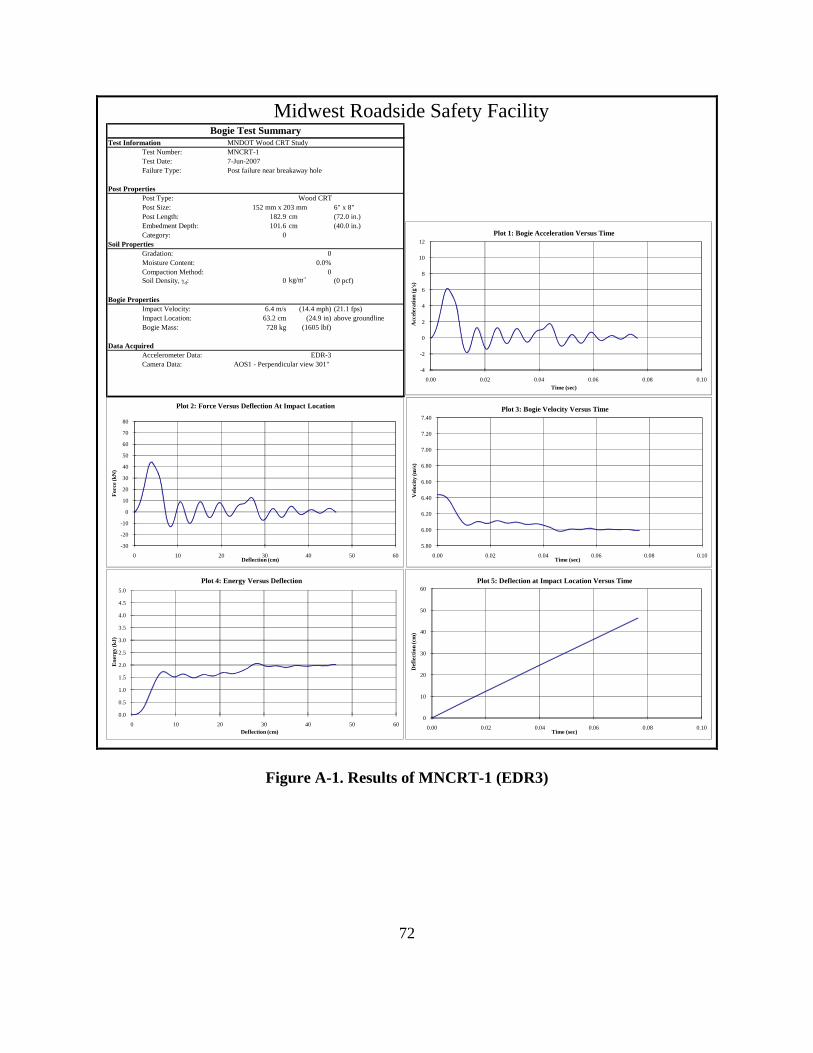
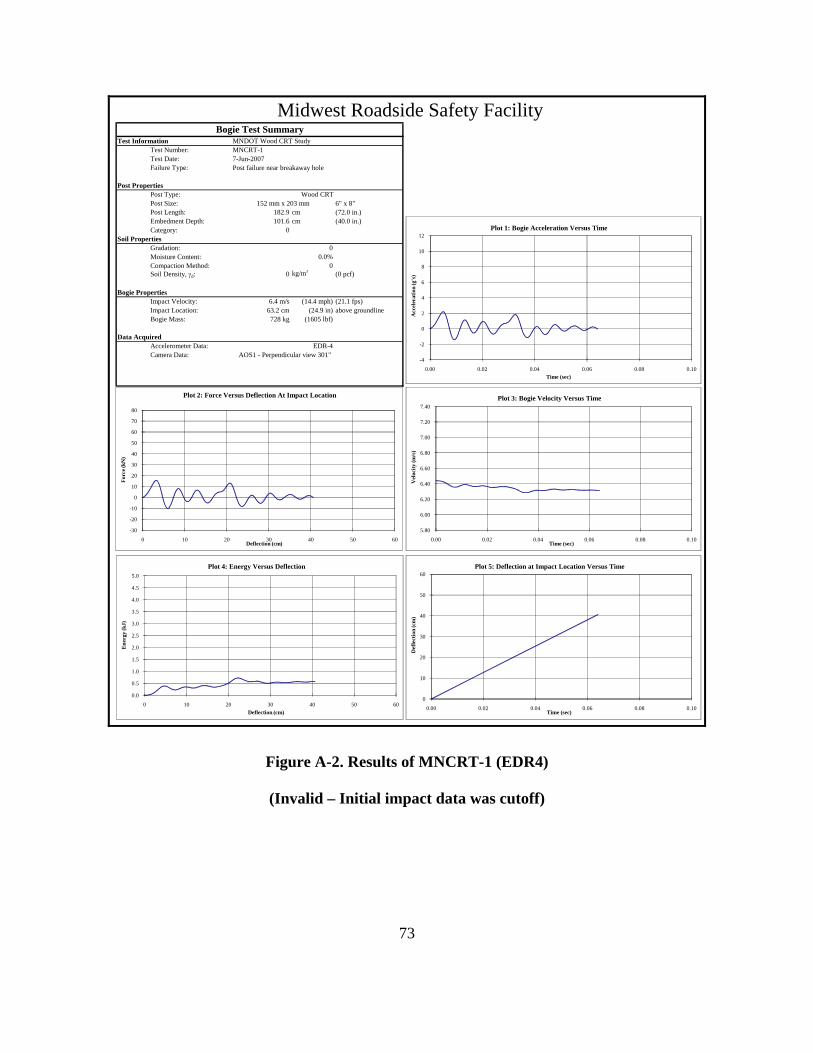
5.2.1 Test No. MNCRT-1 – Strong-Axis (0 Degree) Impact on CRT Post
Test MNCRT-1 was a strong-axis impact at 0 degrees on the
wood CRT post embedded in a rigid sleeve. Time-sequential
photographs are shown in Figure 8. The post was observed to break at
the ground level. Approximately 8 ms after impact, the wood CRT post
fractured as a result of the impact and lost contact with the bogie’s
impact head. At approximately 34 ms, the bogie regained contact with
the CRT post until losing all contact after 62 ms at a deflection of 406
mm (16.0 in).
The force versus deflection curve, as provided in Figure 9,
indicated a significant initial peak in the force level, which can be
attributed to inertial effects and initiating the failure of the post. After
the initial peak, the wood post had fractured and absorbed little more
energy, as seen in the energy versus deflection curve in Figure 10. Post-
impact images of the fractured post can be seen in Figure 11.
IMPACT
TIME = 40 ms
TIME = 60 ms
TIME = 90 ms
TIME = 120 ms
26
0.0
0.5
1.0
1.5
2.0
2.5
3.0
3.5
4.0
4.5
5.0
0 50 100 150 200 250 300 350 400 450 500
Ener
gy (k
J)
Deflection (mm)
Energy Versus Deflection (MNCRT-1)
EDR3
0
5
10
15
20
25
30
35
40
0 2 4 6 8 10 12 14 16 18 20
Ene
rgy
(Kip
-In.)
Deflection (In.)
Energy Versus Deflection (MNCRT-1)
EDR3
-6
-4
-2
0
2
4
6
8
10
12
14
16
18
0 2 4 6 8 10 12 14 16 18 20
Forc
e (K
ips)
Deflection (In.)
Force Versus Deflection (MNCRT-1)
EDR3
-30
-20
-10
0
10
20
30
40
50
60
70
80
0 50 100 150 200 250 300 350 400 450 500
Forc
e (k
N)
Deflection (mm)
Force Versus Deflection (MNCRT-1)
EDR3
Figure 9a. Force versus Deflection Curve for MNCRT-1 – Metric Figure 10a. Energy versus Deflection Curve for MNCRT-1 – Metric
Figure 9b. Force versus Deflection Curve for MNCRT-1 – English Figure 10b. Energy versus Deflection Curve for MNCRT-1 – English
27
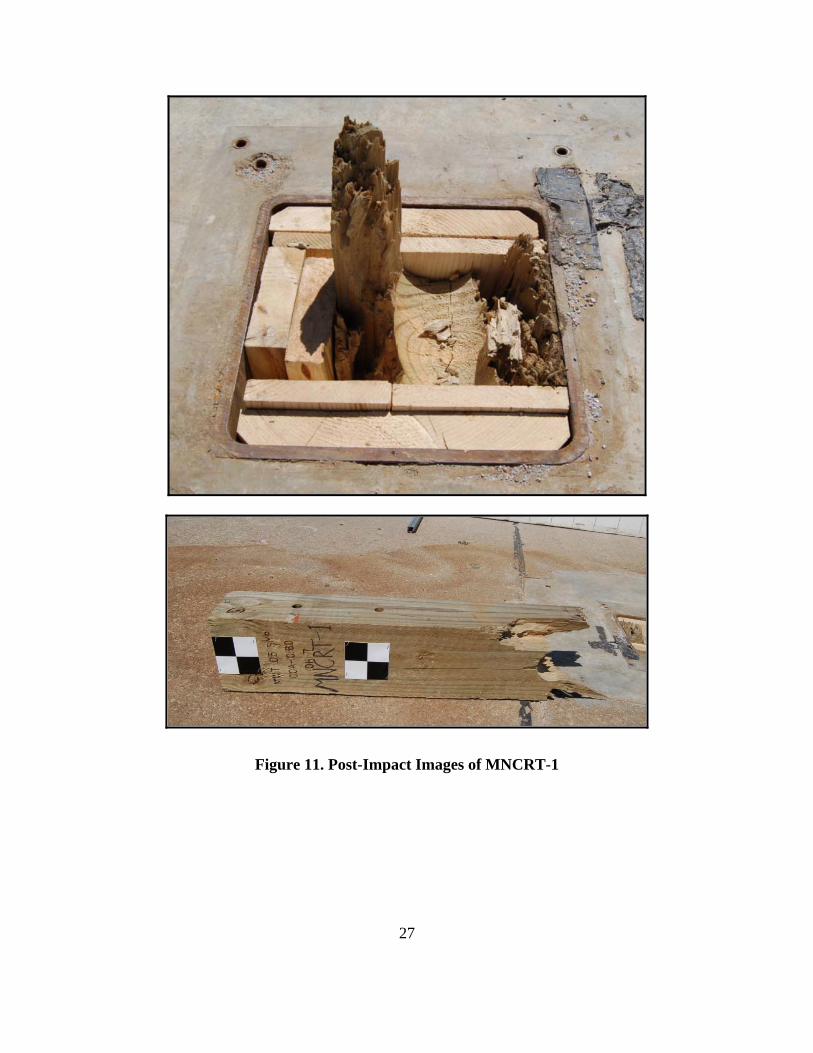
Figure 11. Post-Impact Images of MNCRT-1
28
TIME = 20 ms
Figure 12. Time Sequential Photographs, Test MNCRT-2
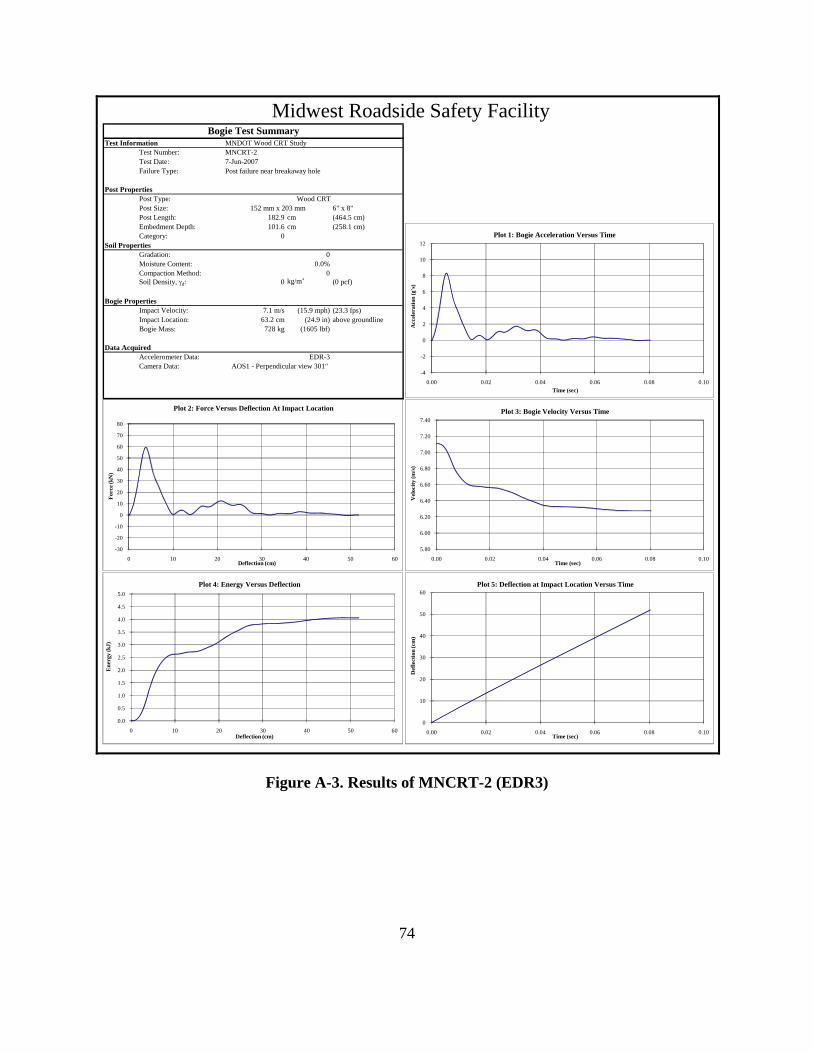
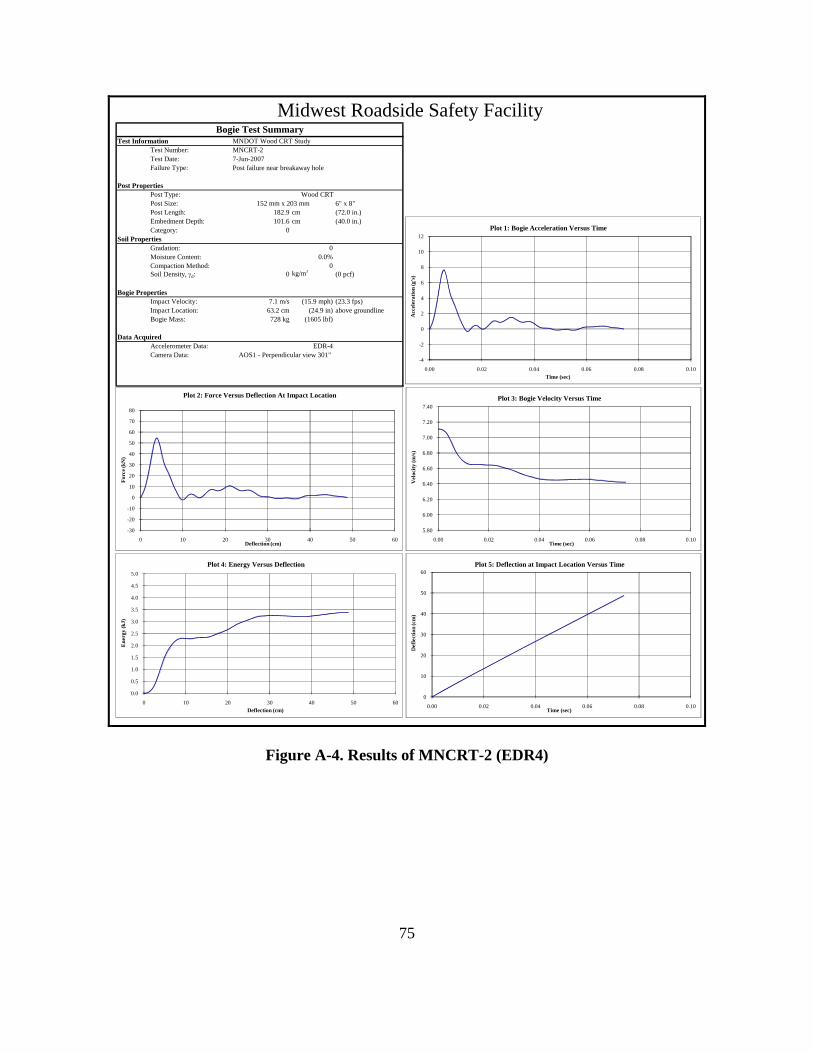
5.2.2 Test No. MNCRT-2 – Strong-Axis (0 Degree) Impact on CRT Post
Test MNCRT-2 was also a strong-axis impact at 0 degrees on the
wood CRT post embedded in a rigid sleeve. Time-sequential
photographs are shown in Figure 12. Even though this test repeated test
MNCRT-1, the wood post exhibited different behaviors by splitting
down the middle before fracturing at the breakaway hole. Also, when
the post was impacted, it did not completely fracture immediately like in
test MNCRT-1. These differences can be attributed to differences in the
wood, especially with no knots present in the MNCRT-2 post. With the
combination of the wood splitting down the middle of the post and the
wood fracturing near the breakaway hole, the CRT post lost strength and
broke into two pieces, eventually losing all contact after 110 ms.
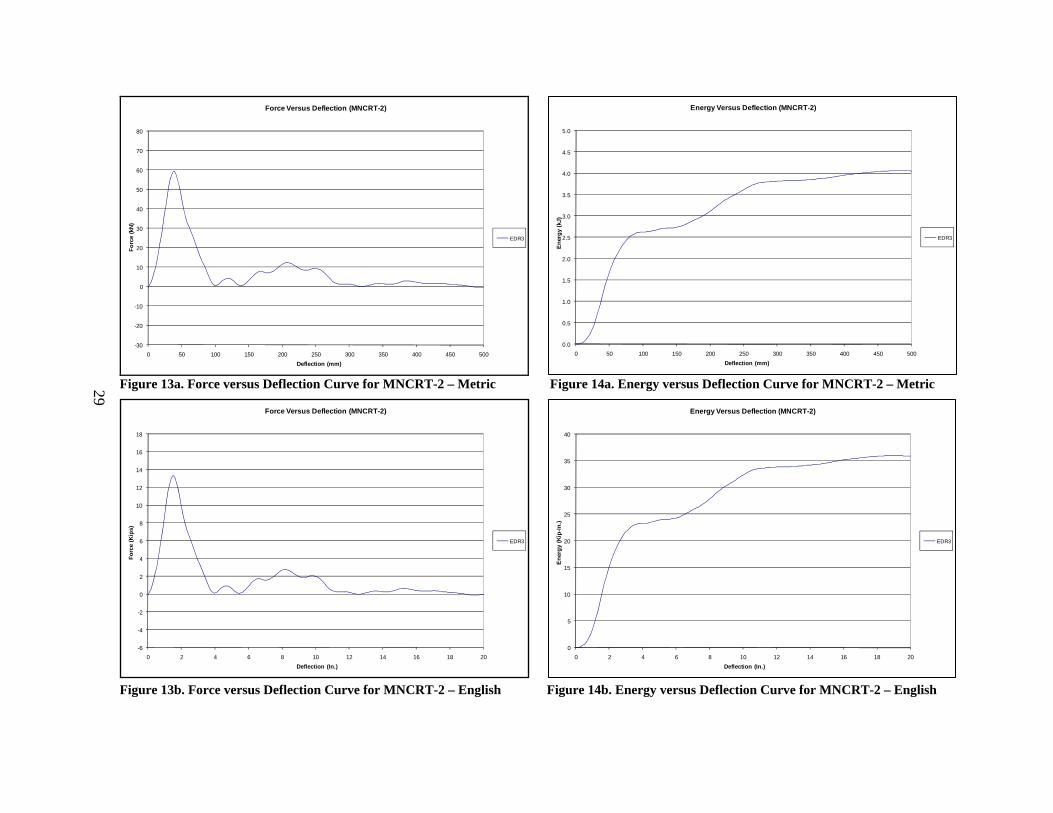
Examination of the force versus deflection curve, as seen in
Figure 13, indicated an initial large peak followed by a region of fairly
uniform force levels. These forces can be attributed to the initial inertial
effects and fracturing of the wood near the breakaway hole, respectively.
The force level then tapered off for the duration of the test, and the post
absorbed little more energy, as illustrated in the energy versus deflection
curve in Figure 14. Post-impact images of the fractured post can be seen
in Figure 15.
TIME = 120 ms
TIME = 60 ms
TIME = 40 ms
IMPACT
TIME = 90 ms
29
0.0
0.5
1.0
1.5
2.0
2.5
3.0
3.5
4.0
4.5
5.0
0 50 100 150 200 250 300 350 400 450 500
Ene
rgy
(kJ)
Deflection (mm)
Energy Versus Deflection (MNCRT-2)
EDR3
-6
-4
-2
0
2
4
6
8
10
12
14
16
18
0 2 4 6 8 10 12 14 16 18 20
Forc
e (K
ips)
Deflection (In.)
Force Versus Deflection (MNCRT-2)
EDR3
0
5
10
15
20
25
30
35
40
0 2 4 6 8 10 12 14 16 18 20
Ene
rgy
(Kip
-In.)
Deflection (In.)
Energy Versus Deflection (MNCRT-2)
EDR3
-30
-20
-10
0
10
20
30
40
50
60
70
80
0 50 100 150 200 250 300 350 400 450 500
Forc
e (k
N)
Deflection (mm)
Force Versus Deflection (MNCRT-2)
EDR3
Figure 13a. Force versus Deflection Curve for MNCRT-2 – Metric Figure 14a. Energy versus Deflection Curve for MNCRT-2 – Metric
Figure 13b. Force versus Deflection Curve for MNCRT-2 – English Figure 14b. Energy versus Deflection Curve for MNCRT-2 – English
30
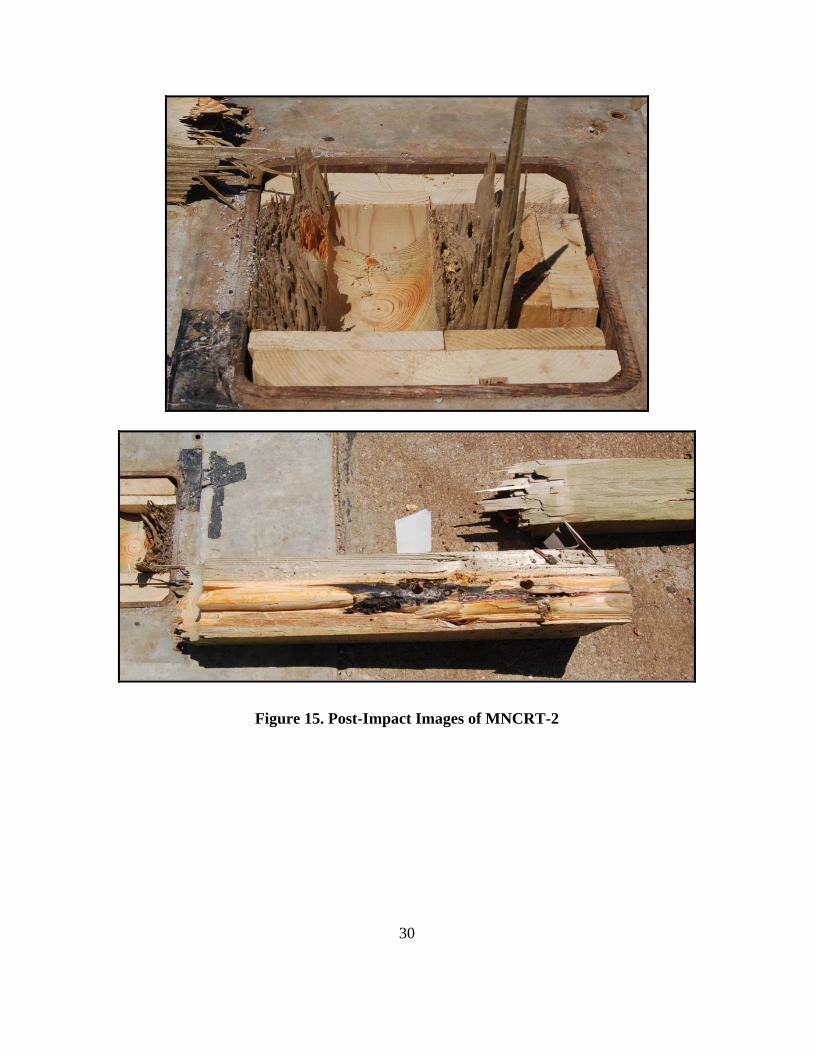
Figure 15. Post-Impact Images of MNCRT-2
31
TIME = 20 ms
Figure 16. Time Sequential Photographs, Test MNCRT-3
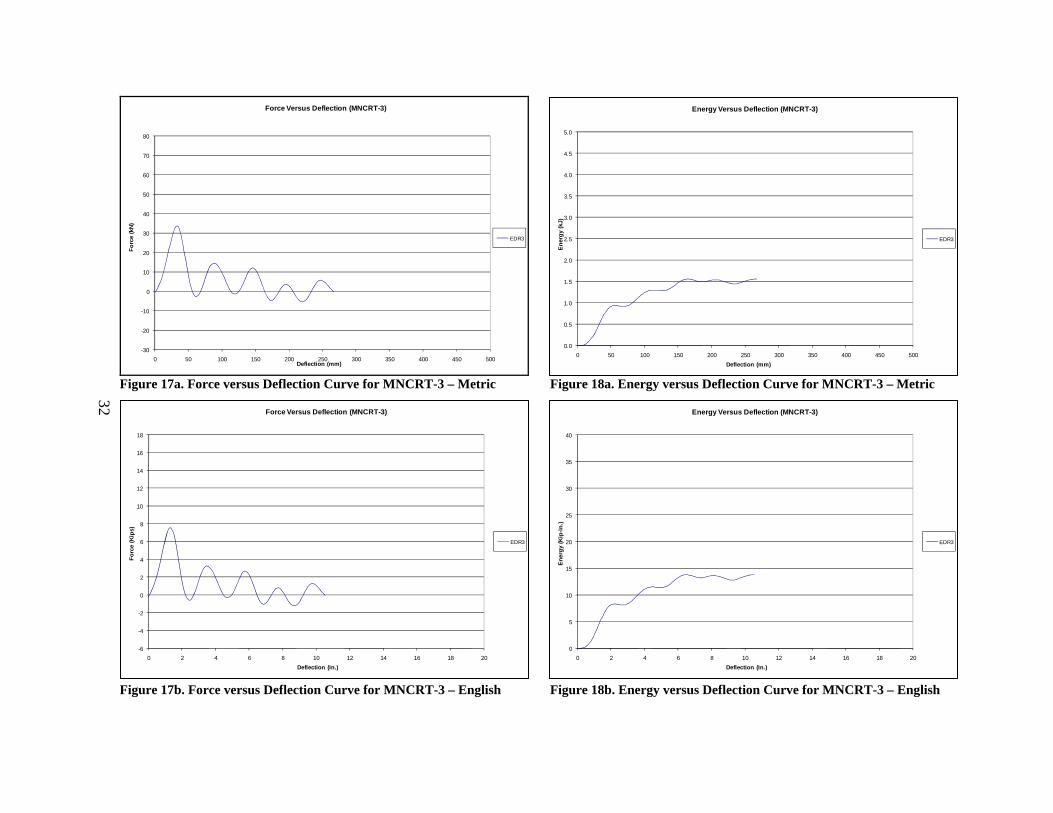
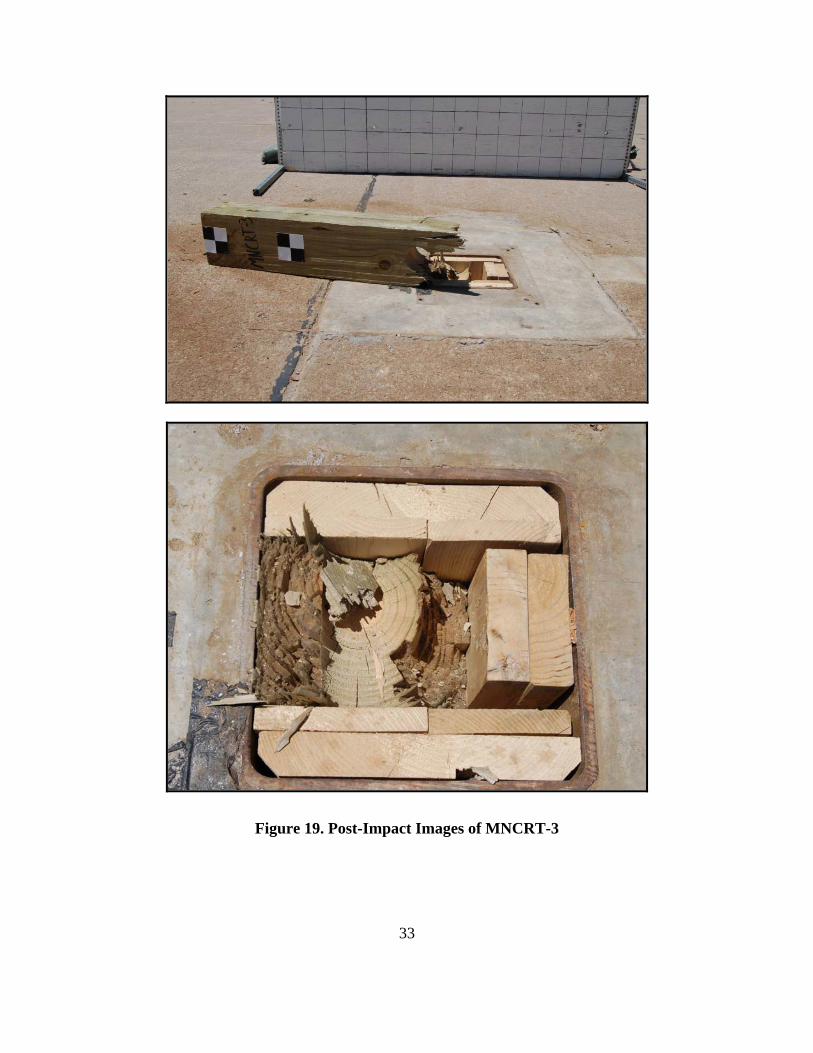
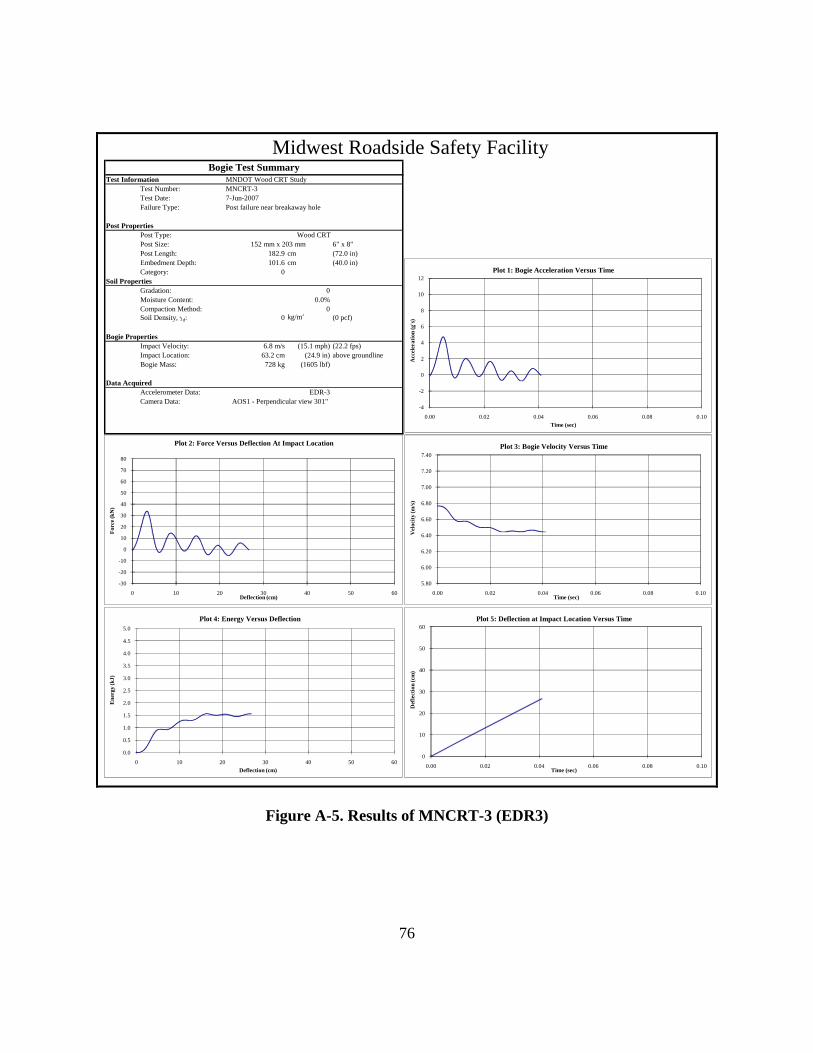
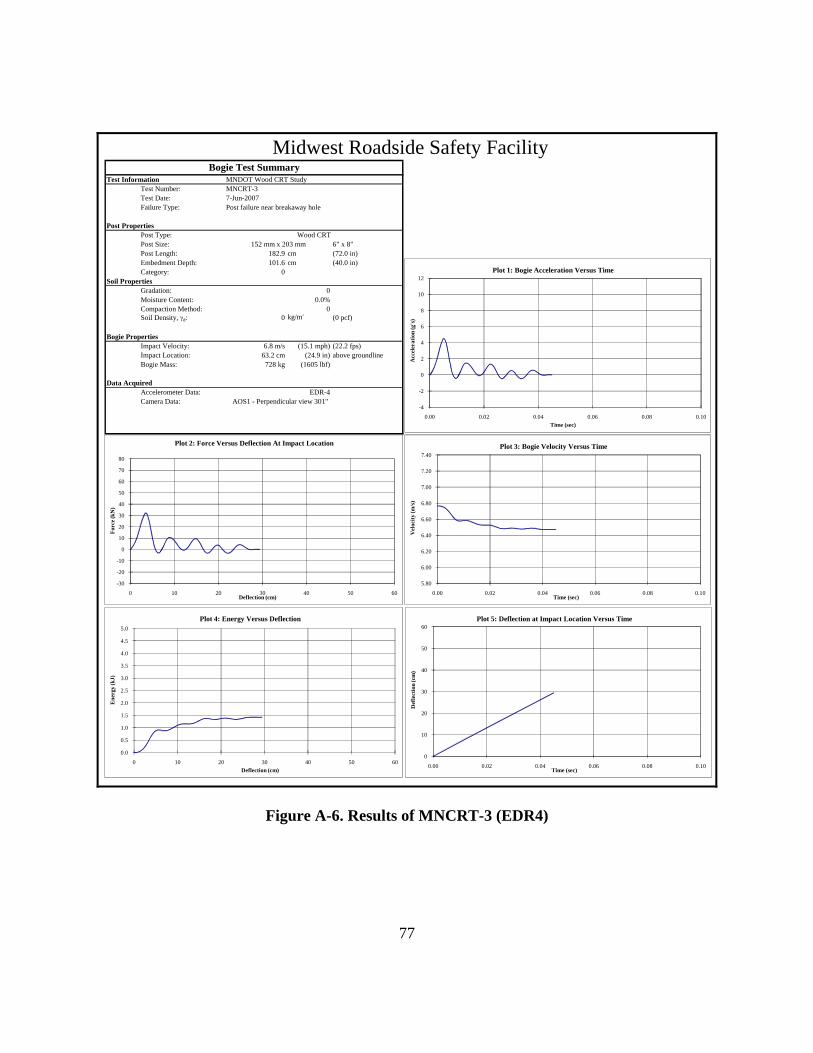
5.2.3 Test No. MNCRT-3 – Strong-Axis (0 Degree) Impact on CRT Post
Test MNCRT-3 was the final test of a strong-axis impact at 0
degrees on the wood CRT post embedded in a rigid sleeve. Time-
sequential photographs are shown in Figure 16. The post began to
fracture at ground level near the breakaway hole almost immediately.
The CRT post continued to rotate and lose strength, while more of the
wood fractured. Eventually, the impact cylinder lost all contact with the
post at 94 ms, resulting in the termination of the test.
The force versus deflection profile, as shown in Figure 17,
indicated a similar behavior to that of test MNCRT-1. However, the
magnitude of the initial peak was not as high, which can be attributed to
the differences in the properties of the wood. Following the initial
portion of the impact, the force level then tapered off in a comparable
magnitude and duration to test MNCRT-1 due to their similar failure
mode. In both tests, the wood only provided resistance in the initial
inertial effects, which caused the wood to fracture and provide little
more resistance, as shown in the energy versus deflection curve in
Figure 18. Post-impact images of the fractured post can be seen in
Figure 19.
TIME = 40 ms
TIME = 60 ms
TIME = 120 ms
IMPACT
TIME = 90 ms
32
-6
-4
-2
0
2
4
6
8
10
12
14
16
18
0 2 4 6 8 10 12 14 16 18 20
Forc
e (K
ips)
Deflection (In.)
Force Versus Deflection (MNCRT-3)
EDR3
0
5
10
15
20
25
30
35
40
0 2 4 6 8 10 12 14 16 18 20
Ene
rgy
(Kip
-In.)
Deflection (In.)
Energy Versus Deflection (MNCRT-3)
EDR3
0.0
0.5
1.0
1.5
2.0
2.5
3.0
3.5
4.0
4.5
5.0
0 50 100 150 200 250 300 350 400 450 500
Ene
rgy
(kJ)
Deflection (mm)
Energy Versus Deflection (MNCRT-3)
EDR3
-30
-20
-10
0
10
20
30
40
50
60
70
80
0 50 100 150 200 250 300 350 400 450 500
Forc
e (k
N)
Deflection (mm)
Force Versus Deflection (MNCRT-3)
EDR3
Figure 17a. Force versus Deflection Curve for MNCRT-3 – Metric Figure 18a. Energy versus Deflection Curve for MNCRT-3 – Metric
Figure 17b. Force versus Deflection Curve for MNCRT-3 – English Figure 18b. Energy versus Deflection Curve for MNCRT-3 – English
33
Figure 19. Post-Impact Images of MNCRT-3
34
TIME = 20 ms
Figure 20. Time Sequential Photographs, Test MNCRT-4
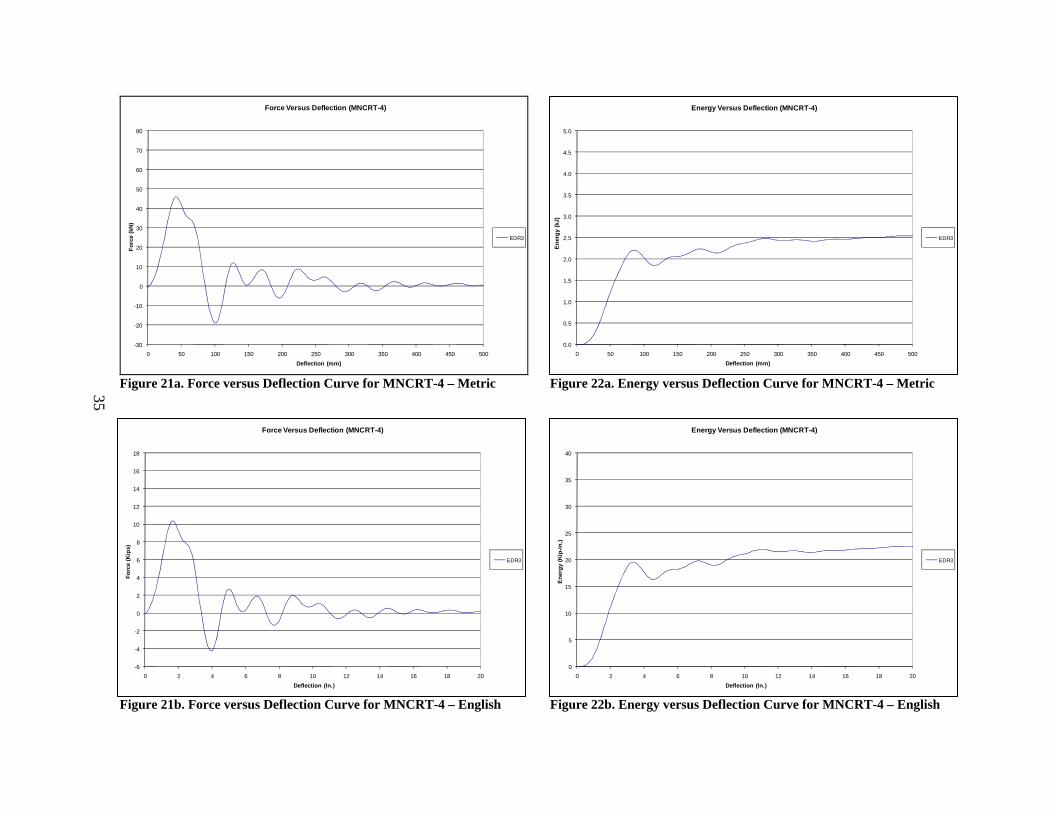
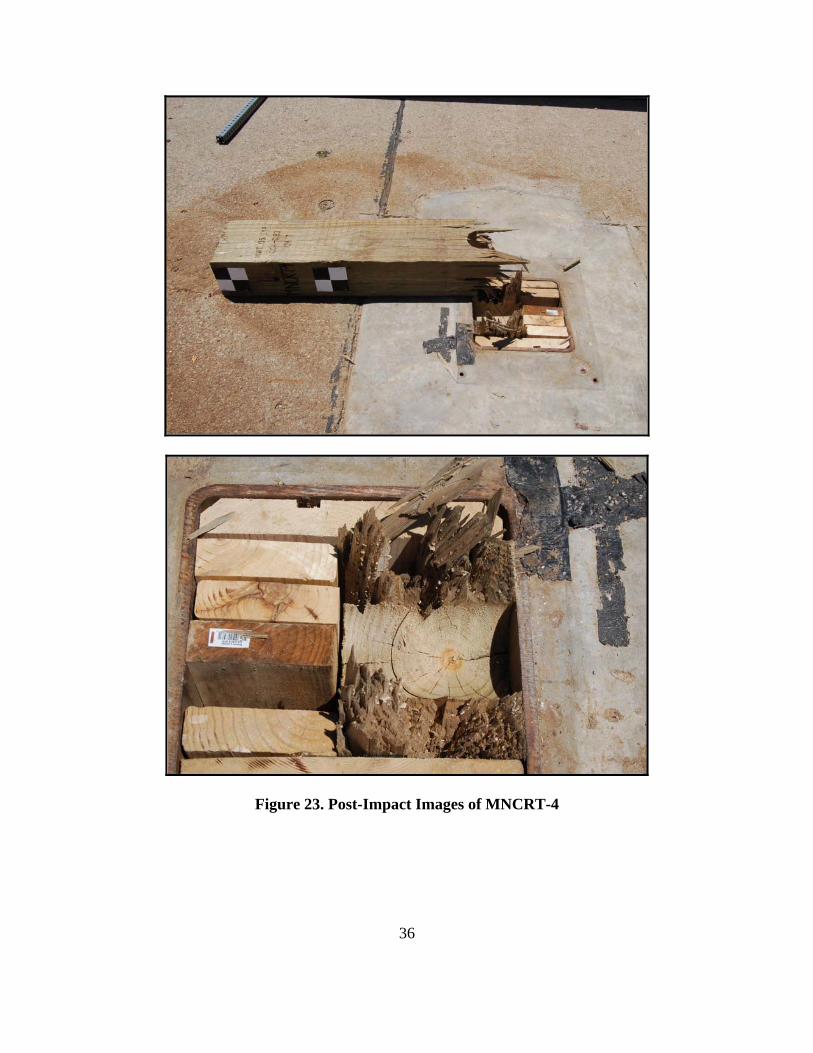
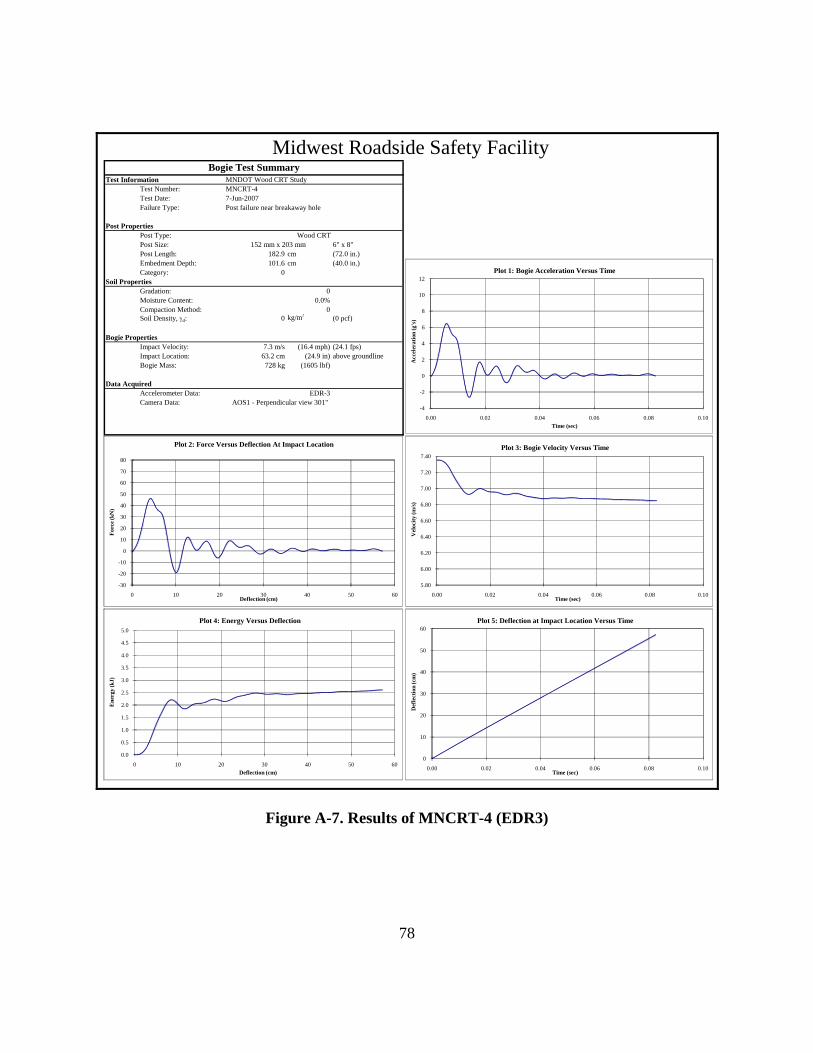
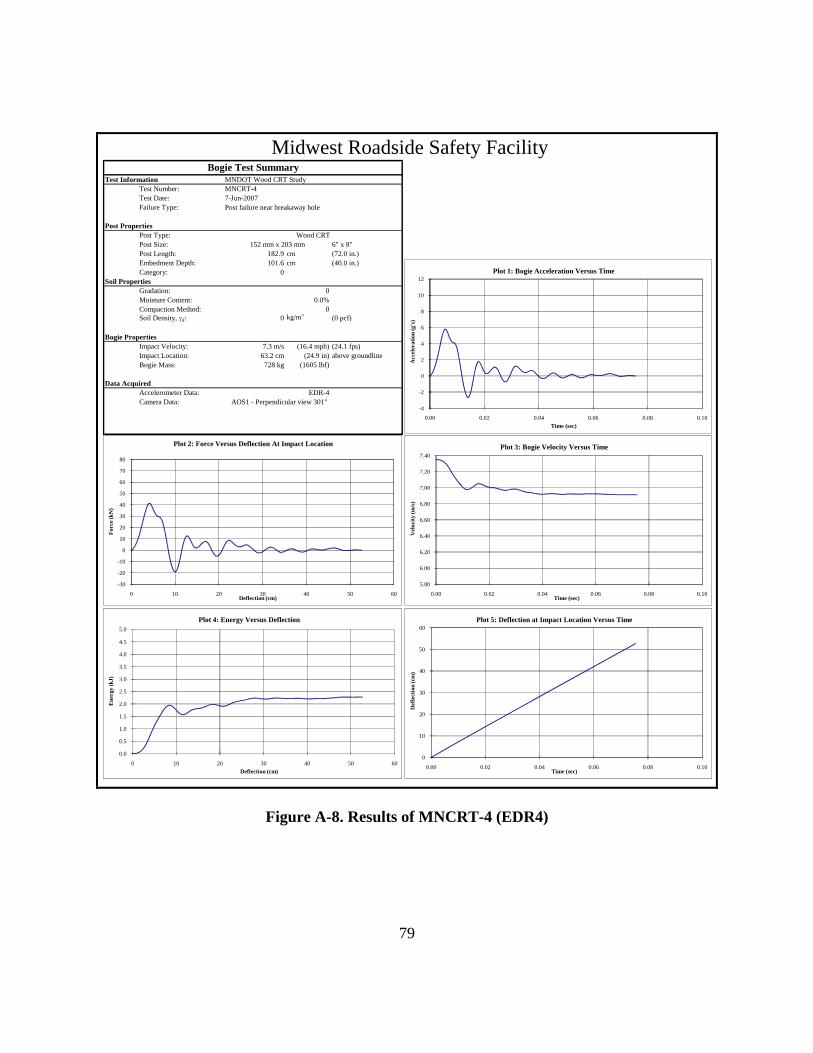
5.2.4 Test No. MNCRT-4 – Weak-Axis (90 Degree) Impact on CRT Post
Test MNCRT-4 was a weak-axis impact at 90 degrees on the
152 mm x 203 mm (6 in. x 8 in.) wood CRT post embedded in a rigid
sleeve. Time-sequential photographs are shown in Figure 20. Within 8
ms, the post began to fracture near the breakaway hole. The wood post
continued to fracture near the breakaway hole as it was deflected by the
bogie’s impact head. As the post fractured, it lost more strength and
eventually lost contact with the post at 96 ms.
The force versus deflection curve, as seen in Figure 21, shows a
significant initial peak in the force level, which can be traced from the
inertial effects and initiating the failure of the post. After the initial peak,
the wood post had already begun to fracture, and as a result, it does not
provide much more resistance for the duration of the test, as seen in the
energy versus deflection curve in Figure 22. Post-impact images of the
fractured post can be seen in Figure 23.
TIME = 40 ms
TIME = 90 ms
TIME = 120 ms
TIME = 60 ms
IMPACT
35
-6
-4
-2
0
2
4
6
8
10
12
14
16
18
0 2 4 6 8 10 12 14 16 18 20
Forc
e (K
ips)
Deflection (In.)
Force Versus Deflection (MNCRT-4)
EDR3
0
5
10
15
20
25
30
35
40
0 2 4 6 8 10 12 14 16 18 20
Ene
rgy
(Kip
-In.)
Deflection (In.)
Energy Versus Deflection (MNCRT-4)
EDR3
0.0
0.5
1.0
1.5
2.0
2.5
3.0
3.5
4.0
4.5
5.0
0 50 100 150 200 250 300 350 400 450 500
Ene
rgy
(kJ)
Deflection (mm)
Energy Versus Deflection (MNCRT-4)
EDR3
-30
-20
-10
0
10
20
30
40
50
60
70
80
0 50 100 150 200 250 300 350 400 450 500
Forc
e (k
N)
Deflection (mm)
Force Versus Deflection (MNCRT-4)
EDR3
Figure 21a. Force versus Deflection Curve for MNCRT-4 – Metric Figure 22a. Energy versus Deflection Curve for MNCRT-4 – Metric
Figure 21b. Force versus Deflection Curve for MNCRT-4 – English Figure 22b. Energy versus Deflection Curve for MNCRT-4 – English
36
Figure 23. Post-Impact Images of MNCRT-4
37
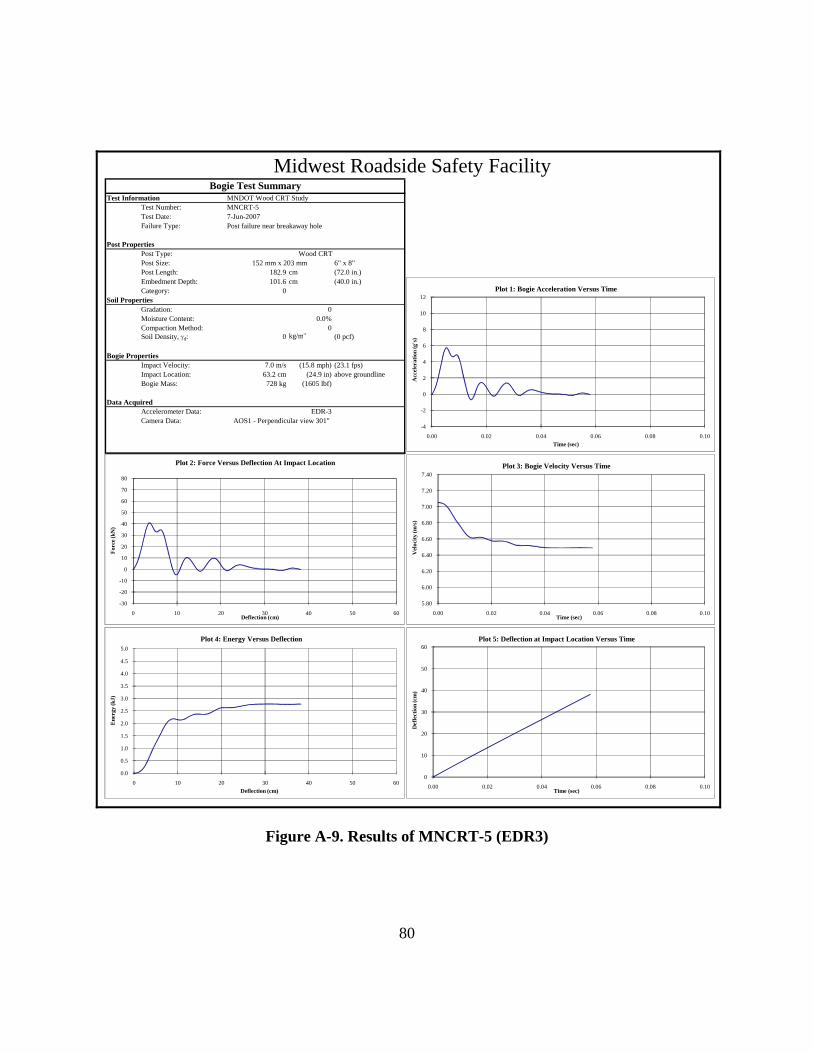
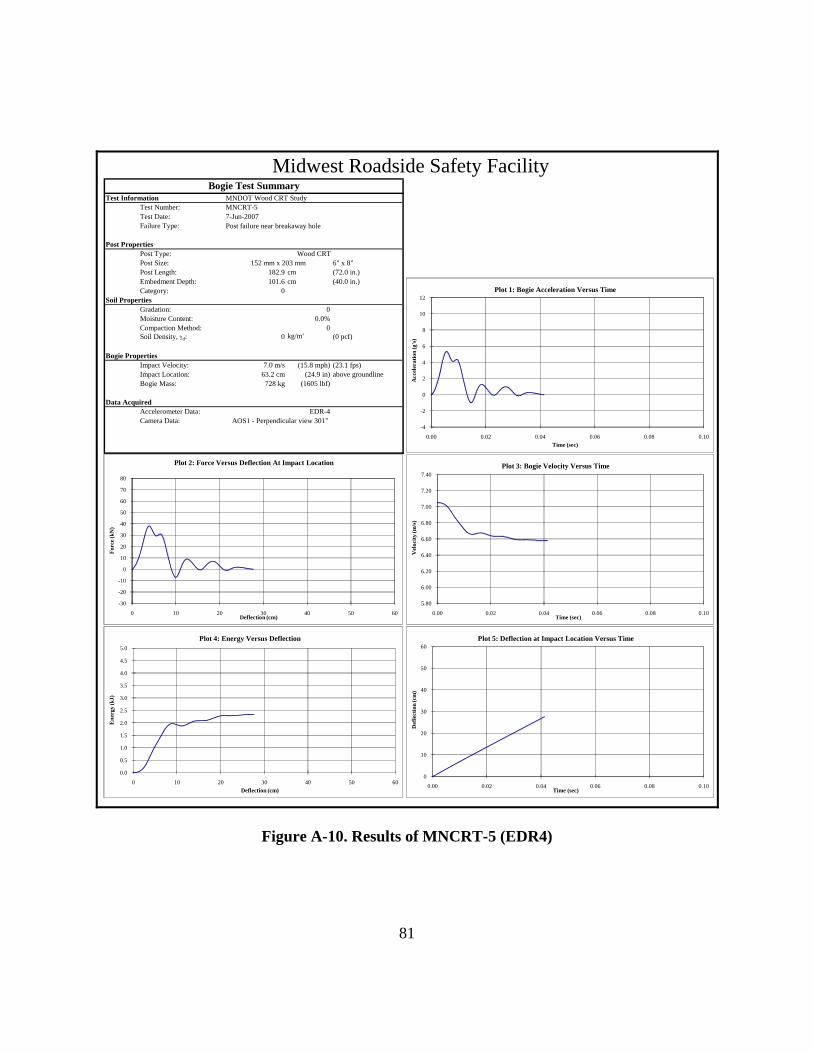
Figure 24. Time Sequential Photographs, Test MNCRT-5
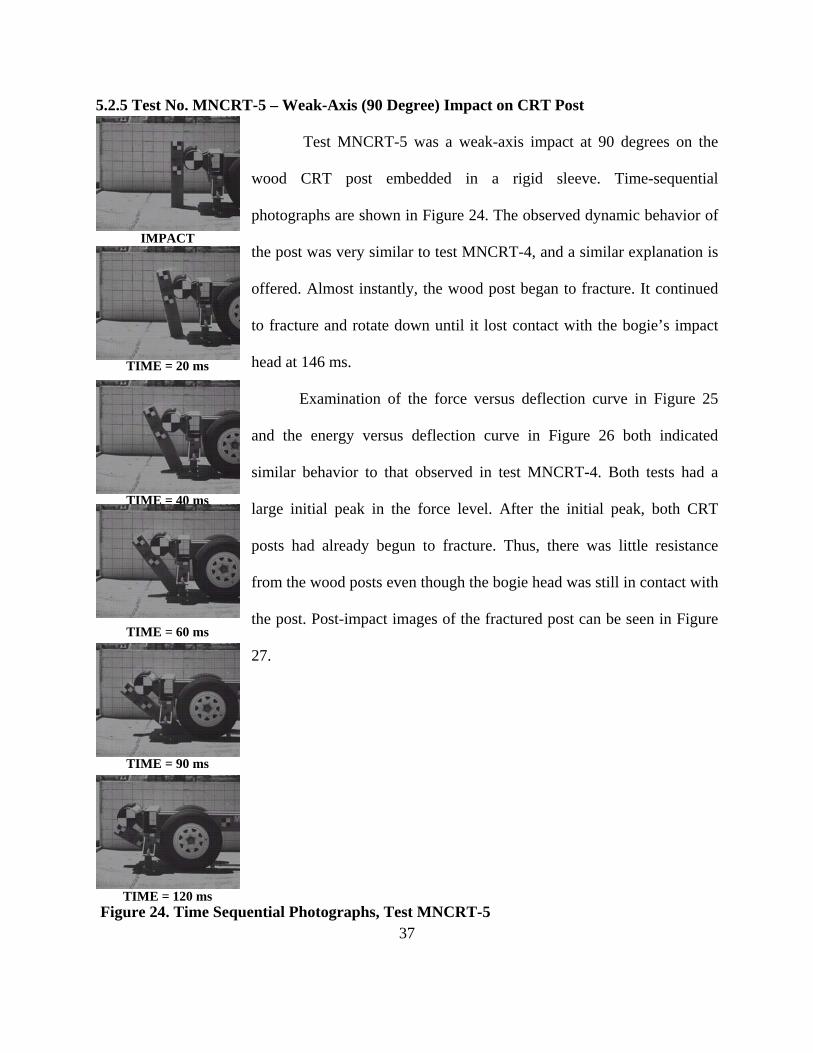
5.2.5 Test No. MNCRT-5 – Weak-Axis (90 Degree) Impact on CRT Post
Test MNCRT-5 was a weak-axis impact at 90 degrees on the
wood CRT post embedded in a rigid sleeve. Time-sequential
photographs are shown in Figure 24. The observed dynamic behavior of
the post was very similar to test MNCRT-4, and a similar explanation is
offered. Almost instantly, the wood post began to fracture. It continued
to fracture and rotate down until it lost contact with the bogie’s impact
head at 146 ms.
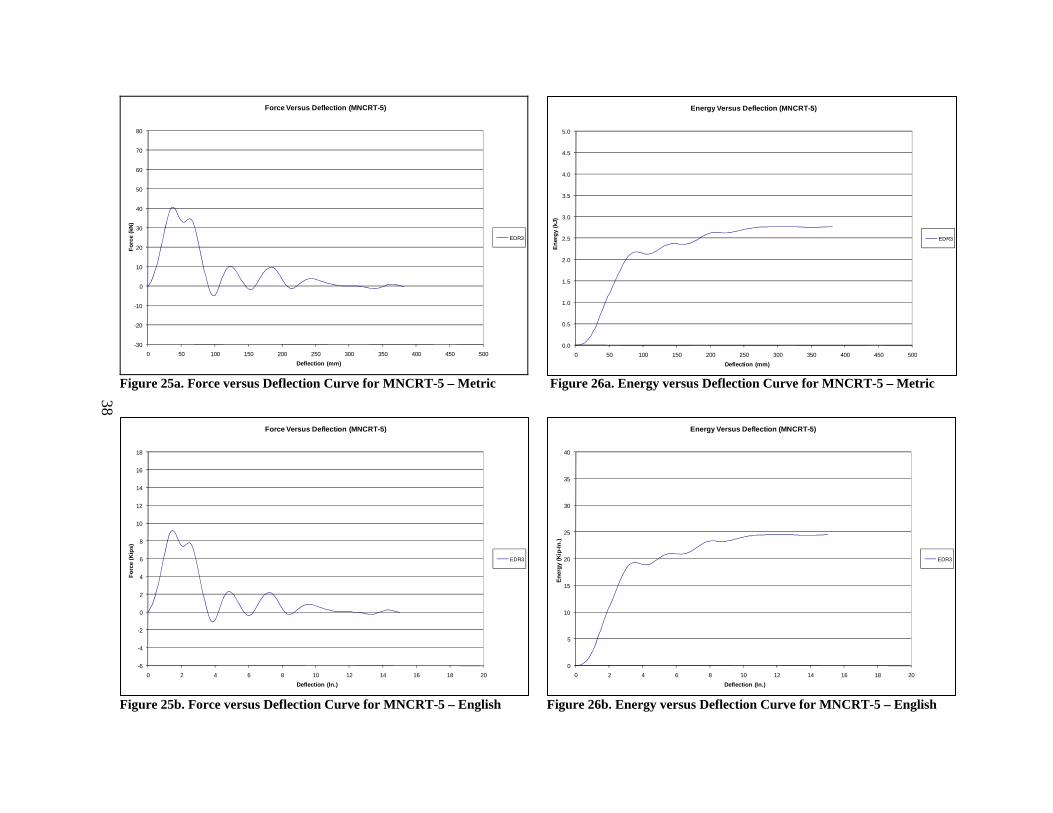
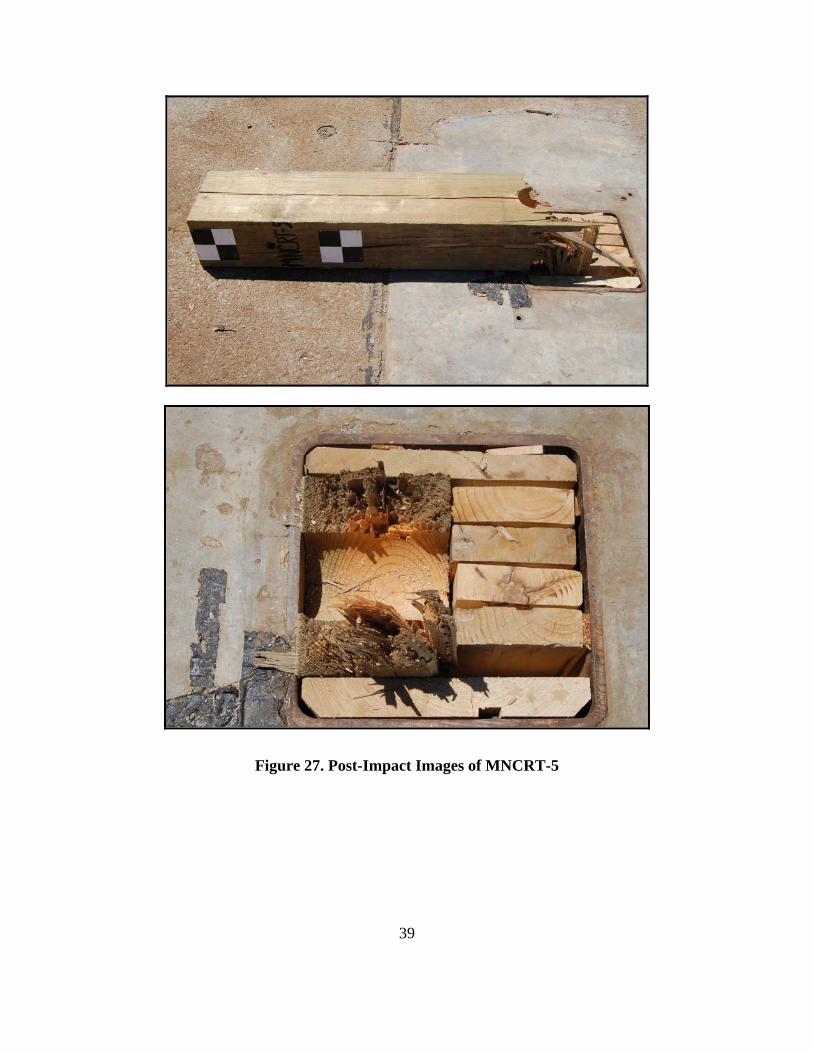
Examination of the force versus deflection curve in Figure 25
and the energy versus deflection curve in Figure 26 both indicated
similar behavior to that observed in test MNCRT-4. Both tests had a
large initial peak in the force level. After the initial peak, both CRT
posts had already begun to fracture. Thus, there was little resistance
from the wood posts even though the bogie head was still in contact with
the post. Post-impact images of the fractured post can be seen in Figure
27.
TIME = 20 ms
TIME = 40 ms
TIME = 60 ms
TIME = 90 ms
TIME = 120 ms
IMPACT
38
0.0
0.5
1.0
1.5
2.0
2.5
3.0
3.5
4.0
4.5
5.0
0 50 100 150 200 250 300 350 400 450 500
Ener
gy (k
J)
Deflection (mm)
Energy Versus Deflection (MNCRT-5)
EDR3
-6
-4
-2
0
2
4
6
8
10
12
14
16
18
0 2 4 6 8 10 12 14 16 18 20
Forc
e (K
ips)
Deflection (In.)
Force Versus Deflection (MNCRT-5)
EDR3
0
5
10
15
20
25
30
35
40
0 2 4 6 8 10 12 14 16 18 20
Ener
gy (K
ip-In
.)
Deflection (In.)
Energy Versus Deflection (MNCRT-5)
EDR3
-30
-20
-10
0
10
20
30
40
50
60
70
80
0 50 100 150 200 250 300 350 400 450 500
Forc
e (k
N)
Deflection (mm)
Force Versus Deflection (MNCRT-5)
EDR3
Figure 25a. Force versus Deflection Curve for MNCRT-5 – Metric Figure 26a. Energy versus Deflection Curve for MNCRT-5 – Metric
Figure 25b. Force versus Deflection Curve for MNCRT-5 – English Figure 26b. Energy versus Deflection Curve for MNCRT-5 – English
39
Figure 27. Post-Impact Images of MNCRT-5
40
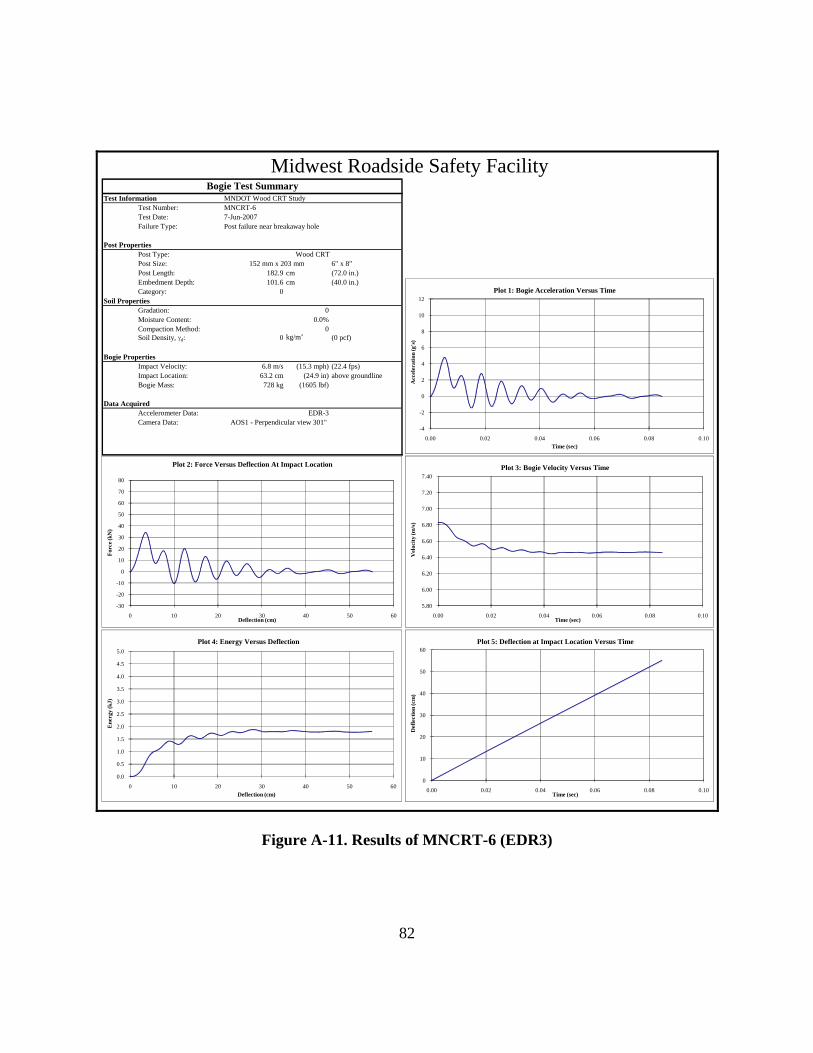
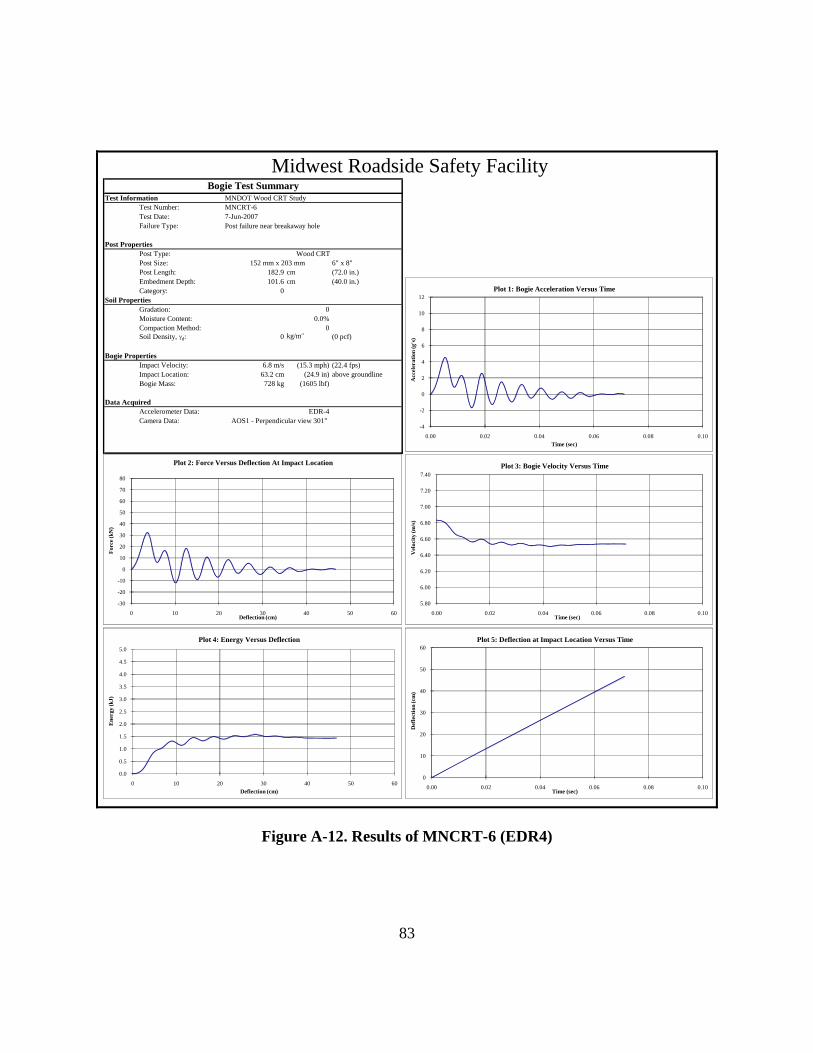
Figure 28. Time Sequential Photographs, Test MNCRT-6
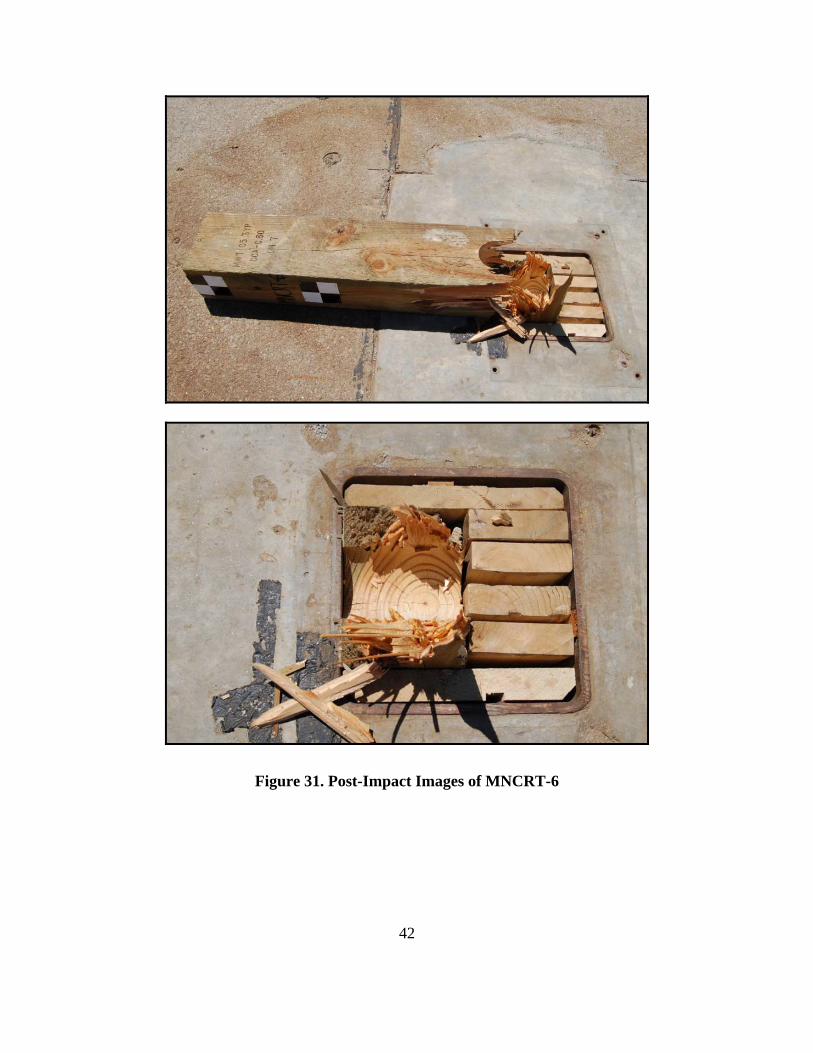
5.2.6 Test No. MNCRT-6 – Weak-Axis (90 Degree) Impact on CRT Post
Test MNCRT-6 was also a weak-axis impact at 90 degrees on
the wood CRT post embedded in a rigid sleeve. Time-sequential
photographs are shown in Figure 28. The observed dynamic behavior of
the post was very similar to tests MNCRT-4 and MNCRT-5. The wood
CRT post immediately began to fracture near the breakaway post.
However, the impact cylinder did not lose contact with the post until
after 88 ms.
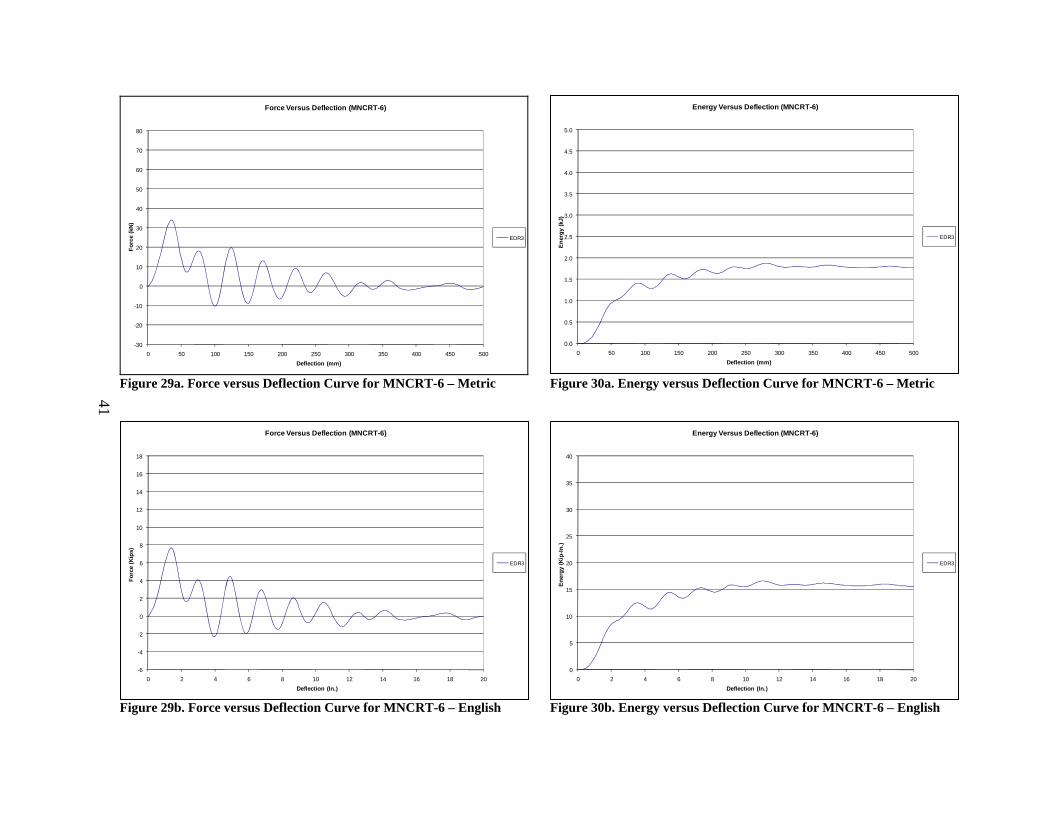
The force versus deflection curve in Figure 29 and the energy
versus deflection curve in Figure 30 both indicated similar behavior to
the previous two tests performed at 90 degrees. When compared with
tests MNCRT-4 and MNCRT-5, the wood post in test MNCRT-6 has
comparable duration and behavior. However, the only difference was in
the magnitude of the force and energy levels. In test MNCRT-6, the
wood post has lower force and energy levels than observed in either test
MNCRT-4 or test MNCRT-5. This difference can be attributed to the
differences in the properties of the wood. Post-impact images of the
fractured post can be seen in Figure 31.
TIME = 20 ms
IMPACT
TIME = 40 ms
TIME =60 ms
TIME = 90 ms
TIME = 120 ms
41
0.0
0.5
1.0
1.5
2.0
2.5
3.0
3.5
4.0
4.5
5.0
0 50 100 150 200 250 300 350 400 450 500
Ener
gy (k
J)
Deflection (mm)
Energy Versus Deflection (MNCRT-6)
EDR3
-6
-4
-2
0
2
4
6
8
10
12
14
16
18
0 2 4 6 8 10 12 14 16 18 20
Forc
e (K
ips)
Deflection (In.)
Force Versus Deflection (MNCRT-6)
EDR3
0
5
10
15
20
25
30
35
40
0 2 4 6 8 10 12 14 16 18 20
Ener
gy (K
ip-In
.)
Deflection (In.)
Energy Versus Deflection (MNCRT-6)
EDR3
-30
-20
-10
0
10
20
30
40
50
60
70
80
0 50 100 150 200 250 300 350 400 450 500
Forc
e (k
N)
Deflection (mm)
Force Versus Deflection (MNCRT-6)
EDR3
Figure 29a. Force versus Deflection Curve for MNCRT-6 – Metric Figure 30a. Energy versus Deflection Curve for MNCRT-6 – Metric
Figure 29b. Force versus Deflection Curve for MNCRT-6 – English Figure 30b. Energy versus Deflection Curve for MNCRT-6 – English
42
Figure 31. Post-Impact Images of MNCRT-6
43
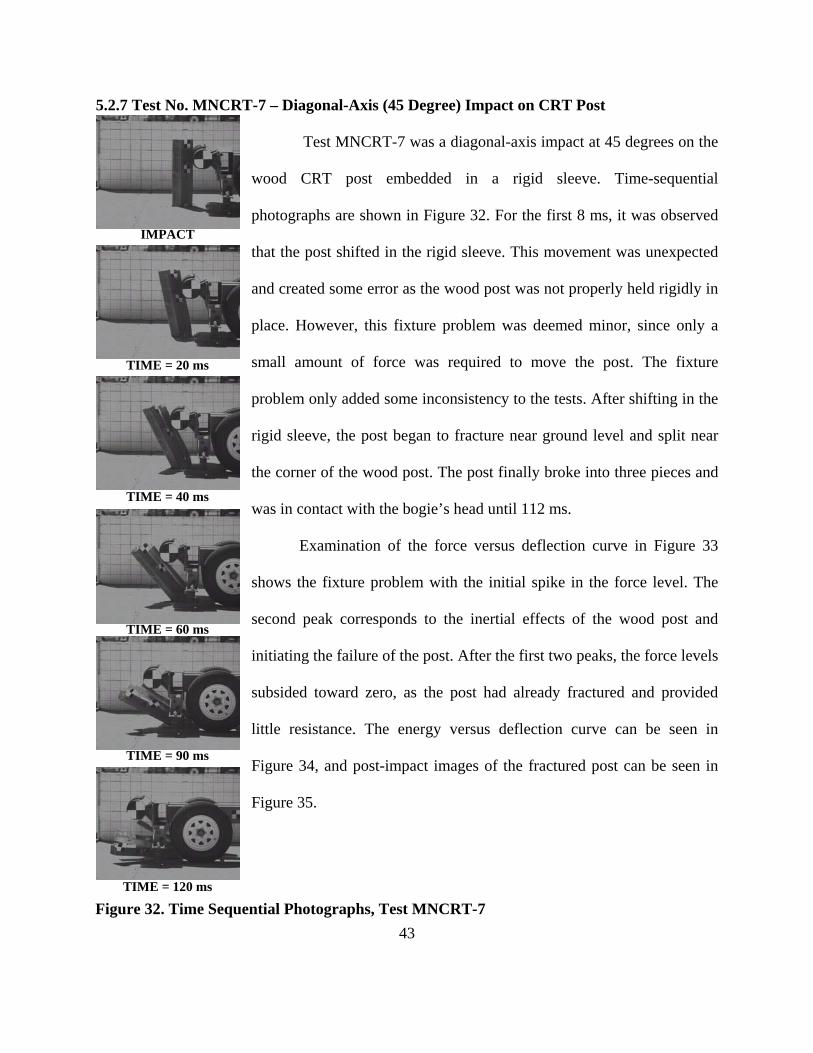
Figure 32. Time Sequential Photographs, Test MNCRT-7
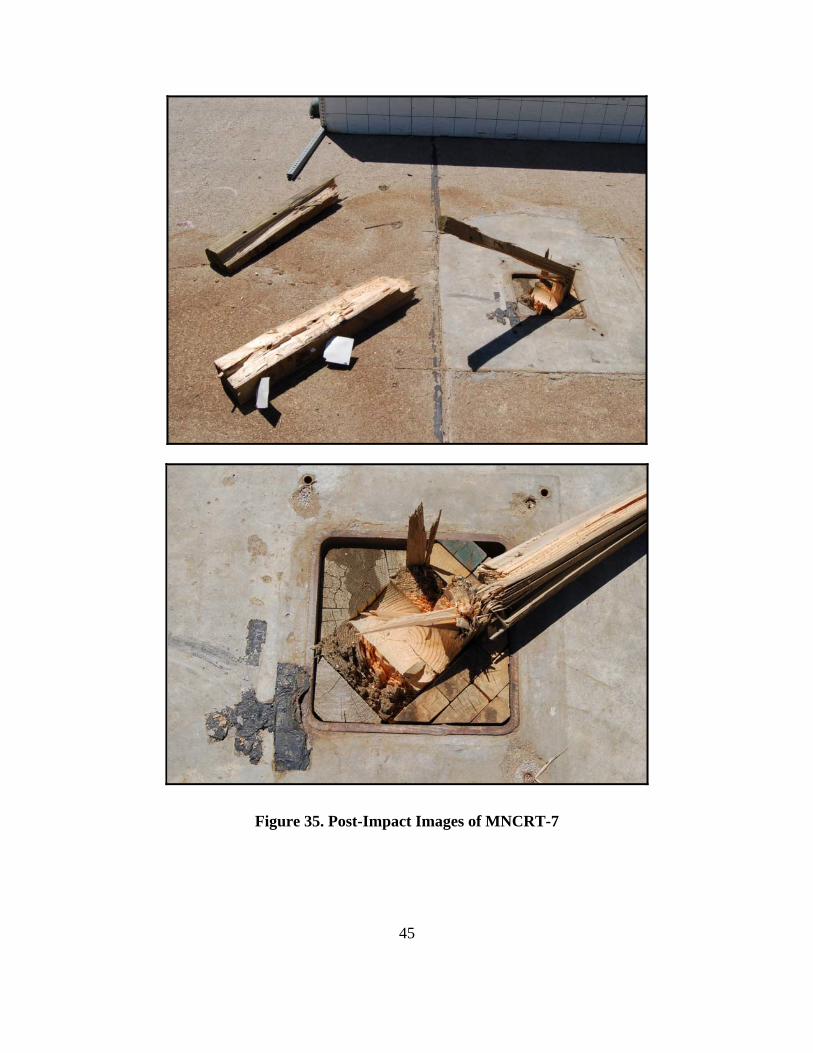
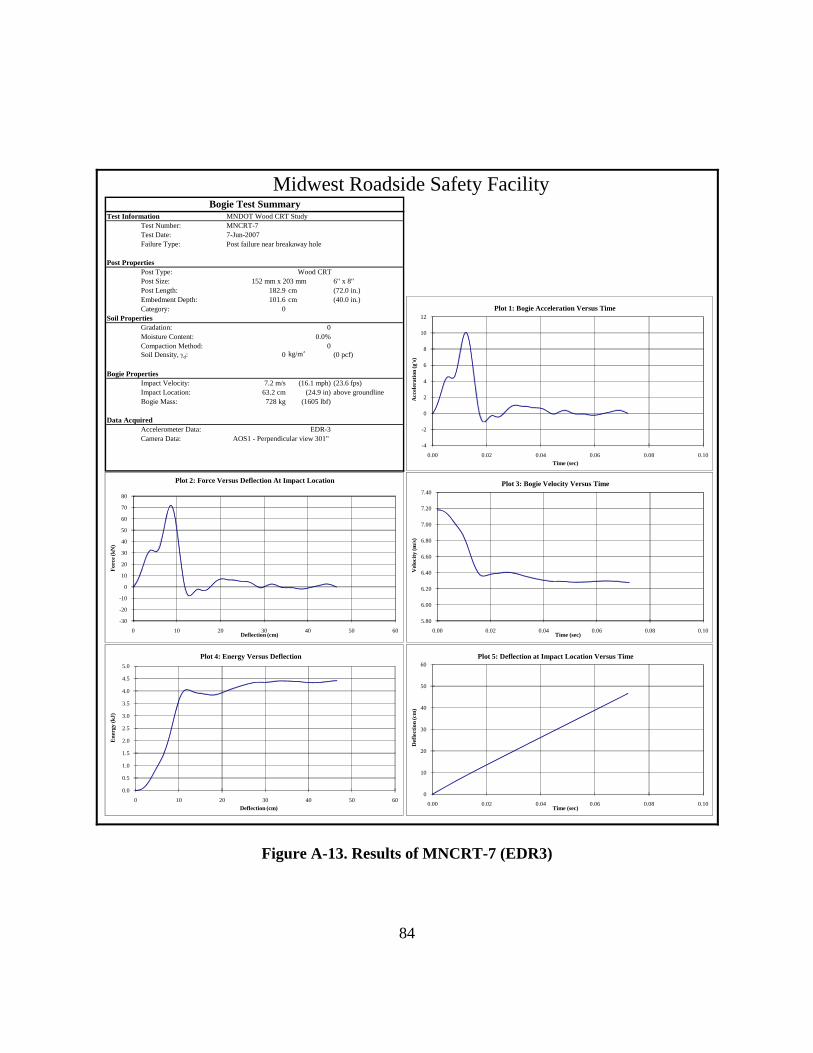
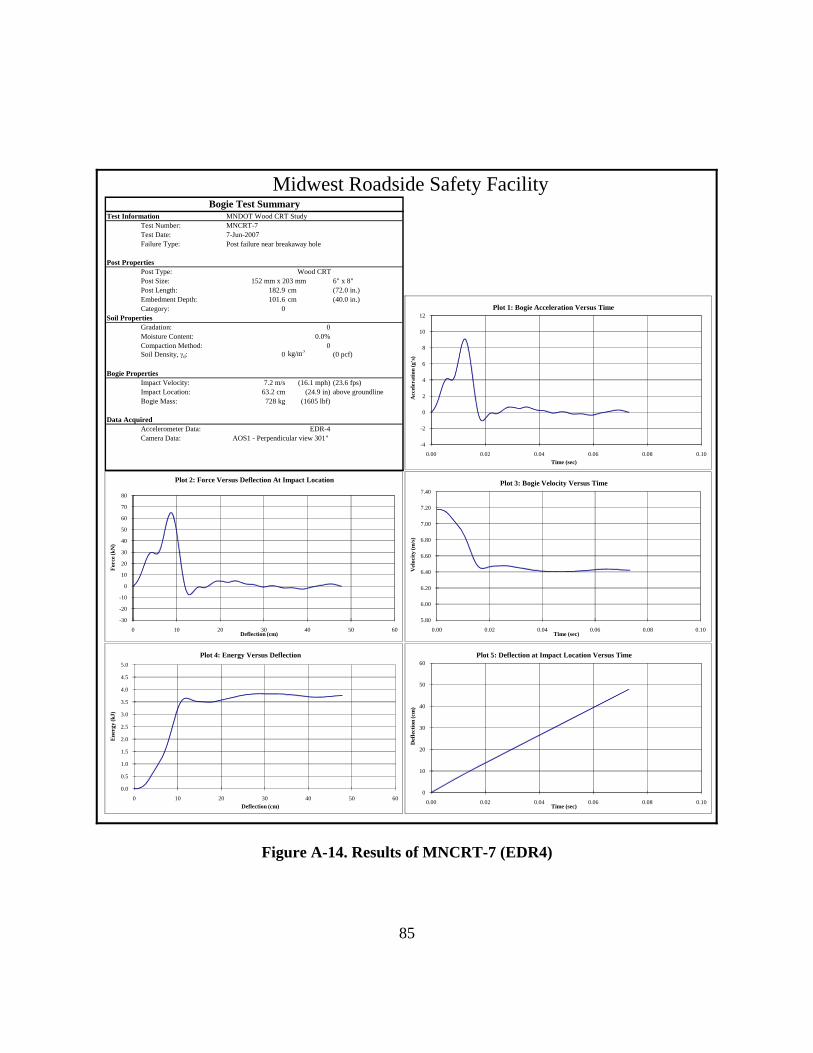
5.2.7 Test No. MNCRT-7 – Diagonal-Axis (45 Degree) Impact on CRT Post
Test MNCRT-7 was a diagonal-axis impact at 45 degrees on the
wood CRT post embedded in a rigid sleeve. Time-sequential
photographs are shown in Figure 32. For the first 8 ms, it was observed
that the post shifted in the rigid sleeve. This movement was unexpected
and created some error as the wood post was not properly held rigidly in
place. However, this fixture problem was deemed minor, since only a
small amount of force was required to move the post. The fixture
problem only added some inconsistency to the tests. After shifting in the
rigid sleeve, the post began to fracture near ground level and split near
the corner of the wood post. The post finally broke into three pieces and
was in contact with the bogie’s head until 112 ms.
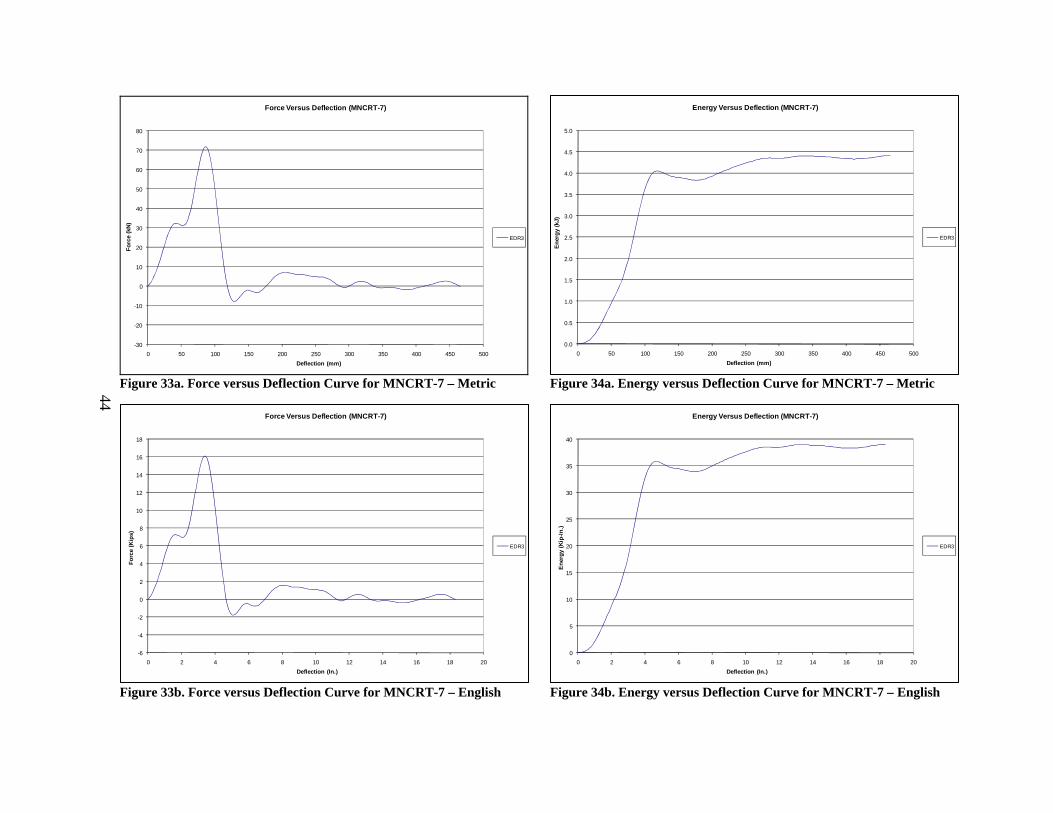
Examination of the force versus deflection curve in Figure 33
shows the fixture problem with the initial spike in the force level. The
second peak corresponds to the inertial effects of the wood post and
initiating the failure of the post. After the first two peaks, the force levels
subsided toward zero, as the post had already fractured and provided
little resistance. The energy versus deflection curve can be seen in
Figure 34, and post-impact images of the fractured post can be seen in
Figure 35.
TIME = 120 ms
TIME = 60 ms
TIME = 40 ms
TIME = 20 ms
IMPACT
TIME = 90 ms
44
0.0
0.5
1.0
1.5
2.0
2.5
3.0
3.5
4.0
4.5
5.0
0 50 100 150 200 250 300 350 400 450 500
Ener
gy (k
J)
Deflection (mm)
Energy Versus Deflection (MNCRT-7)
EDR3
-6
-4
-2
0
2
4
6
8
10
12
14
16
18
0 2 4 6 8 10 12 14 16 18 20
Forc
e (K
ips)
Deflection (In.)
Force Versus Deflection (MNCRT-7)
EDR3
0
5
10
15
20
25
30
35
40
0 2 4 6 8 10 12 14 16 18 20
Ener
gy (K
ip-In
.)
Deflection (In.)
Energy Versus Deflection (MNCRT-7)
EDR3
-30
-20
-10
0
10
20
30
40
50
60
70
80
0 50 100 150 200 250 300 350 400 450 500
Forc
e (k
N)
Deflection (mm)
Force Versus Deflection (MNCRT-7)
EDR3
Figure 33a. Force versus Deflection Curve for MNCRT-7 – Metric Figure 34a. Energy versus Deflection Curve for MNCRT-7 – Metric
Figure 33b. Force versus Deflection Curve for MNCRT-7 – English Figure 34b. Energy versus Deflection Curve for MNCRT-7 – English
45
Figure 35. Post-Impact Images of MNCRT-7
46
Figure 36. Time Sequential Photographs, Test MNCRT-8
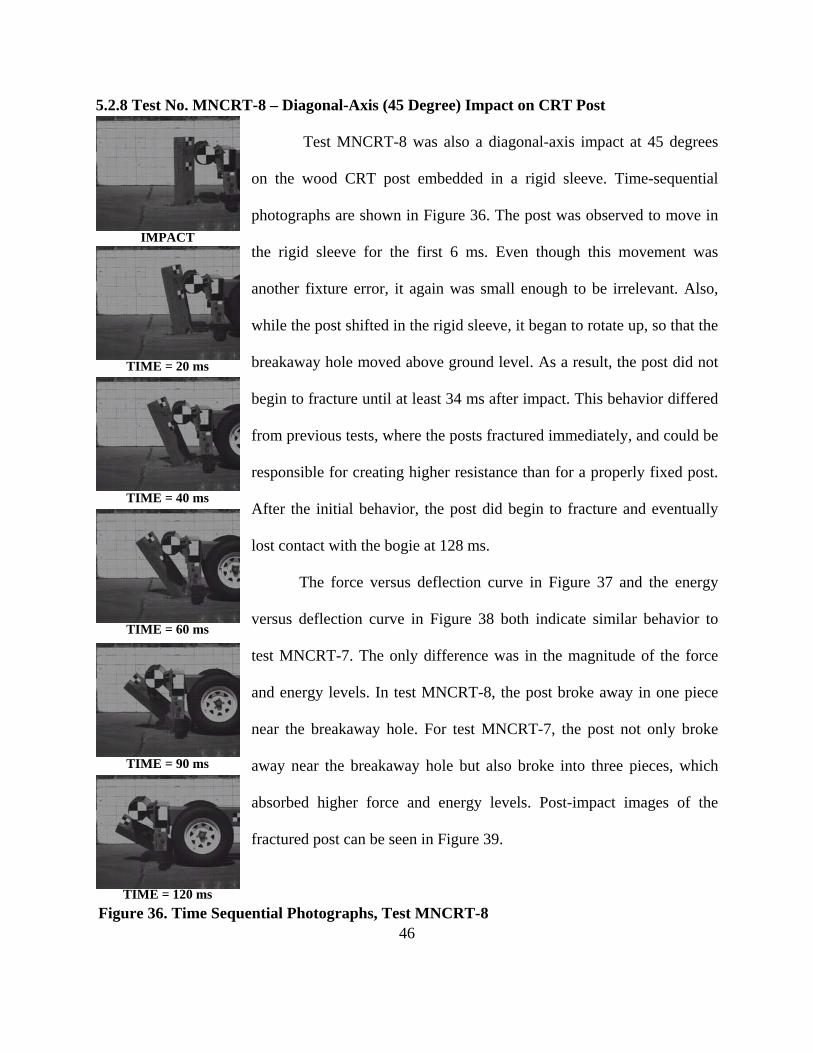
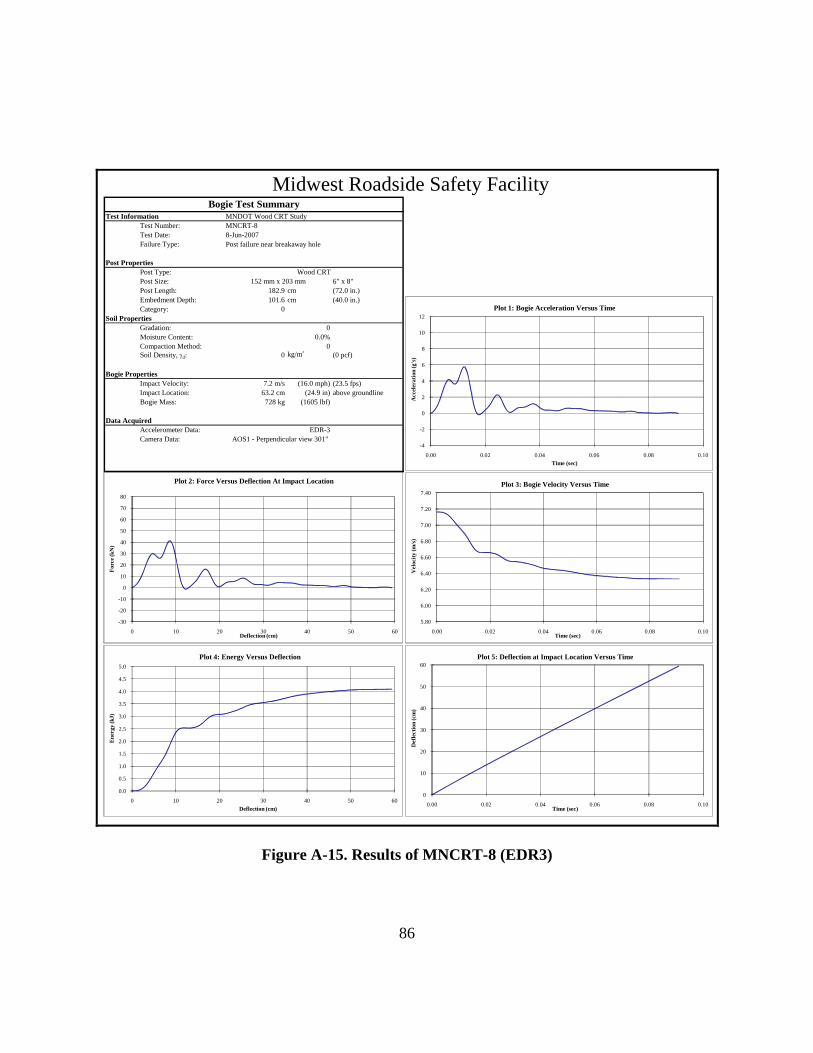
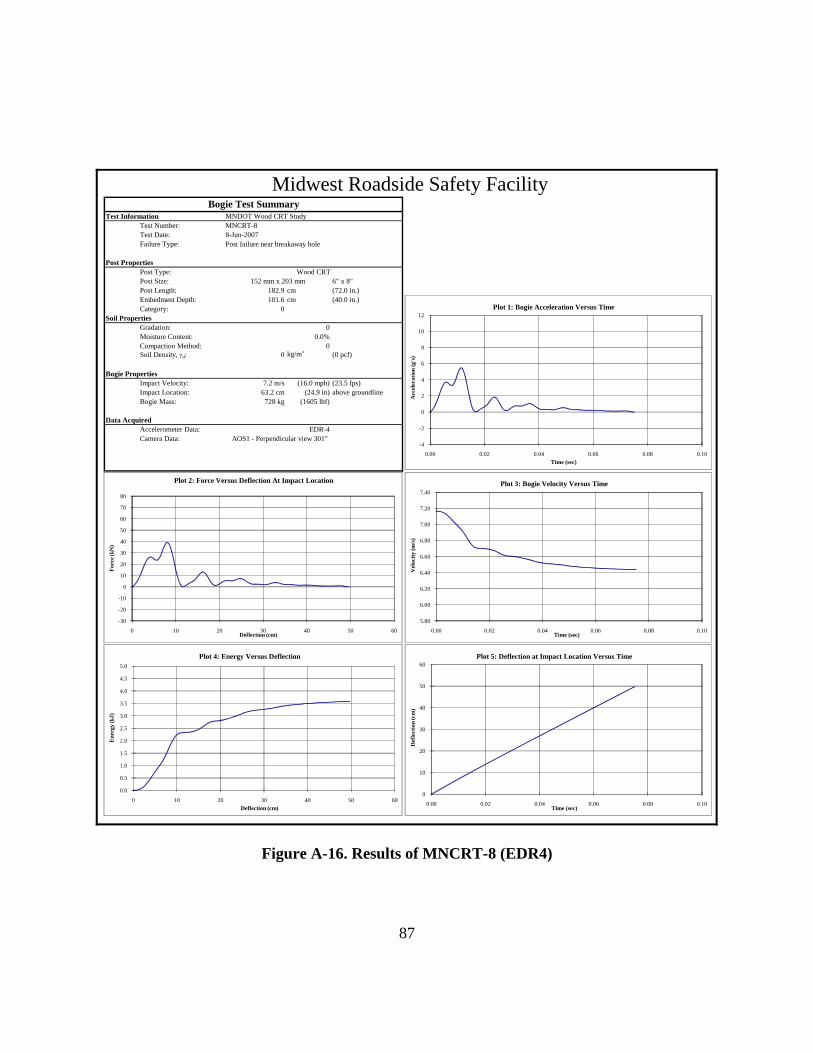
5.2.8 Test No. MNCRT-8 – Diagonal-Axis (45 Degree) Impact on CRT Post
Test MNCRT-8 was also a diagonal-axis impact at 45 degrees
on the wood CRT post embedded in a rigid sleeve. Time-sequential
photographs are shown in Figure 36. The post was observed to move in
the rigid sleeve for the first 6 ms. Even though this movement was
another fixture error, it again was small enough to be irrelevant. Also,
while the post shifted in the rigid sleeve, it began to rotate up, so that the
breakaway hole moved above ground level. As a result, the post did not
begin to fracture until at least 34 ms after impact. This behavior differed
from previous tests, where the posts fractured immediately, and could be
responsible for creating higher resistance than for a properly fixed post.
After the initial behavior, the post did begin to fracture and eventually
lost contact with the bogie at 128 ms.
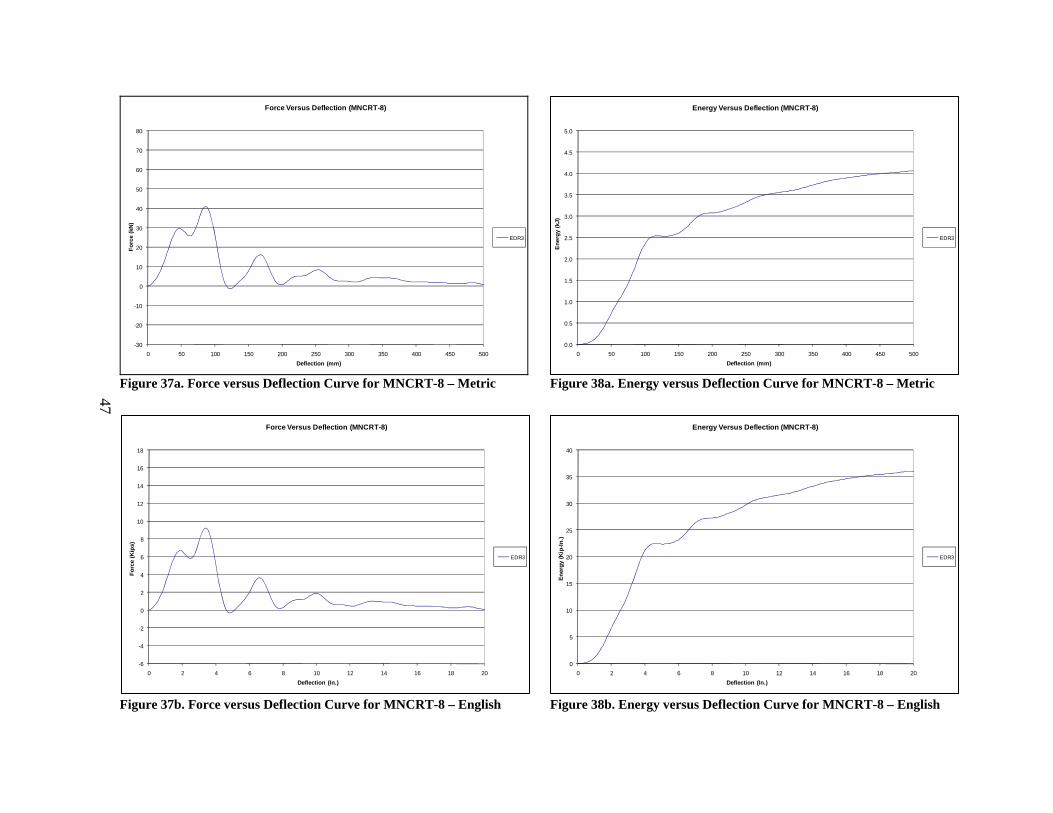
The force versus deflection curve in Figure 37 and the energy
versus deflection curve in Figure 38 both indicate similar behavior to
test MNCRT-7. The only difference was in the magnitude of the force
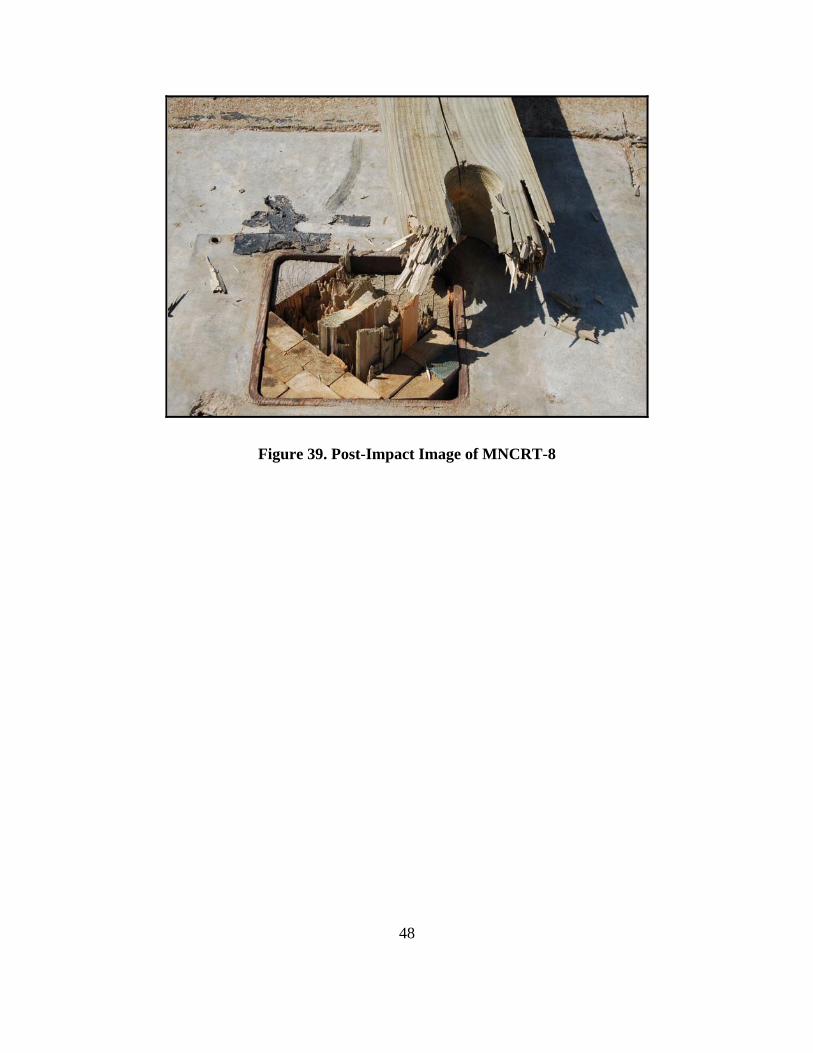
and energy levels. In test MNCRT-8, the post broke away in one piece
near the breakaway hole. For test MNCRT-7, the post not only broke
away near the breakaway hole but also broke into three pieces, which
absorbed higher force and energy levels. Post-impact images of the
fractured post can be seen in Figure 39.
TIME = 90 ms
TIME = 120 ms
TIME = 60 ms
TIME = 40 ms
TIME = 20 ms
IMPACT
47
0.0
0.5
1.0
1.5
2.0
2.5
3.0
3.5
4.0
4.5
5.0
0 50 100 150 200 250 300 350 400 450 500
Ener
gy (k
J)
Deflection (mm)
Energy Versus Deflection (MNCRT-8)
EDR3
-6
-4
-2
0
2
4
6
8
10
12
14
16
18
0 2 4 6 8 10 12 14 16 18 20
Forc
e (K
ips)
Deflection (In.)
Force Versus Deflection (MNCRT-8)
EDR3
0
5
10
15
20
25
30
35
40
0 2 4 6 8 10 12 14 16 18 20
Ener
gy (K
ip-In
.)
Deflection (In.)
Energy Versus Deflection (MNCRT-8)
EDR3
-30
-20
-10
0
10
20
30
40
50
60
70
80
0 50 100 150 200 250 300 350 400 450 500
Forc
e (k
N)
Deflection (mm)
Force Versus Deflection (MNCRT-8)
EDR3
Figure 37a. Force versus Deflection Curve for MNCRT-8 – Metric Figure 38a. Energy versus Deflection Curve for MNCRT-8 – Metric
Figure 37b. Force versus Deflection Curve for MNCRT-8 – English Figure 38b. Energy versus Deflection Curve for MNCRT-8 – English
48
Figure 39. Post-Impact Image of MNCRT-8
49
Figure 40. Time Sequential Photographs, Test MNCRT-9
5.2.9 Test No. MNCRT-9 – Diagonal-Axis (45 Degree) Impact on CRT Post
Test MNCRT-9 was the last diagonal-axis impact at 45 degrees
on the wood CRT post embedded in a rigid sleeve. Time-sequential
photographs are shown in Figure 40. Similar to tests MNCRT-7 and
MNCRT-8, this test also had a fixture issue, but it was also deemed a
minor concern, only creating some inconsistency. In this test, the post
began to fracture immediately. The post lost contact with the bogie head
at 16 ms until 36 ms. Then, the bogie continued to fracture and rotate the
wood post until all contact was lost at 94 ms.
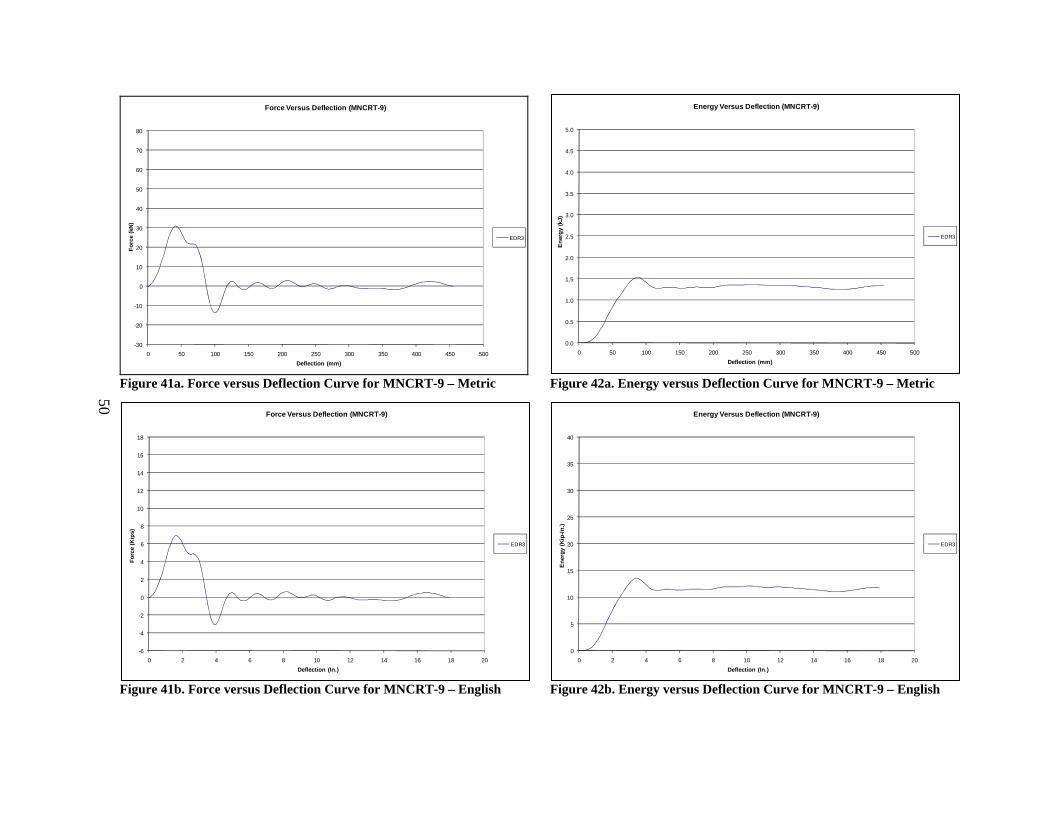
The force versus deflection curve in Figure 41 and the energy
versus deflection curve in Figure 42 indicate both the fixture issue and
the low strength of the wood CRT post. Similar to tests MNCRT-7 and
MNCRT-8, the first peak in the force level illustrates the fixture issue.
However, the second peak for this test was rather small and showed how
easily the post fractured. After the initial peaks, the post had lost its
strength and did not provide much more resistance for the duration of
the test. Post-impact images of the fractured post can be seen in Figure
43.
TIME = 60 ms
TIME = 90 ms
TIME = 120 ms
TIME = 40 ms
TIME = 20 ms
IMPACT
50
0.0
0.5
1.0
1.5
2.0
2.5
3.0
3.5
4.0
4.5
5.0
0 50 100 150 200 250 300 350 400 450 500
Ener
gy (k
J)
Deflection (mm)
Energy Versus Deflection (MNCRT-9)
EDR3
-6
-4
-2
0
2
4
6
8
10
12
14
16
18
0 2 4 6 8 10 12 14 16 18 20
Forc
e (K
ips)
Deflection (In.)
Force Versus Deflection (MNCRT-9)
EDR3
0
5
10
15
20
25
30
35
40
0 2 4 6 8 10 12 14 16 18 20
Ener
gy (K
ip-In
.)
Deflection (In.)
Energy Versus Deflection (MNCRT-9)
EDR3
-30
-20
-10
0
10
20
30
40
50
60
70
80
0 50 100 150 200 250 300 350 400 450 500
Forc
e (k
N)
Deflection (mm)
Force Versus Deflection (MNCRT-9)
EDR3
Figure 41a. Force versus Deflection Curve for MNCRT-9 – Metric Figure 42a. Energy versus Deflection Curve for MNCRT-9 – Metric
Figure 41b. Force versus Deflection Curve for MNCRT-9 – English Figure 42b. Energy versus Deflection Curve for MNCRT-9 – English
51
Figure 43. Post-Impact Images of MNCRT-9
52
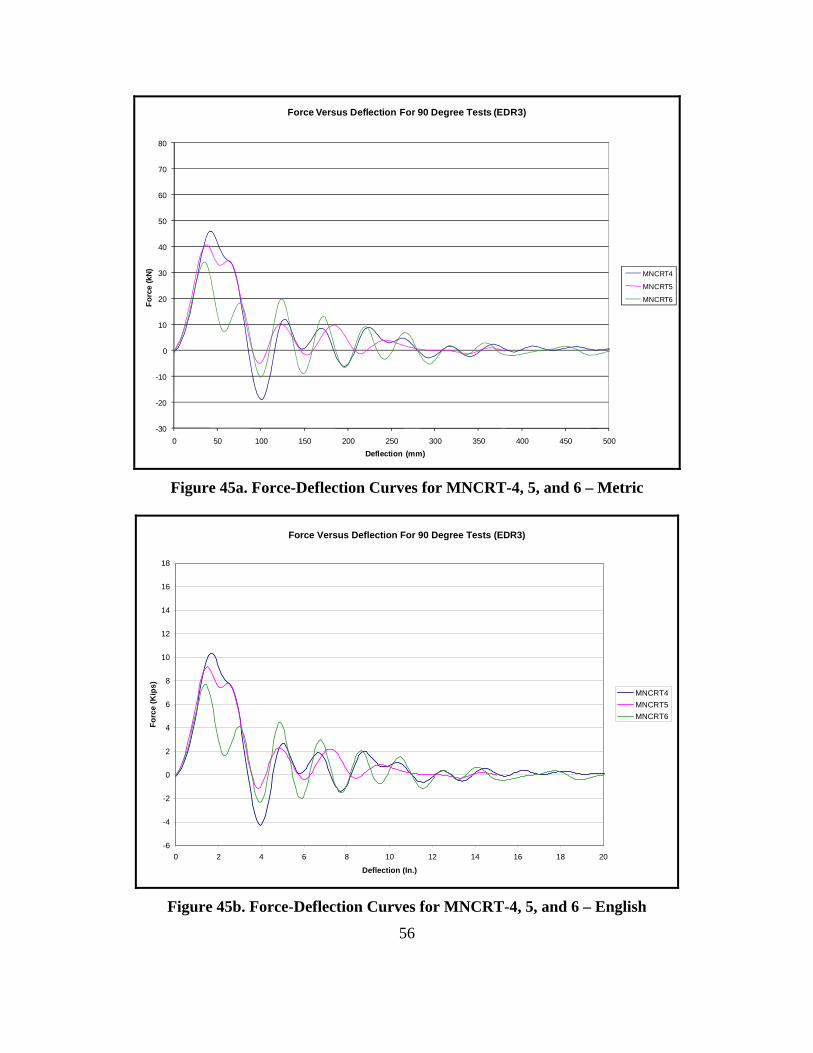
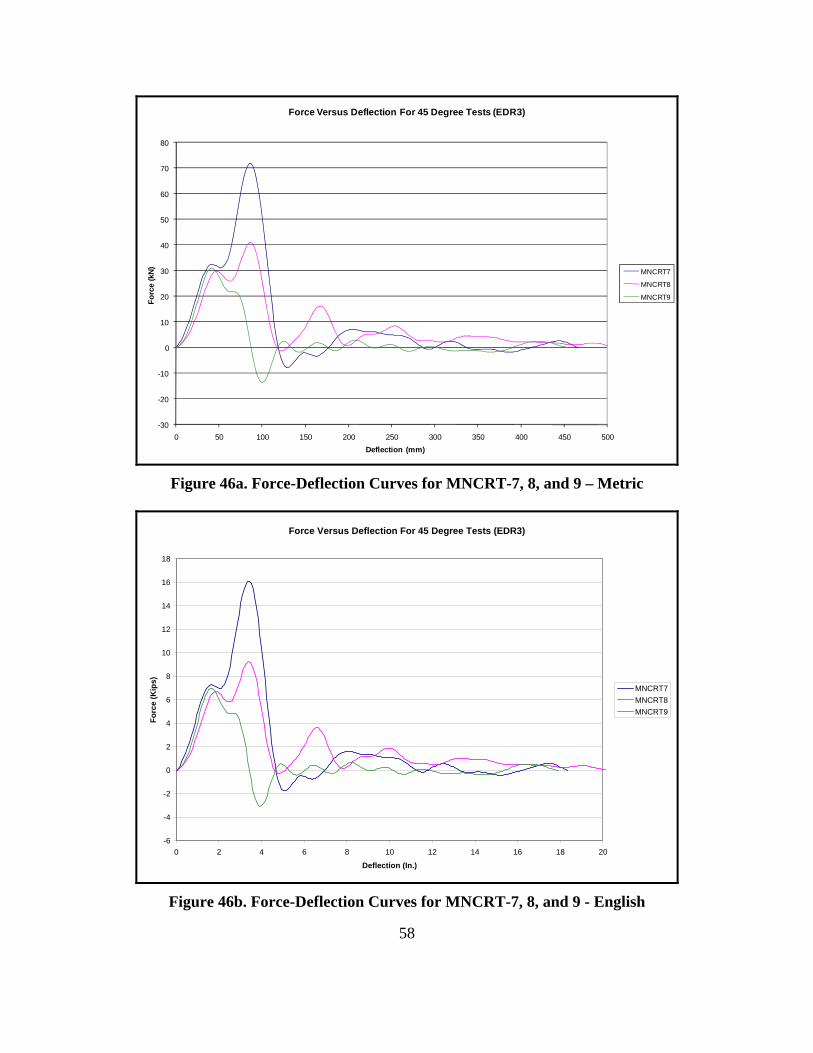
5.3 Force Discussion
The force levels observed during an impact are of significant interest in the design of the
post. For all nine bogie tests, the CRT posts exhibited an initial peak in the force level due to the
inertial effects and initiating the failure of the post near the ground line at the upper breakaway
hole. After the initial peak in the force level, the CRT wood posts had fractured and had lost
most of their strength, so the force level decreased toward zero. Although there was a visible
trend of an initial peak force for all nine bogie tests, the angle for the dynamic impacts on CRT
wood posts greatly affected the observed force levels. Therefore, it was desirable to compare the
force levels during the dynamic impact events at the three different angles. The data presented in
this section is grouped according to impact angle and provides insights into the properties of the
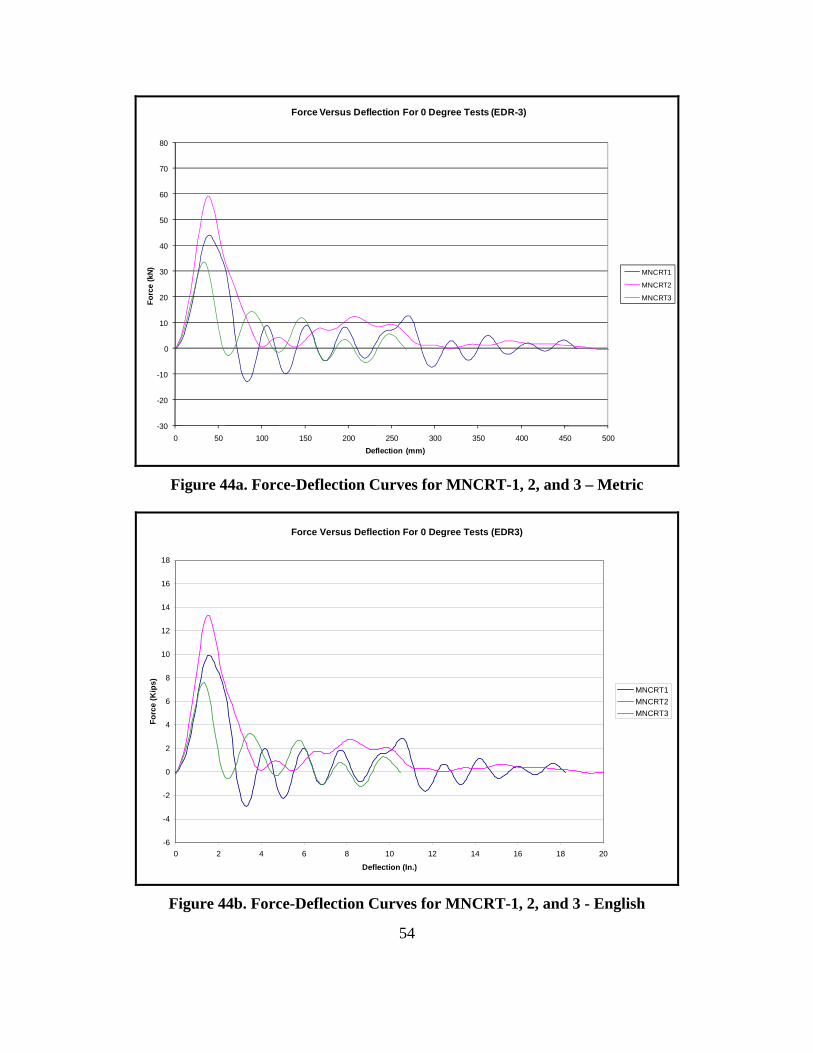
CRT post at the three different impact orientations.
53
5.3.1 Force Results for Test Nos. MNCRT-1, MNCRT-2, and MNCRT-3
The first three bogie tests were performed on the strong-axis of the CRT wood posts. The
force summaries for the three tests are given in Table 7, and the force versus displacement curve
comparing the three tests is shown in Figure 44. For all three tests, the initial peak force occurred
quickly at a similar displacement, averaging 36.9 mm (1.45 in.). The peak force levels were also
similar, ranging from 33.72 kN (7.58 kips) to 59.21 kN (13.31 kips). Differences in the peak
force levels can be attributed to variation in the wood properties of the posts. The post in test
MNCRT-2 had no knots, while the other two posts in tests MNCRT-1 and MNCRT-3 had
several knots that significantly reduced the strength of the posts.
Table 7a. Peak Force Results for MNCRT-1, MNCRT-2, and MNCRT-3 – Metric
Energy Versus Deflection For 45 Degree Tests (EDR3)
MNCRT7
MNCRT8
MNCRT9
Figure 49a. Energy-Deflection Curves for MNCRT-7, 8, and 9 – Metric
Energy Versus Deflection For 45 Degree Tests (EDR3)
0
5
10
15
20
25
30
35
40
0 2 4 6 8 10 12 14 16 18 20
Deflection (In.)
Ener
gy (K
ip-In
.)
MNCRT7MNCRT8MNCRT9
Figure 49b. Energy-Deflection Curves for MNCRT-7, 8, and 9 - English
67
6 CONCLUSIONS AND RECOMMENDATIONS
Dynamic impact testing of standard 152 mm x 203 mm (6 in. x 8 in.) CRT posts at
different angles have been detailed and the results stated. The results from these bogie tests will
aid in the future development of a Universal Breakaway Steel Post for bullnose and other non-
proprietary guardrail systems.
Although only nine tests were performed with three tests at three different angles, the
results of these tests provided the basic properties of the CRT post under dynamic impact testing.
Based on the bogie tests and the properties of the CRT post given in Table 2, the peak forces and
total energy for the strong, weak, and diagonal axis were determined and are illustrated in Figure
50. Though not clearly visible in the actual bogie tests, the strong-axis peak force of 53.4 kN (12
kips) was chosen to be exactly double the strength of the weak axis at 26.7 kN (6 kips). This
decision was based on the clear wood properties of a SYP CRT wood post found in Table 2,
which shows how the strong axis should have nearly double the peak force due to the different
moment of inertias for the separate axes. Also, this data from the moment of inertias was
independent of the differences and variation in the wood that greatly affected the nine bogie
tests. For the energy levels, 51 mm (2 in.) of deflection at the peak force was chosen to be
representative of the energy level. This decision stemmed from the bogie results and also from
previous experience with the CRT posts knowing that the posts fracture rather quickly. From
these results, there are now target force and energy values to aim for in the design of a future
Universal Breakaway Steel Post.
68
Figure 50a. Peak Forces and Energy Levels of the CRT Post - Metric
Figure 50b. Peak Forces and Energy Levels of the CRT Post - English
69
7 REFERENCES
1. Bielenberg, B.W., Faller, R.K., Reid, J.D., Rohde, J.R., Sicking, D.L., and Keller, E.A., Concept Development of a Bullnose Guardrail System for Median Applications, Final Report to the Midwest States’ Regional Pooled Fund Program, MwRSF Research Report No. TRP-03-73-98, Midwest Roadside Safety Facility, University of Nebraska-Lincoln, Lincoln, Nebraska, May 1998.
Holloway, J.C., Phase II Development of a Bullnose Guardrail System for Median Applications, Final Report to the Midwest States’ Regional Pooled Fund Program, MwRSF Research Report No. TRP-03-78-98, Midwest Roadside Safety Facility, University of Nebraska-Lincoln, Lincoln, Nebraska, December 1998.
Holloway, J.C., and Supencheck, L.L., Phase III Development of a Bullnose Guardrail System for Median Applications, Final Report to the Midwest States’ Regional Pooled Fund Program, MwRSF Research Report No. TRP-03-95-00, Midwest Roadside Safety Facility, University of Nebraska-Lincoln, Lincoln, Nebraska, June 2000.
4. Ross, H.E., Jr., Sicking D.L., and Zimmer, R.A., National Cooperative Highway
Research Report 350: Recommended Procedures for the Safety Performance Evaluation of Highway Features. Transportation Research Board, Washington, D.C., 1993.
Investigating the Use of Small-Diameter Softwood as Guardrail Posts (Dynamic Test Results), Final Report to the Forest Products Laboratory – U.S. Department of Agriculture, MwRSF Research Report No. TRP-03-179-07, Midwest Roadside Safety Facility, University of Nebraska-Lincoln, Lincoln, Nebraska, March 2007.
6. Hinch, J.A., Owings R.P., and Manhard G.A., Safety Modifications of Turned-Down
Guardrail Terminals, Volumes 1, 2, and 3, Final Report to the Federal Highway Administration, Ensco, Inc., Springfield, VA, June 1984.
7. Michie, Jarvis D., Recommended Procedures for the Safety Performance Evaluation of Highway Appurtenances, NCHRP Report No. 230, Transportation Research Board, Washington, D.C., March 1981.
8. Rohde, J.R., Hascall, J.A., Polivka, K.A., Faller R.K., and Sicking, D.L., Dynamic Testing of Wooden Guardrail Posts – White and Red Pine Species Equivalency Study, Final Report to the Midwest States’ Regional Pooled Fund Program, MwRSF Research Report No. TRP-03-154-04, Midwest Roadside Safety Facility, University of Nebraska-Lincoln, Lincoln, Nebraska, September 2004.
70
9. Electrophysics, Moisture Meter Model MT700, Operating Instructions & Information, Ontario, Canada.
11. The DADiSP Worksheet, Data Analysis and Display Software, User Reference Manuals,
Version 4.0, DSP Development Corporation, Cambridge, Massachusetts, December 1991.
12. Society of Automotive Engineers (SAE), Instrumentation for Impact Test – Part 1 – Electronic Instrumentation – SAE J211/1 MAR95, New York City, NY, 1999.
71
Appendix A A.1 Test Summary Information
A summary sheet for each test is provided in this section. Summary sheets include
acceleration, velocity, and displacement versus time plots, as well as force and energy versus
deflection plots.
Table A-1. Post Testing Summary
MNCRT Test Parameters MNCRT: Control Releasing Terminal Wood Post Test: Impact in rigid sleeve at 0, 45, and 90 degrees with respect to strong axis Accelerometer: EDR-3 and EDR-4 Data Bogie Weight: 728.0 kg (1,605 lbs) Bumper Height: 632 mm (24.875 in.) Posts: CRT Wood Post: 152 mm x 203 mm (6 in. x 8 in.) Post Length: 1,829 mm (72 in.)
Table A-2. Post Testing Results Reference
Test No. Impact Angle
Velocity Embedment DepthEmbedment Type Figure Number