CSCE Annual Conference Growing with youth – Croître avec les jeunes Laval (Greater Montreal) June 12 - 15, 2019 DYNAMIC MODELING OF PRODUCTIVITY IN MODULAR CONSTRUCTION Manouchehri, B. 1,2 1 Concordia University, Canada 2 [email protected]Abstract: Integration is a key to successful delivery of modular construction (MC). However, off-site construction is still fragmented which can be attributed to undesirable variances in productivity. Such variances are influenced by many factors, among which the potential of key performance indicators (KPIs) cannot be neglected. This study presents a system dynamics (SD)-based model for tracking productivity in delivery processes of MC. KPIs, pertaining to modular phases, are identified by developing KPI matrices through literature review from the perspective of modular manufacturers and general contractors. Data collected from a residential modular project constructed in Oslo, Norway. Causal loop and stock flow diagrams of productivity in MC are developed. The proposed model offers modular manufacturers and general contractors a flexible method for simulation of construction productivity in MC with the capability of finding causes of depicted variances. The core contribution of this research to MC literature is a developed dynamic productivity model which (1) integrates all modular phases for improving onsite construction productivity and (2) predicts onsite construction productivity by accounting for interdependent KPIs. 1 INTRODUCTION A key to the success of modular construction projects is project integration, with cooperation from all stakeholders, including owners, design professionals, construction managers, and general contractors. (Concordia workshop summary report 2015). While from early phases, collaboration is preferred for MC, usually implementing this method is only made after the design process is finished. The design drawings are converted into MC by retaining plan layout and facade. The constraints associated with MC are not always considered in early design development (Javanifard 2013). Despite the benefits of offsite and MC (Lawson et al. 2012), process fragmentation still exists, being dictated by the nature of separate contractual structure of industry (Arashpour et al. 2015). Design, production, logistics, and installation processes are still fragmented (Li et al. 2016). In addition, since Architect/Engineer/Contractor (AEC) sector plays a vital role in cost effectiveness, timeliness, and quality of subsequent phases of MC, a special focus on the design process and managing productivity is required (Arashpour et al. 2015; Arashpour et al. 2018). Therefore, lack of process integration in offsite and MC is still evident, causing construction productivity variance. Making reliable predictions about productivity for comparing with project’s objectives is essential so that early warnings against potential upcoming problems are obtained. 2 BACKGROUND The most important driver in implementing MC is its capability in productivity improvement (McGraw-Hill 2011). High productivity variability is an indicator of poor labor performance in many construction operations. A reasonable strategy is an attempt to minimize productivity variability, since it is often inevitable to manage output variability while, the variability of output is a reaction to input variability (Thomas 2012).
Transcript
CSCE Annual Conference Growing with youth – Croître avec les jeunes
Laval (Greater Montreal) June 12 - 15, 2019
DYNAMIC MODELING OF PRODUCTIVITY IN MODULAR CONSTRUCTION
Abstract: Integration is a key to successful delivery of modular construction (MC). However, off-site construction is still fragmented which can be attributed to undesirable variances in productivity. Such variances are influenced by many factors, among which the potential of key performance indicators (KPIs) cannot be neglected. This study presents a system dynamics (SD)-based model for tracking productivity in delivery processes of MC. KPIs, pertaining to modular phases, are identified by developing KPI matrices through literature review from the perspective of modular manufacturers and general contractors. Data collected from a residential modular project constructed in Oslo, Norway. Causal loop and stock flow diagrams of productivity in MC are developed. The proposed model offers modular manufacturers and general contractors a flexible method for simulation of construction productivity in MC with the capability of finding causes of depicted variances. The core contribution of this research to MC literature is a developed dynamic productivity model which (1) integrates all modular phases for improving onsite construction productivity and (2) predicts onsite construction productivity by accounting for interdependent KPIs.
1 INTRODUCTION
A key to the success of modular construction projects is project integration, with cooperation from all stakeholders, including owners, design professionals, construction managers, and general contractors. (Concordia workshop summary report 2015). While from early phases, collaboration is preferred for MC, usually implementing this method is only made after the design process is finished. The design drawings are converted into MC by retaining plan layout and facade. The constraints associated with MC are not always considered in early design development (Javanifard 2013). Despite the benefits of offsite and MC (Lawson et al. 2012), process fragmentation still exists, being dictated by the nature of separate contractual structure of industry (Arashpour et al. 2015). Design, production, logistics, and installation processes are still fragmented (Li et al. 2016). In addition, since Architect/Engineer/Contractor (AEC) sector plays a vital role in cost effectiveness, timeliness, and quality of subsequent phases of MC, a special focus on the design process and managing productivity is required (Arashpour et al. 2015; Arashpour et al. 2018). Therefore, lack of process integration in offsite and MC is still evident, causing construction productivity variance. Making reliable predictions about productivity for comparing with project’s objectives is essential so that early warnings against potential upcoming problems are obtained.
2 BACKGROUND
The most important driver in implementing MC is its capability in productivity improvement (McGraw-Hill 2011). High productivity variability is an indicator of poor labor performance in many construction operations. A reasonable strategy is an attempt to minimize productivity variability, since it is often inevitable to manage output variability while, the variability of output is a reaction to input variability (Thomas 2012).
Off-site production has become significantly more labor productive. Their rate of productivity growth overall is greater than comparable onsite sectors (Eastman and Sacks 2008). In addition, for reducing productivity variance, few well-known approaches are proposed among which implementation of key performance indicators (KPIs) are critical (McKinsey Global Institute 2017). Construction sector criticizes KPIs for being unable to impose any change and only illustrates the performance of completed processes while, being able to predict future insights. They are served as early indicators of problems and can affect the final outcome during project’s early stages (Beatham et al. 2004). Therefore, the construction industry is suffering from productivity variability which produces unreliable outcomes, highlighting the significance of project’s process tracking and control through KPIs.
3 CONSTRUCTION PRODUCTIVITY MODEL
When attempting to assess the effect of a change in the construction process, it is generally referred to changes in productivity for the task being measured. (song and AbouRizk 2008). Since variations in productivity are imposed by multiple factors, the relationship between such factors and productivity must be quantified through productivity models (Song and AbouRizk 2008). Numerous modeling techniques have been developed which study the relationship between influential factors and productivity. Measuring and predicting productivity requires performing complex mapping of simultaneous influencing factors to productivity which includes the quantified effects of factors on productivity and quantified interactions of factors on themselves. A major portion of construction budget is allocated to labor cost (Hanna et al. 2005), and duration and cost estimates of a construction operation are correlated with productivity (Hwang and Liu, 2010). In this paper, in order to reduce repetition, the terms “labor productivity”, “construction productivity”, “onsite construction productivity” are all addressed as “productivity”.
4 RESEARCH METHODOLOGY
4.1 Construction Productivity
There is no specific definition of productivity. The most widely utilized productivity measure in construction is the unit rate, which is defined as equation (1) (Thomas 2012).
[1] Productivity (Unit rate) = Input / Output = Workhours / Units of work
It is also defined by contractors in one of the following ways:
[2] Productivity = Output / Labor cost
[3] Productivity = Output / Workhours
Therefore, in this study, output is defined as “how much is attained in terms of MC progress (i.e., weight of modules installed) during construction phase”, based on “monetary resources (i.e., labor) put into project during construction phase”, as input. The productivity equation utilized in this study is as shown in Eq. 4.
[4] Productivity = Labor cost / Tonnage of modules installed onsite within schedule
The lower outcome of Eq. 5, higher productivity will be. Labor cost is also calculated by Eq. 6.
[5] Labor cost = Onsite construction workhours x Average unit cost of construction labor
4.2 System Dynamics Approach
System dynamics (SD) introduced by Forrester (1961) is an objective-oriented simulation methodology enabling us to model complex systems considering all the influencing factors, interacting to simulate changes over time (Khanzadi et al., 2012). Much of the art of SD modeling is to discover and represent the feedback process which along with stock and flow structures, time delays and nonlinearities, determine the dynamics of system. To capture the structure of the system several diagramming tools are used in SD, including causal loop (CLD) and stock-flows diagrams (SFD) (Sterman, 2000). A flowchart representing different stages of the productivity simulation developed in this study is shown in Fig. 1.
Figure 1: Flowchart of different stages of productivity simulation in MC
As illustrated in Fig. 1, the model is segregated into five steps namely, KPIs identification, qualitative model development, quantitative model development, model assembly and dynamic simulation, and sensitivity analysis. Likewise, in step one, all KPIs, which contribute to each modular phase (sub-model) and can impact productivity, are identified. Then in step two, qualitative models of each sub-model is constructed using cause and effect feedback loops. In step three, the interrelationships that existed between various KPIs are defined by mathematical equations and the quantitative sub-models are built. Dynamic simulation of productivity is performed, in step four, by assembling developed quantitative sub-models and productivity is then determined by investigating various scenarios. In the final step, sensitivity analysis is conducted to assess the impact of various KPIs on productivity, following the scenarios which produces improved productivity.
4.3 Identification of Performance Indicators
KPIs are general indicators of performance that focus on critical aspects of outputs (Collin 2002) and enable measurement of project performance throughout the construction industry (The KPI Working Group, 2000). In order to measure the effects of any given change on the construction process, one must first identify and determine the appropriate KPIs to focus on. Since the change in one performance index may affect other indices, due to their complex interrelated structures, it is indispensable to account for the interactions among KPIs (Korde et al. 2005). For this reason, practiced forecasting and prediction approaches fail to provide reliable information regarding the real impact of change in performance. However, all these researches were conducted in conventional construction while, none has been performed in MC, although particular KPIs are shared between these two methods of construction. Therefore, most commonly-used KPIs at the project level and from perspective of modular manufacturers and general contractors are identified and prepared by developing KPI-frequency matrices through available researches. The KPIs, as outcome of the matrices, are demonstrated in Tables 1, which serve as model inputs in this study.
Cost Cost Delivery efficiency Cost Quality Waiting/handling time Quality
Coordination Safety Erection cost Erection speed
4.4 Causal Relationships
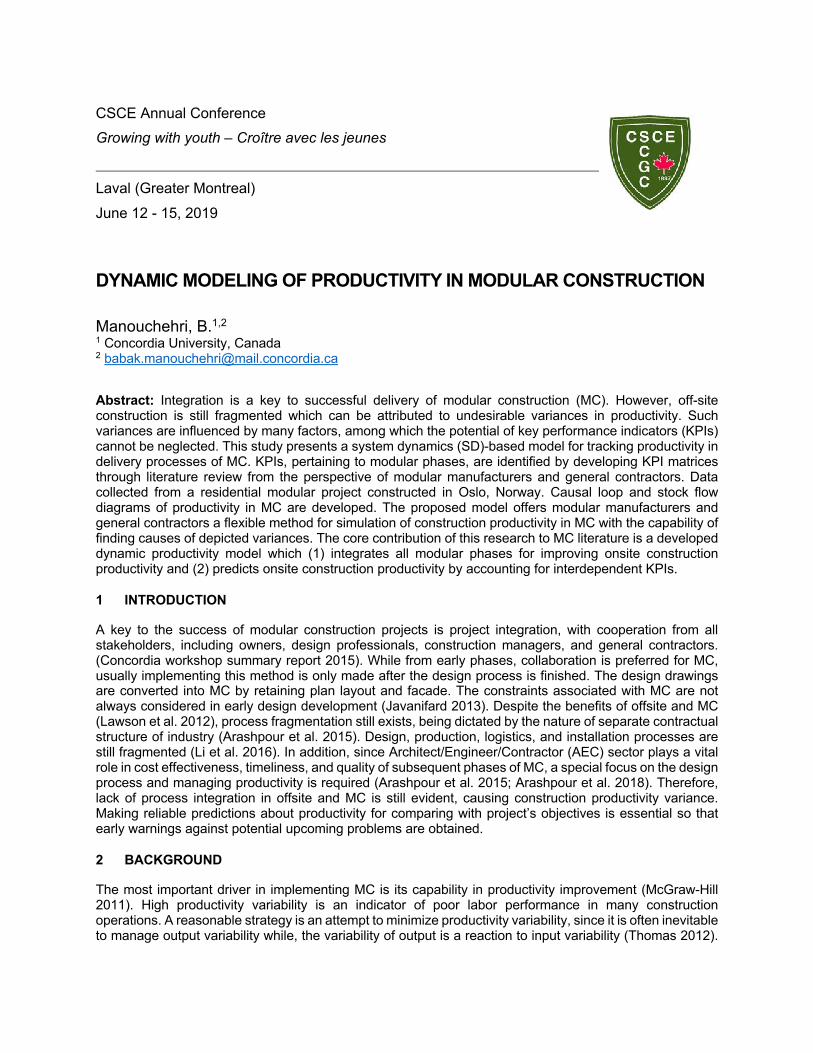
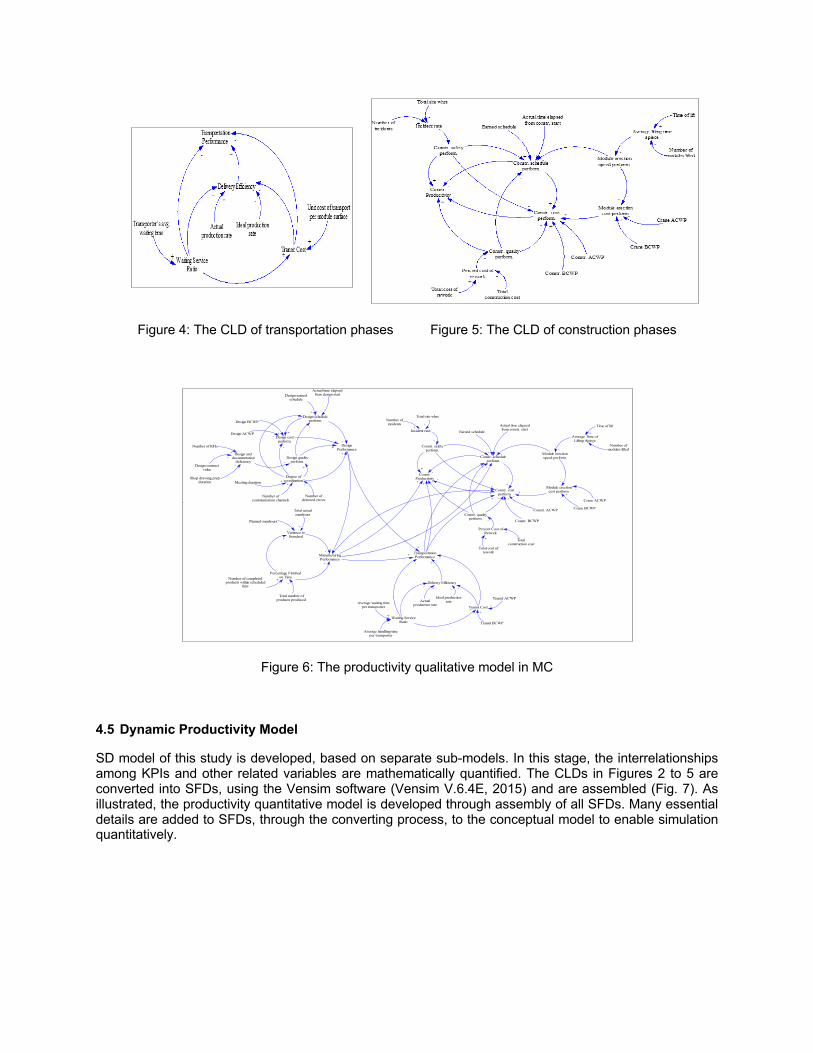
The causal loop diagram (CLD) is an important tool that aids in visualizing how the different variables in a system are interrelated and representing the feedback structure of a system (Sterman 2000). The interrelationships among KPIs and other related variables, pertaining to each modular phase, are depicted in separate CLDs (Fig. 2, 3, 4, and 5). Based on relationships shown in Table 2, all the CLDs are assembled to form the main productivity qualitative model of this study (Fig. 6).
Table 2: Relationships between phases in MC
Figure 2: The CLD of design phases Figure 3: The CLD of manufacturing phases
Impacting phase performance Impacted phase performance Polarity Source Design performance Transportation performance + O’Connor et al. 2016 Design performance Manufacturing performance + De La Torre 1994
Manufacturing performance Transportation performance + Arashpour et al. 2015 Manufacturing performance Onsite construction productivity + Arashpour et al. 2015 Transportation performance Onsite construction productivity + Javanifard et al. 2013
DesignPerformance
Design schedule
Design cost
Design quality
--+
Degree ofcoordination
+
+
-
+
-
-
`Designer/manufacturer/contractor
degree of interaction
+
Design anddocumentation
deficiency -
Earned value
Earned schedule
-
+ Variance toStandard
Percentage Finishedon Time
+
ManufacturingPerformance
-
+
Work that can becompleted within planned
schedule
+
Actual manhours spentwithin planned time
+
Total number ofmodules
-
Planned time ofcompletion
-
Figure 4: The CLD of transportation phases Figure 5: The CLD of construction phases
Figure 6: The productivity qualitative model in MC
4.5 Dynamic Productivity Model
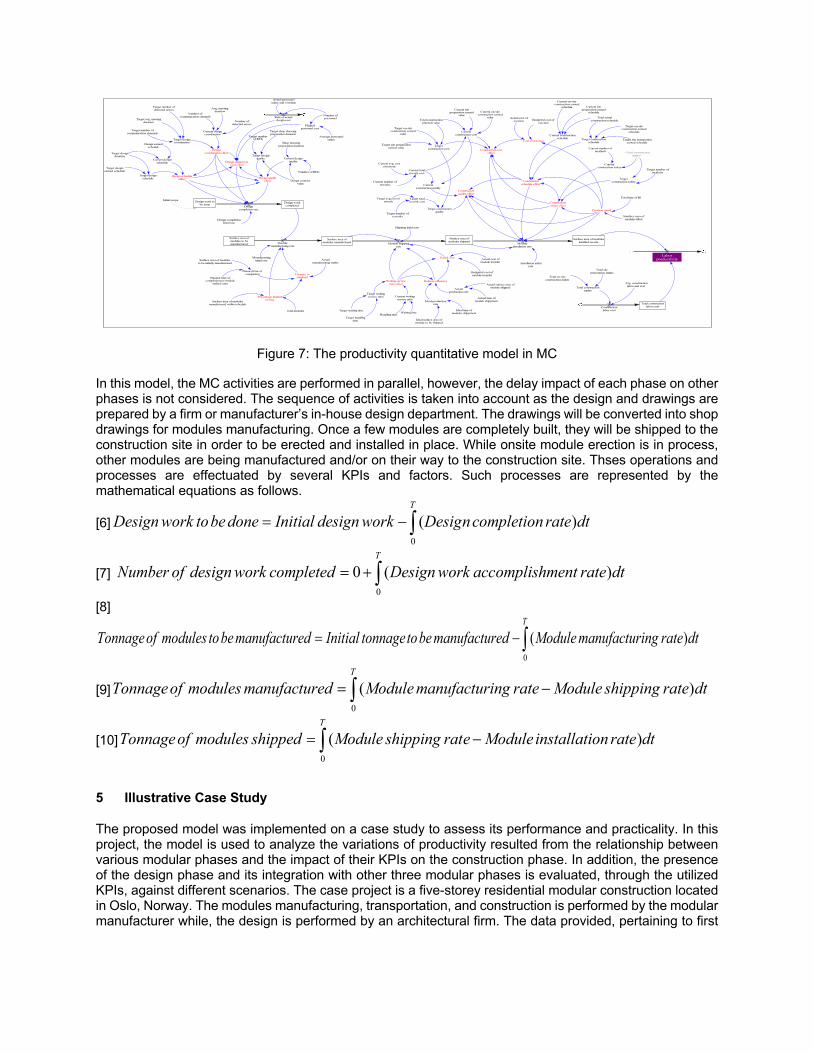
SD model of this study is developed, based on separate sub-models. In this stage, the interrelationships among KPIs and other related variables are mathematically quantified. The CLDs in Figures 2 to 5 are converted into SFDs, using the Vensim software (Vensim V.6.4E, 2015) and are assembled (Fig. 7). As illustrated, the productivity quantitative model is developed through assembly of all SFDs. Many essential details are added to SFDs, through the converting process, to the conceptual model to enable simulation quantitatively.
Delivery Efficiency
Waiting ServiceRatio
Transit Cost
Module erectionspeed perform.
Module erectioncost perform.
Constr. scheduleperform.
Constr. costperform.
Constr. qualityperform.
Constr. safetyperform.
+
-
-
+
-
+
-
TransportationPerformance-
-
Variance toStandard
Percentage Finishedon Time
+
ManufacturingPerformance
-
+ +
+
Constr.Productivity+
-
-
DesignPerformance
++
+
+
+
Number of completedproducts within scheduled
time
+
Ideal productionrate
-
Average waiting timeper transporter
Average Time ofLifting Apiece
-
Earned schedule
+
Crane ACWP
-
Transit ACWP
-
Constr. ACWP
Percent Cost ofRework
-Planned manhours
-
+
-
-
Incident rate
-
-
-
Design scheduleperform.
Design costperform.
Design qualityperform.
--
+
-
Total actualmanhours
+
Total number ofproducts produced
-
Average handling timeper transporter
- Transit BCWP
+
Actualproduction rate
+
Total cost ofrework
Totalconstruction cost
+
-
Constr. BCWP
+
Actual time elapsedfrom constr. start
-
Time of lift
Number ofmodules lifted
+
-
Crane BCWP
+
Total site whrsNumber ofincidents
+-
+
+
+
+
Degree ofcoordination
+
+
-
+
-
-
`
Meeting duration
Number ofcommunication channels
Number ofdetected errors
++ -
Design earnedschedule
Actual time elapsedfrom design start
-+
Design BCWP
Design ACWP +-
Design contractvalue
Number of RFIs
Design anddocumentation
deficiency -
+-
Shop drawing prepduration
-
Figure 7: The productivity quantitative model in MC
In this model, the MC activities are performed in parallel, however, the delay impact of each phase on other phases is not considered. The sequence of activities is taken into account as the design and drawings are prepared by a firm or manufacturer’s in-house design department. The drawings will be converted into shop drawings for modules manufacturing. Once a few modules are completely built, they will be shipped to the construction site in order to be erected and installed in place. While onsite module erection is in process, other modules are being manufactured and/or on their way to the construction site. Thses operations and processes are effectuated by several KPIs and factors. Such processes are represented by the mathematical equations as follows.
[6]
[7]
[8]
[9]
[10]
5 Illustrative Case Study
The proposed model was implemented on a case study to assess its performance and practicality. In this project, the model is used to analyze the variations of productivity resulted from the relationship between various modular phases and the impact of their KPIs on the construction phase. In addition, the presence of the design phase and its integration with other three modular phases is evaluated, through the utilized KPIs, against different scenarios. The case project is a five-storey residential modular construction located in Oslo, Norway. The modules manufacturing, transportation, and construction is performed by the modular manufacturer while, the design is performed by an architectural firm. The data provided, pertaining to first
Surface area ofmodules to bemanufactured
Surface area ofmodules manufacturedModule
manufacturing rate
Surface area ofmodules shipped
Surface area of modulesinstalled on-site
Initial scope
Planned time ofcompletion
Planned time ofcompletion per module
surface area
Variance tostandard
Percentage finishedon time
Number ofcommunication channels
Number of RFIs
Design qualityeffect
Shop drawingpreparation duration
Designcoordination effect
Avg. meetingduration
Number ofdetected errors
Design earnedschedule
Design scheduleeffect
Actualproduction rate
Waiting time
Transit cost
Delivery efficiency
Ideal productionrate
Waiting serviceratio effect
Handling time
Budgeted cost ofmodule transfer
Actual cost ofmodule transfer
Total time of lift
Current number ofincidents
Current number ofreworks
Total actualconstruction schedule
Erection speed
Current on-siteconstruction earned
schedule
Constructionschedule effect
Current sitepreparation earned
schedule
Constructionsafety effect
Current totalrework cost
Current avg. costof rework
Constructionquality effect
Construction costeffect
Cost of erection
Current on-siteconstruction earned
valueTotal construction
planned value
Total on-siteconstruction mnhrs
Total sitepreparation mnhrs
Ideal time ofmodules shippment
Actual time ofmodule shippment
Budgeted cost oferection
Actual cost oferection
Current sitepreparation earned
value
Total constructionlabor cost
Avg. constructionlabor unit cost
Design contractvalue
Surface area of modulesmanufactured within schedule
Constructionlabor cost
Actualmanufacturing mnhrs
Laborproductivity
Total constructionmnhrs
<Total constructionmnhrs>
Manufacturinginitial rate
Shipping initial rate
Installation initialrate
Target designquality Current design
quality
Target numberof RFIs
Target shop drawingpreparation duration
Target designcoordination
Current designcoordination
Target number ofcommunication channels
Target avg. meetingduration
Target number ofdetected errors
Target designschedule
Current designschedule
Target designearned schedule
Target designduration
Current waitingservice ratio
Target waitingservice ratio
Target waiting time
Target handlingtime Ideal surface area of
module to be shipped
Actual surface area ofmodule shipped
Currentconstruction safety
Targetconstruction safety
Target number ofincidents
Currentconstruction quality
Target constructionqualityTarget number of
reworks
Target avg.cost ofrework
Target totalrework cost
Targetconstruction cost
Currentconstruction cost
Target on-siteconstruction earned
value
Target site preparationearned value
Current constructionschedule Target construction
schedule
Target on-siteconstruction earned
schedule
Target site preparationearned schedule
Saurface area ofmodules lifted
Module shippingrate
Moduleinstallation rate
total modules
Surface area of modulesto be initially manufactured
Design work tobe done
Design completioninitial rate
Design workcompletedDesign
completion rate
Design manpowercost effect
Rate of actualdesign cost
Number ofpersonnel
Average personnelsalary
Plannedpersonnel cost
Actual personnelsalary and overtime
0
( )T
Designwork tobedone Initial designwork Designcompletion rate dt= - ò
0
0 ( )T
Number of designwork completed Designwork accomplishment rate dt= + ò
0
( )T
Tonnageof modules tobemanufactured Initial tonnagetobemanufactured Modulemanufacturing rate dt= - ò
week of construction, include KPIs and their related variables of each modular phase; average unit cost of onsite construction labor; weight of modules; and number of modules.
6 Comparative Analysis of Model Results
Although the proposed productivity model is able to simulate productivity by incorporating KPIs, the analysis in this paper focuses primarily on the impact of integration of various modular phases, as a set of possible interventions, on the prediction of productivity.
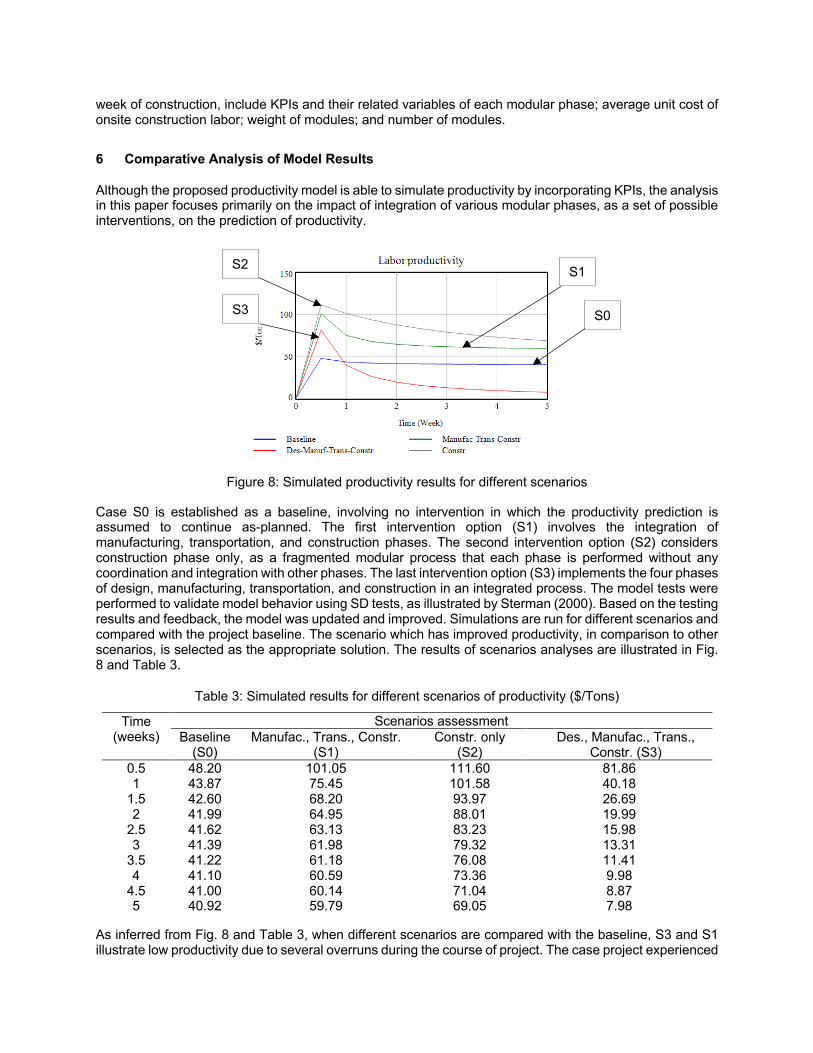
Figure 8: Simulated productivity results for different scenarios
Case S0 is established as a baseline, involving no intervention in which the productivity prediction is assumed to continue as-planned. The first intervention option (S1) involves the integration of manufacturing, transportation, and construction phases. The second intervention option (S2) considers construction phase only, as a fragmented modular process that each phase is performed without any coordination and integration with other phases. The last intervention option (S3) implements the four phases of design, manufacturing, transportation, and construction in an integrated process. The model tests were performed to validate model behavior using SD tests, as illustrated by Sterman (2000). Based on the testing results and feedback, the model was updated and improved. Simulations are run for different scenarios and compared with the project baseline. The scenario which has improved productivity, in comparison to other scenarios, is selected as the appropriate solution. The results of scenarios analyses are illustrated in Fig. 8 and Table 3.
Table 3: Simulated results for different scenarios of productivity ($/Tons)
As inferred from Fig. 8 and Table 3, when different scenarios are compared with the baseline, S3 and S1 illustrate low productivity due to several overruns during the course of project. The case project experienced
S0
S1 S2
S3
overruns in terms of onsite construction cost and schedule, although not very much. In addition, tracking and control of KPIs of the transportation phase reveals that the actual values are exceeding the planned values. However, S3 tends to improve during the first week which demonstrates the influence of integration of four modular phases. Although S1 inclines to improve, the productivity rate is lower than S3 which implies on absence of integration. On the other hand, S2 starts with low productivity for some time but, it gradually tends to increase during the project course, meaning that the project is experiencing loss of productivity at the beginning but improves as it progresses. This is also confirmed by the onsite construction KPIs tracking and control (schedule and cost indices) which show overruns. Additionally, the productivity improvement being demonstrated by S3 is partially confirmed due to a few coordination meetings being held by the design team, module manufacturer, and the construction team. Such coordination is a strong factor that interconnects different modular phases and attempts to improve productivity. Based on the case project, the investigation of various scenarios reveals that S3 has productivity improvement rate of 67% (from 81.86 $/tons to 26.69 $/tons) after nearly a week in comparison to S1 which has 32% productivity improvement (from 101.05 $/tons to 68.20 $/tons).
7 MODEL VALIDATION
7.1 Sensitivity Analysis
The sensitivity analysis is performed for scenario S3, as the paper’s objective, taking into account the KPIs metrics, as model inputs, and module manufacturing rate and productivity, as model outputs. The analysis will indicate which metrics and their related KPI, tracking and control process should be given priority. The results of the analyses for 100 runs are presented in Figs. 9 to 18.
Figure 9: Sensitivity analysis on impact of design quality
Figure 10: Sensitivity analysis on impact of design coordination
Figure 11: Sensitivity analysis on impact design schedule
Since the design phase impacts the manufacturing phase directly and other phases indirectly, the impact of design KPIs on module manufacturing rate is specified through sensitivity analysis. The results for number of communication channels, number of RFIs, design earned schedule as metrics for coordination, quality, and schedule of design phase, respectively, are shown in Figs. 9 to 11. It is illustrated that variations in the design KPIs are causing manufacturing rate variations. With the number of communication channels ranging from1 to 3, number of RFIs from 1 to 4, and design earned schedule from 30 days to 50 days, module manufacturing rate increases 5 times, decreases up to 71%, and decreases up to 95%, respectively.
Figure 12: Sensitivity analysis on impact of variance to standard (VTS)
Figure 13: Sensitivity analysis on impact of percent finish on time (PFT)
The sensitivity analysis results for manufacturing phase are illustrated in Figs. 12 and 13, as manufacturing phase directly impacts onsite construction productivity. It is demonstrated that variations in both manufacturing KPIs are approximately resulting in close productivity variation. However, with manufacturing manhours, as VTS metric, ranging from 600 hours to 1000 hours, and tonnage of modules manufactured within schedule, as PFT metric, ranging from 180 tons to 260 tons, productivity increases up to 61% and increases up to 73.5%, respectively.
Figure 14: Sensitivity analysis on impact of waiting/handling service
Figure 15: Sensitivity analysis on impact of delivery efficiency
The sensitivity analysis results for transportation phase are illustrated in Figs. 14 and 15, as this phase impacts onsite construction productivity. It is demonstrated that variations in both KPIs are approximately resulting in close productivity variation. However, with transporter waiting time at site, as waiting/handling service metric, ranging from 5 hours to 10 hours, and actual total time of module shipment, as delivery efficiency metric, ranging from 60 hours to 80 hours, productivity decreases up to 90% and decreases up to 80%, respectively. However, transit cost variations cause variations in total project cost and it is not considered in the sensitivity analysis.
Figure 16: Sensitivity analysis on impact of onsite construction
schedule
Figure 17: Sensitivity analysis on impact of onsite construction
safety
Figure 18: Sensitivity analysis on impact of onsite construction
quality
The sensitivity analysis results for onsite construction phase are illustrated in Figures 16 to 19, as this phase enormously impacts productivity. With onsite construction earned schedule, as construction schedule metric, ranging from 80 hours to 120 hours, number of incidents, as construction safety metric, ranging from 5 to 8, and average cost of rework, as construction quality metric, ranging from 2200 $/sf2 to 2800 $/sf2, productivity increases up to 46%, decreases up to 90%, and decreases up to 50%, respectively. Since construction cost and erection cost variations cause variations in total project cost and erection speed impacts construction schedule variations directly, they are not considered in the sensitivity analysis.
8 CONCLUSION
High variability is recognized as an indicator of poor labor performance in many construction operations. It is important to monitor productivity variability, not output or input variability. A reliable prediction of productivity guarantees future state of project performance whereby modular manufacturers and general contractors will be able to track and control projects and obtain early warnings against potential problems. In this research, a SD modeling approach is developed to model productivity in MC. Various scenarios representing different configurations of modular phases are assessed. A sensitivity analysis is then conducted to assess the impact of different KPIs on productivity. This led to identifying the significance and priority of each KPI in tracking and control so that higher improved productivity is achieved. Taking MC into account, the developed dynamic productivity model (1) integrates all modular phases for improving productivity and (2) predicts productivity by incorporating interdependent KPIs. The model integrates all four modular phases and presents them in one single model.
9 References
Arashpour, M., Wakefield, R., Abbasi, B., Arashpour, M., and Hosseini, R. 2018. Optimal process integration architectures in off-site construction: Theorizing the use of multi-skilled resources. Journal of Architectural Engineering and Design Management, 14(1): 46-59.
Arashpour, M.; Wakefield, R.; Blismas, N.; Maqsood, T. 2015. Autonomous Production Tracking for Augmenting Output in Off-Site Construction. Journal of Automation in Construction, 53, 13–21.
Beatham, S., Anumba, C.J., Thorpe, T. and Hedges, I. 2004. KPIs – A Critical Appraisal of Their Use in Construction. Benchmarking: An International Journal 11(1), 2004, 93- 117.
Collin, J. 2002. Measuring The Success of Building Projects – Improved Project Delivery Initiatives. Concordia workshop summary report. 2015. Challenges and Opportunities for Modular Construction in
Canada Workshop Summary Report. October 2015. De La Torre, Mayra L. 1994. A Review and Analysis of Modular Construction Practices. Lehigh University:
Lehigh Preserve: Theses and Dissertations. Paper 275. Pages 8-26. Eastman, C., Teicholz, P., Sacks, R., and Liston, K. (2008). BIM handbook: A Guide to Building Information
Modeling for Owners, Managers, Designers, Engineers and Contractors, Wiley, NJ. Hanna, A. S., Taylor, C. S., and Sullivan, K. T. 2005. Impact of Extended Overtime On Construction Labor
Productivity. Journal Construction Engineering and Management, 131(6), 734–739. Hwang, S., and Liu, L. 2010. Contemporaneous Time-Series and Forecasting Methodologies for Predicting
Short-Term Productivity. Journal Construction Engineering and Management, 1047–1055. Javanifard, N., Markert, D., Strobel, K., Yap, J., Azari, R., Dossick, C. S., El-Anwar, O., Simonen, K. 2013.
Modular Prefabricated Residential Construction: Constraints and Opportunities, PNCCRE Technical Report #TR002, Washington, WA, USA, 1-90
Khanzadi, M., Nasirzadeh, F., Alipour, M., 2012. Integrating System Dynamics and Fuzzy Logic Modeling to Determine Concession Period in BOT Projects. Journal of Automation in Construction, 22, 368–376.
Korde, T., Li, M., and Russell, A. 2005. State-of-the-art review of construction performance models and factors. Construction Research Congress, ASCE, Reston, VA, 1–14.
Lawson. R.M., Ogden. R.G., Bergin. R. 2012. Application of Modular Construction in High Rise Buildings. Journal of Architectural Engineering, 18 (2) (2012) 148–154.
Li, C.Z., Hong, J., Xue, F., Shen, G.Q., Xu, X., Mok, M.K. 2016. Schedule Risks in Prefabricated House Construction in Hong Kong: A Social Network Analysis. Journal of Cleaner Production. 134 (Part B).
McGraw-Hill. 2011. Prefabrication and Modularization; Increasing Productivity in the Construction Industry, Massachusetts, USA.
McKinsey Global Institute. 2017. Reinventing Construction: A Route to Higher Productivity. Smith, R. E. 2011. Prefab Architecture: A Guide to Modular Design and Construction, Wiley Publications. Song, L., and AbouRizk, S. M. 2008. Measuring and Modeling Labor Productivity Using Historical Data.
Journal Construction Engineering and Management, 134:10(786),786–794. Sterman, J. D. 2000. Business dynamics: Systems thinking and modeling for a complex world, Irwin
Professional, McGraw-Hill, New York. The KPI Working Group. 2000. KPI Report for The Minister for Construction. Department of the
Environment, Transport and the Regions, London, January 2000. Thomas. H. R. 2012. Benchmarking Construction Labor Productivity. Practice Periodical on Structural